John B. Cole Animal Genomics and Improvement Laboratory Agricultural Research Service, USDA Beltsville, MD 20705-2350 [email protected] 2015 Using genotypes to construct phenotypes for dairy cattle breeding programs and beyond

Using genotypes to construct phenotypes for dairy cattle breeding programs and beyond
Jul 17, 2015
Welcome message from author
This document is posted to help you gain knowledge. Please leave a comment to let me know what you think about it! Share it to your friends and learn new things together.
Transcript

John B. ColeAnimal Genomics and Improvement Laboratory
Agricultural Research Service, USDA
Beltsville, MD 20705-2350
2015
Using genotypes to construct
phenotypes for dairy cattle
breeding programs and beyond

Final OptiMIR Scientific and Expert Meeting, Namur, Belgium, April 17, 2015 (‹#›) Cole
Why do we need new phenotypes?
● Changes in production economics
● Technology enables collection of new
phenotypes
● Better understanding of biology
● Recent review by Egger-Danner et al.
(2015) in Animal

Final OptiMIR Scientific and Expert Meeting, Namur, Belgium, April 17, 2015 (‹#›) Cole
Source: Miglior et al. (2012)
Selection indices now include many traits
0% 10% 20% 30% 40% 50% 60% 70% 80% 90% 100%
Australia - APR
Belgium (Walloon) - V€G
Canada - LPI
France - ISU
Germany - RZG
Great Britain - PLI
Ireland - EBI
Israel - PD11
Italy - PFT
Japan - NTP
Netherlands - NVI
New Zealand - BW
Nordic Countries - TMI
South Africa - BVI
Spain - ICO
Switzerland - ISEL
United States - NM$
United States - TPI
Protein (kg)
Fat (kg)
Milk (kg)
Type
Longevity
Udder Health
Fertility
Others

Final OptiMIR Scientific and Expert Meeting, Namur, Belgium, April 17, 2015 (‹#›) Cole
New phenotypes should add information
low high
Genetic correlation with
existing traits
low
hig
h
Phenoty
pic
corr
ela
tion
with e
xis
ting t
raits
Novel phenotypes
include some
new information
Novel phenotypes
include much
new information
Novel phenotypes
contain some
new information
Novel phenotypes
contain little
new information

Final OptiMIR Scientific and Expert Meeting, Namur, Belgium, April 17, 2015 (‹#›) Cole
Cost of measurement vs. value to farmers
low high
Cost of measurement
low
hig
h
Valu
e o
f phenoty
pe (milk yield)
(greenhouse gas
emissions)
(feed intake)
(conformation)

Final OptiMIR Scientific and Expert Meeting, Namur, Belgium, April 17, 2015 (‹#›) Cole
Some novel phenotypes studied recently
● Claw health (Van der Linde et al., 2010)
● Dairy cattle health (Parker Gaddis et al., 2013)
● Embryonic development (Cochran et al., 2013)
● Immune response (Thompson-Crispi et al., 2013)
● Methane production (de Haas et al., 2011)
● Milk fatty acid composition (Soyeurt et al., 2011)
● Persistency of lactation (Cole et al., 2009)
● Rectal temperature (Dikmen et al., 2013)
● Residual feed intake (Connor et al., 2013)

Final OptiMIR Scientific and Expert Meeting, Namur, Belgium, April 17, 2015 (‹#›) Cole
What do US dairy farmers want?
● National workshop in Tempe, AZ in
February
● Producers, industry, academia, and
government
● Farmers want new tools
● Additional traits (novel phenotypes)
● Better management tools
● Foot health and feed efficiency were of
greatest interest

Final OptiMIR Scientific and Expert Meeting, Namur, Belgium, April 17, 2015 (‹#›) Cole
What can farmers do with novel traits?
● Put them into a selection index
● Correlated traits are helpful
● Apply selection for a long time
● There are no shortcuts
● Collect phenotypes on many daughters
● Repeated records of limited value
● Genomics can increase accuracy

Final OptiMIR Scientific and Expert Meeting, Namur, Belgium, April 17, 2015 (‹#›) Cole
Trait Bias*Reliability
(%)Reliability gain
(% points)
Milk (kg) −80.3 69.2 30.3
Fat (kg) −1.4 68.4 29.5
Protein (kg) −0.9 60.9 22.6
Fat (%) 0.0 93.7 54.8
Protein (%) 0.0 86.3 48.0
Productive life (mo) −0.7 73.7 41.6
Somatic cell score 0.0 64.9 29.3
Daughter pregnancy rate (%)
0.2 53.5 20.9
Sire calving ease 0.6 45.8 19.6
Daughter calving ease −1.8 44.2 22.4
Sire stillbirth rate 0.2 28.2 5.9
Daughter stillbirth rate 0.1 37.6 17.9
Holstein prediction accuracy
*2013 deregressed value – 2009 genomic evaluation

Final OptiMIR Scientific and Expert Meeting, Namur, Belgium, April 17, 2015 (‹#›) Cole
Constructing phenotypes from genotypes
● Prediction from correlated traits or
phenotypes from reference herds
● Haplotypes can be used when causal
variants are not known
● Causal variants can be used in place of
markers
● Specific combining abilities can combine
additive and dominance effects

Final OptiMIR Scientific and Expert Meeting, Namur, Belgium, April 17, 2015 (‹#›) Cole
Genotypes are abundant
0
100000
200000
300000
400000
500000
600000
700000
800000
Nu
mb
er
of
Gen
oty
pes
Run Date
Imputed, Young
Imputed, Old
<50k, Young, Female
<50k, Young, Male
<50k, Old, Female
<50k, Old, Male
50k, Young, Female
50k, Young, Male
50k, Old, Female
50k, Old, Male

Final OptiMIR Scientific and Expert Meeting, Namur, Belgium, April 17, 2015 (‹#›) Cole
Example: Polled cattle
● Polled cattle have improved welfare and
increased economic value
● polled haplotypes have low frequencies:
0.41% in BS, 0.93% in HO, and 2.22% in JE
● Increasing haplotype frequency by index
selection requires known status for all
animals
● Estimate gene content (GC) for all non-
genotyped animals.

Final OptiMIR Scientific and Expert Meeting, Namur, Belgium, April 17, 2015 (‹#›) Cole
Prediction of gene content
● The densefreq.f90 program (VanRaden)
was modified to use the methodology of
Gengler et al. (2007)
● Information from all genotyped relatives
used
● Gene content is real-valued and
continuous in the interval [0,2].

Final OptiMIR Scientific and Expert Meeting, Namur, Belgium, April 17, 2015 (‹#›) Cole
Addition of polled to the Net Merit index
● $11.79 (€10.85) and $10.73 (€9.87) for
costs of dehorning and polled genetics,
respectively (Widmar et al., 2013)
● Haplotype count multiplied by $22.52
(€20.72) for genotyped animals
● Gene content multiplied by $22.52
(€20.72) for non-genotyped animals
● Rank correlations with 2014 NM$
compared for bulls and cows

Final OptiMIR Scientific and Expert Meeting, Namur, Belgium, April 17, 2015 (‹#›) Cole
Validation of Jersey polled gene content
● Polled status from recessive codes and
animal names compared to GC for 1,615
non-genotyped JE with known status.
● 97% (n = 675) of pp animals correctly
assigned GC near 0
● Pp animals had GC near 0 (52%, n = 474)
and near 1 (47%; n = 433)
● All PP animals (n = 11) assigned GC of ~2.

Final OptiMIR Scientific and Expert Meeting, Namur, Belgium, April 17, 2015 (‹#›) Cole
Reasons for variation in gene content
● The expectation for GC is near 1 for
heterozygotes
● GC can be <1 if many polled ancestors
have unknown status or when pedigree is
unknown
● In those cases GC may be set to twice the
allele frequency, which is low for polled
● Some animals with -P in the name may
actually be PP, not Pp

Final OptiMIR Scientific and Expert Meeting, Namur, Belgium, April 17, 2015 (‹#›) Cole
Gene content for polled in Jerseys
MAF = 2.5%
pp Pp PP

Final OptiMIR Scientific and Expert Meeting, Namur, Belgium, April 17, 2015 (‹#›) Cole
Jersey polled merit
Group N ρ
All animals 2,471,025 0.99997
All cows 2,436,439 0.99997
All bulls 34,586 0.99990
Young bulls (G status) 380 0.99787

Final OptiMIR Scientific and Expert Meeting, Namur, Belgium, April 17, 2015 (‹#›) Cole
Validation of Holstein polled gene content
● Polled status from recessive codes and
animal names compared to GC for 1,615
non-genotyped JE with known status.
● 97% (n = 675) of pp animals correctly
assigned GC near 0
● Pp animals had GC near 0 (52%, n = 474)
and near 1 (47%; n = 433)
● All PP animals (n = 11) assigned GC of ~2.

Final OptiMIR Scientific and Expert Meeting, Namur, Belgium, April 17, 2015 (‹#›) Cole
Allele content for polled in Holsteins
MAF = 1.07%
pp Pp PP

Final OptiMIR Scientific and Expert Meeting, Namur, Belgium, April 17, 2015 (‹#›) Cole
Holstein polled merit
Group N ρ
All animals 29,010,457 0.99999
All cows 28,769,803 0.99999
All bulls 240,654 0.99994
Young bulls (G
status)
1,607 0.99966
Final OptiMIR Scientific and Expert Meeting, Namur, Belgium, April 17, 2015 (‹#›) Cole
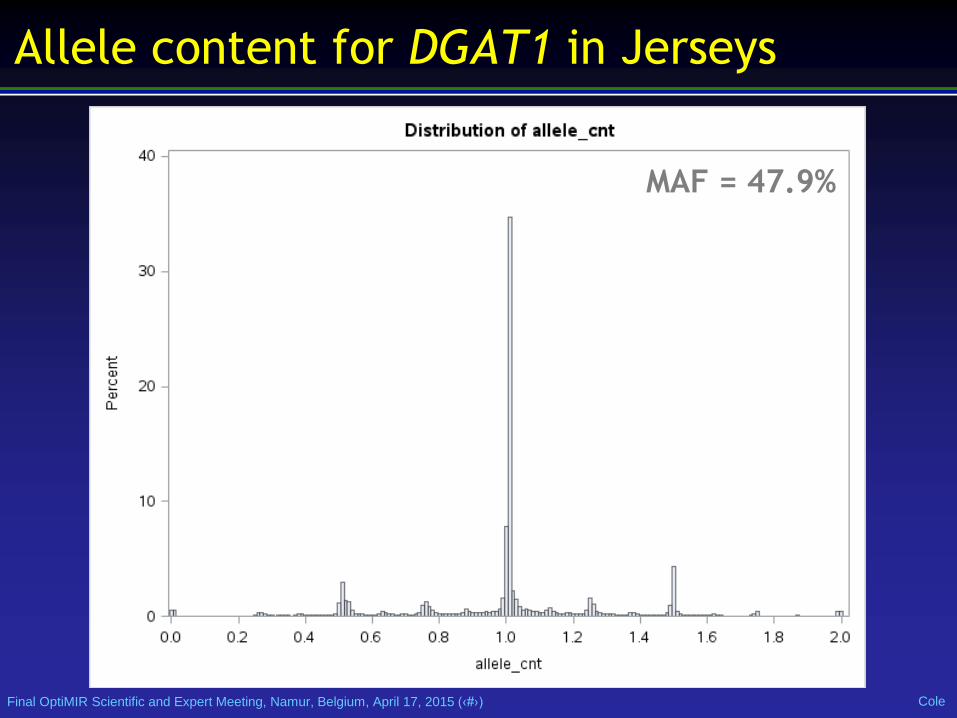
Allele content for DGAT1 in Jerseys
MAF = 47.9%

Final OptiMIR Scientific and Expert Meeting, Namur, Belgium, April 17, 2015 (‹#›) Cole
Name Chrome Location (Mbp) Carrier Freq Earliest Known Ancestor
HH1 5 62-68 4.5 Pawnee Farm Arlinda Chief
HH2 1 93-98 4.6 Willowholme Mark Anthony
HH3 8 92-97 4.7 Glendell Arlinda Chief,
Gray View Skyliner
HH4 1 1.2-1.3 0.37 Besne Buck
HH5 9 92-94 2.22 Thornlea Texal Supreme
JH1 15 11-16 23.4 Observer Chocolate Soldier
BH1 7 42-47 14.0 West Lawn Stretch Improver
BH2 19 10-12 7.78 Rancho Rustic My Design
AH1 17 65.9-66.2 26.1 Selwood Betty’s Commander
Other phenotypes may come from genotypes
For a complete list, see: http://aipl.arsusda.gov/reference/recessive_haplotypes_ARR-G3.html.

Final OptiMIR Scientific and Expert Meeting, Namur, Belgium, April 17, 2015 (‹#›) Cole
Conclusions
• New technology is enabling the collection
of novel phenotypes
• Genotypes are now routinely available for
young animals
• High-density SNP genotypes can be used to
construct phenotypes directly
Final OptiMIR Scientific and Expert Meeting, Namur, Belgium, April 17, 2015 (‹#›) Cole
Acknowledgments
• Dan Null and Paul VanRaden, AGIL
• Chuanyu Sun, Sexing Technologies
• AFRI grant 1245-31000-101-05, “Improving
Fertility of Dairy Cattle Using Translational
Genomics”

Final OptiMIR Scientific and Expert Meeting, Namur, Belgium, April 17, 2015 (‹#›) Cole
Questions?
http://gigaom.com/2012/05/31/t-mobile-pits-its-math-against-verizons-the-loser-common-sense/shutterstock_76826245/
Related Documents