Using genetic techniques to quantify reinvasion, survival and in situ breeding rates during control operations A. J. VEALE,* K.-A. EDGE, † P. MCMURTRIE, † R. M. FEWSTER, ‡ M. N. CLOUT* and D. M. GLEESON §¶ *School of Biological Sciences, Tamaki Campus, University of Auckland, Private Bag 92019, Auckland, New Zealand, †Department of Conservation Te Anau, PO Box 29, Te Anau 9640, New Zealand, ‡Department of Statistics, University of Auckland, Private Bag 92019, Auckland, New Zealand, §Institute for Applied Ecology, University of Canberra, Bruce ACT 2601, Australia, ¶Ecological Genetics Laboratory, Landcare Research, Private Bag 92170, Auckland 1142, New Zealand Abstract Determining the origin of individuals caught during a control/eradication programme enables conservation managers to assess the reinvasion rates of their target species and evaluate the level of success of their control methods. We examine how genetic tech- niques can focus management by distinguishing between hypotheses of ‘reinvasion’ and ‘survivor’, and defining kin groups for invasive stoats (Mustela erminea) on Secre- tary Island, New Zealand. 205 stoats caught on the island were genotyped at 16 micro- satellite loci, along with 40 stoats from the opposing mainland coast, and the age and sex were determined for each individual. Using these data, we compare and combine a variety of genetic techniques including genetic clustering, population assignment and kinship-based techniques to assess the origin of each stoat. The population history and individual movement could be described in fine detail, with results indicating that both in-situ survival and breeding, and reinvasion are occurring. Immigration to the island was found to be generally low, apart from in 1 year where around 8 stoats emi- grated from the mainland. This increased immigration was probably linked to a stoat population spike on the mainland in that year, caused by a masting event of southern beech forest (Nothofagus sp.) and the subsequent rodent irruption. Our study provides an example of some of the ways genetic analyses can feed directly into informing man- agement practices for invasive species. Keywords: assignment, connectivity, immigration, invasion, microsatellite, Mustela erminea Received 26 October 2012; revision received 8 July 2013; accepted 9 July 2013 Introduction Understanding the level of connectivity between patches is vital to successfully manage populations. For invasive species, the ultimate goal of management is eradication (Myers et al. 2000; Simberloff 2003), and this is now a common practice for many mammalian pest species on islands (Towns & Broome 2003; Howald et al. 2007). In order to eradicate a pest from an area, the rate of dispersal and re-establishment from other populations must either be zero or manageable to zero (Bomford & O’Brien 1995; Broome et al. 2005). If this is not possible, then management must refocus to continuous or periodic control (Cromarty et al. 2002). Unfortunately on ‘near-shore’ islands, neighbouring source populations exist, and unaided reinvasion is likely for some species; therefore, understanding the level of connectivity among populations is vital to eval- uate eradication programmes (Clout & Russell 2007; Russell et al. 2009). Equally, understanding the levels of invasion and harvesting success is important when ongoing control is necessary, as this allows managers to determine the likely ongoing residual pest densities and evaluate their control strategies. Population genetic analyses can identify population structure patterns, which may in turn elucidate the degree of population connectivity (Waples & Gaggiotti Correspondence: Andrew Veale, Fax: +6495291934; E-mail: [email protected] © 2013 John Wiley & Sons Ltd Molecular Ecology (2013) doi: 10.1111/mec.12453

Welcome message from author
This document is posted to help you gain knowledge. Please leave a comment to let me know what you think about it! Share it to your friends and learn new things together.
Transcript
Using genetic techniques to quantify reinvasion, survivaland in situ breeding rates during control operations
A. J . VEALE,* K. -A. EDGE,† P. MCMURTRIE,† R. M. FEWSTER,‡ M. N. CLOUT* and
D. M. GLEESON§¶*School of Biological Sciences, Tamaki Campus, University of Auckland, Private Bag 92019, Auckland, New Zealand, †Department
of Conservation Te Anau, PO Box 29, Te Anau 9640, New Zealand, ‡Department of Statistics, University of Auckland, Private
Bag 92019, Auckland, New Zealand, §Institute for Applied Ecology, University of Canberra, Bruce ACT 2601, Australia,
¶Ecological Genetics Laboratory, Landcare Research, Private Bag 92170, Auckland 1142, New Zealand
Abstract
Determining the origin of individuals caught during a control/eradication programme
enables conservation managers to assess the reinvasion rates of their target species and
evaluate the level of success of their control methods. We examine how genetic tech-
niques can focus management by distinguishing between hypotheses of ‘reinvasion’
and ‘survivor’, and defining kin groups for invasive stoats (Mustela erminea) on Secre-
tary Island, New Zealand. 205 stoats caught on the island were genotyped at 16 micro-
satellite loci, along with 40 stoats from the opposing mainland coast, and the age and
sex were determined for each individual. Using these data, we compare and combine a
variety of genetic techniques including genetic clustering, population assignment and
kinship-based techniques to assess the origin of each stoat. The population history
and individual movement could be described in fine detail, with results indicating that
both in-situ survival and breeding, and reinvasion are occurring. Immigration to the
island was found to be generally low, apart from in 1 year where around 8 stoats emi-
grated from the mainland. This increased immigration was probably linked to a stoat
population spike on the mainland in that year, caused by a masting event of southern
beech forest (Nothofagus sp.) and the subsequent rodent irruption. Our study provides
an example of some of the ways genetic analyses can feed directly into informing man-
agement practices for invasive species.
Keywords: assignment, connectivity, immigration, invasion, microsatellite, Mustela erminea
Received 26 October 2012; revision received 8 July 2013; accepted 9 July 2013
Introduction
Understanding the level of connectivity between
patches is vital to successfully manage populations. For
invasive species, the ultimate goal of management is
eradication (Myers et al. 2000; Simberloff 2003), and this
is now a common practice for many mammalian pest
species on islands (Towns & Broome 2003; Howald
et al. 2007). In order to eradicate a pest from an area,
the rate of dispersal and re-establishment from other
populations must either be zero or manageable to zero
(Bomford & O’Brien 1995; Broome et al. 2005). If this is
not possible, then management must refocus to
continuous or periodic control (Cromarty et al. 2002).
Unfortunately on ‘near-shore’ islands, neighbouring
source populations exist, and unaided reinvasion is
likely for some species; therefore, understanding the
level of connectivity among populations is vital to eval-
uate eradication programmes (Clout & Russell 2007;
Russell et al. 2009). Equally, understanding the levels of
invasion and harvesting success is important when
ongoing control is necessary, as this allows managers to
determine the likely ongoing residual pest densities and
evaluate their control strategies.
Population genetic analyses can identify population
structure patterns, which may in turn elucidate the
degree of population connectivity (Waples & GaggiottiCorrespondence: Andrew Veale, Fax: +6495291934;
E-mail: [email protected]
© 2013 John Wiley & Sons Ltd
Molecular Ecology (2013) doi: 10.1111/mec.12453
2006). These techniques can determine the origin of inva-
sive species populations, along with patterns of connec-
tivity within and between established populations
(Robertson & Gemmell 2004; Rollins et al. 2006; Schwartz
et al. 2007; Le Roux & Wieczorek 2009). There are three
broad categories of population genetic analyses used to
assess migration rates between patches. First, there are
indirect approaches, which use the partitioning of
genetic variation among populations to estimate migra-
tion levels (Slatkin & Barton 1989; Neigel 1997). Second,
a higher resolution set of methods are direct assignment
approaches, which select or exclude populations as pos-
sible sources for sampled individuals (Rannala & Moun-
tain 1997; Davies et al. 1999; Manel et al. 2005). For
invasive species during or after eradication attempts,
these methods have been successfully used to select
between hypotheses of ‘survival’ or ‘reinvasion’ for indi-
viduals detected post’eradication’ (e.g. Abdelkrim et al.
2005, 2007; Berry & Kirkwood 2010; Russell et al. 2010;
Veale et al. 2012a). Finally, there are kinship-based meth-
ods, which link individuals to a kin group rather than to
a population (e.g. Paetkau et al. 1995; Peery et al. 2008;
Broquet et al. 2009; Saenz-Agudelo et al. 2009; Palsbøll
et al. 2010). Kinship-based methods are well suited when
the degree of genetic divergence between populations is
low, such as for recently diverged populations, admixed
but subdivided populations, or in situations where cur-
rent or recent migration rates are high.
The stoat (Mustela erminea) is one of the principal
invasive species in New Zealand. They were introduced
to New Zealand in 1884 (Thomson 1922) to control
invasive rabbits (Oryctolagus cuniculus). Stoats subse-
quently have had well-documented catastrophic effects
on native New Zealand birds (King & Powell 2007).
They are one of the key nest predators in both alpine
grasslands and beech forests (Smith et al. 2008), and
they are a primary agent of decline for a large number
of threatened species of forest birds in New Zealand –
particularly in southern beech forest (Innes et al. 2010).
Due to the severe effects of stoat invasions – and the
associated extirpation of many endemic species on the
mainland, maintaining the stoat-free status of New Zea-
land’s offshore islands is extremely important (Parkes &
Murphy 2003; Bellingham et al. 2010). Unfortunately, of
all mammalian invasive species in New Zealand, stoats
pose one of the highest island invasion risks, having
invaded at least 90 islands (Veale et al. 2012b). Stoats
are competent swimmers (Veale 2013), and incursions
out to at least 3 km have been detected (Veale et al.
2012a). Stoats have been eradicated from numerous
islands around New Zealand, primarily through trap-
ping (Veale et al. 2012b). On these islands, trapping has
generally been maintained to prevent re-establishment,
although reincursions have occurred (King & Powell
2007). The reproductive biology of stoats makes them a
particularly insidious invasive species, in that all female
stoats become impregnated in spring (September –
October in New Zealand) including all infant female
stoats before they leave the nest (King & Moody 1982b).
Delayed implantation then means that litters are not
born until the following spring. This effectively means
that all female stoats are always pregnant, and any
female stoat that arrives on an island is capable of
founding a new population.
In this study, microsatellite, sex and age data were
analysed to assess the rates of immigration to, and the
rates of survival on Secretary Island during a stoat-con-
trol/eradication operation. A pilot study of the stoat
incursion rate to 19 small islands in Fiordland predicted
that the incursion rate to Secretary Island would be
below 1 stoat per year based on the minimum swim-
ming distance (950 m) to the island (Elliott et al. 2010),
and this was felt to be a manageable reincursion rate.
Aims
This study was designed to better quantify the rates of
immigration and survival of stoats on the island during
the operation to date. The specific questions asked are:
(i) How successful has the trapping programme been at
eliminating extant individuals? (ii) How successful has
the trapping programme been at eliminating invading
individuals? (iii) What is the immigration rate to the
island? (iv) Is in situ breeding occurring on the island
and (v) What information and level of resolution can
each genetic analysis method provide for answering
these questions?
Methods
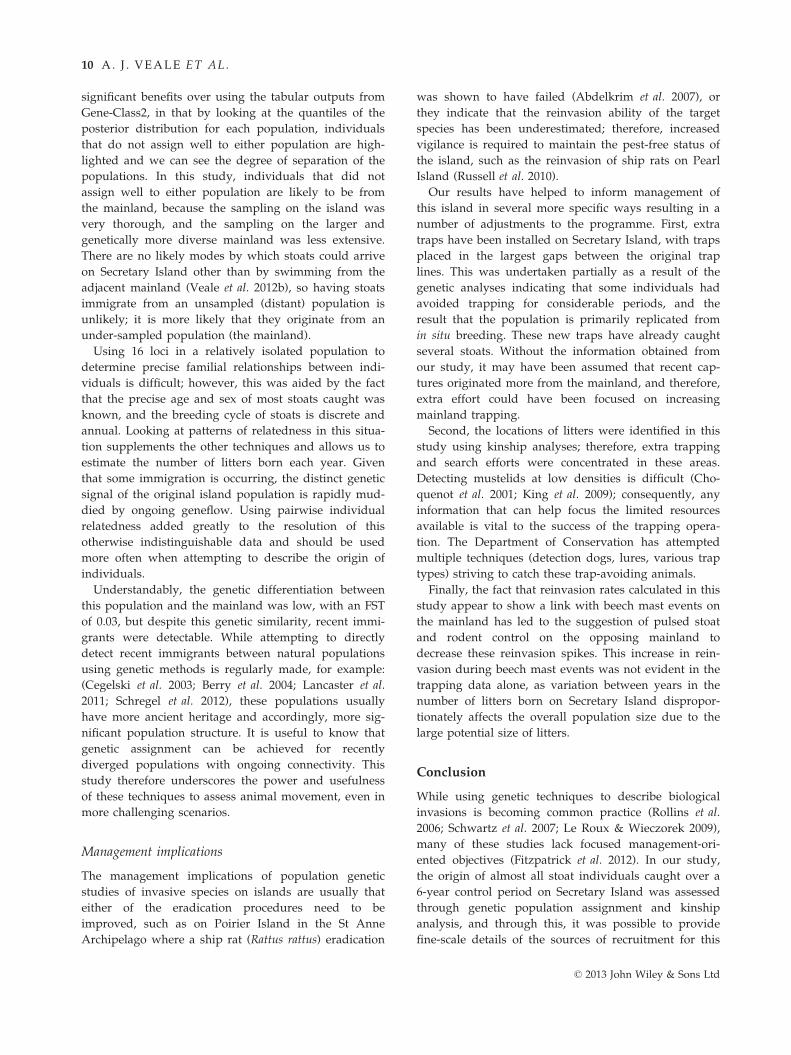
Study area
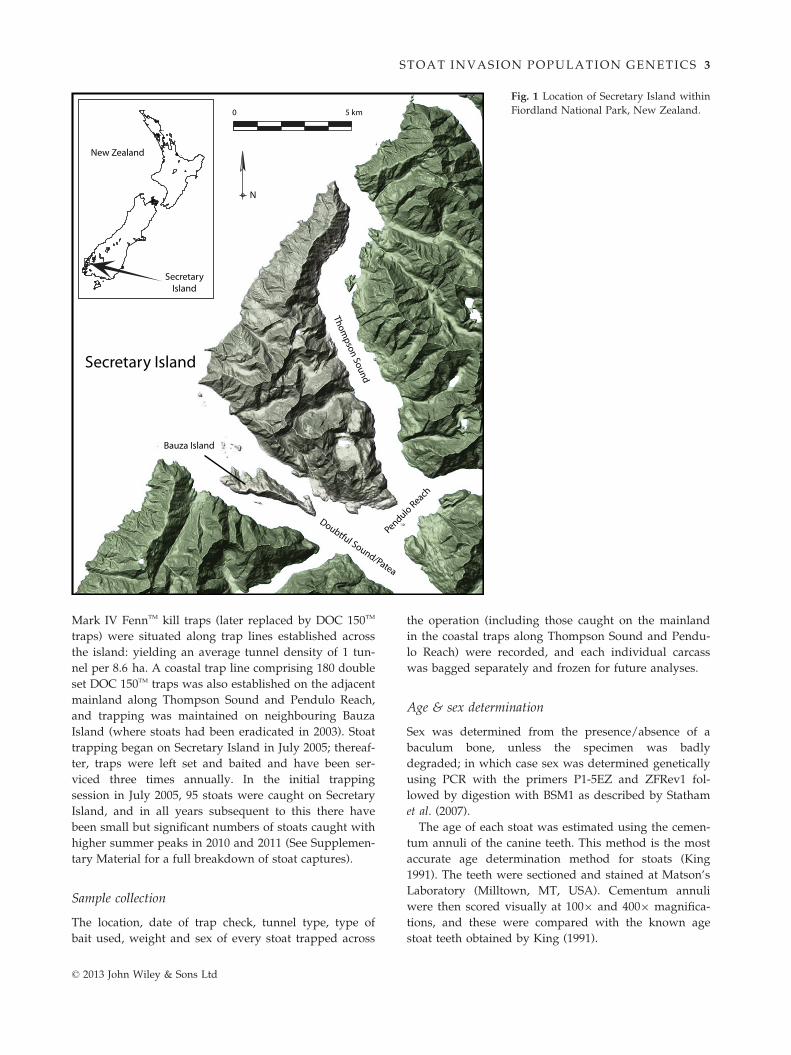
Secretary Island (8140 ha) is situated at the entrance to
Doubtful Sound in Fiordland, New Zealand (Fig. 1.). It
is the second largest island on the Fiordland coast and
is an order of magnitude larger than any other island
where stoat eradication has been attempted using a
trapping network. It is unknown when stoats first
invaded Secretary Island, but it is likely to have been
around 1900, at the time they invaded nearby Resolu-
tion Island (Hill & Hill 1987).
Control programme
Full details of the methods for the trapping programme
on Secretary Island are described in the Operational
Plan (Golding et al. 2005) and summarized by McMurt-
rie et al. (2011). In brief, 945 tunnels, each containing 2
© 2013 John Wiley & Sons Ltd
2 A. J . VEALE ET AL.
Mark IV FennTM kill traps (later replaced by DOC 150TM
traps) were situated along trap lines established across
the island: yielding an average tunnel density of 1 tun-
nel per 8.6 ha. A coastal trap line comprising 180 double
set DOC 150TM traps was also established on the adjacent
mainland along Thompson Sound and Pendulo Reach,
and trapping was maintained on neighbouring Bauza
Island (where stoats had been eradicated in 2003). Stoat
trapping began on Secretary Island in July 2005; thereaf-
ter, traps were left set and baited and have been ser-
viced three times annually. In the initial trapping
session in July 2005, 95 stoats were caught on Secretary
Island, and in all years subsequent to this there have
been small but significant numbers of stoats caught with
higher summer peaks in 2010 and 2011 (See Supplemen-
tary Material for a full breakdown of stoat captures).
Sample collection
The location, date of trap check, tunnel type, type of
bait used, weight and sex of every stoat trapped across
the operation (including those caught on the mainland
in the coastal traps along Thompson Sound and Pendu-
lo Reach) were recorded, and each individual carcass
was bagged separately and frozen for future analyses.
Age & sex determination
Sex was determined from the presence/absence of a
baculum bone, unless the specimen was badly
degraded; in which case sex was determined genetically
using PCR with the primers P1-5EZ and ZFRev1 fol-
lowed by digestion with BSM1 as described by Statham
et al. (2007).
The age of each stoat was estimated using the cemen-
tum annuli of the canine teeth. This method is the most
accurate age determination method for stoats (King
1991). The teeth were sectioned and stained at Matson’s
Laboratory (Milltown, MT, USA). Cementum annuli
were then scored visually at 1009 and 4009 magnifica-
tions, and these were compared with the known age
stoat teeth obtained by King (1991).
New Zealand
SecretaryIsland
Thompson Sound
Pendulo Reach
0 5 km
Secretary Island
Bauza Island
N
Doubtful Sound/Patea
Fig. 1 Location of Secretary Island within
Fiordland National Park, New Zealand.
© 2013 John Wiley & Sons Ltd
STOAT INVASION POPULATION GENETICS 3
DNA extraction and amplification
DNA extraction was attempted from all individual
stoats caught on Secretary Island, and from all main-
land samples that were not badly degraded. Tissue
samples were dissected in the laboratory, where around
50 mg of tissue from the tail or ear was removed. For
samples that were particularly degraded, clumps of
hair, unidentified tissue or bone were dissected. Bone
samples were digested using the protocol of Loreille
et al. (2007) before DNA extraction. Genomic DNA was
extracted using the X-tractor GeneTM CAS-1820 (Corb-
ett Robotics, Brisbane, Australia) following digest or
using standard phenol/chloroform/isoamyl alcohol
(IAE) (protocol 2 in Hoelzel & Green 1992).
Individual genetic profiling was carried out by PCR
amplification of 16 microsatellite markers as described
by Veale et al. (2012a). For degraded samples, PCR
amplification was replicated using a stepwise protocol
as recommended by Paetkau (2003). A perfect match
between two PCR amplifications was required in order
to accept a genotype in order to eliminate PCR errors
resulting in either allelic dropout or false alleles. Any
samples that differed by one locus were checked for
scoring or amplification errors at all loci (Paetkau 2003).
If these differences could not be explained by errors in
scoring/typing, samples were then subjected to a
further round of PCR and scoring (Poole et al. 2001;
Mowat & Paetkau 2002). MICROCHECKER (van Oo-
sterhout et al. 2006) was used to detect possible techni-
cal artefacts, such as null alleles, large allele dropout
and accidental scoring of stutter bands.
Analysis
For both the mainland population and the Secretary
Island population for each capture year, the allele fre-
quencies, observed and expected heterozygosities and
mean number of alleles per locus were calculated as
summaries of genetic diversity within the populations
in ARLEQUIN 3.5.1.3 (Excoffier et al. 2005). Allelic rich-
ness and private allele richness were also calculated for
each capture year using the rarefaction method imple-
mented in HP-RARE 1.0 (Kalinowski 2005). Our assign-
ment methods rely on assumptions of Hardy–Weinberg
proportions and not on linkage disequilibrium, so these
were checked in each population, using Fisher’s exact
tests. FIS, FIT and FST were estimated between all combi-
nations of Mainland and Secretary Island during each
year of the control. These calculations were made in R
(version 2.10.1), based on the methods of Weir and
Cockerham (1984).
A number of approaches were used to determine the
likely origin of each individual and estimate the
migration rates. First, Structure, version 2.3.4 (Pritchard
et al. 2000), was used to infer individual cluster assign-
ment, using the correlated allele frequencies and admix-
ture models as recommended by Falush et al. (2003).
The probability of each admixture model was tested for
clusters (K) ranging from 1 to 5. For each value of K,
models were tested using 5 independent MCMC simu-
lations each consisting of a burn-in period of 105, fol-
lowed by 106 analysis cycles. This was conducted both
with and without the use of a location prior (Secretary
Island or mainland). We assessed the most likely num-
ber of homogeneous clusters using the second-order
rate of change L” (K) or ΔK following Evanno et al.
2005; implemented in STRUCTURE HARVESTER (Earl & von
Holdt 2012). Results were then combined with the pro-
gram CLUMPP to average individual clustering outputs
between runs (Jakobsson & Rosenberg 2007) were and
visualized in DISTRUCT (Rosenberg 2004).
For genetic population assignment, we used GENE-
CLASS2 (Piry et al. 2004), implementing the Bayesian
assignment criterion of Rannala & Mountain (1997),
which was recommended as the best set of assignment
criterion by Cornuet et al. (1999). We attempted to
assign each individual to either the initial knockdown
population (2005) or to the mainland population. For
later years, we also evaluated population assignment
using the previous year’s Secretary Island captures as
one potential population and the mainland as the other.
For population assignment, individuals were high-
lighted as potential migrants that either had a higher
posterior probability of originating in the ‘mainland’
population or that had a low posterior probability
(<1%) of belonging to the ‘island’ population. We pres-
ent the assignment results graphically following the
methodology of Russell et al. (2010), using an updated
method of accommodating individuals with partially
missing data by plotting them at the same posterior
quantiles in the full-locus chart, as they would appear
at in a reduced-locus chart. For each reference popula-
tion, the charts show the 1% and 99% quantiles of the
posterior distribution of log-genotype probabilities.
These lines display the Bayesian posterior distribution
for the ‘fit’ to a population for an individual drawn
from this population, and should be regarded as a
simultaneous reflection of both the natural spread of
the population, and of our sampling uncertainty. We
refer to these plots as GeneCharts hereafter.
Relatedness was assessed using pairwise likelihood
ratios calculated in KINGROUP 2.0, a program that imple-
ments the methods developed by Queller & Goodnight
(1989) to calculate the genetic similarity between indi-
viduals (Konovalov et al. 2004). In KINGROUP, we
used the descending ratio (DR) method to partition
individuals into kin groups that had the highest overall
© 2013 John Wiley & Sons Ltd
4 A. J . VEALE ET AL.
likelihood. In addition, we attempted to identify full-
sibling and parent–offspring relationships. Given the
very large number of comparisons, only likelihood
ratios with a probability of <0.01 were accepted as sig-
nificant. These analyses were combined with the age
data to assist in determining parent–offspring relation-
ships and to ascertain whether stoats assigned as
siblings were plausibly littermates.
Using the combined age and sex data, clustering,
population assignment and kinship outputs, the mini-
mum total number of individuals alive at any given
time on the island was estimated, along with the num-
ber of litters produced on the island, and the number of
immigrants that arrived each year. For defining
migrants, results were compared between Structure,
GENECHART and KINGROUP for each individual. The GENE-
CHART was generally given precedence over Structure
due to better resolution particularly in later years.
Potential migrants highlighted by Structure or in GENE-
CHART that had kin members present on the island
either that year or the previous year were defined as
‘residents’. The total minimum population on the island
during each year was estimated by adding the total
number of stoats caught during the year, with the total
survivors that were later caught, and the total number
of females and males required for the subsequent years’
litters to be produced that also were not caught. This
was estimated by examining the relatedness estimates
derived from KINGROUP, to determine if the father and
mother of each litter had been caught. The maximum
potential capture success attained during each year was
then estimated by dividing the estimated minimum
total stoat population with the total captures each year.
Results
From a total of 247 stoats caught on Secretary Island in
the period July 2005 – December 2011, 205 (83%) stoats
were genotyped for at least 13 loci and were used in
the analysis. Of these, 187 were genotyped at all 16 loci.
From the 77 stoats caught on the mainland, 40 were
genotyped. The age of 88% (218/247) of the stoats was
successfully estimated (those that could not either had
broken or degraded tooth samples, or teeth were not
collected).
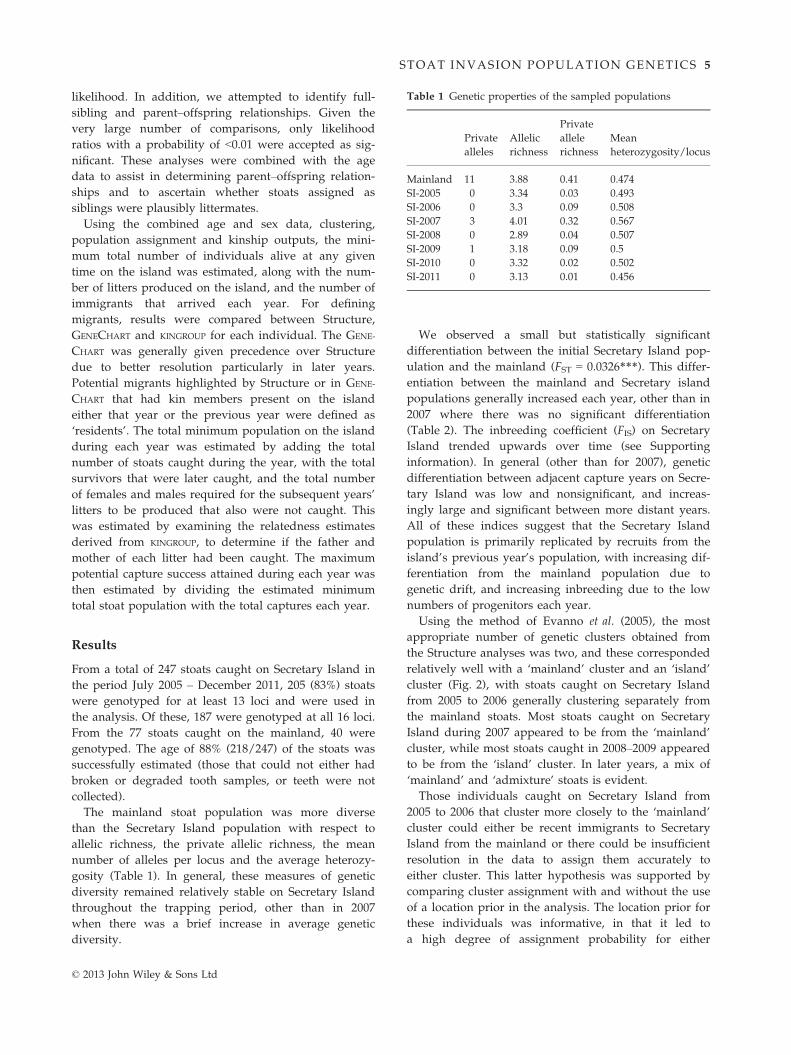
The mainland stoat population was more diverse
than the Secretary Island population with respect to
allelic richness, the private allelic richness, the mean
number of alleles per locus and the average heterozy-
gosity (Table 1). In general, these measures of genetic
diversity remained relatively stable on Secretary Island
throughout the trapping period, other than in 2007
when there was a brief increase in average genetic
diversity.
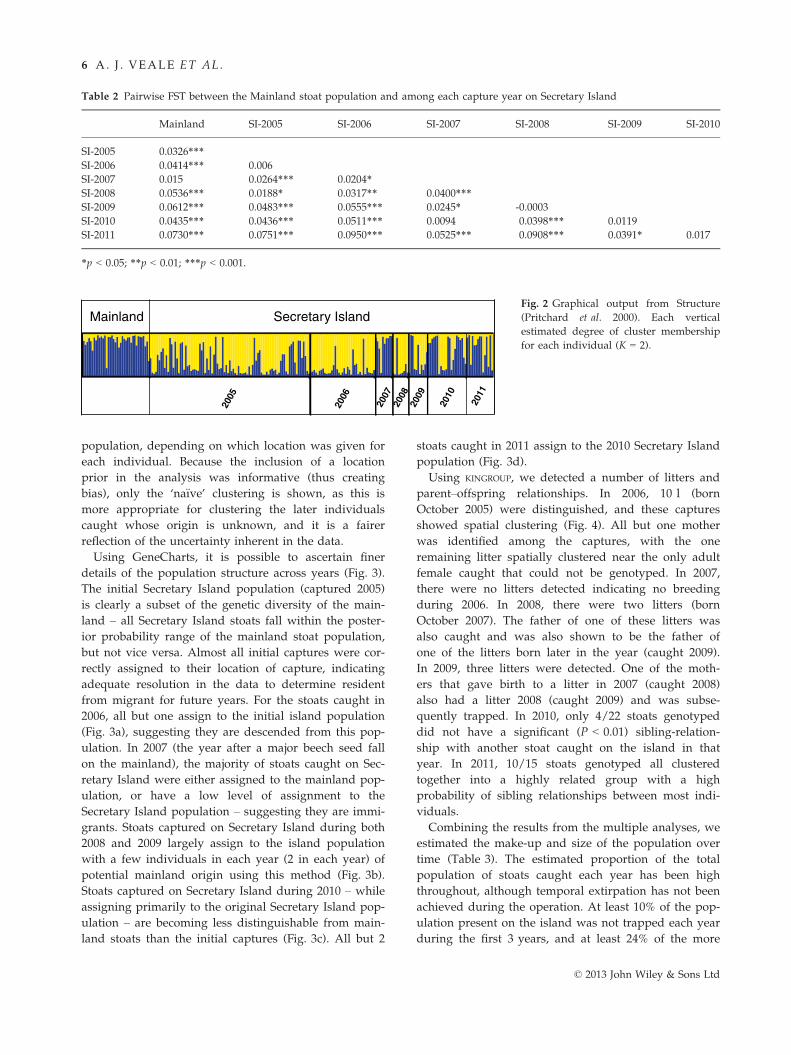
We observed a small but statistically significant
differentiation between the initial Secretary Island pop-
ulation and the mainland (FST = 0.0326***). This differ-
entiation between the mainland and Secretary island
populations generally increased each year, other than in
2007 where there was no significant differentiation
(Table 2). The inbreeding coefficient (FIS) on Secretary
Island trended upwards over time (see Supporting
information). In general (other than for 2007), genetic
differentiation between adjacent capture years on Secre-
tary Island was low and nonsignificant, and increas-
ingly large and significant between more distant years.
All of these indices suggest that the Secretary Island
population is primarily replicated by recruits from the
island’s previous year’s population, with increasing dif-
ferentiation from the mainland population due to
genetic drift, and increasing inbreeding due to the low
numbers of progenitors each year.
Using the method of Evanno et al. (2005), the most
appropriate number of genetic clusters obtained from
the Structure analyses was two, and these corresponded
relatively well with a ‘mainland’ cluster and an ‘island’
cluster (Fig. 2), with stoats caught on Secretary Island
from 2005 to 2006 generally clustering separately from
the mainland stoats. Most stoats caught on Secretary
Island during 2007 appeared to be from the ‘mainland’
cluster, while most stoats caught in 2008–2009 appeared
to be from the ‘island’ cluster. In later years, a mix of
‘mainland’ and ‘admixture’ stoats is evident.
Those individuals caught on Secretary Island from
2005 to 2006 that cluster more closely to the ‘mainland’
cluster could either be recent immigrants to Secretary
Island from the mainland or there could be insufficient
resolution in the data to assign them accurately to
either cluster. This latter hypothesis was supported by
comparing cluster assignment with and without the use
of a location prior in the analysis. The location prior for
these individuals was informative, in that it led to
a high degree of assignment probability for either
Table 1 Genetic properties of the sampled populations
Private
alleles
Allelic
richness
Private
allele
richness
Mean
heterozygosity/locus
Mainland 11 3.88 0.41 0.474
SI-2005 0 3.34 0.03 0.493
SI-2006 0 3.3 0.09 0.508
SI-2007 3 4.01 0.32 0.567
SI-2008 0 2.89 0.04 0.507
SI-2009 1 3.18 0.09 0.5
SI-2010 0 3.32 0.02 0.502
SI-2011 0 3.13 0.01 0.456
© 2013 John Wiley & Sons Ltd
STOAT INVASION POPULATION GENETICS 5
population, depending on which location was given for
each individual. Because the inclusion of a location
prior in the analysis was informative (thus creating
bias), only the ‘na€ıve’ clustering is shown, as this is
more appropriate for clustering the later individuals
caught whose origin is unknown, and it is a fairer
reflection of the uncertainty inherent in the data.
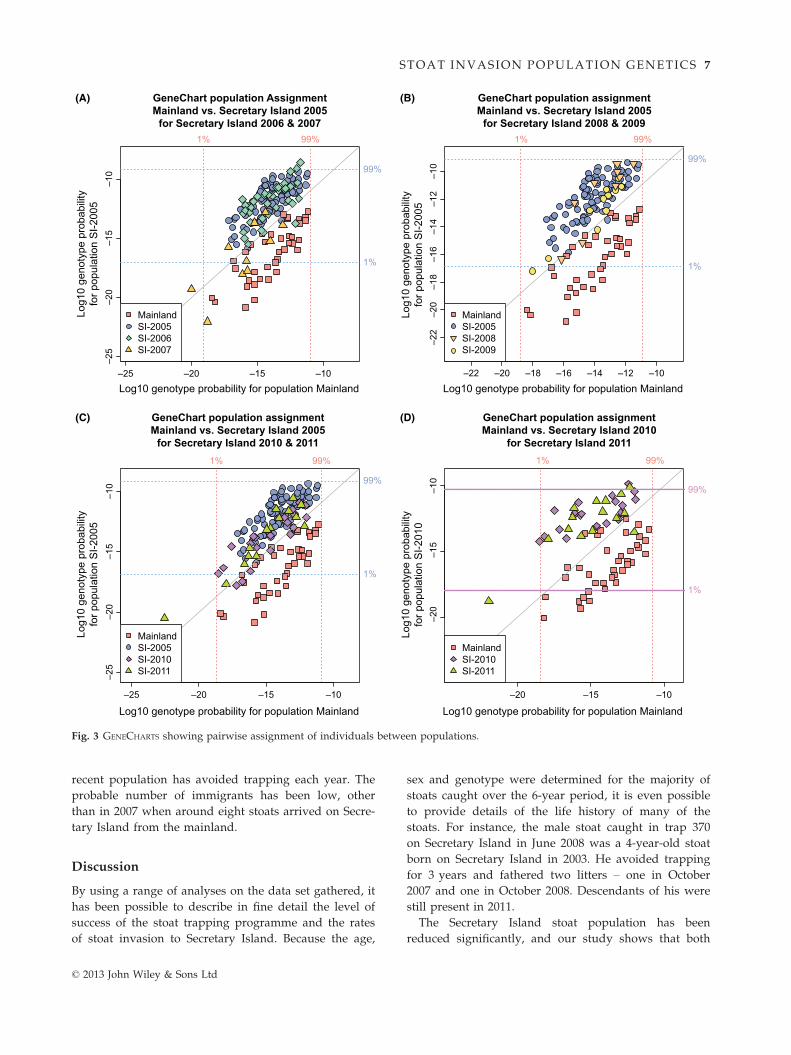
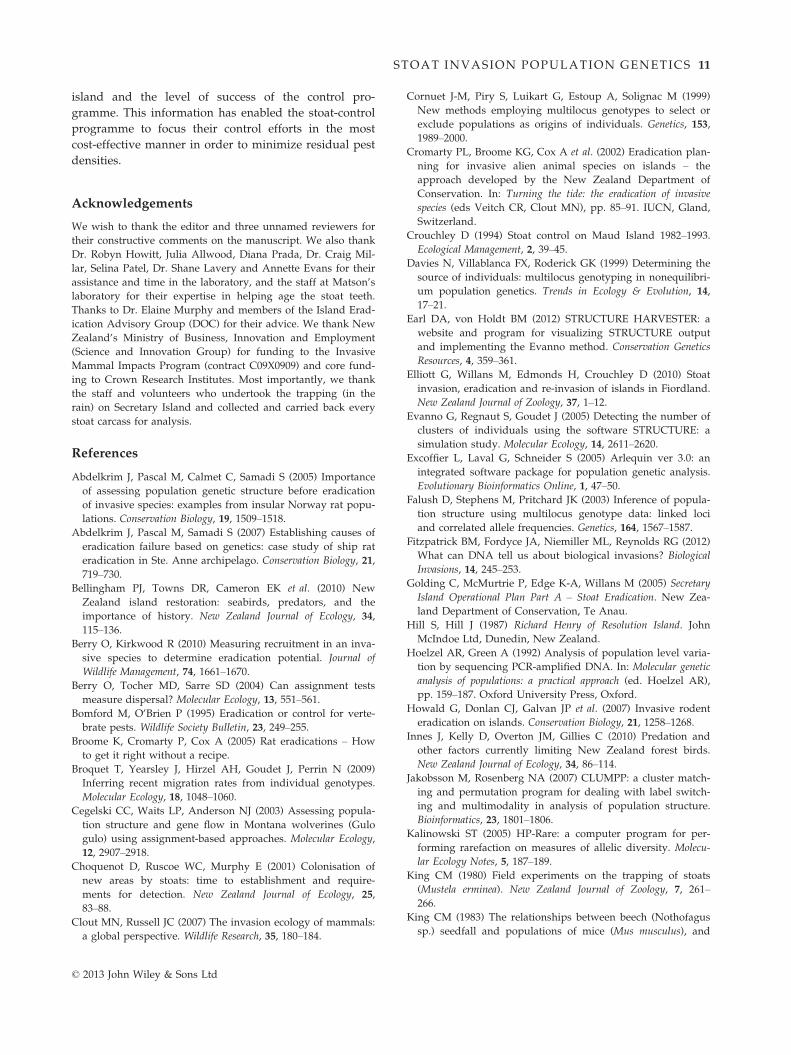
Using GeneCharts, it is possible to ascertain finer
details of the population structure across years (Fig. 3).
The initial Secretary Island population (captured 2005)
is clearly a subset of the genetic diversity of the main-
land – all Secretary Island stoats fall within the poster-
ior probability range of the mainland stoat population,
but not vice versa. Almost all initial captures were cor-
rectly assigned to their location of capture, indicating
adequate resolution in the data to determine resident
from migrant for future years. For the stoats caught in
2006, all but one assign to the initial island population
(Fig. 3a), suggesting they are descended from this pop-
ulation. In 2007 (the year after a major beech seed fall
on the mainland), the majority of stoats caught on Sec-
retary Island were either assigned to the mainland pop-
ulation, or have a low level of assignment to the
Secretary Island population – suggesting they are immi-
grants. Stoats captured on Secretary Island during both
2008 and 2009 largely assign to the island population
with a few individuals in each year (2 in each year) of
potential mainland origin using this method (Fig. 3b).
Stoats captured on Secretary Island during 2010 – while
assigning primarily to the original Secretary Island pop-
ulation – are becoming less distinguishable from main-
land stoats than the initial captures (Fig. 3c). All but 2
stoats caught in 2011 assign to the 2010 Secretary Island
population (Fig. 3d).
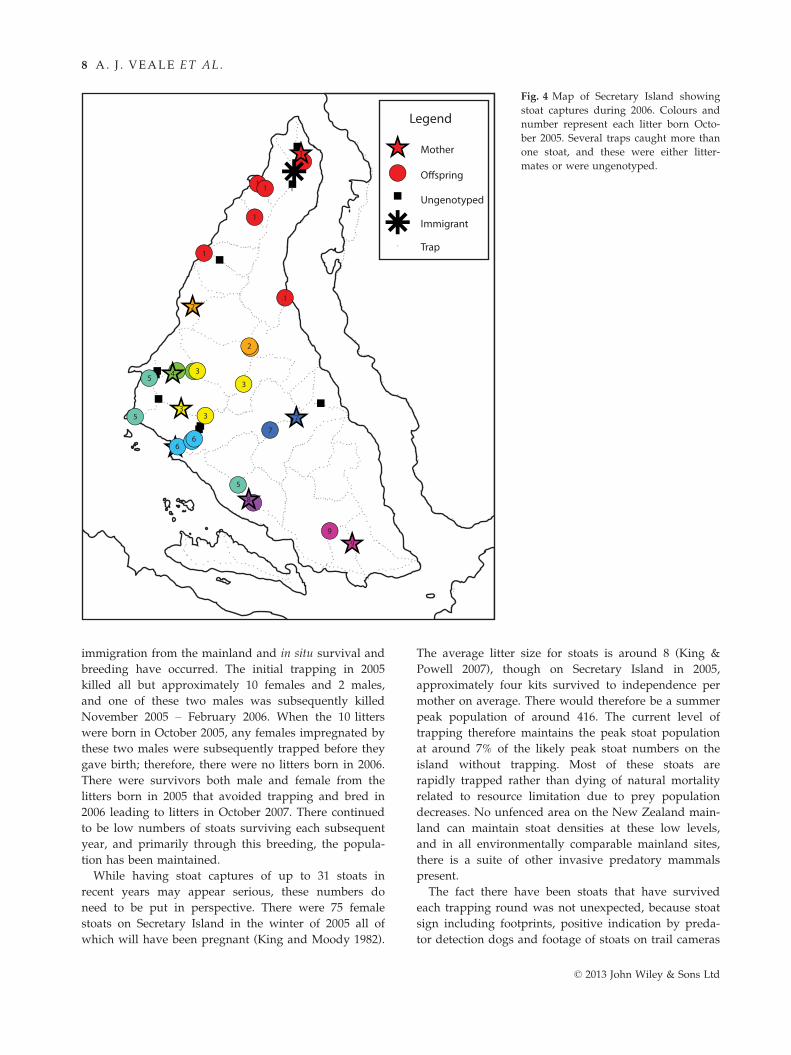
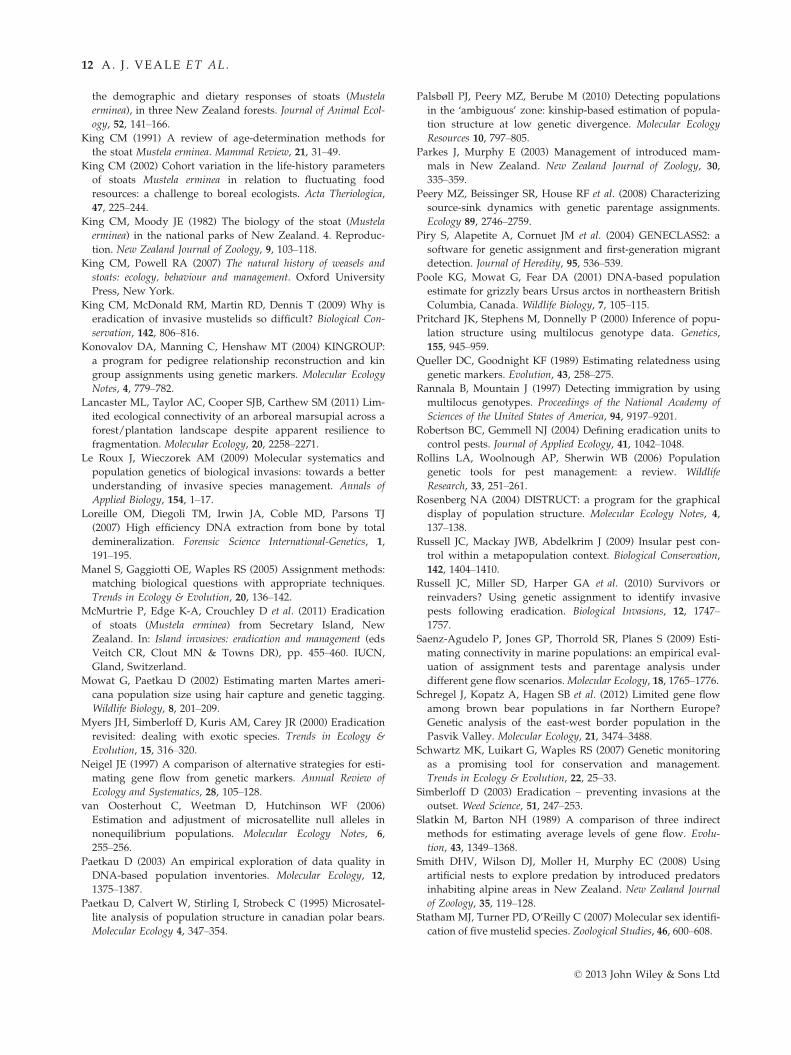
Using KINGROUP, we detected a number of litters and
parent–offspring relationships. In 2006, 10 l (born
October 2005) were distinguished, and these captures
showed spatial clustering (Fig. 4). All but one mother
was identified among the captures, with the one
remaining litter spatially clustered near the only adult
female caught that could not be genotyped. In 2007,
there were no litters detected indicating no breeding
during 2006. In 2008, there were two litters (born
October 2007). The father of one of these litters was
also caught and was also shown to be the father of
one of the litters born later in the year (caught 2009).
In 2009, three litters were detected. One of the moth-
ers that gave birth to a litter in 2007 (caught 2008)
also had a litter 2008 (caught 2009) and was subse-
quently trapped. In 2010, only 4/22 stoats genotyped
did not have a significant (P < 0.01) sibling-relation-
ship with another stoat caught on the island in that
year. In 2011, 10/15 stoats genotyped all clustered
together into a highly related group with a high
probability of sibling relationships between most indi-
viduals.
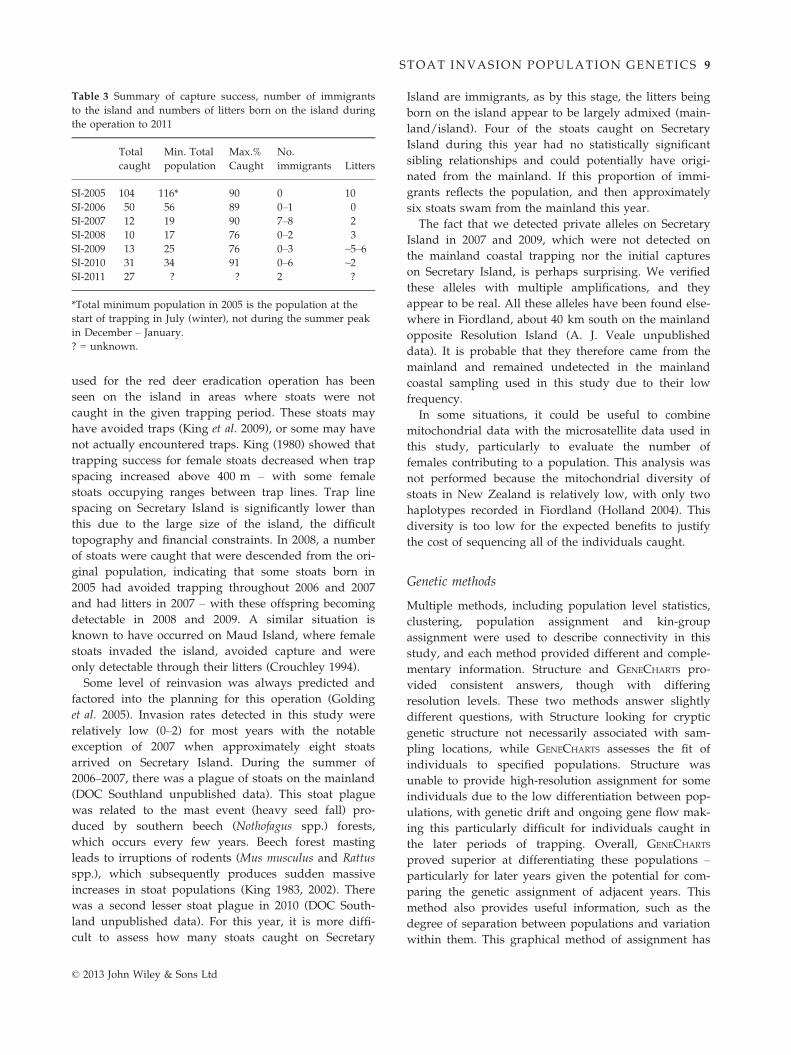
Combining the results from the multiple analyses, we
estimated the make-up and size of the population over
time (Table 3). The estimated proportion of the total
population of stoats caught each year has been high
throughout, although temporal extirpation has not been
achieved during the operation. At least 10% of the pop-
ulation present on the island was not trapped each year
during the first 3 years, and at least 24% of the more
Table 2 Pairwise FST between the Mainland stoat population and among each capture year on Secretary Island
Mainland SI-2005 SI-2006 SI-2007 SI-2008 SI-2009 SI-2010
SI-2005 0.0326***SI-2006 0.0414*** 0.006
SI-2007 0.015 0.0264*** 0.0204*SI-2008 0.0536*** 0.0188* 0.0317** 0.0400***SI-2009 0.0612*** 0.0483*** 0.0555*** 0.0245* -0.0003
SI-2010 0.0435*** 0.0436*** 0.0511*** 0.0094 0.0398*** 0.0119
SI-2011 0.0730*** 0.0751*** 0.0950*** 0.0525*** 0.0908*** 0.0391* 0.017
*p < 0.05; **p < 0.01; ***p < 0.001.
2005
2009
2010
2011
2008
2007
2006
Mainland Secretary IslandFig. 2 Graphical output from Structure
(Pritchard et al. 2000). Each vertical
estimated degree of cluster membership
for each individual (K = 2).
© 2013 John Wiley & Sons Ltd
6 A. J . VEALE ET AL.
recent population has avoided trapping each year. The
probable number of immigrants has been low, other
than in 2007 when around eight stoats arrived on Secre-
tary Island from the mainland.
Discussion
By using a range of analyses on the data set gathered, it
has been possible to describe in fine detail the level of
success of the stoat trapping programme and the rates
of stoat invasion to Secretary Island. Because the age,
sex and genotype were determined for the majority of
stoats caught over the 6-year period, it is even possible
to provide details of the life history of many of the
stoats. For instance, the male stoat caught in trap 370
on Secretary Island in June 2008 was a 4-year-old stoat
born on Secretary Island in 2003. He avoided trapping
for 3 years and fathered two litters – one in October
2007 and one in October 2008. Descendants of his were
still present in 2011.
The Secretary Island stoat population has been
reduced significantly, and our study shows that both
(A) (B)
(C) (D)
–25 –20 –15 –10
–25
–20
–15
–10
Log10 genotype probability for population Mainland
Log1
0 ge
noty
pe p
roba
bilit
yfo
r pop
ulat
ion
SI-2
005
1% 99%
1%
99%
MainlandSI-2005SI-2006SI-2007
–22 –20 –18 –16 –14 –12 –10
–22
–20
–18
–16
–14
–12
–10
Log10 genotype probability for population MainlandLo
g10
geno
type
pro
babi
lity
for p
opul
atio
n S
I-200
5
1% 99%
1%
99%
MainlandSI-2005SI-2008SI-2009
–25 –20 –15 –10
–25
–20
–15
–10
Log10 genotype probability for population Mainland
Log1
0 ge
noty
pe p
roba
bilit
yfo
r pop
ulat
ion
SI-2
005
1% 99%
1%
99%
MainlandSI-2005SI-2010SI-2011
–20 –15 –10
–20
–15
–10
Log10 genotype probability for population Mainland
Log1
0 ge
noty
pe p
roba
bilit
yfo
r pop
ulat
ion
SI-2
010
1% 99%
1%
99%
MainlandSI-2010SI-2011
GeneChart population AssignmentMainland vs. Secretary Island 2005
for Secretary Island 2006 & 2007
GeneChart population assignmentMainland vs. Secretary Island 2005
for Secretary Island 2008 & 2009
GeneChart population assignmentMainland vs. Secretary Island 2005
for Secretary Island 2010 & 2011
GeneChart population assignmentMainland vs. Secretary Island 2010
for Secretary Island 2011
Fig. 3 GENECHARTS showing pairwise assignment of individuals between populations.
© 2013 John Wiley & Sons Ltd
STOAT INVASION POPULATION GENETICS 7
immigration from the mainland and in situ survival and
breeding have occurred. The initial trapping in 2005
killed all but approximately 10 females and 2 males,
and one of these two males was subsequently killed
November 2005 – February 2006. When the 10 litters
were born in October 2005, any females impregnated by
these two males were subsequently trapped before they
gave birth; therefore, there were no litters born in 2006.
There were survivors both male and female from the
litters born in 2005 that avoided trapping and bred in
2006 leading to litters in October 2007. There continued
to be low numbers of stoats surviving each subsequent
year, and primarily through this breeding, the popula-
tion has been maintained.
While having stoat captures of up to 31 stoats in
recent years may appear serious, these numbers do
need to be put in perspective. There were 75 female
stoats on Secretary Island in the winter of 2005 all of
which will have been pregnant (King and Moody 1982).
The average litter size for stoats is around 8 (King &
Powell 2007), though on Secretary Island in 2005,
approximately four kits survived to independence per
mother on average. There would therefore be a summer
peak population of around 416. The current level of
trapping therefore maintains the peak stoat population
at around 7% of the likely peak stoat numbers on the
island without trapping. Most of these stoats are
rapidly trapped rather than dying of natural mortality
related to resource limitation due to prey population
decreases. No unfenced area on the New Zealand main-
land can maintain stoat densities at these low levels,
and in all environmentally comparable mainland sites,
there is a suite of other invasive predatory mammals
present.
The fact there have been stoats that have survived
each trapping round was not unexpected, because stoat
sign including footprints, positive indication by preda-
tor detection dogs and footage of stoats on trail cameras
1
11
1
1
1
1
1
2
2
33
3
345
5
66
5
7
7
8
9
9
Mother
Ungenotyped
Immigrant
Trap
Legend
Fig. 4 Map of Secretary Island showing
stoat captures during 2006. Colours and
number represent each litter born Octo-
ber 2005. Several traps caught more than
one stoat, and these were either litter-
mates or were ungenotyped.
© 2013 John Wiley & Sons Ltd
8 A. J . VEALE ET AL.
used for the red deer eradication operation has been
seen on the island in areas where stoats were not
caught in the given trapping period. These stoats may
have avoided traps (King et al. 2009), or some may have
not actually encountered traps. King (1980) showed that
trapping success for female stoats decreased when trap
spacing increased above 400 m – with some female
stoats occupying ranges between trap lines. Trap line
spacing on Secretary Island is significantly lower than
this due to the large size of the island, the difficult
topography and financial constraints. In 2008, a number
of stoats were caught that were descended from the ori-
ginal population, indicating that some stoats born in
2005 had avoided trapping throughout 2006 and 2007
and had litters in 2007 – with these offspring becoming
detectable in 2008 and 2009. A similar situation is
known to have occurred on Maud Island, where female
stoats invaded the island, avoided capture and were
only detectable through their litters (Crouchley 1994).
Some level of reinvasion was always predicted and
factored into the planning for this operation (Golding
et al. 2005). Invasion rates detected in this study were
relatively low (0–2) for most years with the notable
exception of 2007 when approximately eight stoats
arrived on Secretary Island. During the summer of
2006–2007, there was a plague of stoats on the mainland
(DOC Southland unpublished data). This stoat plague
was related to the mast event (heavy seed fall) pro-
duced by southern beech (Nothofagus spp.) forests,
which occurs every few years. Beech forest masting
leads to irruptions of rodents (Mus musculus and Rattus
spp.), which subsequently produces sudden massive
increases in stoat populations (King 1983, 2002). There
was a second lesser stoat plague in 2010 (DOC South-
land unpublished data). For this year, it is more diffi-
cult to assess how many stoats caught on Secretary
Island are immigrants, as by this stage, the litters being
born on the island appear to be largely admixed (main-
land/island). Four of the stoats caught on Secretary
Island during this year had no statistically significant
sibling relationships and could potentially have origi-
nated from the mainland. If this proportion of immi-
grants reflects the population, and then approximately
six stoats swam from the mainland this year.
The fact that we detected private alleles on Secretary
Island in 2007 and 2009, which were not detected on
the mainland coastal trapping nor the initial captures
on Secretary Island, is perhaps surprising. We verified
these alleles with multiple amplifications, and they
appear to be real. All these alleles have been found else-
where in Fiordland, about 40 km south on the mainland
opposite Resolution Island (A. J. Veale unpublished
data). It is probable that they therefore came from the
mainland and remained undetected in the mainland
coastal sampling used in this study due to their low
frequency.
In some situations, it could be useful to combine
mitochondrial data with the microsatellite data used in
this study, particularly to evaluate the number of
females contributing to a population. This analysis was
not performed because the mitochondrial diversity of
stoats in New Zealand is relatively low, with only two
haplotypes recorded in Fiordland (Holland 2004). This
diversity is too low for the expected benefits to justify
the cost of sequencing all of the individuals caught.
Genetic methods
Multiple methods, including population level statistics,
clustering, population assignment and kin-group
assignment were used to describe connectivity in this
study, and each method provided different and comple-
mentary information. Structure and GENECHARTS pro-
vided consistent answers, though with differing
resolution levels. These two methods answer slightly
different questions, with Structure looking for cryptic
genetic structure not necessarily associated with sam-
pling locations, while GENECHARTS assesses the fit of
individuals to specified populations. Structure was
unable to provide high-resolution assignment for some
individuals due to the low differentiation between pop-
ulations, with genetic drift and ongoing gene flow mak-
ing this particularly difficult for individuals caught in
the later periods of trapping. Overall, GENECHARTS
proved superior at differentiating these populations –
particularly for later years given the potential for com-
paring the genetic assignment of adjacent years. This
method also provides useful information, such as the
degree of separation between populations and variation
within them. This graphical method of assignment has
Table 3 Summary of capture success, number of immigrants
to the island and numbers of litters born on the island during
the operation to 2011
Total
caught
Min. Total
population
Max.%
Caught
No.
immigrants Litters
SI-2005 104 116* 90 0 10
SI-2006 50 56 89 0–1 0
SI-2007 12 19 90 7–8 2
SI-2008 10 17 76 0–2 3
SI-2009 13 25 76 0–3 ~5–6SI-2010 31 34 91 0–6 ~2SI-2011 27 ? ? 2 ?
*Total minimum population in 2005 is the population at the
start of trapping in July (winter), not during the summer peak
in December – January.
? = unknown.
© 2013 John Wiley & Sons Ltd
STOAT INVASION POPULATION GENETICS 9
significant benefits over using the tabular outputs from
Gene-Class2, in that by looking at the quantiles of the
posterior distribution for each population, individuals
that do not assign well to either population are high-
lighted and we can see the degree of separation of the
populations. In this study, individuals that did not
assign well to either population are likely to be from
the mainland, because the sampling on the island was
very thorough, and the sampling on the larger and
genetically more diverse mainland was less extensive.
There are no likely modes by which stoats could arrive
on Secretary Island other than by swimming from the
adjacent mainland (Veale et al. 2012b), so having stoats
immigrate from an unsampled (distant) population is
unlikely; it is more likely that they originate from an
under-sampled population (the mainland).
Using 16 loci in a relatively isolated population to
determine precise familial relationships between indi-
viduals is difficult; however, this was aided by the fact
that the precise age and sex of most stoats caught was
known, and the breeding cycle of stoats is discrete and
annual. Looking at patterns of relatedness in this situa-
tion supplements the other techniques and allows us to
estimate the number of litters born each year. Given
that some immigration is occurring, the distinct genetic
signal of the original island population is rapidly mud-
died by ongoing geneflow. Using pairwise individual
relatedness added greatly to the resolution of this
otherwise indistinguishable data and should be used
more often when attempting to describe the origin of
individuals.
Understandably, the genetic differentiation between
this population and the mainland was low, with an FST
of 0.03, but despite this genetic similarity, recent immi-
grants were detectable. While attempting to directly
detect recent immigrants between natural populations
using genetic methods is regularly made, for example:
(Cegelski et al. 2003; Berry et al. 2004; Lancaster et al.
2011; Schregel et al. 2012), these populations usually
have more ancient heritage and accordingly, more sig-
nificant population structure. It is useful to know that
genetic assignment can be achieved for recently
diverged populations with ongoing connectivity. This
study therefore underscores the power and usefulness
of these techniques to assess animal movement, even in
more challenging scenarios.
Management implications
The management implications of population genetic
studies of invasive species on islands are usually that
either of the eradication procedures need to be
improved, such as on Poirier Island in the St Anne
Archipelago where a ship rat (Rattus rattus) eradication
was shown to have failed (Abdelkrim et al. 2007), or
they indicate that the reinvasion ability of the target
species has been underestimated; therefore, increased
vigilance is required to maintain the pest-free status of
the island, such as the reinvasion of ship rats on Pearl
Island (Russell et al. 2010).
Our results have helped to inform management of
this island in several more specific ways resulting in a
number of adjustments to the programme. First, extra
traps have been installed on Secretary Island, with traps
placed in the largest gaps between the original trap
lines. This was undertaken partially as a result of the
genetic analyses indicating that some individuals had
avoided trapping for considerable periods, and the
result that the population is primarily replicated from
in situ breeding. These new traps have already caught
several stoats. Without the information obtained from
our study, it may have been assumed that recent cap-
tures originated more from the mainland, and therefore,
extra effort could have been focused on increasing
mainland trapping.
Second, the locations of litters were identified in this
study using kinship analyses; therefore, extra trapping
and search efforts were concentrated in these areas.
Detecting mustelids at low densities is difficult (Cho-
quenot et al. 2001; King et al. 2009); consequently, any
information that can help focus the limited resources
available is vital to the success of the trapping opera-
tion. The Department of Conservation has attempted
multiple techniques (detection dogs, lures, various trap
types) striving to catch these trap-avoiding animals.
Finally, the fact that reinvasion rates calculated in this
study appear to show a link with beech mast events on
the mainland has led to the suggestion of pulsed stoat
and rodent control on the opposing mainland to
decrease these reinvasion spikes. This increase in rein-
vasion during beech mast events was not evident in the
trapping data alone, as variation between years in the
number of litters born on Secretary Island dispropor-
tionately affects the overall population size due to the
large potential size of litters.
Conclusion
While using genetic techniques to describe biological
invasions is becoming common practice (Rollins et al.
2006; Schwartz et al. 2007; Le Roux & Wieczorek 2009),
many of these studies lack focused management-ori-
ented objectives (Fitzpatrick et al. 2012). In our study,
the origin of almost all stoat individuals caught over a
6-year control period on Secretary Island was assessed
through genetic population assignment and kinship
analysis, and through this, it was possible to provide
fine-scale details of the sources of recruitment for this
© 2013 John Wiley & Sons Ltd
10 A. J . VEALE ET AL.
island and the level of success of the control pro-
gramme. This information has enabled the stoat-control
programme to focus their control efforts in the most
cost-effective manner in order to minimize residual pest
densities.
Acknowledgements
We wish to thank the editor and three unnamed reviewers for
their constructive comments on the manuscript. We also thank
Dr. Robyn Howitt, Julia Allwood, Diana Prada, Dr. Craig Mil-
lar, Selina Patel, Dr. Shane Lavery and Annette Evans for their
assistance and time in the laboratory, and the staff at Matson’s
laboratory for their expertise in helping age the stoat teeth.
Thanks to Dr. Elaine Murphy and members of the Island Erad-
ication Advisory Group (DOC) for their advice. We thank New
Zealand’s Ministry of Business, Innovation and Employment
(Science and Innovation Group) for funding to the Invasive
Mammal Impacts Program (contract C09X0909) and core fund-
ing to Crown Research Institutes. Most importantly, we thank
the staff and volunteers who undertook the trapping (in the
rain) on Secretary Island and collected and carried back every
stoat carcass for analysis.
References
Abdelkrim J, Pascal M, Calmet C, Samadi S (2005) Importance
of assessing population genetic structure before eradication
of invasive species: examples from insular Norway rat popu-
lations. Conservation Biology, 19, 1509–1518.Abdelkrim J, Pascal M, Samadi S (2007) Establishing causes of
eradication failure based on genetics: case study of ship rat
eradication in Ste. Anne archipelago. Conservation Biology, 21,
719–730.Bellingham PJ, Towns DR, Cameron EK et al. (2010) New
Zealand island restoration: seabirds, predators, and the
importance of history. New Zealand Journal of Ecology, 34,
115–136.Berry O, Kirkwood R (2010) Measuring recruitment in an inva-
sive species to determine eradication potential. Journal of
Wildlife Management, 74, 1661–1670.
Berry O, Tocher MD, Sarre SD (2004) Can assignment tests
measure dispersal? Molecular Ecology, 13, 551–561.
Bomford M, O’Brien P (1995) Eradication or control for verte-
brate pests. Wildlife Society Bulletin, 23, 249–255.
Broome K, Cromarty P, Cox A (2005) Rat eradications – How
to get it right without a recipe.
Broquet T, Yearsley J, Hirzel AH, Goudet J, Perrin N (2009)
Inferring recent migration rates from individual genotypes.
Molecular Ecology, 18, 1048–1060.Cegelski CC, Waits LP, Anderson NJ (2003) Assessing popula-
tion structure and gene flow in Montana wolverines (Gulo
gulo) using assignment-based approaches. Molecular Ecology,
12, 2907–2918.Choquenot D, Ruscoe WC, Murphy E (2001) Colonisation of
new areas by stoats: time to establishment and require-
ments for detection. New Zealand Journal of Ecology, 25,
83–88.
Clout MN, Russell JC (2007) The invasion ecology of mammals:
a global perspective. Wildlife Research, 35, 180–184.
Cornuet J-M, Piry S, Luikart G, Estoup A, Solignac M (1999)
New methods employing multilocus genotypes to select or
exclude populations as origins of individuals. Genetics, 153,
1989–2000.Cromarty PL, Broome KG, Cox A et al. (2002) Eradication plan-
ning for invasive alien animal species on islands – the
approach developed by the New Zealand Department of
Conservation. In: Turning the tide: the eradication of invasive
species (eds Veitch CR, Clout MN), pp. 85–91. IUCN, Gland,
Switzerland.
Crouchley D (1994) Stoat control on Maud Island 1982–1993.
Ecological Management, 2, 39–45.Davies N, Villablanca FX, Roderick GK (1999) Determining the
source of individuals: multilocus genotyping in nonequilibri-
um population genetics. Trends in Ecology & Evolution, 14,
17–21.Earl DA, von Holdt BM (2012) STRUCTURE HARVESTER: a
website and program for visualizing STRUCTURE output
and implementing the Evanno method. Conservation Genetics
Resources, 4, 359–361.Elliott G, Willans M, Edmonds H, Crouchley D (2010) Stoat
invasion, eradication and re-invasion of islands in Fiordland.
New Zealand Journal of Zoology, 37, 1–12.
Evanno G, Regnaut S, Goudet J (2005) Detecting the number of
clusters of individuals using the software STRUCTURE: a
simulation study. Molecular Ecology, 14, 2611–2620.Excoffier L, Laval G, Schneider S (2005) Arlequin ver 3.0: an
integrated software package for population genetic analysis.
Evolutionary Bioinformatics Online, 1, 47–50.Falush D, Stephens M, Pritchard JK (2003) Inference of popula-
tion structure using multilocus genotype data: linked loci
and correlated allele frequencies. Genetics, 164, 1567–1587.
Fitzpatrick BM, Fordyce JA, Niemiller ML, Reynolds RG (2012)
What can DNA tell us about biological invasions? Biological
Invasions, 14, 245–253.Golding C, McMurtrie P, Edge K-A, Willans M (2005) Secretary
Island Operational Plan Part A – Stoat Eradication. New Zea-
land Department of Conservation, Te Anau.
Hill S, Hill J (1987) Richard Henry of Resolution Island. John
McIndoe Ltd, Dunedin, New Zealand.
Hoelzel AR, Green A (1992) Analysis of population level varia-
tion by sequencing PCR-amplified DNA. In: Molecular genetic
analysis of populations: a practical approach (ed. Hoelzel AR),
pp. 159–187. Oxford University Press, Oxford.
Howald G, Donlan CJ, Galvan JP et al. (2007) Invasive rodent
eradication on islands. Conservation Biology, 21, 1258–1268.
Innes J, Kelly D, Overton JM, Gillies C (2010) Predation and
other factors currently limiting New Zealand forest birds.
New Zealand Journal of Ecology, 34, 86–114.Jakobsson M, Rosenberg NA (2007) CLUMPP: a cluster match-
ing and permutation program for dealing with label switch-
ing and multimodality in analysis of population structure.
Bioinformatics, 23, 1801–1806.Kalinowski ST (2005) HP-Rare: a computer program for per-
forming rarefaction on measures of allelic diversity. Molecu-
lar Ecology Notes, 5, 187–189.
King CM (1980) Field experiments on the trapping of stoats
(Mustela erminea). New Zealand Journal of Zoology, 7, 261–
266.
King CM (1983) The relationships between beech (Nothofagus
sp.) seedfall and populations of mice (Mus musculus), and
© 2013 John Wiley & Sons Ltd
STOAT INVASION POPULATION GENETICS 11
the demographic and dietary responses of stoats (Mustela
erminea), in three New Zealand forests. Journal of Animal Ecol-
ogy, 52, 141–166.
King CM (1991) A review of age-determination methods for
the stoat Mustela erminea. Mammal Review, 21, 31–49.
King CM (2002) Cohort variation in the life-history parameters
of stoats Mustela erminea in relation to fluctuating food
resources: a challenge to boreal ecologists. Acta Theriologica,
47, 225–244.
King CM, Moody JE (1982) The biology of the stoat (Mustela
erminea) in the national parks of New Zealand. 4. Reproduc-
tion. New Zealand Journal of Zoology, 9, 103–118.King CM, Powell RA (2007) The natural history of weasels and
stoats: ecology, behaviour and management. Oxford University
Press, New York.
King CM, McDonald RM, Martin RD, Dennis T (2009) Why is
eradication of invasive mustelids so difficult? Biological Con-
servation, 142, 806–816.Konovalov DA, Manning C, Henshaw MT (2004) KINGROUP:
a program for pedigree relationship reconstruction and kin
group assignments using genetic markers. Molecular Ecology
Notes, 4, 779–782.Lancaster ML, Taylor AC, Cooper SJB, Carthew SM (2011) Lim-
ited ecological connectivity of an arboreal marsupial across a
forest/plantation landscape despite apparent resilience to
fragmentation. Molecular Ecology, 20, 2258–2271.Le Roux J, Wieczorek AM (2009) Molecular systematics and
population genetics of biological invasions: towards a better
understanding of invasive species management. Annals of
Applied Biology, 154, 1–17.
Loreille OM, Diegoli TM, Irwin JA, Coble MD, Parsons TJ
(2007) High efficiency DNA extraction from bone by total
demineralization. Forensic Science International-Genetics, 1,
191–195.
Manel S, Gaggiotti OE, Waples RS (2005) Assignment methods:
matching biological questions with appropriate techniques.
Trends in Ecology & Evolution, 20, 136–142.McMurtrie P, Edge K-A, Crouchley D et al. (2011) Eradication
of stoats (Mustela erminea) from Secretary Island, New
Zealand. In: Island invasives: eradication and management (eds
Veitch CR, Clout MN & Towns DR), pp. 455–460. IUCN,
Gland, Switzerland.
Mowat G, Paetkau D (2002) Estimating marten Martes ameri-
cana population size using hair capture and genetic tagging.
Wildlife Biology, 8, 201–209.Myers JH, Simberloff D, Kuris AM, Carey JR (2000) Eradication
revisited: dealing with exotic species. Trends in Ecology &
Evolution, 15, 316–320.
Neigel JE (1997) A comparison of alternative strategies for esti-
mating gene flow from genetic markers. Annual Review of
Ecology and Systematics, 28, 105–128.van Oosterhout C, Weetman D, Hutchinson WF (2006)
Estimation and adjustment of microsatellite null alleles in
nonequilibrium populations. Molecular Ecology Notes, 6,
255–256.Paetkau D (2003) An empirical exploration of data quality in
DNA-based population inventories. Molecular Ecology, 12,
1375–1387.
Paetkau D, Calvert W, Stirling I, Strobeck C (1995) Microsatel-
lite analysis of population structure in canadian polar bears.
Molecular Ecology 4, 347–354.
Palsbøll PJ, Peery MZ, Berube M (2010) Detecting populations
in the ‘ambiguous’ zone: kinship-based estimation of popula-
tion structure at low genetic divergence. Molecular Ecology
Resources 10, 797–805.Parkes J, Murphy E (2003) Management of introduced mam-
mals in New Zealand. New Zealand Journal of Zoology, 30,
335–359.
Peery MZ, Beissinger SR, House RF et al. (2008) Characterizing
source-sink dynamics with genetic parentage assignments.
Ecology 89, 2746–2759.Piry S, Alapetite A, Cornuet JM et al. (2004) GENECLASS2: a
software for genetic assignment and first-generation migrant
detection. Journal of Heredity, 95, 536–539.
Poole KG, Mowat G, Fear DA (2001) DNA-based population
estimate for grizzly bears Ursus arctos in northeastern British
Columbia, Canada. Wildlife Biology, 7, 105–115.Pritchard JK, Stephens M, Donnelly P (2000) Inference of popu-
lation structure using multilocus genotype data. Genetics,
155, 945–959.
Queller DC, Goodnight KF (1989) Estimating relatedness using
genetic markers. Evolution, 43, 258–275.
Rannala B, Mountain J (1997) Detecting immigration by using
multilocus genotypes. Proceedings of the National Academy of
Sciences of the United States of America, 94, 9197–9201.Robertson BC, Gemmell NJ (2004) Defining eradication units to
control pests. Journal of Applied Ecology, 41, 1042–1048.Rollins LA, Woolnough AP, Sherwin WB (2006) Population
genetic tools for pest management: a review. Wildlife
Research, 33, 251–261.Rosenberg NA (2004) DISTRUCT: a program for the graphical
display of population structure. Molecular Ecology Notes, 4,
137–138.
Russell JC, Mackay JWB, Abdelkrim J (2009) Insular pest con-
trol within a metapopulation context. Biological Conservation,
142, 1404–1410.Russell JC, Miller SD, Harper GA et al. (2010) Survivors or
reinvaders? Using genetic assignment to identify invasive
pests following eradication. Biological Invasions, 12, 1747–
1757.
Saenz-Agudelo P, Jones GP, Thorrold SR, Planes S (2009) Esti-
mating connectivity in marine populations: an empirical eval-
uation of assignment tests and parentage analysis under
different gene flow scenarios.Molecular Ecology, 18, 1765–1776.Schregel J, Kopatz A, Hagen SB et al. (2012) Limited gene flow
among brown bear populations in far Northern Europe?
Genetic analysis of the east-west border population in the
Pasvik Valley. Molecular Ecology, 21, 3474–3488.Schwartz MK, Luikart G, Waples RS (2007) Genetic monitoring
as a promising tool for conservation and management.
Trends in Ecology & Evolution, 22, 25–33.
Simberloff D (2003) Eradication – preventing invasions at the
outset. Weed Science, 51, 247–253.
Slatkin M, Barton NH (1989) A comparison of three indirect
methods for estimating average levels of gene flow. Evolu-
tion, 43, 1349–1368.Smith DHV, Wilson DJ, Moller H, Murphy EC (2008) Using
artificial nests to explore predation by introduced predators
inhabiting alpine areas in New Zealand. New Zealand Journal
of Zoology, 35, 119–128.Statham MJ, Turner PD, O’Reilly C (2007) Molecular sex identifi-
cation of five mustelid species. Zoological Studies, 46, 600–608.
© 2013 John Wiley & Sons Ltd
12 A. J . VEALE ET AL.
Thomson GM (1922) The Naturalisation of Animals and Plants in
New Zealand. Cambridge University Press, Cambridge.
Towns DR, Broome KG (2003) From small Maria to massive
Campbell: forty years of rat eradications from New Zealand
islands. New Zealand Journal of Zoology, 30, 377–398.
Veale AJ (2013) Observations of stoats (Mustela erminea) swim-
ming. New Zealand Journal of Zoology, 40, 166–169.
Veale AJ, Clout MN, Gleeson DM (2012a) Genetic population
assignment reveals a long-distance incursion to an island by a
stoat (Mustela erminea). Biological Invasions, 14, 735–742.Veale AJ, Hannaford OD, Russell JC, Clout MN (2012b) Model-
ling the distribution of stoats on New Zealand offshore
islands. New Zealand Journal of Ecology, 36, 38–47.
Waples RS, Gaggiotti O (2006) What is a population? An
empirical evaluation of some genetic methods for identifying
the number of gene pools and their degree of connectivity.
Molecular Ecology, 15, 1419–1439.
Weir BS, Cockerham CC (1984) Estimating F-statistics for the
analysis of population structure. Evolution, 38, 1358–1370.
A.J.V. Designed, performed, analysed and wrote the arti-
cle. K.A.E. Designed, performed and edited article. P.M.
Designed, performed and edited article. R.F. Analysed
and edited article. M.N.C. Designed and edited article.
D.M.G. Designed and edited article.
Data accessibility
Sample data (age, sex, location, time of capture), micro-
satellite data and GeneChart R script available from
Dryad, doi:10.5061/dryad.r634p.
Supporting information
Additional supporting information may be found in the online ver-
sion of this article.
Fig. S1 Stoat capture tally on Secretary Island from 2005 until
December 2011.
Table S1 Inbreeding Coefficient (FIS) between the Mainland
stoat population and each capture year on Secretary Island.
© 2013 John Wiley & Sons Ltd
STOAT INVASION POPULATION GENETICS 13
Related Documents