Soil Science Society of America Journal Soil Sci. Soc. Am. J. doi:10.2136/sssaj2014.04.0161 Received 21 Apr. 2014. *Corresponding author ([email protected]). © Soil Science Society of America, 5585 Guilford Rd., Madison WI 53711 USA All rights reserved. No part of this periodical may be reproduced or transmitted in any form or by any means, electronic or mechanical, including photocopying, recording, or any information storage and retrieval system, without permission in writing from the publisher. Permission for printing and for reprinting the material contained herein has been obtained by the publisher. Using Fourier-Transform Mid-Infrared Spectroscopy to Distinguish Soil Organic Matter Composition Dynamics in Aggregate Fractions of Two Agroecosystems Soil Biology & Biochemistry The relationship between soil organic C (SOC) content and its composition as impacted by management is not well understood and may influence long- term storage of SOC. To better understand the potential for SOC storage in specific aggregate pools (e.g., physically protected intra-aggregate C), a wet- sieving aggregate fractionation method was coupled with Fourier-transform mid-infrared (MidIR) spectroscopy to determine the composition of water- stable (macroaggregates, microaggregates, and silt + clay) and intra-aggregate (particulate organic matter [POM], microaggregates, and silt + clay) frac- tions under an integrated crop–livestock (ICL) system and continuous cotton (Gossypium hirsutum L.) production. These agroecosystems were located in the semiarid Texas High Plains on a clay loam soil. The ICL system included a paddock of grazed WW-B. Dahl Old World bluestem [Bothriochloa blad- hii (Retz) S.T. Blake] and a no-till crop rotation of wheat (Triticum aestivum L.)–fallow–rye (Secale cereale L.)–cotton for livestock grazing and cotton pro- duction. Distance-based redundancy analysis (dbRDA) of the MidIR spectra distinguished the intra-aggregate POM from the other fractions. The intra- aggregate POM fraction was correlated with increased pseudo-absorbance (PA) in regions associated with carboxylates, phenolic C–O, aliphatic C–H, and quartz, while macro- and microaggregates demonstrated higher PA at 1570 and 1700 to 1765cm −1 . Differences attributed to management were identifiable in intra-aggregate POM and both silt + clay fractions. Within the intra-aggregate POM, dbRDA showed that bluestem was characterized by higher PA at 2800 to 3000 and 3300 to 3450 cm −1 relative to the rest of the rotations. In the silt + clay fractions, more labile functional groups were found following rye and cotton planting. Abbreviations: CTN, continuous cotton; ICL, integrated crop–livestock; MidIR, Fourier- transform mid-infrared; SOC, soil organic carbon; PA, pseudo-absorbance; POM, particulate organic matter; RCWF, rye–cotton–wheat–fallow; WFRC, wheat–fallow–rye– cotton. T he soil organic C (SOC) pool, encompassing more C than found in the atmospheric and vegetation pools combined, is directly impacted by management practices, which influence the magnitude and rate of C stor- age (Schlesinger, 1977; Post et al., 1982; Batjes, 1996). Quantification of SOC in the whole soil is one of the most commonly measured soil properties to moni- tor the impacts of management on soil quality; however, measurable changes may take decades to reflect shiſts in management practices. To address this, pools of SOC have been identified ranging from readily decomposable compounds that are more sensitive indicators of change to more stable, recalcitrant material that persists following decomposition. To isolate these fractions, physical fractionation Lisa M. Fultz* Jennifer Moore-Kucera Dep. of Plant and Soil Science Box 42122 Texas Tech Univ. Lubbock, TX 79409-2122 Francisco Calderón USDA–ARS Central Great Plains Resources Management Research Station 40335 County Road GG Akron, CO 80720 Veronica Acosta-Martínez USDA–ARS Cropping Systems Research Lab. 3810 4th St. Lubbock, TX 79415

Welcome message from author
This document is posted to help you gain knowledge. Please leave a comment to let me know what you think about it! Share it to your friends and learn new things together.
Transcript
Soil Science Society of America Journal
Soil Sci. Soc. Am. J. doi:10.2136/sssaj2014.04.0161 Received 21 Apr. 2014. *Corresponding author ([email protected]). © Soil Science Society of America, 5585 Guilford Rd., Madison WI 53711 USA All rights reserved. No part of this periodical may be reproduced or transmitted in any form or by any means, electronic or mechanical, including photocopying, recording, or any information storage and retrieval system, without permission in writing from the publisher. Permission for printing and for reprinting the material contained herein has been obtained by the publisher.
Using Fourier-Transform Mid-Infrared Spectroscopy to Distinguish Soil Organic Matter Composition Dynamics
in Aggregate Fractions of Two Agroecosystems
Soil Biology & Biochemistry
The relationship between soil organic C (SOC) content and its composition as impacted by management is not well understood and may influence long-term storage of SOC. To better understand the potential for SOC storage in specific aggregate pools (e.g., physically protected intra-aggregate C), a wet-sieving aggregate fractionation method was coupled with Fourier-transform mid-infrared (MidIR) spectroscopy to determine the composition of water-stable (macroaggregates, microaggregates, and silt + clay) and intra-aggregate (particulate organic matter [POM], microaggregates, and silt + clay) frac-tions under an integrated crop–livestock (ICL) system and continuous cotton (Gossypium hirsutum L.) production. These agroecosystems were located in the semiarid Texas High Plains on a clay loam soil. The ICL system included a paddock of grazed WW-B. Dahl Old World bluestem [Bothriochloa blad-hii (Retz) S.T. Blake] and a no-till crop rotation of wheat (Triticum aestivum L.)–fallow–rye (Secale cereale L.)–cotton for livestock grazing and cotton pro-duction. Distance-based redundancy analysis (dbRDA) of the MidIR spectra distinguished the intra-aggregate POM from the other fractions. The intra-aggregate POM fraction was correlated with increased pseudo-absorbance (PA) in regions associated with carboxylates, phenolic C–O, aliphatic C–H, and quartz, while macro- and microaggregates demonstrated higher PA at 1570 and 1700 to 1765cm−1. Differences attributed to management were identifiable in intra-aggregate POM and both silt + clay fractions. Within the intra-aggregate POM, dbRDA showed that bluestem was characterized by higher PA at 2800 to 3000 and 3300 to 3450 cm−1 relative to the rest of the rotations. In the silt + clay fractions, more labile functional groups were found following rye and cotton planting.
Abbreviations: CTN, continuous cotton; ICL, integrated crop–livestock; MidIR, Fourier-transform mid-infrared; SOC, soil organic carbon; PA, pseudo-absorbance; POM, particulate organic matter; RCWF, rye–cotton–wheat–fallow; WFRC, wheat–fallow–rye–cotton.
The soil organic C (SOC) pool, encompassing more C than found in the atmospheric and vegetation pools combined, is directly impacted by management practices, which influence the magnitude and rate of C stor-
age (Schlesinger, 1977; Post et al., 1982; Batjes, 1996). Quantification of SOC in the whole soil is one of the most commonly measured soil properties to moni-tor the impacts of management on soil quality; however, measurable changes may take decades to reflect shifts in management practices. To address this, pools of SOC have been identified ranging from readily decomposable compounds that are more sensitive indicators of change to more stable, recalcitrant material that persists following decomposition. To isolate these fractions, physical fractionation
Lisa M. Fultz* Jennifer Moore-Kucera
Dep. of Plant and Soil Science Box 42122 Texas Tech Univ. Lubbock, TX 79409-2122
Francisco CalderónUSDA–ARS Central Great Plains Resources Management Research Station 40335 County Road GG Akron, CO 80720
Veronica Acosta-MartínezUSDA–ARS Cropping Systems Research Lab. 3810 4th St. Lubbock, TX 79415
∆ Soil Science Society of America Journal
techniques such as those described by Elliott (1986) and Six et al. (2000) disperse the soil into distinct aggregate fractions in-cluding the protected intra-aggregate pools that represent labile C (particulate organic matter [POM]) and recalcitrant C (mi-croaggregates) pools. By quantifying the C in these pools, it is possible to estimate potential C storage as impacted by manage-ment. However, a critical step in comprehending C sequestra-tion potential and the soil’s ability to protect and store SOC is understanding management practices influence on the chemical composition of SOC (Blanco-Canqui and Lal, 2004; Calderón et al., 2011a, 2011b).
The chemical composition of aggregates has been, in part, described using the aggregate hierarchical model (Oades, 1984) and the “life cycle” of a macroaggregate (Six et al., 2000). The formation of macroaggregates is aided by decreased disturbances and increased organic matter inputs from surface and subsurface vegetation. The increase in macroaggregates, comprised of a mix-ture of C components, provides an environment suitable for the formation of stable intra-aggregate microaggregates (Six et al., 2000; Denef et al., 2004). During decomposition of the more labile materials, the relatively recalcitrant C components persist as the building blocks for intra-aggregate microaggregate forma-tion. Stable conditions allow the macroaggregate shells to degrade slowly; however, under conventional tillage practices, macroag-gregates are destroyed and the intra-aggregate C is exposed and subjected to degradation, altering the overall C composition.
Diffuse reflectance Fourier-transform mid-infrared (MidIR) analysis, also known as DRIFTS or FT-IR, which covers the 400 to 4000 cm−1 range, can provide a semiquantitative overview of soil C functional groups (Haberhauer and Gerzabek, 1999; Reeves et al., 2001; McCarty et al., 2002; Calderón et al., 2013) and SOC turnover rates in environmental samples (Ellerbrock and Kaiser, 2005). When coupled with aggregate fractionation methods, MidIR analysis has been used to identify the interac-tions between SOC and the formation of soil aggregates along with the microbial community composition (Davinic et al., 2012). In turn, the ratio of absorbance of specific peaks (i.e., 1600/1060 cm−1) can be used to indicate the level of decompo-sition of the associated organic material (Prasad et al., 2000; Artz et al., 2006). Soil fractions incubated for 800 d showed that ab-sorbance at 3400, 2920 to 2860, and near 1220 cm−1 marked the presence of biologically labile bands, while absorbance at 1630 cm−1 was aligned with a resistant form of organic C (Calderón et al., 2011b). As with all methods aimed at characterizing SOC, MidIR spectroscopy has certain limitations. For example, soil is inherently complex in chemical composition and thus overlap-ping bands that represent specific functional groups can be dif-ficult to resolve (Table 1). Mineral composition strongly influ-ences the soil spectra given that most soils are dominated by min-erals (i.e., sands, silts, and clays), which can have high molar ab-sorptivity. However, spectral libraries are continually improved with the accumulation of data from a variety of environments and soil types that identify specific spectral bands or regions as-sociated with specific C functional groups (Parikh et al., 2014).
In the Texas High Plains, an integrated crop–livestock (ICL) system (perennial grass and two stages of a no-till rota-tion) increased SOC by 27% in 2007 compared with the typi-cal continuous cotton (CTN) system (Acosta-Martínez et al., 2010). After 13 yr, the ICL system increased SOC by 31%
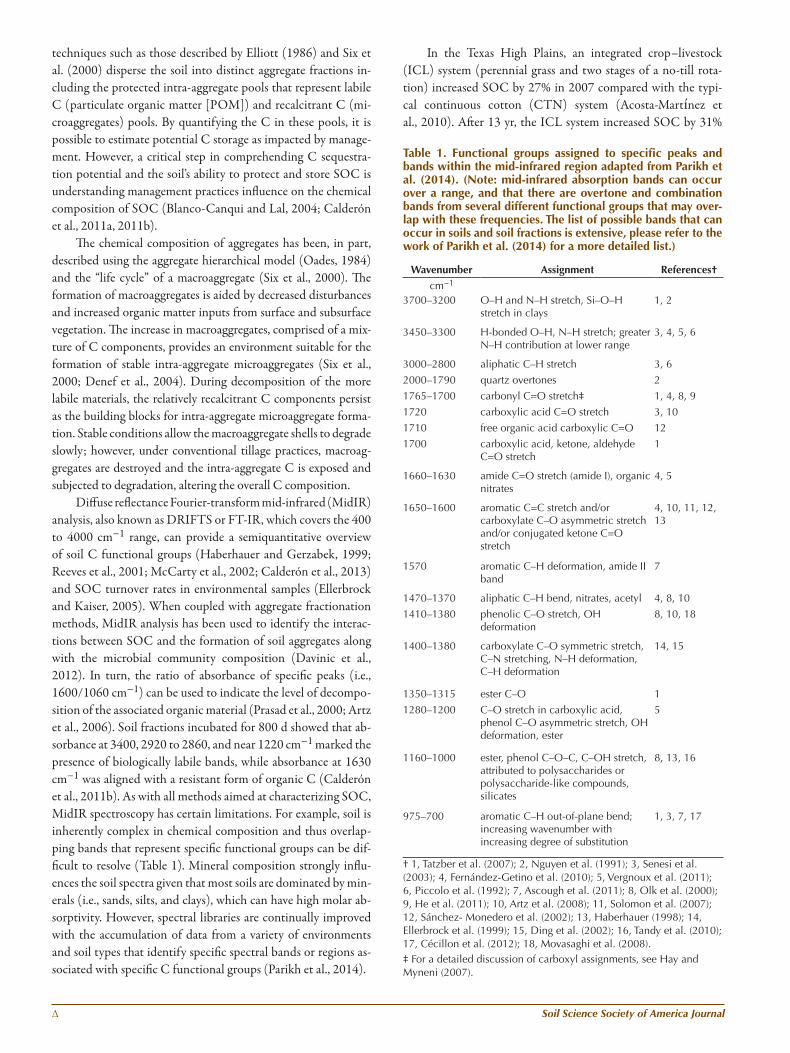
Table 1. Functional groups assigned to specific peaks and bands within the mid-infrared region adapted from Parikh et al. (2014). (Note: mid-infrared absorption bands can occur over a range, and that there are overtone and combination bands from several different functional groups that may over-lap with these frequencies. The list of possible bands that can occur in soils and soil fractions is extensive, please refer to the work of Parikh et al. (2014) for a more detailed list.)
Wavenumber Assignment References†
cm−1
3700–3200 O–H and N–H stretch, Si–O–H stretch in clays
1, 2
3450–3300 H-bonded O–H, N–H stretch; greater N–H contribution at lower range
3, 4, 5, 6
3000–2800 aliphatic C–H stretch 3, 6
2000–1790 quartz overtones 2
1765–1700 carbonyl C=O stretch‡ 1, 4, 8, 9
1720 carboxylic acid C=O stretch 3, 10
1710 free organic acid carboxylic C=O 12
1700 carboxylic acid, ketone, aldehyde C=O stretch
1
1660–1630 amide C=O stretch (amide I), organic nitrates
4, 5
1650–1600 aromatic C=C stretch and/or carboxylate C–O asymmetric stretch and/or conjugated ketone C=O stretch
4, 10, 11, 12, 13
1570 aromatic C–H deformation, amide II band
7
1470–1370 aliphatic C–H bend, nitrates, acetyl 4, 8, 10
1410–1380 phenolic C–O stretch, OH deformation
8, 10, 18
1400–1380 carboxylate C–O symmetric stretch, C–N stretching, N–H deformation, C–H deformation
14, 15
1350–1315 ester C–O 1
1280–1200 C–O stretch in carboxylic acid, phenol C–O asymmetric stretch, OH deformation, ester
5
1160–1000 ester, phenol C–O–C, C–OH stretch, attributed to polysaccharides or polysaccharide-like compounds, silicates
8, 13, 16
975–700 aromatic C–H out-of-plane bend; increasing wavenumber with increasing degree of substitution
1, 3, 7, 17
† 1, Tatzber et al. (2007); 2, Nguyen et al. (1991); 3, Senesi et al. (2003); 4, Fernández-Getino et al. (2010); 5, Vergnoux et al. (2011); 6, Piccolo et al. (1992); 7, Ascough et al. (2011); 8, Olk et al. (2000); 9, He et al. (2011); 10, Artz et al. (2008); 11, Solomon et al. (2007); 12, Sánchez- Monedero et al. (2002); 13, Haberhauer (1998); 14, Ellerbrock et al. (1999); 15, Ding et al. (2002); 16, Tandy et al. (2010); 17, Cécillon et al. (2012); 18, Movasaghi et al. (2008).‡ For a detailed discussion of carboxyl assignments, see Hay and Myneni (2007).
www.soils.org/publications/sssaj ∆
when we compared the original soil samples before the change in management to ICLs, while SOC concentration did not change during the same time period in a CTN field (Fultz et al., 2013b). A similar study comparing five additional ICL op-tions in the same region found that ICLs significantly increased SOC (up to 45%), and the change resulted in an increase in protected intra-aggregate SOC (up to 157%) relative to CTN production (Fultz et al., 2013b). For all ICLs evaluated in this region, perennial vegetation always increased aggregate stability and SOC concentration in both the intra-aggregate POM and microaggregate fractions. However, little change during 13 yr of management was observed in the isolated silt + clay and intra-aggregate silt + clay fractions, typically associated with microbial byproducts and longer SOC turnover (Sollins et al., 2006). More knowledge is required on the effects of ICLs on C budgets and the composition of SOC accumulated under their management. Therefore, the objective of this study was to examine the SOC within soil aggregates using MidIR spectroscopy to characterize organic functional groups in three water-stable and three pro-tected intra-aggregate fractions under an ICL compared with a continuous monoculture cotton system discussed by Fultz et al. (2013a). We hypothesized that aggregate fractions would have distinct MidIR spectra with specific bands or regions associated with each fraction. Additionally, we hypothesized that agroeco-systems (ICL and CTN) would result in distinct spectra as a re-sult of differing vegetation and management practices.
MATeRIALS AND MeTHODSSystems Description and Soil Sampling
Samples were collected from two long-term (>10 yr) sys-tems located six miles east of New Deal, TX, on the Texas Tech University Experimental Farm. The farm is located within the semiarid Texas High Plains region, with a mean annual precipi-tation of 470 mm and mean annual temperature of 15°C. The soil series was a Pullman clay loam (a fine, mixed, superactive, thermic Torrertic Paleustoll) with an average soil pH of 8.3 in the top 15 cm and clay and sand contents of 32 and 38%, re-spectively. Subsequent testing found no carbonates present in the identified sampling depth. The systems were established in 1997 to compare a CTN system (0.25 ha) with an ICL system (Allen et al., 2012). Both systems were deficit irrigated through subsur-face drip irrigation with 1-m spacing buried to a depth of 0.36 m and were scheduled to replace 65 and 77% of evapotranspiration in the ICL and CTN systems, respectively. Cotton was planted into chemically terminated Lockett wheat following tillage in May from 1997 to 2004, after which time wheat was discontin-ued and only cotton was grown. The ICL (the total area per rep-licate was 3.9 ha) consisted of a 2.1-ha no-till WW-B. Dahl Old World bluestem component, with the remaining area divided between two stages of a rotation (0.9 ha each) in which cotton was grown in a no-till rotation of wheat, fallow, and rye such that both stages did not have the same crop at the same time. The two stages of the rotations are referred to here as either rye–cotton–wheat–fallow (RCWF) or wheat–fallow–rye–cotton (WFRC),
with the last crop indicating the crop planted immediately before sampling. The ICL was grazed beginning in January of each year, with steers (1.7 steers ha−1) rotated through the system until July, when they were moved to a feedlot (Allen et al., 2005). Each system was replicated three times in a randomized block design. In 2008, a 2-yr period was initiated when all farming operations ceased but bluestem remained on site (Allen et al., 2012). Soil samples were collected in December 2010 (0–15 cm) using a shovel from a shallow hole by removing a uniform 5-cm-thick slice from one wall of the hole. A minimum of four samples were collected per vegetation component, gently mixed, and homog-enized to obtain a single representative sample. Soils were passed gently through an 8-mm sieve and air dried before soil aggregate fractionation and analysis.
Water-Stable Aggregate IsolationWater-stable aggregates were isolated according to the
method described by Elliott (1986). Briefly, 100 g of air-dried (<8-mm) soil was slaked by submerging subsamples into deion-ized water on a 2000-mm sieve for 5 min. Subsamples were then wet-sieved by raising and lowering the sieve 50 times during a 2-min period with an amplitude of approximately 3 cm. The wet-sieving process was repeated with 250- and 53-mm sieves us-ing the suspension that had passed through the previous sieve. The soil that remained on each sieve was transferred to an alu-minum drying dish and oven dried at 60°C. Following the final sieve (53 mm), the solution was transferred to a large drying dish to recover the silt + clay fraction. This process resulted in the isolation of four water-stable aggregate fractions: large macroag-gregates (>2000 mm), small macroaggregates (250–2000 mm), microaggregates (53–250 mm), and silt + clay (<53 mm).
Intra-aggregate IsolationA subsample of the macroaggregate fractions (combined
large and small macroaggregates) was further fractionated into three intra-aggregate fractions by shaking the soil under continu-ous water flow in a device mounted on a shaker consisting of a 250-mm sieve and 50 glass beads (4 mm in diameter) as described by Six et al. (2000). Shaking continued until all macroaggregates were dispersed. Any material remaining on the 250-mm sieve (intra-aggregate POM) was transferred to an aluminum drying dish and oven dried at 60°C. Material that had passed through the 250-mm sieve was collected on a 53-mm sieve and wet-sieved as described above to isolate stable intra-aggregate microaggre-gates and intra-aggregate silt + clay. Once dry, a subsample of each fraction was hand ground to a fine powder, transferred to a prelabeled micro-centrifuge tube, and shipped for MidIR analy-sis. Description for SOC concentration analysis were provided by Fultz et al. (2013a) and is repeated briefly here. Dry combus-tion using a LECO TruSpec CN analyzer was used to assess the total C concentration. Inorganic C (i.e., carbonates) was exam-ined via acidification of a subset of samples before analysis. No detectable inorganic C was present, and the measured total C was assumed to correspond to SOC.
∆ Soil Science Society of America Journal
Chemical Composition Using Fourier-Transform Mid-Infrared Analysis
Following drying (60°C) and grinding using a mortar and pestle, spectral analysis was completed using a Digilab FTS 7000 Fourier-transform spectrometer (Varian, Inc.) with a deuter-ated, Peltier-cooled, triglycine sulfate detector and KBr beam splitter. The spectrometer was fitted with a Pike AutoDIFF dif-fuse reflectance accessory (Pike Technologies) and KBr used as background. Data were obtained as pseudo-absorbance [log(1/reflectance)]. Data were collected at 4 cm−1 resolution, with 64 co-added scans per spectrum from 4000 to 400 cm−1 (Calderón et al., 2011a). Spectra replicates were averaged, result-ing in one value per sample.
Statistical AnalysisThe experimental design consisted of a completely random-
ized block design with three field replicates. Data were analyzed at the vegetation (CTN, bluestem, RCWF, and WFRC) level. Analysis of pseudo-absorbance (PA) spectrum data was con-ducted using the R-Project software package Version 3.0.2 (R Development Core Team, 2013). Distance (Bray) matrices were
produced using the vegan package (Oksanen et al., 2013) and used in distance-based redundancy analysis. Ordination plots were used to visualize differences between fractions and agro-ecosystems within fractions, with ellipses used to represent 95% confidence intervals around the group center. Greater distances between points represents a greater dissimilarity between those points. Analysis of variance (ANOVA) with a = 0.05 was used to determine if the spectra distinguished samples according to (i) aggregate fractions, regardless of management, or (ii) manage-ment within each fraction. When significant differences were identified, Pearson’s correlation coefficients were used to evaluate the relationships between MidIR spectra and aggregates, with a Pearson correlation value of |R| > 0.3 value used to identify sig-nificant peaks or regions. The R value was selected such that it would provide a conservative value of the relationship between the spectral analysis and the associated fraction or agroecosystem.
ReSULTS AND DISCUSSIONSoil Organic Carbon Distribution within Different Aggregate Fractions Using Fourier-Transform Mid-Infrared Spectra
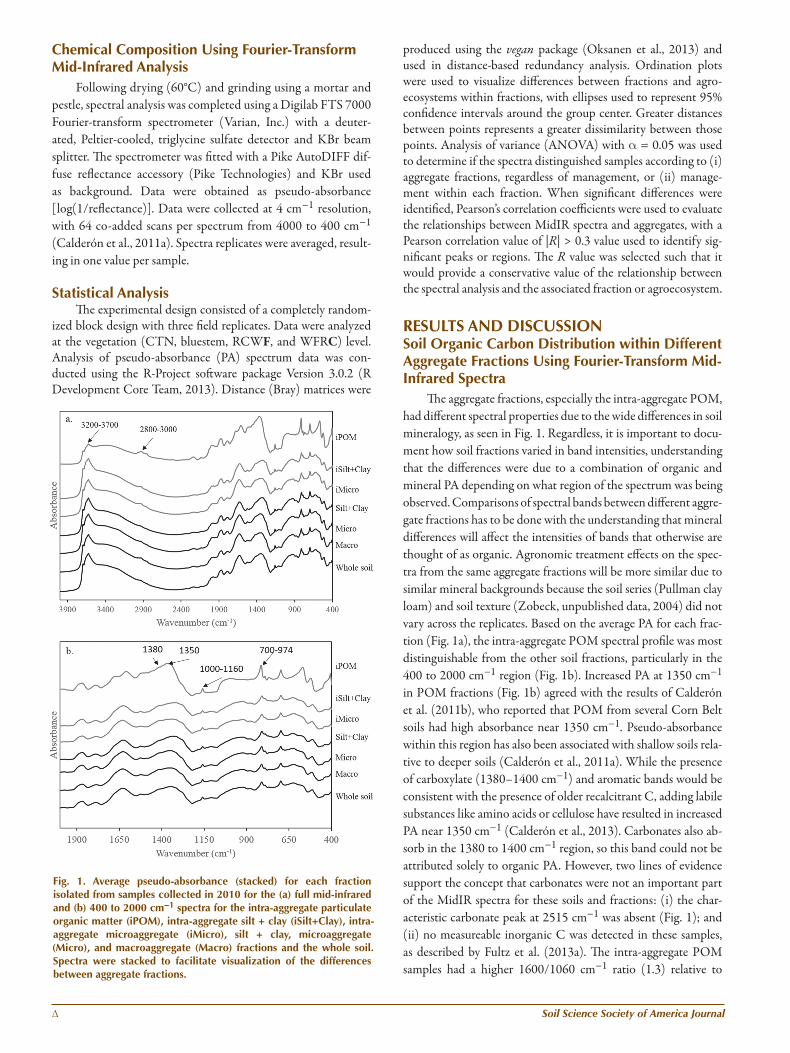
The aggregate fractions, especially the intra-aggregate POM, had different spectral properties due to the wide differences in soil mineralogy, as seen in Fig. 1. Regardless, it is important to docu-ment how soil fractions varied in band intensities, understanding that the differences were due to a combination of organic and mineral PA depending on what region of the spectrum was being observed. Comparisons of spectral bands between different aggre-gate fractions has to be done with the understanding that mineral differences will affect the intensities of bands that otherwise are thought of as organic. Agronomic treatment effects on the spec-tra from the same aggregate fractions will be more similar due to similar mineral backgrounds because the soil series (Pullman clay loam) and soil texture (Zobeck, unpublished data, 2004) did not vary across the replicates. Based on the average PA for each frac-tion (Fig. 1a), the intra-aggregate POM spectral profile was most distinguishable from the other soil fractions, particularly in the 400 to 2000 cm−1 region (Fig. 1b). Increased PA at 1350 cm−1 in POM fractions (Fig. 1b) agreed with the results of Calderón et al. (2011b), who reported that POM from several Corn Belt soils had high absorbance near 1350 cm−1. Pseudo-absorbance within this region has also been associated with shallow soils rela-tive to deeper soils (Calderón et al., 2011a). While the presence of carboxylate (1380–1400 cm−1) and aromatic bands would be consistent with the presence of older recalcitrant C, adding labile substances like amino acids or cellulose have resulted in increased PA near 1350 cm−1 (Calderón et al., 2013). Carbonates also ab-sorb in the 1380 to 1400 cm−1 region, so this band could not be attributed solely to organic PA. However, two lines of evidence support the concept that carbonates were not an important part of the MidIR spectra for these soils and fractions: (i) the char-acteristic carbonate peak at 2515 cm−1 was absent (Fig. 1); and (ii) no measureable inorganic C was detected in these samples, as described by Fultz et al. (2013a). The intra-aggregate POM samples had a higher 1600/1060 cm−1 ratio (1.3) relative to
Fig. 1. Average pseudo-absorbance (stacked) for each fraction isolated from samples collected in 2010 for the (a) full mid-infrared and (b) 400 to 2000 cm−1 spectra for the intra-aggregate particulate organic matter (iPOM), intra-aggregate silt + clay (iSilt+Clay), intra-aggregate microaggregate (iMicro), silt + clay, microaggregate (Micro), and macroaggregate (Macro) fractions and the whole soil. Spectra were stacked to facilitate visualization of the differences between aggregate fractions.
www.soils.org/publications/sssaj ∆
all other fractions (1.0) with the exception of macroaggregates (1.2), which suggests PA by carboxylate C–O asymmetric stretch and/or aromatic C=C stretch and/or conjugated ketone C=O stretch (Table 1). The higher 1600/1060 cm−1 ratio in the intra-aggregate POM fraction compared with the other size fractions conflicts with other reports of relatively labile SOM in the intra-aggregate POM fraction (Six et al., 1998; Calderón et al., 2011b). However, cotton residues are typically high in lignin content and can result in more stable C, which may be one source of material responsible for increased PA in bands typically associated with carboxylates (Zibilske and Materon, 2005). It has to be noted that PA at 1060 cm−1 is also influenced by the silicate inversion band in neat samples and is not completely explained by organic PA. Regardless, we showed that the 1600/1060 cm−1 ratio was useful to differentiate the different size fractions. The PA within the 1790 to 2000 cm−1 region (Fig. 1b) in the intra-aggregate POM corresponds to a relatively high amount of quartz within the intra-aggregate POM relative to the other fractions (Nguyen et al., 1991), consistent with the previously observed separation of the sands into POM during the sieving process (Calderón et al., 2011b). The intra-aggregate POM fraction differed from the rest of the fractions because of lower PA at 3625 cm−1 (Fig. 1a). The Pullman clay loam has montmorillonite and illite as the prin-cipal types of clay, and the spectral data showed that fractionation acted to remove clays from the intra-aggregate POM.
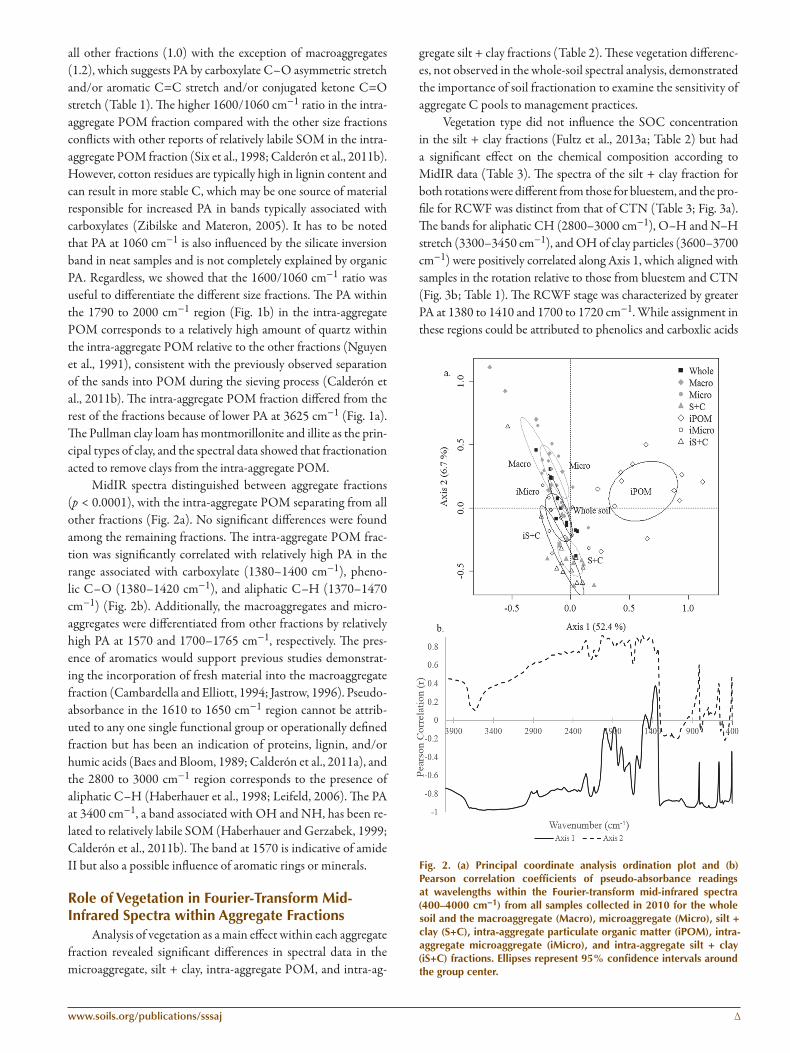
MidIR spectra distinguished between aggregate fractions (p < 0.0001), with the intra-aggregate POM separating from all other fractions (Fig. 2a). No significant differences were found among the remaining fractions. The intra-aggregate POM frac-tion was significantly correlated with relatively high PA in the range associated with carboxylate (1380–1400 cm−1), pheno-lic C–O (1380–1420 cm−1), and aliphatic C–H (1370–1470 cm−1) (Fig. 2b). Additionally, the macroaggregates and micro-aggregates were differentiated from other fractions by relatively high PA at 1570 and 1700–1765 cm−1, respectively. The pres-ence of aromatics would support previous studies demonstrat-ing the incorporation of fresh material into the macroaggregate fraction (Cambardella and Elliott, 1994; Jastrow, 1996). Pseudo-absorbance in the 1610 to 1650 cm−1 region cannot be attrib-uted to any one single functional group or operationally defined fraction but has been an indication of proteins, lignin, and/or humic acids (Baes and Bloom, 1989; Calderón et al., 2011a), and the 2800 to 3000 cm−1 region corresponds to the presence of aliphatic C–H (Haberhauer et al., 1998; Leifeld, 2006). The PA at 3400 cm−1, a band associated with OH and NH, has been re-lated to relatively labile SOM (Haberhauer and Gerzabek, 1999; Calderón et al., 2011b). The band at 1570 is indicative of amide II but also a possible influence of aromatic rings or minerals.
Role of Vegetation in Fourier-Transform Mid-Infrared Spectra within Aggregate Fractions
Analysis of vegetation as a main effect within each aggregate fraction revealed significant differences in spectral data in the microaggregate, silt + clay, intra-aggregate POM, and intra-ag-
gregate silt + clay fractions (Table 2). These vegetation differenc-es, not observed in the whole-soil spectral analysis, demonstrated the importance of soil fractionation to examine the sensitivity of aggregate C pools to management practices.
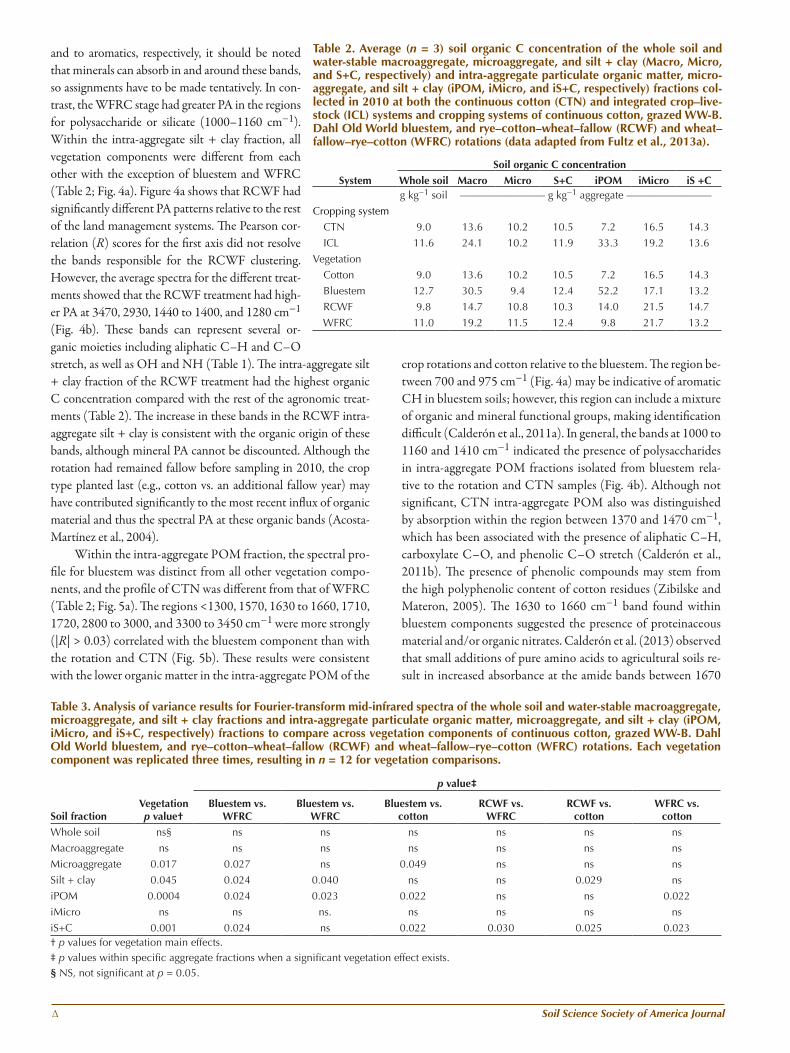
Vegetation type did not influence the SOC concentration in the silt + clay fractions (Fultz et al., 2013a; Table 2) but had a significant effect on the chemical composition according to MidIR data (Table 3). The spectra of the silt + clay fraction for both rotations were different from those for bluestem, and the pro-file for RCWF was distinct from that of CTN (Table 3; Fig. 3a). The bands for aliphatic CH (2800–3000 cm−1), O–H and N–H stretch (3300–3450 cm−1), and OH of clay particles (3600–3700 cm−1) were positively correlated along Axis 1, which aligned with samples in the rotation relative to those from bluestem and CTN (Fig. 3b; Table 1). The RCWF stage was characterized by greater PA at 1380 to 1410 and 1700 to 1720 cm−1. While assignment in these regions could be attributed to phenolics and carboxlic acids
Fig. 2. (a) Principal coordinate analysis ordination plot and (b) Pearson correlation coefficients of pseudo-absorbance readings at wavelengths within the Fourier-transform mid-infrared spectra (400–4000 cm−1) from all samples collected in 2010 for the whole soil and the macroaggregate (Macro), microaggregate (Micro), silt + clay (S+C), intra-aggregate particulate organic matter (iPOM), intra-aggregate microaggregate (iMicro), and intra-aggregate silt + clay (iS+C) fractions. ellipses represent 95% confidence intervals around the group center.
∆ Soil Science Society of America Journal
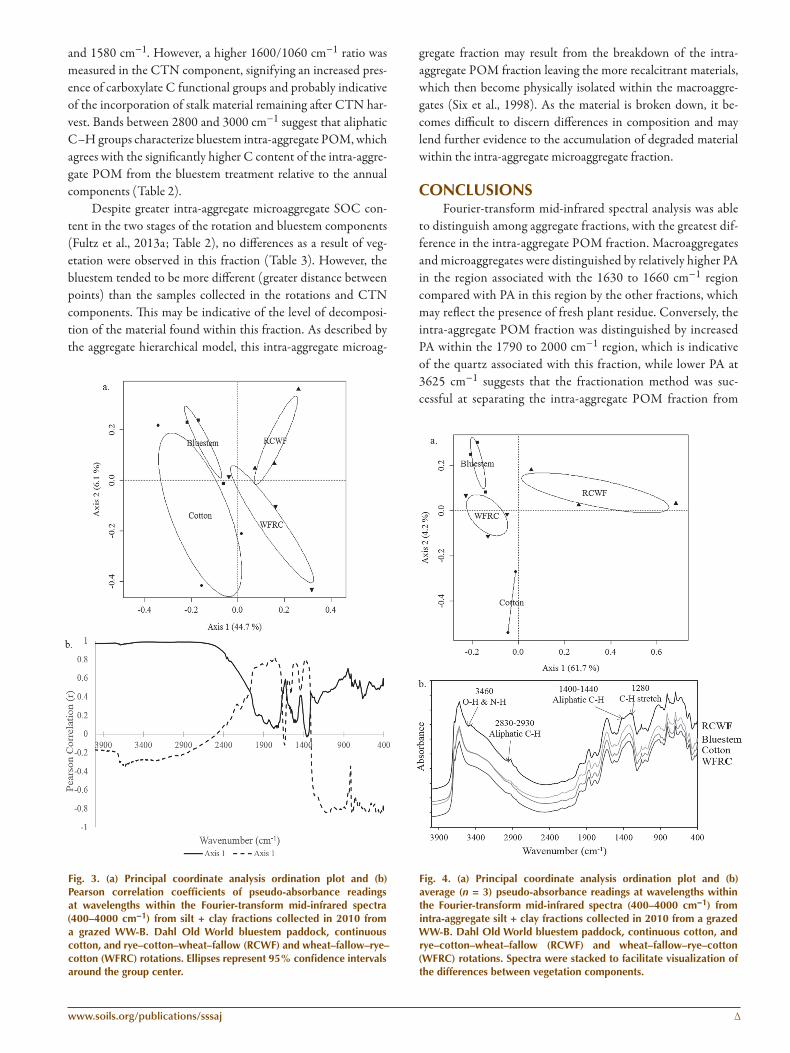
and to aromatics, respectively, it should be noted that minerals can absorb in and around these bands, so assignments have to be made tentatively. In con-trast, the WFRC stage had greater PA in the regions for polysaccharide or silicate (1000–1160 cm−1). Within the intra-aggregate silt + clay fraction, all vegetation components were different from each other with the exception of bluestem and WFRC (Table 2; Fig. 4a). Figure 4a shows that RCWF had significantly different PA patterns relative to the rest of the land management systems. The Pearson cor-relation (R) scores for the first axis did not resolve the bands responsible for the RCWF clustering. However, the average spectra for the different treat-ments showed that the RCWF treatment had high-er PA at 3470, 2930, 1440 to 1400, and 1280 cm−1 (Fig. 4b). These bands can represent several or-ganic moieties including aliphatic C–H and C–O stretch, as well as OH and NH (Table 1). The intra-aggregate silt + clay fraction of the RCWF treatment had the highest organic C concentration compared with the rest of the agronomic treat-ments (Table 2). The increase in these bands in the RCWF intra-aggregate silt + clay is consistent with the organic origin of these bands, although mineral PA cannot be discounted. Although the rotation had remained fallow before sampling in 2010, the crop type planted last (e.g., cotton vs. an additional fallow year) may have contributed significantly to the most recent influx of organic material and thus the spectral PA at these organic bands (Acosta-Martínez et al., 2004).
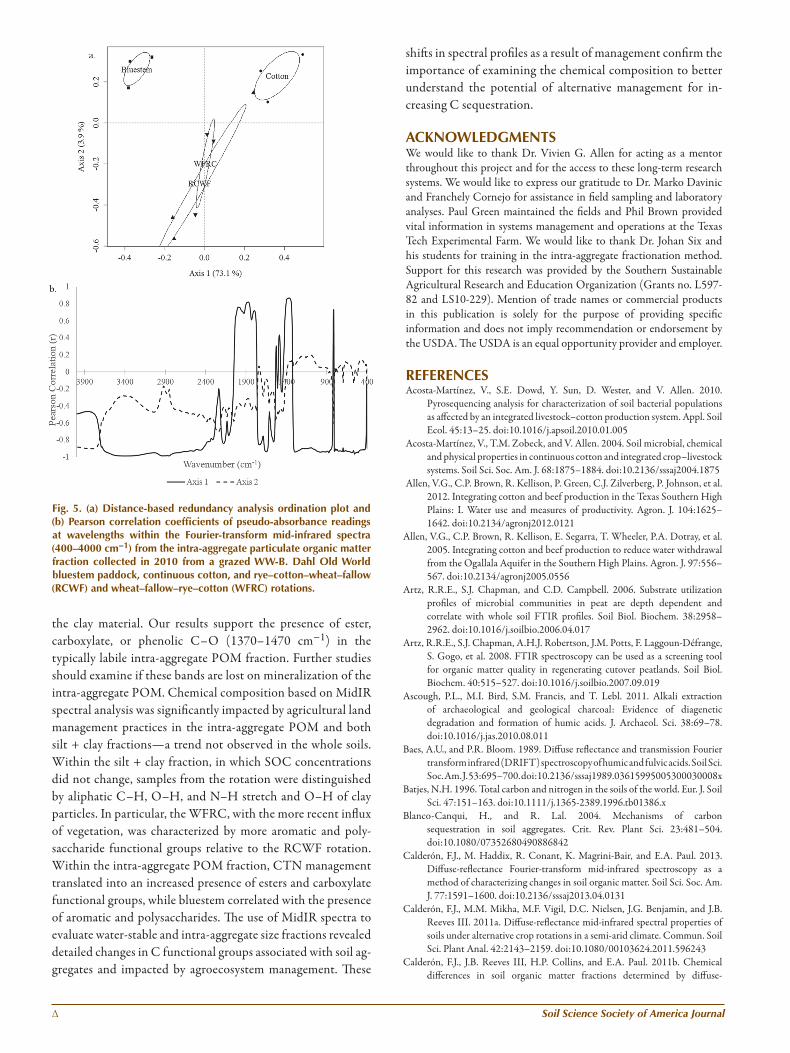
Within the intra-aggregate POM fraction, the spectral pro-file for bluestem was distinct from all other vegetation compo-nents, and the profile of CTN was different from that of WFRC (Table 2; Fig. 5a). The regions <1300, 1570, 1630 to 1660, 1710, 1720, 2800 to 3000, and 3300 to 3450 cm−1 were more strongly (|R| > 0.03) correlated with the bluestem component than with the rotation and CTN (Fig. 5b). These results were consistent with the lower organic matter in the intra-aggregate POM of the
crop rotations and cotton relative to the bluestem. The region be-tween 700 and 975 cm−1 (Fig. 4a) may be indicative of aromatic CH in bluestem soils; however, this region can include a mixture of organic and mineral functional groups, making identification difficult (Calderón et al., 2011a). In general, the bands at 1000 to 1160 and 1410 cm−1 indicated the presence of polysaccharides in intra-aggregate POM fractions isolated from bluestem rela-tive to the rotation and CTN samples (Fig. 4b). Although not significant, CTN intra-aggregate POM also was distinguished by absorption within the region between 1370 and 1470 cm−1, which has been associated with the presence of aliphatic C–H, carboxylate C–O, and phenolic C–O stretch (Calderón et al., 2011b). The presence of phenolic compounds may stem from the high polyphenolic content of cotton residues (Zibilske and Materon, 2005). The 1630 to 1660 cm−1 band found within bluestem components suggested the presence of proteinaceous material and/or organic nitrates. Calderón et al. (2013) observed that small additions of pure amino acids to agricultural soils re-sult in increased absorbance at the amide bands between 1670
Table 2. Average (n = 3) soil organic C concentration of the whole soil and water-stable macroaggregate, microaggregate, and silt + clay (Macro, Micro, and S+C, respectively) and intra-aggregate particulate organic matter, micro-aggregate, and silt + clay (iPOM, iMicro, and iS+C, respectively) fractions col-lected in 2010 at both the continuous cotton (CTN) and integrated crop–live-stock (ICL) systems and cropping systems of continuous cotton, grazed WW-B. Dahl Old World bluestem, and rye–cotton–wheat–fallow (RCWF) and wheat–fallow–rye–cotton (WFRC) rotations (data adapted from Fultz et al., 2013a).
System
Soil organic C concentration
Whole soil Macro Micro S+C iPOM iMicro iS +Cg kg−1 soil ———————— g kg−1 aggregate ————————
Cropping system
CTN 9.0 13.6 10.2 10.5 7.2 16.5 14.3
ICL 11.6 24.1 10.2 11.9 33.3 19.2 13.6
Vegetation
Cotton 9.0 13.6 10.2 10.5 7.2 16.5 14.3
Bluestem 12.7 30.5 9.4 12.4 52.2 17.1 13.2
RCWF 9.8 14.7 10.8 10.3 14.0 21.5 14.7
WFRC 11.0 19.2 11.5 12.4 9.8 21.7 13.2
Table 3. Analysis of variance results for Fourier-transform mid-infrared spectra of the whole soil and water-stable macroaggregate, microaggregate, and silt + clay fractions and intra-aggregate particulate organic matter, microaggregate, and silt + clay (iPOM, iMicro, and iS+C, respectively) fractions to compare across vegetation components of continuous cotton, grazed WW-B. Dahl Old World bluestem, and rye–cotton–wheat–fallow (RCWF) and wheat–fallow–rye–cotton (WFRC) rotations. each vegetation component was replicated three times, resulting in n = 12 for vegetation comparisons.
Soil fractionVegetation p value†
p value‡
Bluestem vs. WFRC
Bluestem vs. WFRC
Bluestem vs. cotton
RCWF vs. WFRC
RCWF vs. cotton
WFRC vs. cotton
Whole soil ns§ ns ns ns ns ns ns
Macroaggregate ns ns ns ns ns ns ns
Microaggregate 0.017 0.027 ns 0.049 ns ns ns
Silt + clay 0.045 0.024 0.040 ns ns 0.029 ns
iPOM 0.0004 0.024 0.023 0.022 ns ns 0.022
iMicro ns ns ns. ns ns ns ns
iS+C 0.001 0.024 ns 0.022 0.030 0.025 0.023† p values for vegetation main effects.‡ p values within specific aggregate fractions when a significant vegetation effect exists.§ NS, not significant at p = 0.05.
www.soils.org/publications/sssaj ∆
and 1580 cm−1. However, a higher 1600/1060 cm−1 ratio was measured in the CTN component, signifying an increased pres-ence of carboxylate C functional groups and probably indicative of the incorporation of stalk material remaining after CTN har-vest. Bands between 2800 and 3000 cm−1 suggest that aliphatic C–H groups characterize bluestem intra-aggregate POM, which agrees with the significantly higher C content of the intra-aggre-gate POM from the bluestem treatment relative to the annual components (Table 2).
Despite greater intra-aggregate microaggregate SOC con-tent in the two stages of the rotation and bluestem components (Fultz et al., 2013a; Table 2), no differences as a result of veg-etation were observed in this fraction (Table 3). However, the bluestem tended to be more different (greater distance between points) than the samples collected in the rotations and CTN components. This may be indicative of the level of decomposi-tion of the material found within this fraction. As described by the aggregate hierarchical model, this intra-aggregate microag-
gregate fraction may result from the breakdown of the intra-aggregate POM fraction leaving the more recalcitrant materials, which then become physically isolated within the macroaggre-gates (Six et al., 1998). As the material is broken down, it be-comes difficult to discern differences in composition and may lend further evidence to the accumulation of degraded material within the intra-aggregate microaggregate fraction.
CONCLUSIONSFourier-transform mid-infrared spectral analysis was able
to distinguish among aggregate fractions, with the greatest dif-ference in the intra-aggregate POM fraction. Macroaggregates and microaggregates were distinguished by relatively higher PA in the region associated with the 1630 to 1660 cm−1 region compared with PA in this region by the other fractions, which may reflect the presence of fresh plant residue. Conversely, the intra-aggregate POM fraction was distinguished by increased PA within the 1790 to 2000 cm−1 region, which is indicative of the quartz associated with this fraction, while lower PA at 3625 cm−1 suggests that the fractionation method was suc-cessful at separating the intra-aggregate POM fraction from
Fig. 3. (a) Principal coordinate analysis ordination plot and (b) Pearson correlation coefficients of pseudo-absorbance readings at wavelengths within the Fourier-transform mid-infrared spectra (400–4000 cm−1) from silt + clay fractions collected in 2010 from a grazed WW-B. Dahl Old World bluestem paddock, continuous cotton, and rye–cotton–wheat–fallow (RCWF) and wheat–fallow–rye–cotton (WFRC) rotations. ellipses represent 95% confidence intervals around the group center.
Fig. 4. (a) Principal coordinate analysis ordination plot and (b) average (n = 3) pseudo-absorbance readings at wavelengths within the Fourier-transform mid-infrared spectra (400–4000 cm−1) from intra-aggregate silt + clay fractions collected in 2010 from a grazed WW-B. Dahl Old World bluestem paddock, continuous cotton, and rye–cotton–wheat–fallow (RCWF) and wheat–fallow–rye–cotton (WFRC) rotations. Spectra were stacked to facilitate visualization of the differences between vegetation components.
∆ Soil Science Society of America Journal
the clay material. Our results support the presence of ester, carboxylate, or phenolic C–O (1370–1470 cm−1) in the typically labile intra-aggregate POM fraction. Further studies should examine if these bands are lost on mineralization of the intra-aggregate POM. Chemical composition based on MidIR spectral analysis was significantly impacted by agricultural land management practices in the intra-aggregate POM and both silt + clay fractions—a trend not observed in the whole soils. Within the silt + clay fraction, in which SOC concentrations did not change, samples from the rotation were distinguished by aliphatic C–H, O–H, and N–H stretch and O–H of clay particles. In particular, the WFRC, with the more recent influx of vegetation, was characterized by more aromatic and poly-saccharide functional groups relative to the RCWF rotation. Within the intra-aggregate POM fraction, CTN management translated into an increased presence of esters and carboxylate functional groups, while bluestem correlated with the presence of aromatic and polysaccharides. The use of MidIR spectra to evaluate water-stable and intra-aggregate size fractions revealed detailed changes in C functional groups associated with soil ag-gregates and impacted by agroecosystem management. These
shifts in spectral profiles as a result of management confirm the importance of examining the chemical composition to better understand the potential of alternative management for in-creasing C sequestration.
ACKNOWLeDgMeNTSWe would like to thank Dr. Vivien G. Allen for acting as a mentor throughout this project and for the access to these long-term research systems. We would like to express our gratitude to Dr. Marko Davinic and Franchely Cornejo for assistance in field sampling and laboratory analyses. Paul Green maintained the fields and Phil Brown provided vital information in systems management and operations at the Texas Tech Experimental Farm. We would like to thank Dr. Johan Six and his students for training in the intra-aggregate fractionation method. Support for this research was provided by the Southern Sustainable Agricultural Research and Education Organization (Grants no. L597-82 and LS10-229). Mention of trade names or commercial products in this publication is solely for the purpose of providing specific information and does not imply recommendation or endorsement by the USDA. The USDA is an equal opportunity provider and employer.
ReFeReNCeSAcosta-Martínez, V., S.E. Dowd, Y. Sun, D. Wester, and V. Allen. 2010.
Pyrosequencing analysis for characterization of soil bacterial populations as affected by an integrated livestock–cotton production system. Appl. Soil Ecol. 45:13–25. doi:10.1016/j.apsoil.2010.01.005
Acosta-Martínez, V., T.M. Zobeck, and V. Allen. 2004. Soil microbial, chemical and physical properties in continuous cotton and integrated crop–livestock systems. Soil Sci. Soc. Am. J. 68:1875–1884. doi:10.2136/sssaj2004.1875
Allen, V.G., C.P. Brown, R. Kellison, P. Green, C.J. Zilverberg, P. Johnson, et al. 2012. Integrating cotton and beef production in the Texas Southern High Plains: I. Water use and measures of productivity. Agron. J. 104:1625–1642. doi:10.2134/agronj2012.0121
Allen, V.G., C.P. Brown, R. Kellison, E. Segarra, T. Wheeler, P.A. Dotray, et al. 2005. Integrating cotton and beef production to reduce water withdrawal from the Ogallala Aquifer in the Southern High Plains. Agron. J. 97:556–567. doi:10.2134/agronj2005.0556
Artz, R.R.E., S.J. Chapman, and C.D. Campbell. 2006. Substrate utilization profiles of microbial communities in peat are depth dependent and correlate with whole soil FTIR profiles. Soil Biol. Biochem. 38:2958–2962. doi:10.1016/j.soilbio.2006.04.017
Artz, R.R.E., S.J. Chapman, A.H.J. Robertson, J.M. Potts, F. Laggoun-Défrange, S. Gogo, et al. 2008. FTIR spectroscopy can be used as a screening tool for organic matter quality in regenerating cutover peatlands. Soil Biol. Biochem. 40:515–527. doi:10.1016/j.soilbio.2007.09.019
Ascough, P.L., M.I. Bird, S.M. Francis, and T. Lebl. 2011. Alkali extraction of archaeological and geological charcoal: Evidence of diagenetic degradation and formation of humic acids. J. Archaeol. Sci. 38:69–78. doi:10.1016/j.jas.2010.08.011
Baes, A.U., and P.R. Bloom. 1989. Diffuse reflectance and transmission Fourier transform infrared (DRIFT) spectroscopy of humic and fulvic acids. Soil Sci. Soc. Am. J. 53:695–700. doi:10.2136/sssaj1989.03615995005300030008x
Batjes, N.H. 1996. Total carbon and nitrogen in the soils of the world. Eur. J. Soil Sci. 47:151–163. doi:10.1111/j.1365-2389.1996.tb01386.x
Blanco-Canqui, H., and R. Lal. 2004. Mechanisms of carbon sequestration in soil aggregates. Crit. Rev. Plant Sci. 23:481–504. doi:10.1080/07352680490886842
Calderón, F.J., M. Haddix, R. Conant, K. Magrini-Bair, and E.A. Paul. 2013. Diffuse-reflectance Fourier-transform mid-infrared spectroscopy as a method of characterizing changes in soil organic matter. Soil Sci. Soc. Am. J. 77:1591–1600. doi:10.2136/sssaj2013.04.0131
Calderón, F.J., M.M. Mikha, M.F. Vigil, D.C. Nielsen, J.G. Benjamin, and J.B. Reeves III. 2011a. Diffuse-reflectance mid-infrared spectral properties of soils under alternative crop rotations in a semi-arid climate. Commun. Soil Sci. Plant Anal. 42:2143–2159. doi:10.1080/00103624.2011.596243
Calderón, F.J., J.B. Reeves III, H.P. Collins, and E.A. Paul. 2011b. Chemical differences in soil organic matter fractions determined by diffuse-
Fig. 5. (a) Distance-based redundancy analysis ordination plot and (b) Pearson correlation coefficients of pseudo-absorbance readings at wavelengths within the Fourier-transform mid-infrared spectra (400–4000 cm−1) from the intra-aggregate particulate organic matter fraction collected in 2010 from a grazed WW-B. Dahl Old World bluestem paddock, continuous cotton, and rye–cotton–wheat–fallow (RCWF) and wheat–fallow–rye–cotton (WFRC) rotations.

www.soils.org/publications/sssaj ∆
reflectance mid-infrared spectroscopy. Soil Sci. Soc. Am. J. 75:568–579. doi:10.2136/sssaj2009.0375
Cambardella, C.A., and E.T. Elliott. 1994. Carbon and nitrogen dynamics of soil organic matter fractions from cultivated grassland soils. Soil Sci. Soc. Am. J. 58:123–130. doi:10.2136/sssaj1994.03615995005800010017x
Cécillon, L., G. Certini, H. Lange, C. Forte, and L.T. Strand. 2012. Spectral fingerprinting of soil organic matter composition. Org. Geochem. 46:127–136. doi:10.1016/j.orggeochem.2012.02.006
Davinic, M., L.M. Fultz, V. Acosta-Martinez, F.J. Calderón, S.B. Cox, S.E. Dowd, et al. 2012. Pyrosequencing and mid-infrared spectroscopy reveal distinct aggregate stratification of soil bacterial communities and organic matter composition. Soil Biol. Biochem. 46:63–72. doi:10.1016/j.soilbio.2011.11.012
Denef, K., J. Six, R. Merckx, and K. Paustian. 2004. Carbon sequestration in microaggregates of no-tillage soils with different clay mineralogy. Soil Sci. Soc. Am. J. 68:1935–1944. doi:10.2136/sssaj2004.1935
Ding, G., J.M. Novak, D. Amarasiriwardena, P.G. Hunt, and B. Xing. 2002. Soil organic matter characteristics as affected by tillage management. Soil Sci. Soc. Am. J. 66:421–429. doi:10.2136/sssaj2002.4210
Ellerbrock, R.H., A. Höhn, and J. Rogasik. 1999. Functional analysis of soil organic matter as affected by long-term manorial treatment. Eur. J. Soil Sci. 50:65–71. doi:10.1046/j.1365-2389.1999.00206.x
Ellerbrock, R.H., and H. Kaiser. 2005. Stability and composition of different soluble soil organic matter fractions: Evidence from d13C and FTIR signatures. Geoderma 128:28–37. doi:10.1016/j.geoderma.2004.12.025
Elliott, E.T. 1986. Aggregate structure and carbon, nitrogen, and phosphorus in native and cultivated soils. Soil Sci. Soc. Am. J. 50:627–633. doi:10.2136/sssaj1986.03615995005000030017x
Fernández-Getino, A.P., Z. Hernández, A.P. Buena, and G. Almendros. 2010. Assessment of the effects of environmental factors on humification processes by derivative infrared spectroscopy and discriminant analysis. Geoderma 158:225–232. doi:10.1016/j.geoderma.2010.05.002
Fultz, L.M., J. Moore-Kucera, T.M. Zobeck, V. Acosta-Martinez, and V.G. Allen. 2013a. Aggregate carbon pools after 13 years of integrated crop–livestock management in semiarid soils. Soil Sci. Soc. Am. J. 77:1659–1666. doi:10.2136/sssaj2012.0423
Fultz, L.M., J. Moore-Kucera, T.M. Zobeck, V. Acosta-Martinez, D.B. Wester, and V.G. Allen. 2013b. Organic carbon dynamics and soil stability in five semiarid agroecosystems. Agric. Ecosyst. Environ. 181:231–240. doi:10.1016/j.agee.2013.10.004
Haberhauer, G., and M.H. Gerzabek. 1999. Drift and transmission FT-IR spectroscopy of forest soils: An approach to determine decomposition processes of forest litter. Vib. Spectrosc. 19:413–417. doi:10.1016/S0924-2031(98)00046-0
Haberhauer, G., B. Rafferty, F. Strebl, and M.H. Gerzabeck. 1998. Comparison of the composition of forest soil litter derived from three different sites at various decompositional stages using FTIR spectroscopy. Geoderma 83:331–342. doi:10.1016/S0016-7061(98)00008-1
He, X., B. Xi, Z. Wei, X. Guo, M. Li, D. An, and H. Liu. 2011. Spectroscopic characterization of water extractable organic matter during composting of municipal soil waste. Chemosphere 82:541–548. doi:10.1016/j.chemosphere.2010.10.057
Hay, M.B., and C.B. Myneni. 2007. Structural environments of carboxyl groups in natural organic molecules from terrestrial systems: 1. Infrared spectroscopy. Geochim. Cosmochim. Acta 71:3518–3532. doi:10.1016/j.gca.2007.03.038
Jastrow, J.D. 1996. Soil aggregate formation and the accrual of particulate and mineral associated organic matter. Soil Biol. Biochem. 28:665–676. doi:10.1016/0038-0717(95)00159-X
Leifeld, J. 2006. Application of diffuse reflectance FT-IR spectroscopy and partial least squares regression to predict NMR properties of soil organic matter. Eur. J. Soil Sci. 57:846–857. doi:10.1111/j.1365-2389.2005.00776.x
McCarty, G.W., J.B. Reeves III, V.B. Reeves, R.F. Follett, and J.M. Kimble. 2002. Mid-infrared and near-infrared diffuse reflectance spectroscopy for soil carbon measurement. Soil Sci. Soc. Am. J. 66:640–646. doi:10.2136/sssaj2002.6400
Movasaghi, Z., S. Rehman, and I. ur Rehman. 2008. Fourier transform infrared (FTIR) spectroscopy of biological tissues. Appl. Spectrosc. Rev. 43:134–179. doi:10.1080/05704920701829043
Nguyen, T., L.J. Janik, and M. Raupach. 1991. Diffuse reflectance infrared
Fourier transform (DRIFT) spectroscopy in soil studies. Aust. J. Soil Res. 29:49–67. doi:10.1071/SR9910049
Oades, J.M. 1984. Soil organic matter and structural stability: Mechanisms and implications for measurement. Plant Soil 76:319–337. doi:10.1007/BF02205590
Oksanen, J., F.G. Blanchet, R. Kindt, P. Legendre, P.R. Minchin, R.B. O’Hara, et al. 2013. Vegan: Community ecology package. R Foundation for Statistical Computing, Vienna. http://CRAN.R-project.org/package=vegan.
Olk, D., G. Brunetti, and N. Senesi. 2000. Decrease in humification of organic matter with intensified lowland rice cropping: A wet chemical and spectroscopic investigation. Soil Sci. Soc. Am. J. 64:1337–1347. doi:10.2136/sssaj2000.6441337x
Parikh, S.J., K.W. Goyne, A.J. Margenot, F.N.D. Mukome, and F.J. Calderón. 2014. Soil chemical insights provided through vibrational spectroscopy. Adv. Agron. 126:1–148. doi:10.1016/B978-0-12-800132-5.00001-8
Piccolo, A., R. Rausa, and G. Celano. 1992. Characteristics of molecular size fractions of humic substances derived from oxidized cells. Chemosphere 24:1381–1387. doi:10.1016/0045-6535(92)90061-U
Post, W.M., W.R. Emanuel, P.J. Zinke, and A.G. Stangenberger. 1982. Soil carbon pools and world life zones. Nature 298:156–159. doi:10.1038/298156a0
Prasad, M., J.B.G.M. Verhagen, and T.G.L. Aendekerk. 2000. Effect of peat type and pH on breakdown of peat using Fourier transform infrared spectroscopy. Commun. Soil Sci. Plant Anal. 31:2881–2889. doi:10.1080/00103620009370635
R Development Core Team. 2013. R: A language and environment for statistical computing. R Foundation for Statistical Computing, Vienna. http://www.R-project.org/.
Reeves, J.B., III, G.W. McCarty, and V.B. Reeves. 2001. Mid-infrared diffuse reflectance spectroscopy for the quantitative analysis of agricultural soils. J. Agric. Food Chem. 49:766–772. doi:10.1021/jf0011283
Sánchez-Monedero, M.A., J. Cegarra, D. García, and A. Roig. 2002. Chemical and structural evolution of humic acids during organic waste composting. Biodegradation 13:361–371. doi:10.1023/A:1022888231982
Schlesinger, W.J. 1977. Carbon balance in terrestrial detritus. Annu. Rev. Ecol. Syst. 8:51–81. doi:10.1146/annurev.es.08.110177.000411
Senesi, N., V. D’Orazio, and G. Ricca. 2003. Humic acids in the first generation of EUROSOILS. Geoderma 116:325–344. doi:10.1016/S0016-7061(03)00107-1
Six, J., E.T. Elliott, and K. Paustian. 2000. Soil macroaggregate turnover and microaggregate formation: A mechanism for C sequestration under no-tillage agriculture. Soil Biol. Biochem. 32:2099–2103. doi:10.1016/S0038-0717(00)00179-6
Six, J., E.T. Elliott, K. Paustian, and J.W. Doran. 1998. Aggregation and soil organic matter accumulation in cultivated and native grassland soils. Soil Sci. Soc. Am. J. 62:1367–1377. doi:10.2136/sssaj1998.03615995006200050032x
Sollins, P., C. Swanston, M. Kleber, T. Filley, M. Kramer, S. Crow, et al. 2006. Organic C and N stabilization in a forest soil: Evidence from sequential density fractionation. Soil Biol. Biochem. 38:3313–3324. doi:10.1016/j.soilbio.2006.04.014
Solomon, D., J. Lehmann, J. Thies, T. Schäfer, B. Liang, J. Kinyangi, et al. 2007. Molecular signature and sources of biochemical recalcitrance of organic C in Amazonian Dark Earths. Geochim. Cosmochim. Acta 71:2285–2298. doi:10.1016/j.gca.2007.02.014
Tandy, S., J.R. Healey, M.A. Nason, J.C. Williamson, D.L. Jones, and S.C. Thain. 2010. FT-IR as an alternative method for measuring chemical properties during composting. Bioresour. Technol. 101:5431–5436. doi:10.1016/j.biortech.2010.02.033
Tatzber, M., M. Stemmer, H. Spiegel, C. Katzlberger, G. Haberhauer, A. Mentler, and M.H. Gerzabek. 2007. FTIR-spectroscopic characterization of humic acids and humin fractions obtained by advanced NaOH, Na4P2O7, and Na2CO3 extraction procedures. J. Plant Nutr. Soil Sci. 170:522–529. doi:10.1002/jpln.200622082
Vergnoux, A., M. Guiliano, R. Di Rocco, M. Domeizel, F. Theraulaz, and P. Doumenq. 2011. Quantitative and mid-infrared changes of humic substances from burned soils. Environ. Res. 111:205–214. doi:10.1016/j.envres.2010.03.005
Zibilske, L.M., and L.A. Materon. 2005. Biochemical properties of decomposing cotton and corn stem and root residues. Soil Sci. Soc. Am. J. 69:378–386. doi:10.2136/sssaj2005.0378
Related Documents


![Tropical and Subtropical Agroecosystems...Tropical and Subtropical Agroecosystems, 9 (2008): 15 - 27 15 REVIEW [REVISIÓN] EMPLEO DE MARCADORES MOLECULARES EN LA DIFERENCIACIÓN DE](https://static.cupdf.com/doc/110x72/601ad25a26b23f41444fcff4/tropical-and-subtropical-tropical-and-subtropical-agroecosystems-9-2008.jpg)


