Using EUROMOD to nowcast risk of poverty in the EU Jekaterina Navicke, Olga Rastrigina and Holly Sutherland ISER, University of Essex 2013 EUROMOD research workshop Lisbon, 2 October 2013

Welcome message from author
This document is posted to help you gain knowledge. Please leave a comment to let me know what you think about it! Share it to your friends and learn new things together.
Transcript

Using EUROMOD to nowcast risk of poverty
in the EU
Jekaterina Navicke, Olga Rastrigina and Holly SutherlandISER, University of Essex
2013 EUROMOD research workshopLisbon, 2 October 2013

Motivation & aim Context Toolbox Results Further steps
Outline:

Problem: 2-3-year time lag in the production of EU-SILC statistics
Timely indicators would: Promote distributional issues when assessing current socio-economic
conditions Facilitate monitoring of current policy reforms/problems Help assess progress towards Europe 2020 target Not a substitute for more timely data collection and processing! As any forecast should be treated with caution
Aims: To predict what the EU-SILC will show when the data on current income
are available To develop methods that can be applied quickly and updated easily for
EU27 To estimate the direction and scale of movement of key income-based
indicators (median, risk-of-poverty, inequality, etc.)
Motivation & aim
Dec 2012: paper at the NetSILC2 conference develop the method tested on EU-SILC 2008 (2007 income) 8 countries: Estonia, Greece, Spain, Italy, Latvia, Lithuania, Portugal,
Romania nowcast for 2010-2012 Eurostat working paper:
http://epp.eurostat.ec.europa.eu/cache/ITY_OFFPUB/KS-RA-13-010/EN/KS-RA-13-010-EN.PDF
July 2013: EUROMOD working paper focus on validation https://www.iser.essex.ac.uk/publications/working-papers/euromod/em11-
13
By Dec 2013: SSM research note (work in progress) improvements to current methodology application on EU-SILC 2010 (2009 income) more countries (+ Germany, Finland, …) nowcast 2011-2013
Context:

EUROMOD simulation
Adjusting EUROMOD to account for employment changes
Calibration to align EUROMOD and EU-SILC
No data adjustments to account for demographic changes
Ad hoc and country specific adjustments kept to the minimum
Toolbox:
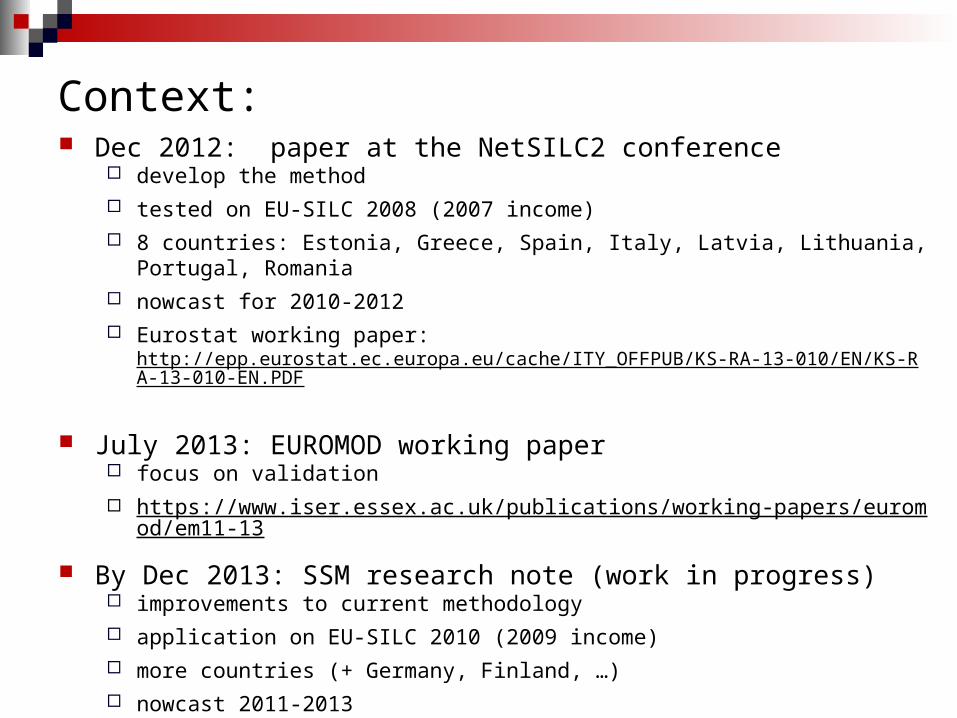
EUROMOD - static tax-benefit microsimulation model for the EU: Unique: consistent results across 27 Member States Operates on anonymized EU-SILC cross-sectional micro-data Scope: income taxes, social contributions and cash benefits For details see EUROMOD Country Reports:
https://www.iser.essex.ac.uk/euromod/resources-for-euromod-users/country-reports
Simulation: Tax and benefit policies simulated up to 2012 (as of June 30th); Non-simulated benefits and original incomes are updated from 2007 to
2012 using indexes (earnings, CPI etc.) plus official projections. Updating disaggregated where possible (e.g. earnings by sector).
Toolbox (1): EUROMOD simulation

Fig 1 Nominal proportional changes in average gross employment income (EUROMOD and EU-SILC) and compensation per employee (AMECO), EUR
Notes: Chain growth. EU-SILC numbers are lagged by one year to correspond to the income reference year. Statistics on compensation per employee obtained from the annual macro-economic dataset of DG ECFIN (AMECO).
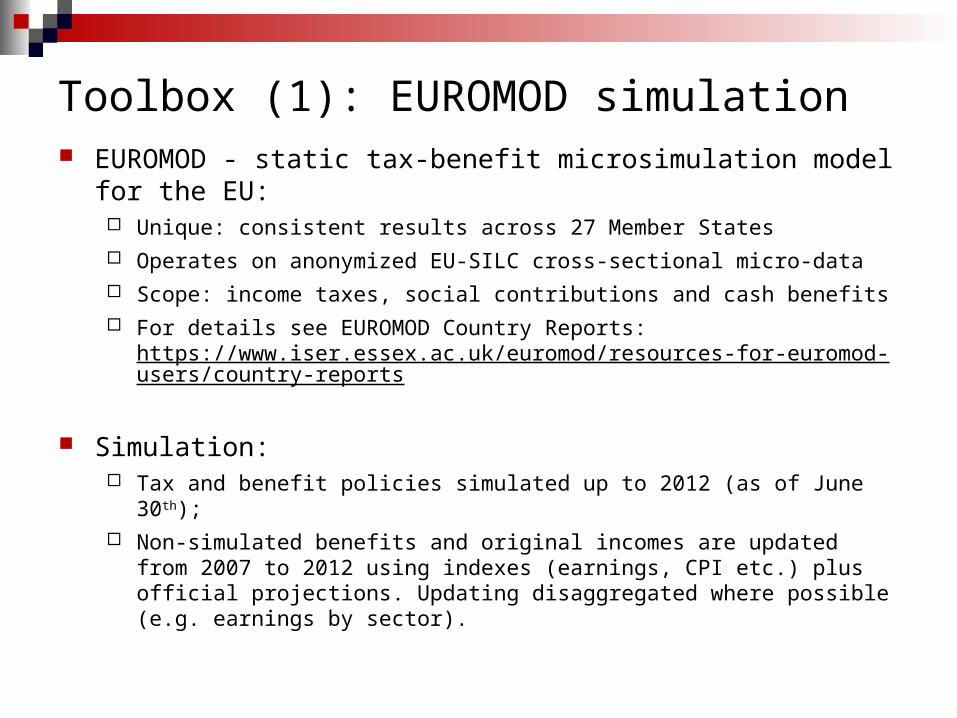
Adjusting EUROMOD input data (SILC 2008) for employment changes (2008-2012)
Based on LFS data: Trade-off between more up-to-date and more detailed data We use published LFS employment figures
(in 2012: annual up to 2011 & rolling quarterly average for 2012) Concepts do not align perfectly between SILC and LFS => = > Aim is not to align LFS and SILC, but model relative changes
Steps: modelling employment transitions
(net changes in employment rates modelled within 18 stratum by age, gender, educational status: random selection + 200 replications for more robust results)
modelling share of long-term unemployment to capture changes in eligibility for benefit receipt (similar method)
adjusting labour market characteristics in the EUROMOD data & simulating benefits.
Toolbox (2): Employment Adjustments

Fig 2 Employment rates in the LFS, EU-SILC and in EUROMOD before and after labour market adjustments
Notes: EU-SILC numbers are lagged by one year to correspond to the income reference year.
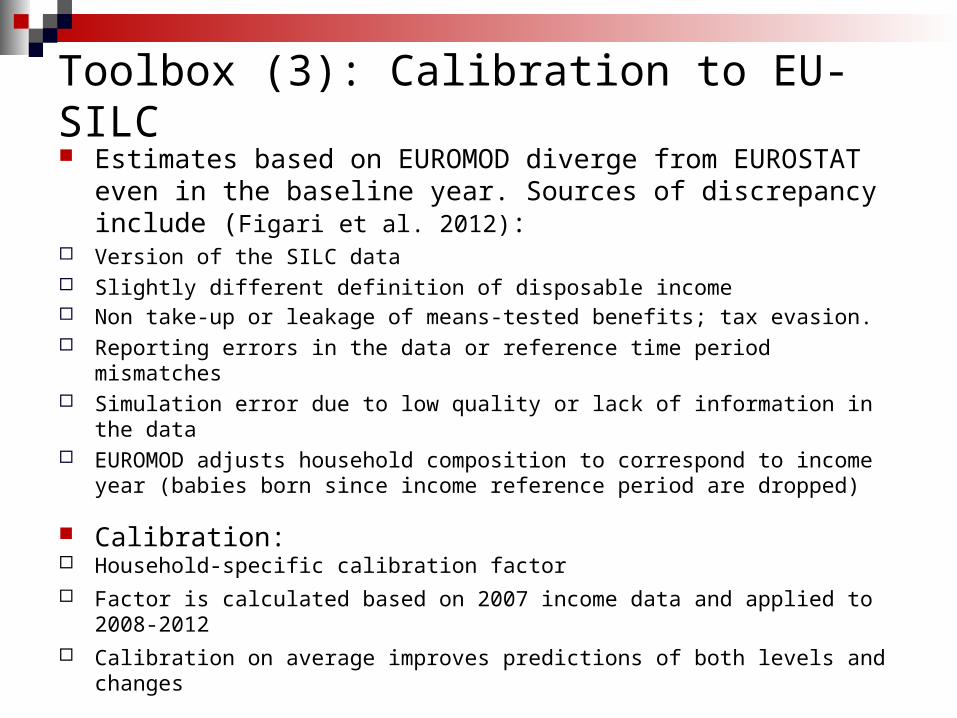
Estimates based on EUROMOD diverge from EUROSTAT even in the baseline year. Sources of discrepancy include (Figari et al. 2012):
Version of the SILC data Slightly different definition of disposable income Non take-up or leakage of means-tested benefits; tax evasion. Reporting errors in the data or reference time period mismatches Simulation error due to low quality or lack of information in the data EUROMOD adjusts household composition to correspond to income year
(babies born since income reference period are dropped)
Calibration: Household-specific calibration factor Factor is calculated based on 2007 income data and applied to 2008-2012 Calibration on average improves predictions of both levels and changes
Toolbox (3): Calibration to EU-SILC

Results (1): POVERTY RISKFig 3 EUROMOD 2007-2012 and EU-SILC 2007-2010: At risk of poverty rates (using 60% median as the threshold)
Notes: EU-SILC numbers are lagged by one year to correspond to the income reference year
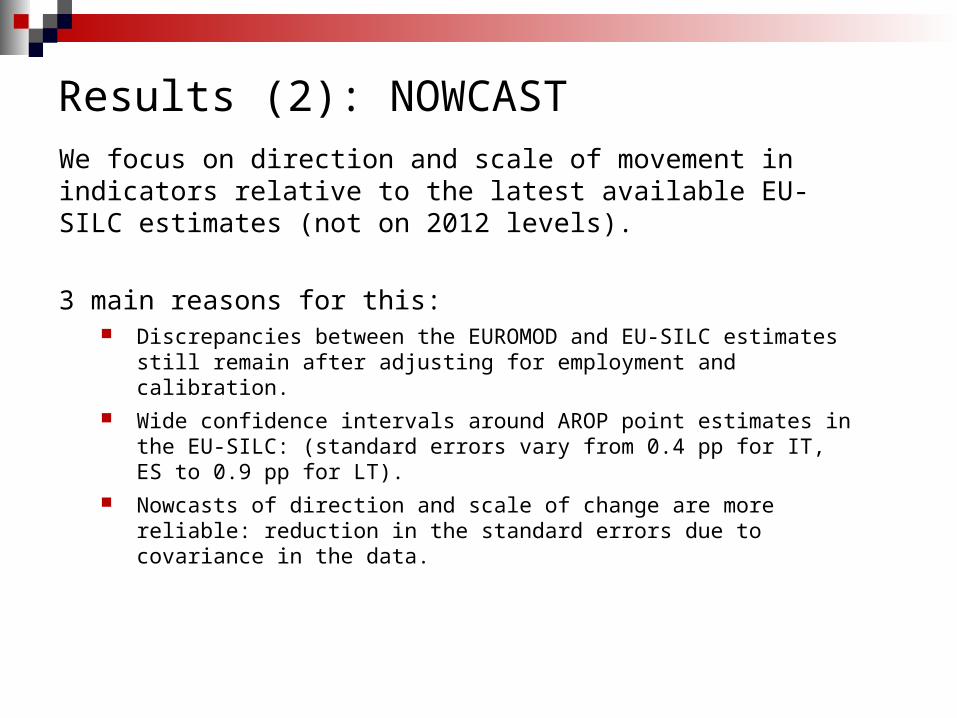
We focus on direction and scale of movement in indicators relative to the latest available EU-SILC estimates (not on 2012 levels).
3 main reasons for this: Discrepancies between the EUROMOD and EU-SILC estimates still
remain after adjusting for employment and calibration. Wide confidence intervals around AROP point estimates in the EU-
SILC: (standard errors vary from 0.4 pp for IT, ES to 0.9 pp for LT). Nowcasts of direction and scale of change are more reliable:
reduction in the standard errors due to covariance in the data.
Results (2): NOWCAST
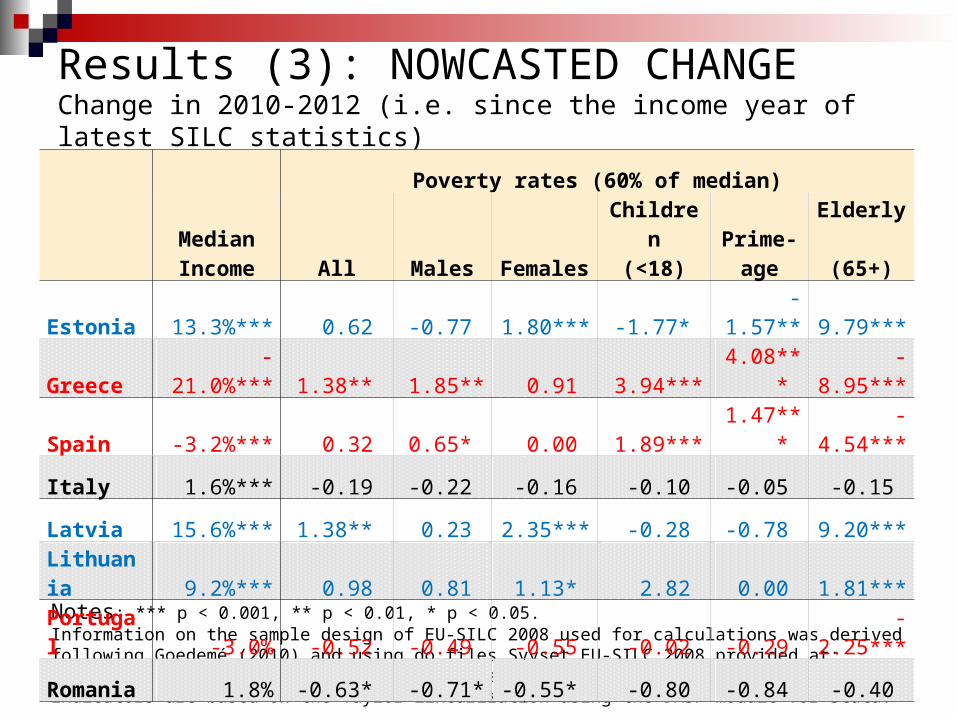
Results (3): NOWCASTED CHANGEChange in 2010-2012 (i.e. since the income year of latest SILC statistics)
Notes: *** p < 0.001, ** p < 0.01, * p < 0.05. Information on the sample design of EU-SILC 2008 used for calculations was derived following Goedemé (2010) and using do files Svyset EU-SILC 2008 provided at: http://www.ua.ac.be/main.aspx?c=tim.goedeme&n=95420. Standard errors around AROP indicators are based on the Taylor linearization using the DASP module for Stata.
Poverty rates (60% of median)
Median Income All Males
Females
Children
(<18)Prime-
ageElderly (65+)
Estonia 13.3%*** 0.62 -0.77 1.80*** -1.77* -1.57** 9.79*** Greece -21.0%*** 1.38** 1.85** 0.91 3.94*** 4.08*** -8.95*** Spain -3.2%*** 0.32 0.65* 0.00 1.89*** 1.47*** -4.54*** Italy 1.6%*** -0.19 -0.22 -0.16 -0.10 -0.05 -0.15 Latvia 15.6%*** 1.38** 0.23 2.35*** -0.28 -0.78 9.20*** Lithuania 9.2%*** 0.98 0.81 1.13* 2.82 0.00 1.81*** Portugal -3.0% -0.52 -0.49 -0.55 -0.02 -0.29 -2.25*** Romania 1.8% -0.63* -0.71* -0.55* -0.80 -0.84 -0.40

Results (4): NOWCASTED LEVELSWhat EU-SILC 2013 will show (2012 income)
Poverty rates (60% of median)
Median Income
(€ per year) All Males FemalesChildren
(<18)Prime-
ageElderly
(65+)
Estonia 6,340 18.1 16.8 19.2 17.7 14.3 22.9
Greece 8,683 22.8 22.8 22.8 27.6 22.7 14.7
Spain 12,111 22.1 21.8 22.4 29.1 21.9 16.3
Italy 16,225 19.4 18.1 20.6 26.2 19.1 16.9
Latvia 4,796 20.5 20.2 20.8 24.7 18.5 18.1
Lithuania 4,373 21.0 20.6 21.2 27.1 19.8 13.9
Portugal 8,155 17.5 17.1 17.8 22.4 14.7 17.7
Romania 2,155 21.6 21.2 21.9 32.1 21.0 13.7Notes:Household incomes are equivalized using the modified OECD scale. Median income in Euro per year.Change in 2010-2012 applied on the latest EU-SILC statistics.

Select cases for employment transitions based on estimated conditional probabilities of being in a particular employment status
occupational decision models (e.g. Habib et.al. 2010, Ferreira et.al. 2004) estimation based on the latest EU-SILC microdata Logit model for predicting employment/non-employment estimated
separately for those with low/high education, age frame 15-64: predictors: sex, age, years of education, occupational status as measured by
ISCO, dependency ratio in a household, participation rate, dummies for hh head, employed partner, small children under 4; squares, interactions.
combine with published LFS employment statistics (as currently)
Modeling new wages needs refinement: Currently based on average wage within the stratum Refining this using wage equations
Reweighting for changes in employment and/or demographics
Other?
Further steps (methodological improvements)


Fig 4 EUROMOD 2007-2012 and EU-SILC 2007-2010: Median equivalized household disposable income (EUR per year)
Note: SILC data corresponds to the income reference period.

Fig 5 EUROMOD 2007-2012 and EU-SILC 2007-2010: At risk of poverty rates (using 60% median as the threshold)
Notes:Confidence intervals for EUROMOD estimates are due to a random element in the simulation of employment transitions and do not account for sampling variability. Confidence intervals for EU-SILC estimates of at risk of poverty rates are constructed based on the standard errors provided in Comparative EU Intermediate Quality Reports for EU-SILC 2008-2010 (Available at: http://epp.eurostat.ec.europa.eu/portal/page/portal/income_social_inclusion_living_conditions/quality/eu_quality_reports).

Fig 6 EUROMOD 2007 -2012: At risk of poverty rates by household type (using 60% of the 2007 median as the threshold)
Note: The poverty threshold is 60% of median 2007 equivalised household income, indexed by the HCPI
10
15
20
25
30
35
40
45
2007 2008 2009 2010 2011 2012
Estonia
051015202530354045
2007
Total Children Elderly
15
20
25
30
35
40
45
50
2007 2008 2009 2010 2011 2012
Greece
15
20
25
30
35
40
45
50
2007 2008 2009 2010 2011 2012
Spain
15
20
25
30
35
40
45
50
2007 2008 2009 2010 2011 2012
Italy
15
20
25
30
35
40
45
50
2007 2008 2009 2010 2011 2012
Lithuania
20
25
30
35
40
45
50
55
2007 2008 2009 2010 2011 2012
Latvia
15
20
25
30
35
40
45
50
2007 2008 2009 2010 2011 2012
Portugal
5
10
15
20
25
30
35
40
2007 2008 2009 2010 2011 2012
Romania

Growth incidence curvesChange in real income by percentile, 2010-2012
-15%
-10%
-5%
0%
5%
10%
15%
20%
25%
6 8 10 12 14 16 18 20 22 24 26 28 30 32 34 36 38 40 42 44 46 48 50 52 54 56 58 60 62 64 66 68 70 72 74 76 78 80 82 84 86 88 90 92 94
LV
EE
LT
RO
IT
ES
PT
-80%
-70%
-60%
-50%
-40%
-30%
-20%
-10%
0%6 9 12 15 18 21 24 27 30 33 36 39 42 45 48 51 54 57 60 63 66 69 72 75 78 81 84 87 90 93
GREECE
Note: based on re-ranked distribution
Related Documents