Using Equity Audit in NHS Lothian Dr Margaret Douglas Public Health Consultant Sheila Wilson Senior Health Policy Officer

Using Equity Audit in NHS Lothian Dr Margaret Douglas Public Health Consultant Sheila Wilson Senior Health Policy Officer.
Dec 31, 2015
Welcome message from author
This document is posted to help you gain knowledge. Please leave a comment to let me know what you think about it! Share it to your friends and learn new things together.
Transcript

Using Equity Audit in NHS Lothian
Dr Margaret DouglasPublic Health Consultant
Sheila Wilson Senior Health Policy Officer

A whole systems approach to addressing
health inequalities in NHS Lothian

NHS Lothian Principles to address health inequalities
• Broad programme: both health determinants and health services
• Identify and avoid unintended adverse effects of our services• Give priority to disadvantaged groups• Consult with/involve all groups • Interventions coherent, long term, at all levels, with evidence
base• NHS needs to influence partners but also ensure our own work
doesn’t disadvantage vulnerable groups
Whole system approach
• Three strands of work:
• Partnership work to address determinants of inequality
• Ensure mainstream services appropriate for all
• Targeted initiatives

Inequalities in access to healthcare
• ‘Inverse care law’• Physical access eg car ownership• Language barriers• Cultural barriers• Financial barriers• Previous experience• Different expectations
Inequalities in access to healthcare
• NHS by itself cant reduce the inequalities• But we must meet the needs of the people with greatest health
needs• Aim for equal access, equal use and equal quality for equal need • Services may be
– Universal / Targeted / Distributional
Equity audits
• Explore how well existing services meet needs of disadvantaged groups
• Both quantitative data and qualitative methods• Aim to identify changes to improve access and/or outcomes for
disadvantaged groups • Core public health work but with systematic approach and formal
NHS Lothian policy
Selection of topic areas
• Is this a well defined service area? Complexity of patient pathway
• Previous or ongoing work in this service area
• Likely staff support in this service area• Fit with strategic priorities/links with
other workstreams• Is data readily available?• What is the potential impact on health
inequalities?
Example 1:Physiotherapy self referral
• Background: community physiotherapy services and routes of referral
• Aim: to explore differences between GP and self referred patients

Patient Pathway
What are the research questions?
What data could be used?
What dimensions of inequality could the data be broken down by?

Objectives of the equity audit
• To describe self-referrals and other types of referral by age, sex, socioeconomic status and location
• To describe self-referrals and other types of referral by type of discharge (Patient completed treatment, DNA, Did not complete etc.), age, sex, socio-economic status and location
• To describe time from routine referral to start of treatment by type of referral age, sex, socio-economic status and location.
• To describe clinical presentation (back pain etc.) by age, sex, socioeconomic status and location
• To describe type of referral and clinical presentation by ethnic group (where number is sufficient)
Data
• Electronic patient record• Referral date between 1/4/07 and 31/7/10• 20,522 referrals in 2 centres, which account
for about 20% of Edinburgh CHP physio referrals
• SIMD used to derive deprivation quintiles• Onomap software to assign ethnicity
• What are the potential biases in these data?
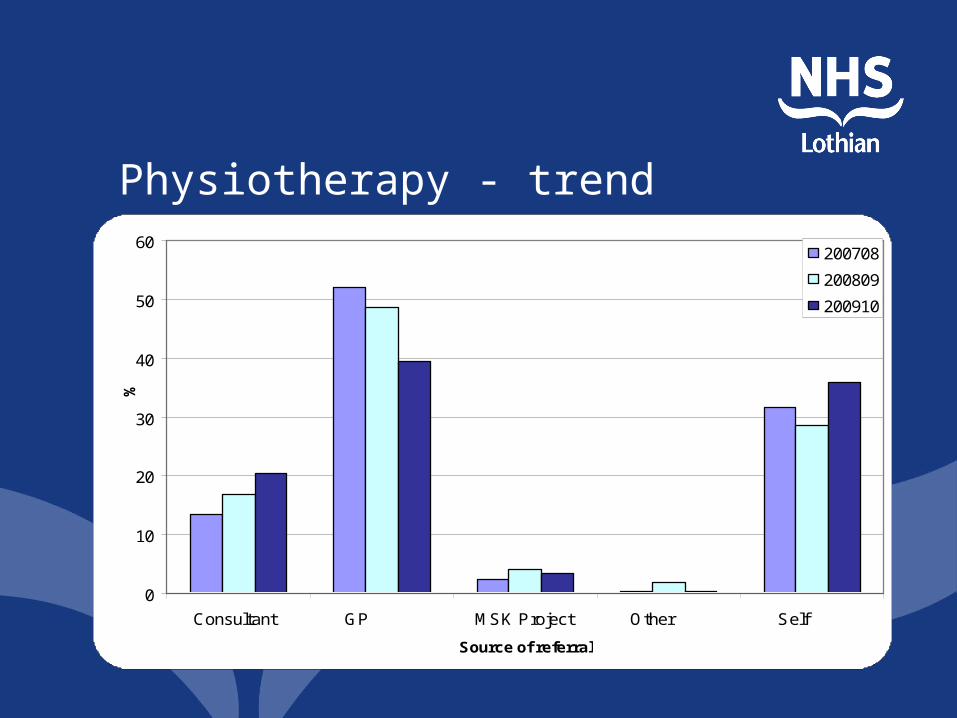
Physiotherapy - trend
0
10
20
30
40
50
60
Consultant GP MSK Project Other Self
Source of referral
%
200708
200809
200910
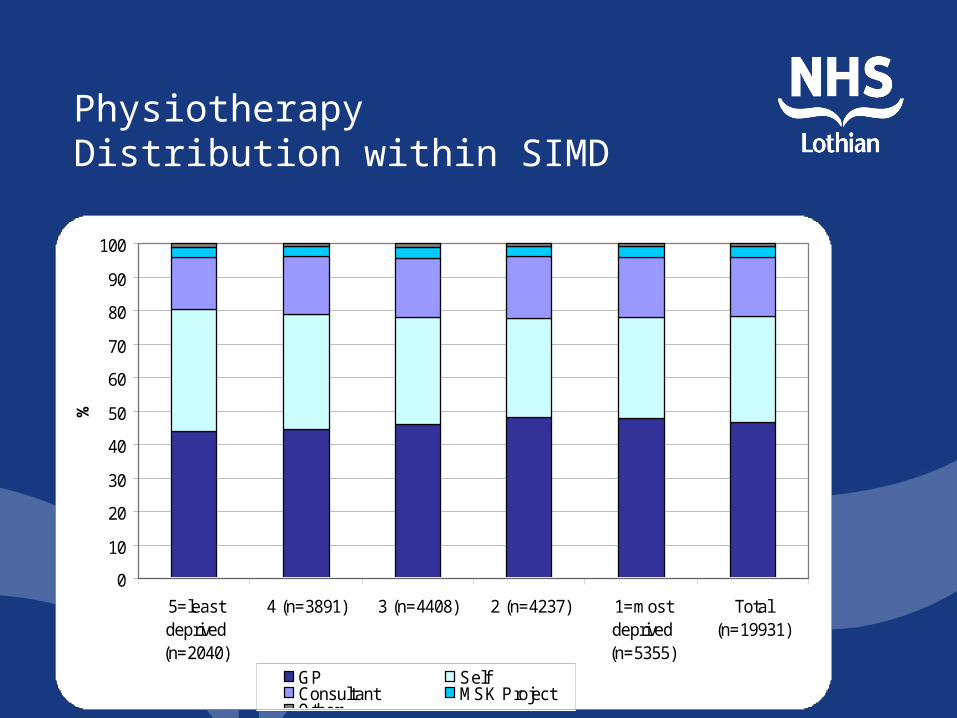
Physiotherapy Distribution within SIMD
0
10
20
30
40
50
60
70
80
90
100
5=leastdeprived(n=2040)
4 (n=3891) 3 (n=4408) 2 (n=4237) 1=mostdeprived(n=5355)
Total(n=19931)
SIMD
%
GP SelfConsultant MSK ProjectOther
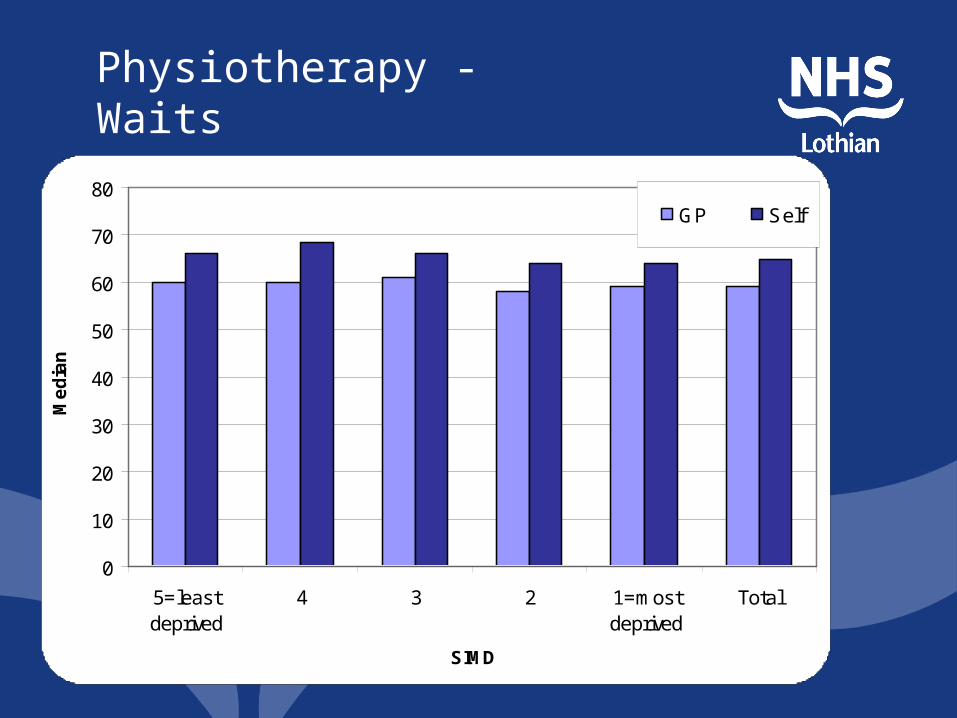
Physiotherapy - Waits
0
10
20
30
40
50
60
70
80
5=leastdeprived
4 3 2 1=mostdeprived
Total
SIMD
Me
dia
n
GP Self
Physiotherapy - Waits

Physiotherapy Assessment – Self referral
0
10
20
30
40
50
60
70
80
90
100
5 = leastdeprived(n=739)
4 (n=1328) 3 (n=1395) 2 (n=1225) 1 = mostdeprived(n=1593)
Total(n=6280)
SIMD
%
Joint Pain Upper/Low er Limb Low Back Pain Neck PainOther Soft Tissue Upper/Low er Limb Trauma BonyUrology
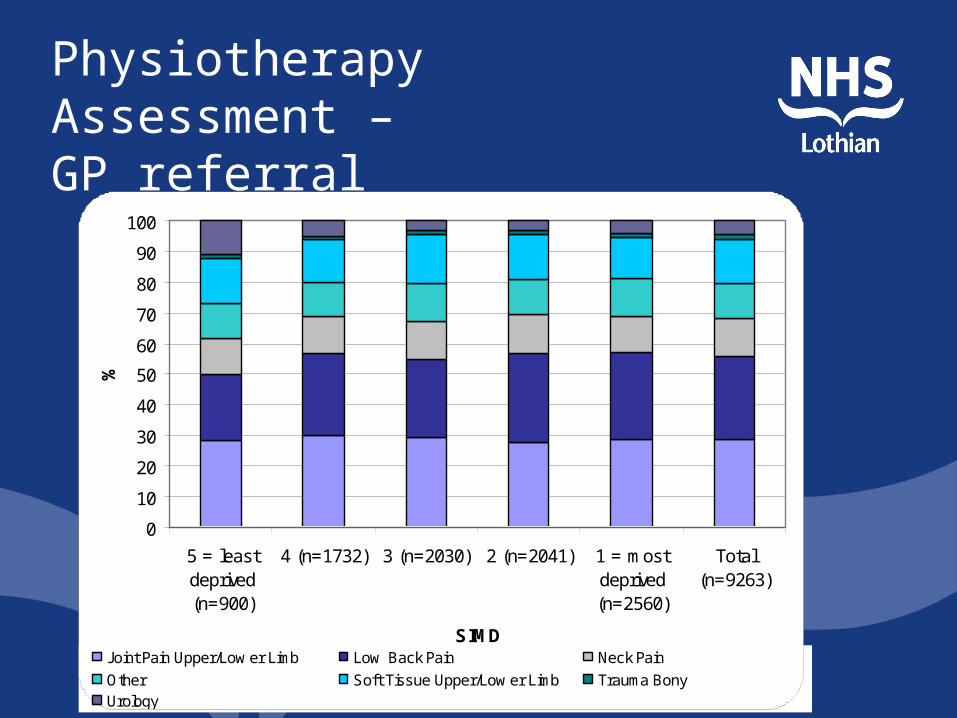
Physiotherapy Assessment – GP referral
0
10
20
30
40
50
60
70
80
90
100
5 = leastdeprived(n=900)
4 (n=1732) 3 (n=2030) 2 (n=2041) 1 = mostdeprived(n=2560)
Total(n=9263)
SIMD
%
Joint Pain Upper/Low er Limb Low Back Pain Neck Pain
Other Soft Tissue Upper/Low er Limb Trauma BonyUrology

Not Completing Treatment
0
10
20
30
40
50
60
5 = leastdeprived
4 3 2 1 = mostdeprived
Total
SIMD
%
GP Self
Findings
• What do the data tell us?• What questions are not
answered?• What would you like to do next?• What recommendations would
you make?
Example 2Head and neck cancer• Context – Cancer Patient Experience
Service Improvement Programme
• Aim: to explore differences in access and outcome by deprivation, age and gender

Data Source and Issues
• SCAN database• Timing • Data• Completeness• Analyses
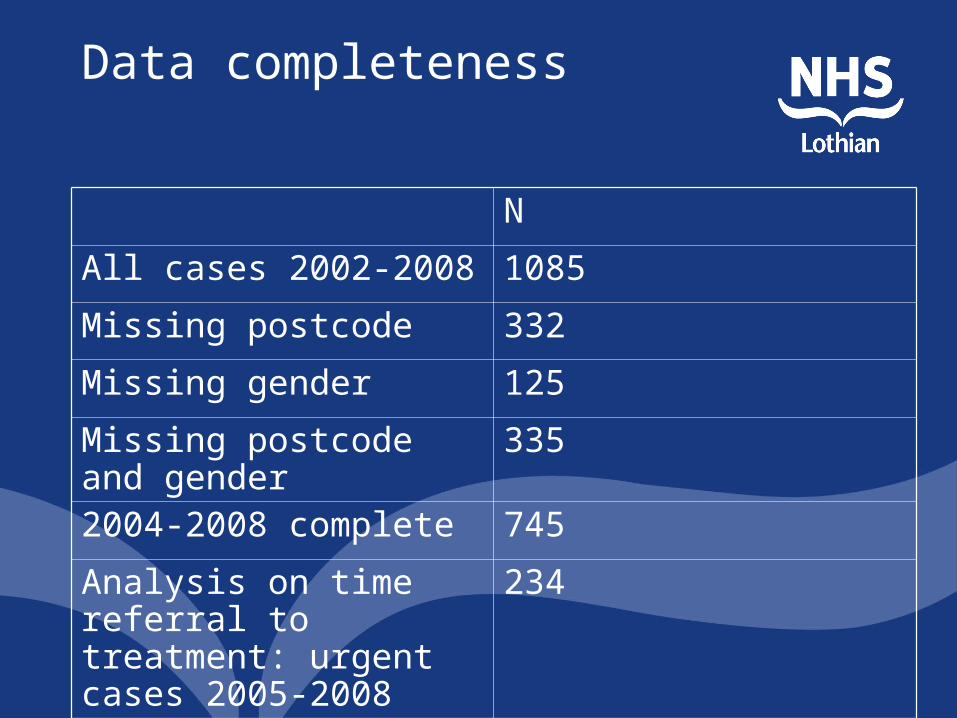
Data completeness
N
All cases 2002-2008 1085Missing postcode 332Missing gender 125Missing postcode and gender
335
2004-2008 complete 745Analysis on time referral to treatment: urgent cases 2005-2008
234
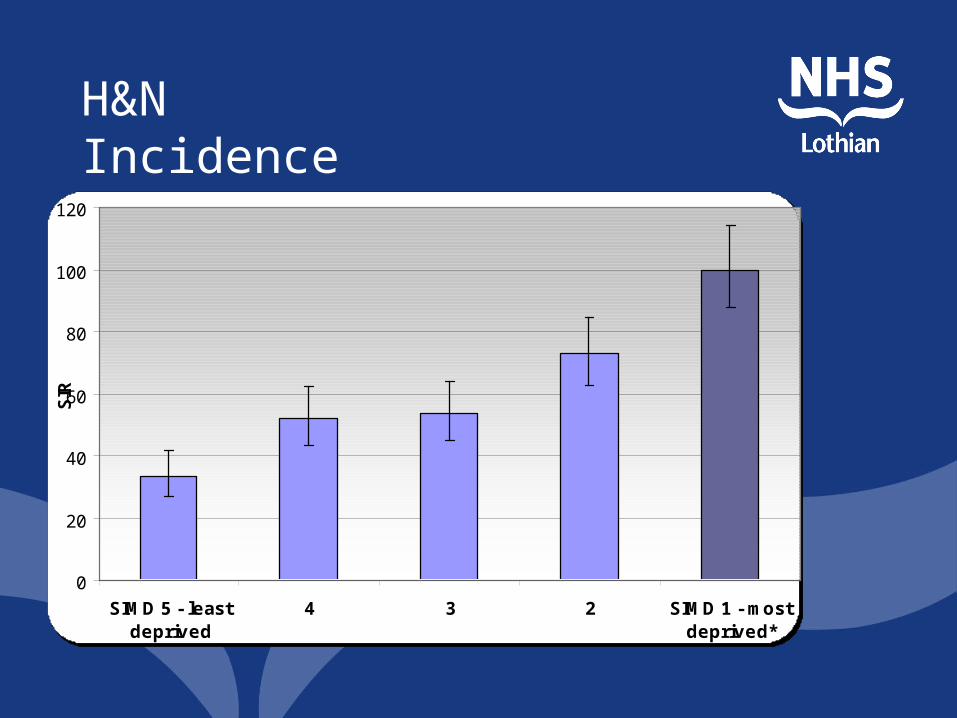
H&N Incidence
0
20
40
60
80
100
120
SIMD 5 - leastdeprived
4 3 2 SIMD 1 - mostdeprived*
SIR

H&N Deaths
0
5
10
15
20
25
30
35
40
5= Leastdeprived
4 3 2 1=mostdeprived
Total
Cancer
Other

Interventions
0
10
20
30
40
50
60
70
80
5 = leastdeprived(n=45)
4 (n=47) 3 (n=69) 2 (n=104) 1 = mostdeprived(n=138)
All (n=433)
SIMD 2009
%
Chemotherapy (n=39)
Radiotherapy (n=67)
Surgery (n=206)
Synchronous Chemoradiotherapy (n=55)
other (n=66)
Findings and issues
• What recommendations could you make?
• Communications issues
Criteria for success
• Clear focus and purpose• Engagement and support of service
(including ability and capacity to respond to ongoing queries, willingness to engage with findings)
• Data - availability and quality• Patient pathway with quality indicators• Real issues may be outside NHS
services• More nuanced inequalities may need
qualitative approach
Related Documents


