“Using DuPont analysis to assess the financial performance of the top 3 JSE listed companies in the food industry” AUTHORS Mishelle Doorasamy https://orcid.org/0000-0001-9320-3461 ARTICLE INFO Mishelle Doorasamy (2016). Using DuPont analysis to assess the financial performance of the top 3 JSE listed companies in the food industry. Investment Management and Financial Innovations, 13(2), 29-44. doi:10.21511/imfi.13(2).2016.04 DOI http://dx.doi.org/10.21511/imfi.13(2).2016.04 RELEASED ON Friday, 03 June 2016 JOURNAL "Investment Management and Financial Innovations" FOUNDER LLC “Consulting Publishing Company “Business Perspectives” NUMBER OF REFERENCES 0 NUMBER OF FIGURES 0 NUMBER OF TABLES 0 © The author(s) 2021. This publication is an open access article. businessperspectives.org

Welcome message from author
This document is posted to help you gain knowledge. Please leave a comment to let me know what you think about it! Share it to your friends and learn new things together.
Transcript
“Using DuPont analysis to assess the financial performance of the top 3 JSElisted companies in the food industry”
AUTHORS Mishelle Doorasamy https://orcid.org/0000-0001-9320-3461
ARTICLE INFO
Mishelle Doorasamy (2016). Using DuPont analysis to assess the financial
performance of the top 3 JSE listed companies in the food industry. Investment
Management and Financial Innovations, 13(2), 29-44.
doi:10.21511/imfi.13(2).2016.04
DOI http://dx.doi.org/10.21511/imfi.13(2).2016.04
RELEASED ON Friday, 03 June 2016
JOURNAL "Investment Management and Financial Innovations"
FOUNDER LLC “Consulting Publishing Company “Business Perspectives”
NUMBER OF REFERENCES
0
NUMBER OF FIGURES
0
NUMBER OF TABLES
0
© The author(s) 2021. This publication is an open access article.
businessperspectives.org
Investment Management and Financial Innovations, Volume 13, Issue 2, 2016
29
Mishelle Doorasamy (South Africa)
Using DuPont analysis to assess the financial performance of the top
3 JSE listed companies in the food industry
Abstract
This study attempts to measure the financial performance of the food industry taking the top three JSE listed companies
Pioneer Foods, Tiger Brands and RCI for the period of 2013-2014. In order to achieve the objectives of this research,
ratios such as return on equity (ROE), return on assets (ROA) have been calculated by applying the DuPont analysis.
The DuPont analysis is an important tool to measure the operating performance of a firm (Sheela and Karthikeyan,
2012). The volatility of the stock market makes investment decisions a controversial issue for most investors.
Investments of huge amounts of money need proper analysis in order to make an informed decision. Financial
statements are indicators of the profitability and financial sustainability of the business. Ratios are tools used to
quantify the risk element before making any strategic decisions, more especially, investment decisions. It has been
reported to be one of the most important financial ratios, because it provides investors with a more comprehensive
measure of performance (Demmer, 2015). A detailed financial analysis of all three companies using the DuPont system
shows that investing in Tiger Brands would generate a higher return to shareholders than Pioneer Foods or RCI.
Keywords: profitability, ratios, financial sustainability, financial analysis, investments, DuPont analysis, strategic
decisions.
JEL Classification: C32, G10, G15.
Introduction
In publishing their financial statements, corporate
organizations fully disclose matters concerning their
operations to aid investors in making investment
decisions (Blessing and Onoja, 2015). The goal of
corporate managers is to maximize the value of the
firm, which is determined by the investment and
financing decisions made by the managers of the
firm (McGowan and Stambaugh, 2012).
Ratios are used to establish the relationship between
two variables and how they influence one another,
and ratio analysis offers a means by which the
financial and operational ills of a business enterprise
can be effectively diagnosed (Agala, Jadhav and
Borhade, 2014). Ratios also point out areas for
further investigation. To guide decision making,
managers analyze financial statements together with
the ratios given. Analysis and interpretation of
financial statements is an important tool in assessing
the company’s performance and gives investors an
indication of the level of risk associated with that
particular firm. For an investor, this is important and
relevant information.
Different ratios are used to measure different
aspects of the business in terms of performance,
liquidity, riskiness and profitability. Of these
possible indicators, literature indicates that the most
important measure of profitability and performance
is the one which is calculated using DuPont
analysis. Demmer (2015) notes that changes in
profit margin provide incremental information for
Mishelle Doorasamy, 2016.
Mishelle Doorasamy, Lecturer, Department of Accounting, University
of KwaZulu-Natal, Westville, Durban, South Africa.
predicting changes in future return on assets, and
Soliman (2008) cites DuPont components as
yielding important information about the operating
characteristics of a firm.
1. Literature review
1.1. Development of the DuPont model. The
DuPont model was created in the early 1900s to
assess the profitability of a business (Sheela and
Karthikeyan, 2012). Modified twice after its initial
conception, the original DuPont method of financial
ratio analysis was developed in 1918 by
F. Donaldson Brown, an engineer at DuPont in
charge of understanding the finances of a company
that DuPont was acquiring, who recognized a
mathematical relationship between profitability and
return on equity (ROE) that was determined by
return on assets (ROA).
Since ROA impacts both profitability and
efficiency, operating decisions of a firm in terms of
planning and control will, thus, focus on increasing
ROA, but the first modification of the DuPont
model shifted the focus from ROA to ROE,
incorporating debt or “leverage” as a third area of
attention. This modification made the DuPont model
a powerful tool for strategic decision making within
an organization to increase ROE (Collier, McGowan
and Muhammad, 2006).
The latest modification of the DuPont model
incorporates a combination of five ratios to
determine ROE. With the focus of annual statements
from a managerial perspective being to assess a
firm’s financial performance, the significance of
operating decisions (profitability and efficiency) and
financing decisions (leverage) upon ROE continues
to be important, and recent evidence has shown that

Investment Management and Financial Innovations, Volume 13, Issue 2, 2016
30
this modified DuPont approach can be used to identify
the causes of financial problems within manufacturing
companies (Liesz and Maranville, 2008).
According to Rogova (2014), DuPont analysis
effectively revealed factors of efficiency which had,
in turn, impacted on the investment appeal of
Russian oil-extracting companies. It was found that
a strong advantage of ROE was the possibility of its
disaggregation into different profitability ratios,
with ROE indicating profitability and efficiency
from the shareholders’ point of view.
1.1.1. The DuPont analysis system. The DuPont
system of financial analysis is based on return on
equity, with the components of this ratio being the
net profit margin, the total asset turnover and the
equity multiplier (McGowan and Stambaugh, 2012).
DuPont analysis is a preferred method to estimate
the market value of a firm, indicating the leverage of
a company to improve future profitability through
more efficient utilization of its assets which will, in
turn, improve the return to shareholders – higher
leverage being preferable for potential investors.
Demmer (2015) reports documentation in prior
literature on the usefulness of DuPont
disaggregation for predicting a firm’s future
profitability, operating income, and stock market
returns and concludes that changes in profit margin
provide important and relevant information on
future return on assets. His findings also imply that
DuPont components are partially influenced by the
quality of the firms’ expected earnings. He points to
recent financial statement analysis (FSA) research
which has shown the usefulness of change in profit
margin for predicting year-ahead changes in RNOA
(Demmer, 2015).
1.1.2. Earnings quantity and the influence on profitability forecasts. According to Dechow et al.
(2010), the quality of earnings is recognized as
higher when they provide more information about
the features of a firm’s financial performance for
decision making, which, in turn, depends on the
specific situation. It has also been stated in prior
literature that the accounting system influences both
future profitability and market reactions of a firm
(Demmer, 2015).
Investment decisions affect the operating leverage
of a firm, and financing decisions impact the degree
of financial leverage of a firm. These, in turn,
determine the future cash flows of the firm (Collier,
McGowan and Muhammed, 2006). According to
Soliman (2008), a change in asset turnover is
positively related to future changes in earnings, and
he goes on to discuss the extent to which
competitive forces differently affect the profitability
of a firm, noting that large profit margins draw new
entrants into the market place or result in existing
rivals imitating the new ideas. However, he found
that competition may be less threatening to an
efficient deployment of assets. If production
processes are efficient, it makes it difficult to imitate
another firms ideas due to the large cost factors
involved. Soliman’s findings contribute to literature
on the sell-side analyst use of accounting
information. He argues that if DuPont components
map into equity value, analysts could use this
information when creating forecasts and reviewing
prior literature about the future profitability of the
firm (Soliman, 2008).
Blessing and Onoja (2015) agree that profitability,
assets, liabilities and equities are significant ways of
evaluating performance reports of companies and
for making investment decisions. They note a
general belief that published financial statements
have failed in their responsibility to provide credible
information for investors and other users of
financial statements.
1.2. Research objective. The main objective of this
study is to ascertain the role of financial statements
on investment decision making.
2. Research methodology
To test the research hypothesis, this study used
secondary data from financial statements for 2013
and 2014 of the top three JSE listed food
manufacturing companies, centred on Pioneer
Foods, with its two main competitors, Tiger Brands
and RCL Foods, used as comparatives. The model
used for this research is good for investment
decision making by potential investors and for
policy-making purposes by banks and other
corporate organizations.
3. Financial analysis of the three companies
3.1. Cash flow analysis. While the statement of
profit or loss and other comprehensive income
relays important information about the inflows and
outflows of money in the business (using accrual
accounting), the cash flow statement (using cash
basis accounting) gives the true representation of the
actual cash movement of the business for the
financial year (McClure, 2015).
3.2. Interpreting cash flow.
Table 1. Operation cash flow/turnover
Company Working 2014 Working 2013
PioneerFoods
2154 / 17698.6 12.17% 1429 / 16240.9 8.79%
Tiger Brands competitor
4193.2 / 30126.0 13.92% 3974.1 / 27064.7 14.68%
RCL Foods competitor
1174 / 19719 5.95% 669 / 10108 6.62%
Investment Management and Financial Innovations, Volume 13, Issue 2, 2016
31
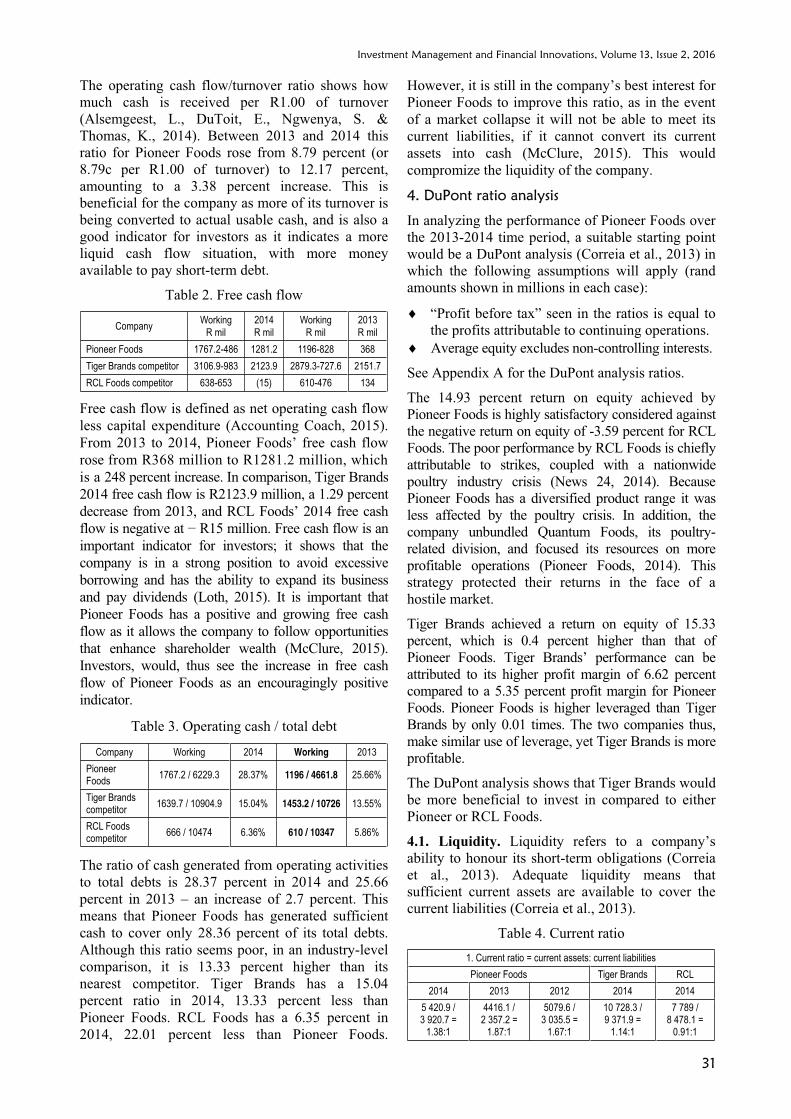
The operating cash flow/turnover ratio shows how
much cash is received per R1.00 of turnover
(Alsemgeest, L., DuToit, E., Ngwenya, S. &
Thomas, K., 2014). Between 2013 and 2014 this
ratio for Pioneer Foods rose from 8.79 percent (or
8.79c per R1.00 of turnover) to 12.17 percent,
amounting to a 3.38 percent increase. This is
beneficial for the company as more of its turnover is
being converted to actual usable cash, and is also a
good indicator for investors as it indicates a more
liquid cash flow situation, with more money
available to pay short-term debt.
Table 2. Free cash flow
Company Working
R mil
2014
R mil
Working
R mil
2013
R mil
Pioneer Foods 1767.2-486 1281.2 1196-828 368
Tiger Brands competitor 3106.9-983 2123.9 2879.3-727.6 2151.7
RCL Foods competitor 638-653 (15) 610-476 134
Free cash flow is defined as net operating cash flow
less capital expenditure (Accounting Coach, 2015).
From 2013 to 2014, Pioneer Foods’ free cash flow
rose from R368 million to R1281.2 million, which
is a 248 percent increase. In comparison, Tiger Brands
2014 free cash flow is R2123.9 million, a 1.29 percent
decrease from 2013, and RCL Foods’ 2014 free cash
flow is negative at R15 million. Free cash flow is an
important indicator for investors; it shows that the
company is in a strong position to avoid excessive
borrowing and has the ability to expand its business
and pay dividends (Loth, 2015). It is important that
Pioneer Foods has a positive and growing free cash
flow as it allows the company to follow opportunities
that enhance shareholder wealth (McClure, 2015).
Investors, would, thus see the increase in free cash
flow of Pioneer Foods as an encouragingly positive
indicator.
Table 3. Operating cash / total debt
Company Working 2014 Working 2013
PioneerFoods
1767.2 / 6229.3 28.37% 1196 / 4661.8 25.66%
Tiger Brands competitor
1639.7 / 10904.9 15.04% 1453.2 / 10726 13.55%
RCL Foods competitor
666 / 10474 6.36% 610 / 10347 5.86%
The ratio of cash generated from operating activities
to total debts is 28.37 percent in 2014 and 25.66
percent in 2013 – an increase of 2.7 percent. This
means that Pioneer Foods has generated sufficient
cash to cover only 28.36 percent of its total debts.
Although this ratio seems poor, in an industry-level
comparison, it is 13.33 percent higher than its
nearest competitor. Tiger Brands has a 15.04
percent ratio in 2014, 13.33 percent less than
Pioneer Foods. RCL Foods has a 6.35 percent in
2014, 22.01 percent less than Pioneer Foods.
However, it is still in the company’s best interest for
Pioneer Foods to improve this ratio, as in the event
of a market collapse it will not be able to meet its
current liabilities, if it cannot convert its current
assets into cash (McClure, 2015). This would
compromize the liquidity of the company.
4. DuPont ratio analysis
In analyzing the performance of Pioneer Foods over
the 2013-2014 time period, a suitable starting point
would be a DuPont analysis (Correia et al., 2013) in
which the following assumptions will apply (rand
amounts shown in millions in each case):
“Profit before tax” seen in the ratios is equal to
the profits attributable to continuing operations.
Average equity excludes non-controlling interests.
See Appendix A for the DuPont analysis ratios.
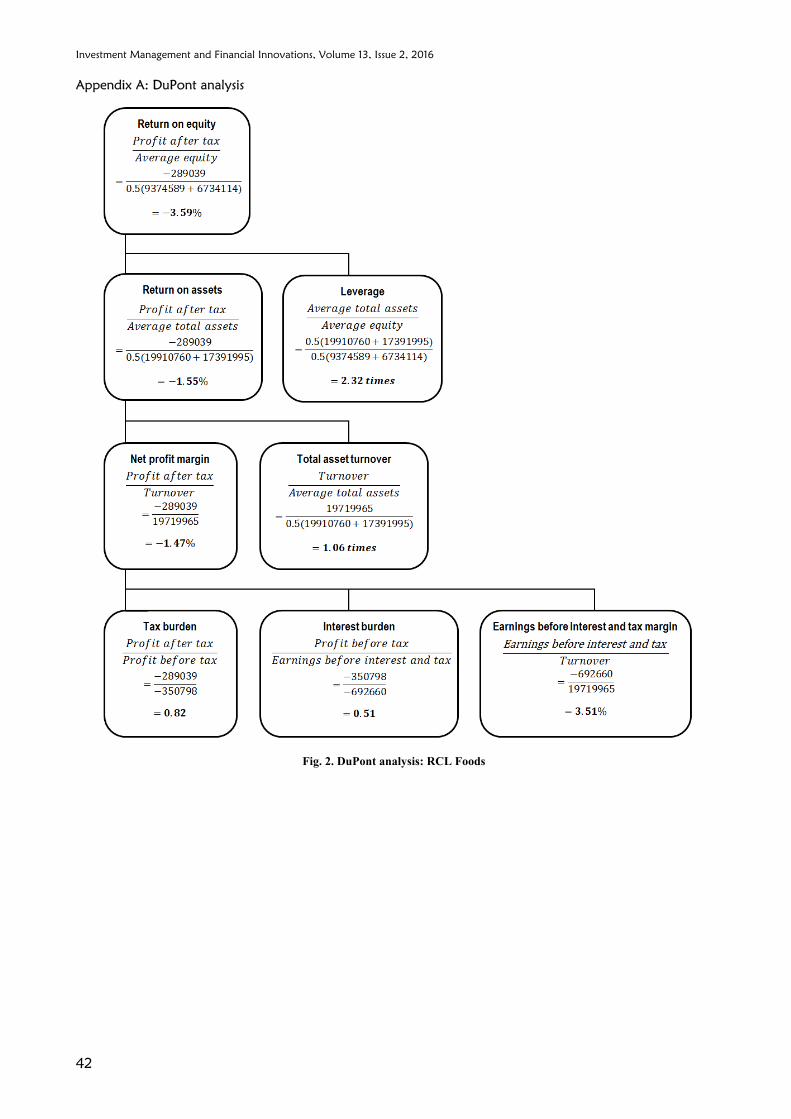
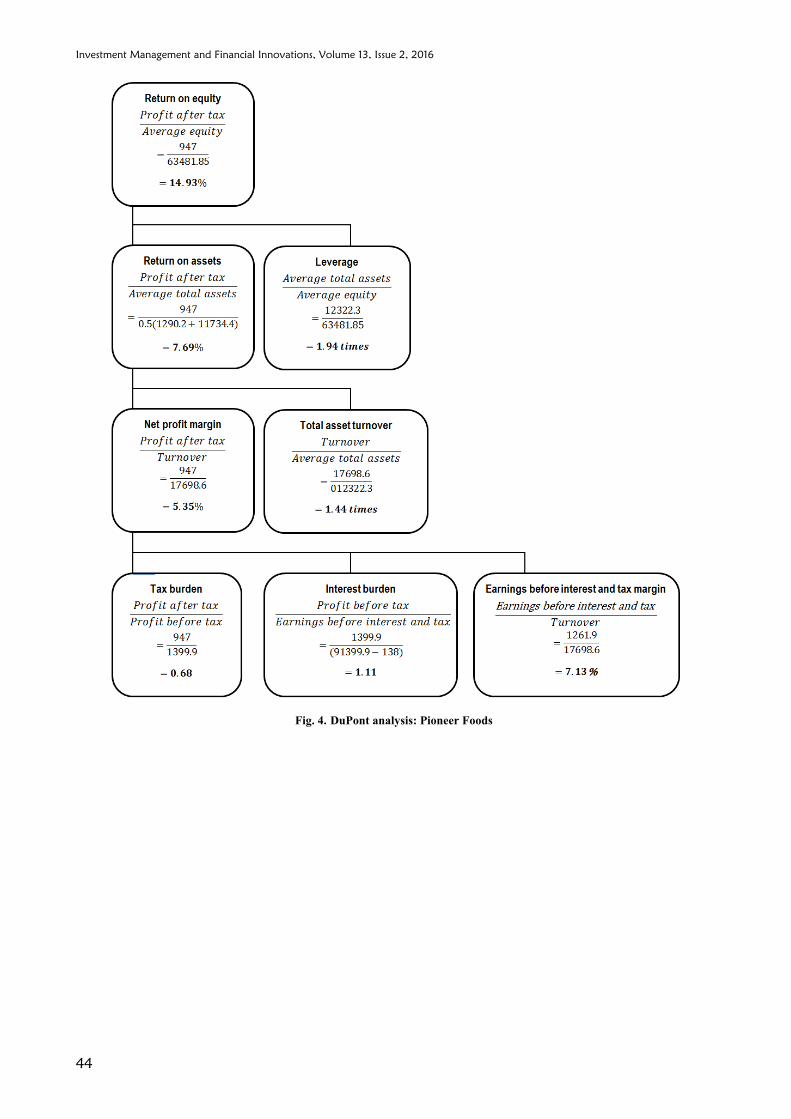
The 14.93 percent return on equity achieved by
Pioneer Foods is highly satisfactory considered against
the negative return on equity of -3.59 percent for RCL
Foods. The poor performance by RCL Foods is chiefly
attributable to strikes, coupled with a nationwide
poultry industry crisis (News 24, 2014). Because
Pioneer Foods has a diversified product range it was
less affected by the poultry crisis. In addition, the
company unbundled Quantum Foods, its poultry-
related division, and focused its resources on more
profitable operations (Pioneer Foods, 2014). This
strategy protected their returns in the face of a
hostile market.
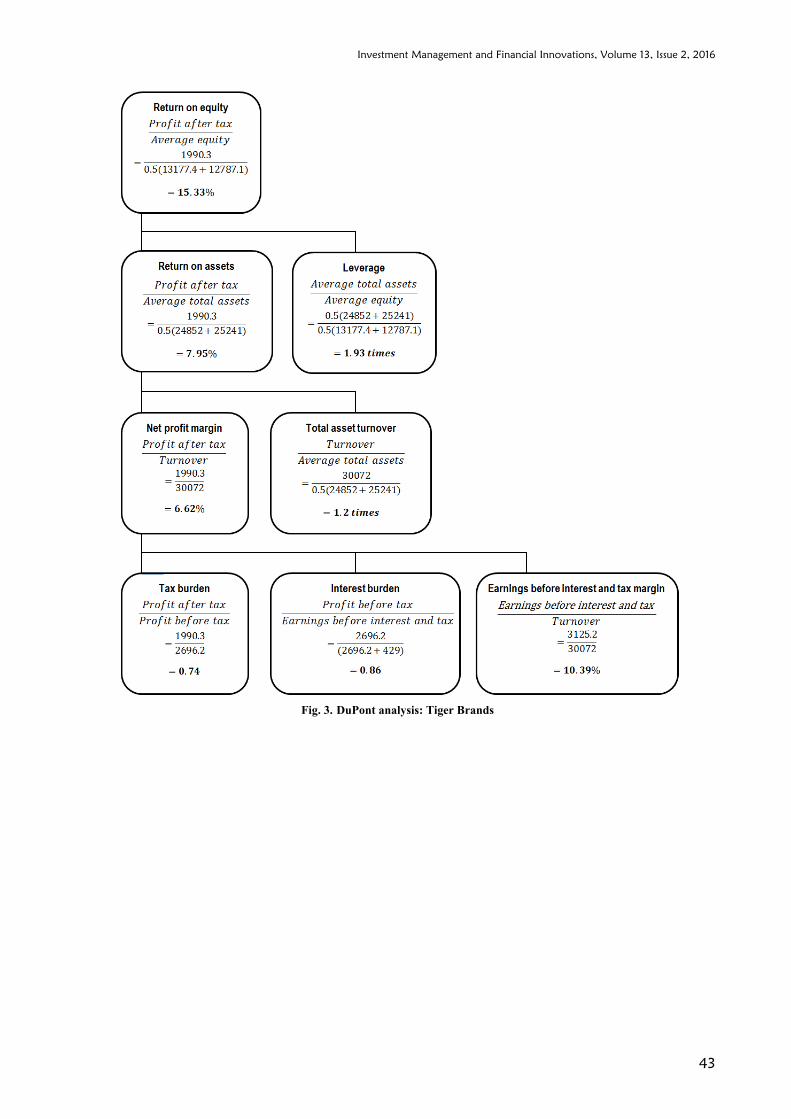
Tiger Brands achieved a return on equity of 15.33
percent, which is 0.4 percent higher than that of
Pioneer Foods. Tiger Brands’ performance can be
attributed to its higher profit margin of 6.62 percent
compared to a 5.35 percent profit margin for Pioneer
Foods. Pioneer Foods is higher leveraged than Tiger
Brands by only 0.01 times. The two companies thus,
make similar use of leverage, yet Tiger Brands is more
profitable.
The DuPont analysis shows that Tiger Brands would
be more beneficial to invest in compared to either
Pioneer or RCL Foods.
4.1. Liquidity. Liquidity refers to a company’s
ability to honour its short-term obligations (Correia
et al., 2013). Adequate liquidity means that
sufficient current assets are available to cover the
current liabilities (Correia et al., 2013).
Table 4. Current ratio
1. Current ratio = current assets: current liabilities
Pioneer Foods Tiger Brands RCL
2014 2013 2012 2014 2014
5 420.9 /3 920.7 =
1.38:1
4416.1 /2 357.2 =
1.87:1
5079.6 / 3 035.5 =
1.67:1
10 728.3 / 9 371.9 =
1.14:1
7 789 /8 478.1 =
0.91:1
Investment Management and Financial Innovations, Volume 13, Issue 2, 2016
32
Table 4 (cont.). Current ratio
2. Quick ratio = current assetsinventory: current liabilities
Pioneer foods Tiger brands RCL
2014 2013 2012 2014 2014
2 997.6 / 3 920.7 =
0.76:1
2 014.9 / 2 357.2 =
0.85:1
2629.7 /3 035.5 =
0.87:1
6 027.7 / 9 371.9 =
0.64:1
5 631.7 /8 478.1 =
0.12:1
3. Cash ratio = cash: current liabilities
1 107.6 / 3 920.7 =
0.28:1
379 / 2 357.2 =
0.16:1
375.6 /3035.5 =
0.12:1
1 160.3 / 9 371.9 =
0.12:1
1 047.7 /8 478.1 =
0.12:1
Pioneer Foods’ current ratio for year 2014 is 1.38:1,
which is a 26.2 percent decrease from 2013 (1.87:1).
This still indicates a liquid situation for Pioneer
Foods, however, as the company can pay off
short-term debts with their current assets. Its
current ratio for 2014 is 1.38:1, which is 0.24:1
greater than Tiger Brands (1.14:1) and 0.47:1
greater than RCL Foods (0.91:1). This indicates
that Pioneer Foods is more liquid than the industry
in relation to current ratio.
Although the quick ratio for Pioneer Foods has
decreased from 0.85:1 (2013) to 0.76:1 (2014), the
2014 quick ratios for Tiger Brands and RCL Foods
are 0.64:1 and 0.66:1, respectively, indicating that
Pioneer Foods is above the industry norm, and, thus,
more liquid in terms of the quick ratio. However,
the decrease in the quick ratio is still
disadvantageous to Pioneer Foods, firstly, because
it shows a declining liquidity position, and,
secondly, because it may indicate that the
company is holding too much inventory, since the
decrease between current ratio and quick ratio is
the greatest for Pioneer Foods (44.92 percent).
Holding too much inventory implies that Pioneer
Foods may be tying up too much money in
inventory that it could, instead, be investing to
receiving an investment return. Holding too much
stock could also mean higher risk of obsolete stock
(Correia et al., 2013).
The cash ratio shows how much cash the company
has available to cover its current liabilities (Correia
et al., 2013). Pioneer Foods’ cash ratio has risen
from 0.16:1 (2013) to 0.28:1 (2014). This is
positive as it means money is available to pay off
short-term debts. In comparison with industry
competitors, Pioneer Foods has a much higher cash
ratio than both Tiger Brands (0.12:1) and RCL
Foods (0.12:1).
Pioneer Foods has shown to be slightly less liquid
than in prior years, but still more liquid than Tiger
Brands and RCL Foods.
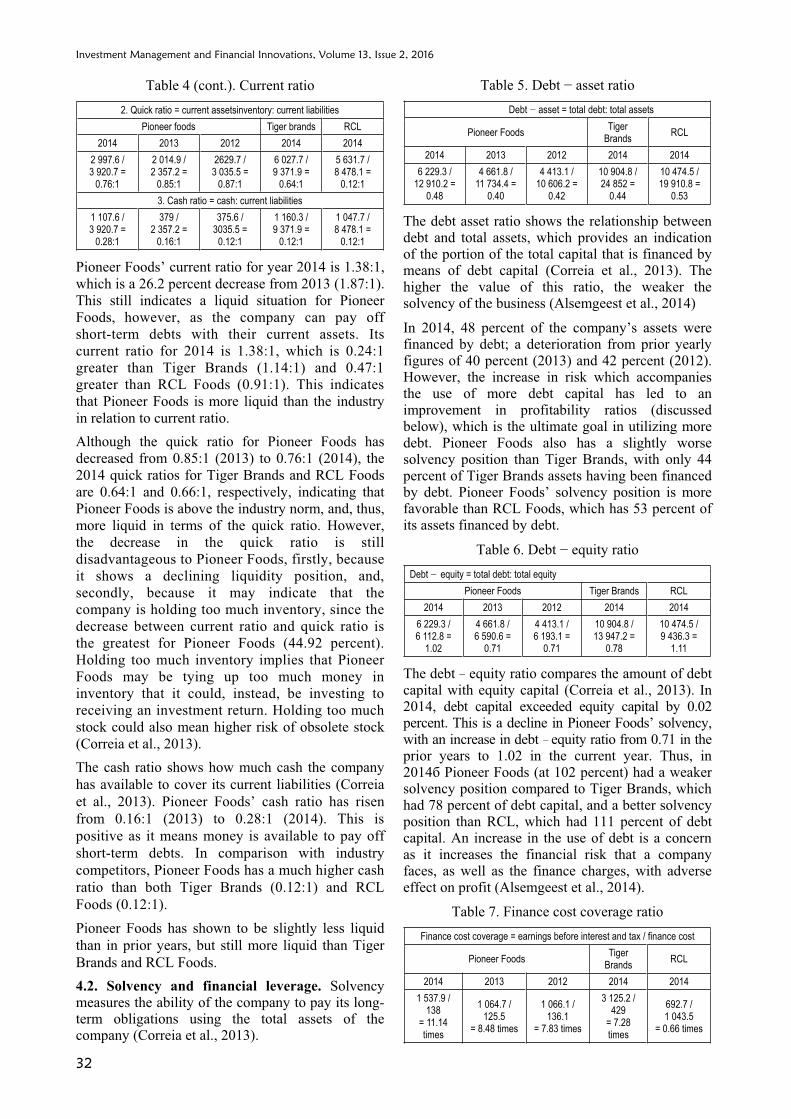
4.2. Solvency and financial leverage. Solvency measures the ability of the company to pay its long-term obligations using the total assets of the company (Correia et al., 2013).
Table 5. Debt asset ratio
Debt asset = total debt: total assets
Pioneer Foods Tiger
Brands RCL
2014 2013 2012 2014 2014
6 229.3 /12 910.2 =
0.48
4 661.8 /11 734.4 =
0.40
4 413.1 / 10 606.2 =
0.42
10 904.8 / 24 852 =
0.44
10 474.5 /19 910.8 =
0.53
The debt asset ratio shows the relationship between debt and total assets, which provides an indication of the portion of the total capital that is financed by means of debt capital (Correia et al., 2013). The higher the value of this ratio, the weaker the solvency of the business (Alsemgeest et al., 2014)
In 2014, 48 percent of the company’s assets were financed by debt; a deterioration from prior yearly figures of 40 percent (2013) and 42 percent (2012). However, the increase in risk which accompanies the use of more debt capital has led to an improvement in profitability ratios (discussed below), which is the ultimate goal in utilizing more debt. Pioneer Foods also has a slightly worse solvency position than Tiger Brands, with only 44 percent of Tiger Brands assets having been financed by debt. Pioneer Foods’ solvency position is more favorable than RCL Foods, which has 53 percent of its assets financed by debt.
Table 6. Debt equity ratio
Debt equity = total debt: total equity
Pioneer Foods Tiger Brands RCL
2014 2013 2012 2014 2014
6 229.3 /6 112.8 =
1.02
4 661.8 /6 590.6 =
0.71
4 413.1 / 6 193.1 =
0.71
10 904.8 / 13 947.2 =
0.78
10 474.5 /9 436.3 =
1.11
The debt equity ratio compares the amount of debt capital with equity capital (Correia et al., 2013). In 2014, debt capital exceeded equity capital by 0.02 percent. This is a decline in Pioneer Foods’ solvency, with an increase in debt equity ratio from 0.71 in the prior years to 1.02 in the current year. Thus, in 2014 Pioneer Foods (at 102 percent) had a weaker solvency position compared to Tiger Brands, which had 78 percent of debt capital, and a better solvency position than RCL, which had 111 percent of debt capital. An increase in the use of debt is a concern as it increases the financial risk that a company faces, as well as the finance charges, with adverse effect on profit (Alsemgeest et al., 2014).
Table 7. Finance cost coverage ratio
Finance cost coverage = earnings before interest and tax / finance cost
Pioneer Foods Tiger
Brands RCL
2014 2013 2012 2014 2014
1 537.9 /138
= 11.14 times
1 064.7 / 125.5
= 8.48 times
1 066.1 / 136.1
= 7.83 times
3 125.2 / 429
= 7.28 times
692.7 / 1 043.5
= 0.66 times
Investment Management and Financial Innovations, Volume 13, Issue 2, 2016
33
The finance cost coverage ratio indicates whether
there are sufficient profits available to pay the
finance cost charge (Correia et al., 2013). In 2014,
the finance cost coverage ratio is sufficient, as an
amount of R11.14 is available to cover each R1.00
of finance cost that needs to be paid. This is an
improvement from 2013 (where the corresponding
cost coverage ratio was 8.48 times) and 2012 (where
it was 7.83 times). This ratio suggests that Pioneer
Foods has a better solvency position than Tiger
Brands and RCL, for which cost coverage
availability was only 7.28 times and 0.66,
respectively.
Table 8. Financial leverage ratio
Finance leverage = average total assets / average total equity
Pioneer Foods Tiger Brands RCL
2014 2013 2012 2014 2014
12 322.3 / 6 341.85 =
1.94
11 238.5 / 6 389.8 =
1.76
10 234.6 / 5 844.4 =
1.75
25 046.5 / 12 982.25 =
1.93
18 651.4 / 8 240.9 =
2.32
As discussed in the DuPont analysis (Appendix 1),
the financial leverage ratio compares the average
amount of total assets with the average amount of
equity capital included in the company’s capital
structure (Alsemgeest et al., 2014). Pioneer Foods’
financial leverage in 2014 was 1.94, an increase
from 1.76 in 2013, which indicates an increase in
portion of debt capital utilized by the company.
Pioneer Foods has a slightly worse leveraged
position than Tiger Brands (1.93) but a better
solvency position than RCL (2.32) profitability.
Profitability refers to the efficiency with which a
company utilizes its capital to generate turnover
(Alsemgeest et al., 2014).
Table 9. Gross profit margin
Gross profit margin on sales = gross profit / sales
Pioneer Foods Tiger Brands RCL
2014 2013 2012 2014 2014
5 377.4 / 17 698.6 =
30.38%
4 713.4 / 16 240.9 =
29.02%
4 677.0 /15 534.5 =30.11
9 531.8 / 30 072 = 31.70%
4 811.3 /19 720 = 24.40%
The gross profit margin is an indication of the
portion of the company’s turnover that is realized as
gross profit after the cost of sales has been
subtracted (Correia et al., 2013). This ratio
decreased from 2012 (30.11 percent) to 2013 (29.02
percent) and increased from 2013 to 2014 (30.38
percent). This fluctuation is attributable to change in
revenue growth, above the rate of inflation. In 2014,
revenue from continuing operations increased by 9
percent to R17.7 billion, mainly due to increase in
the mix of selling prices, exports and sales (Pioneer
Foods, 2014). Notably, this favorable increase
occurred despite the discontinuation of Quantum
Foods which took place subsequent to the 2014 year
end. Pioneer Foods has a higher gross profit margin
than RCL Foods (24.40 percent) which suggests that
it is more profitable, and, perhaps, has more buying
power that allows it to request cheaper materials
from suppliers.
However, Tiger Brands is slightly more profitable
than Pioneer Foods as it makes a gross profit of
R31.70 for every R100 worth of sales. Tiger
Brands’ performance is expected as it has the
highest revenue, while still apparently able to
control its cost of sales efficiently and consistently.
Table 10. Net profit margin
Net profit margin on sales = net profit / sales
Pioneer Foods Tiger Brands RCL
2014 2013 2012 2014 2014
947 / 17 698.6 =
5.35%
699 / 16 240.9 =
4.30%
610.6 / 15 534.5 =
3.93%
1 990.3 / 30 072 = 6.62%
-289 / 19 720 = -
1.47%
The net profit margin indicates how much revenue
is available after tax is paid (Alsemgeest et al.,
2014). Pioneer Foods’ net profit margin is 5.35
percent in 2014, a 1.05 percent increase from 2013.
This suggests, at a surface level, that management
has proportionately decreased expenses relative to
the increase in net profit, indicating reduced
inefficiencies. This improvement is also attributable
to the increase in net profit that the company has
been experiencing from the year 2012 to the current
year. The improvement in the net profits of the
company in 2014 may be attributable to profit made
from the discontinued operation (Quantum Foods)
of R18.2 million, compared to the loss of R200.4
million made in 2013 financial year. Notably,
profitability was reduced because of a R36.3
increase from 2013 in the impairment of the
company’s investment in the Pepsi business.
Pioneer Foods has a lower net profit margin than
Tiger Brands (6.62 percent), but a higher net profit
margin than RCL Foods (-1.47 percent). This is
expected, as Tiger Brands has been generating
higher revenues in the current year. Compared to
Pioneer Foods, RCL Foods has been experiencing
losses. The loss suffered by RCL Foods in 2014 is
mainly caused by a R889 783 increase in finance
costs from 2013 (the company has compulsory
redeemable preference shares which means they
recognize dividends as a finance cost).
Table 11. Return on ordinary shareholders’ equity
Return on ordinary shareholder’s equity = profit after tax- non-controlling interest-preference dividends / average ordinary shareholders equity
Pioneer Foods Tiger Brands RCL
2014 2013 2012 2014 2014
947 / 6 341.9 = 14.93%
699 / 6 383.1 = 10.95%
610.6 / 5 836.6 = 10.46%
1 990.3 / 12 982.3 =
15.33%
-289.0 / 8 054.4 =
-3.59
Investment Management and Financial Innovations, Volume 13, Issue 2, 2016
34
The return on ordinary shareholders equity measures
how much the ordinary shareholders earned for their
investment in the company (Alsemgeest et al.,
2014). Pioneer Foods’ return on ordinary
shareholders equity for 2014 is 14.93 percent, which
is 3.98 percent more than 2013 (10.95 percent). This
improvement was mainly caused by a substantial
increase in profits, further assisted by a decrease in
equity. This higher ratio indicates that management
is more efficient in utilizing its equity base,
ultimately leading to better return for investors.
Tiger Brands has a higher return on shareholders’
equity than Pioneer Foods, as for every R100
investment in Tiger Brands, ordinary shareholders
receive a return of R15.33 as compared to a return
of R14.93 from Pioneer Foods. However, the
Pioneer Foods’ return is greater than the RCL
Foods’ negative return of -3.59 percent.
4.3. Asset management. Asset management ratios
are designed to determine how effectively the assets of
the company are being utilized (Correia et al., 2013).
Inventory turnover days.
Inventory turnover days are calculated according to
the formula:
Inventory turnover days = average inventory / cost
of sales × 365.
Indicate that the average number of days that
inventory is on hand before being sold (Alsemgeest
et al., 2014). There has been a favourable 5.34 day
decrease in the Pioneer Foods inventory turnover
days, from 76.8 days in 2013 to 71.46 days in 2014.
This is due to the consumption of their goods
increasing over the year, evidenced in their
increased market share in core categories (Pioneer
Foods, 2014). Additionally, the ratio is 11.65 days
lower than that of Tiger Brands (83.11 days), which
is a positive indication that Pioneer Foods is running
through its stock at a faster rate than its main
competitor. The company, is thus, at decreased risk
of product spoilage in relation both to prior years
and to Tiger Brands. RCL Foods (at 40.88 days), on
the other hand, has an inventory turnover ratio that
is 30.58 days lower than that of Pioneer Foods, but
not too much should be read into this comparison as
RCL Foods mainly deals in poultry which has a
shorter shelf life and, thus, quicke rinventory
turnover than the bulk of Pioneer Foods products
such as cereals. The figure do, nonetheless, suggest
that Pioneer Foods may have to take further
initiatives to continue improving the ratio.
4.4. Average collection period. The average
collection period ratio is calculated according to the
formula:
Average collection period = average trade
receivables* / sales × 365,
where * is calculated using net trade receivables
(being trade receivables less impairment provision),
as stated in the Trade and other receivables Note.
Indicate the average number of days, it takes debtors
to pay the company (Alsemgeest et al., 2014).
Pioneer Foods’ average collection period has
decreased by 5.21 days from 37.57 days (2013) to
32.36 days (2014). Thus, debtors are paying Pioneer
Foods more quickly than in the previous year,
placing the company at decreased risk of bad debts
and poor cash flow. Additionally, Pioneer Foods has
indicated that the credit quality of its customer base
is considered to be good based on historical default
rates (Pioneer Foods, 2014).
In relation to their competitors, Pioneer Foods has a
much lower risk of bad debts, as Tiger Brands
(42.17 days) and RCL Foods (40.79 days) debtors,
respectively, take 9.81 and 8.43 days longer to
pay. Further discussion on the implications of this
ratio is continued below in relation to the working
capital ratio.
Table 12. Fixed asset turnover ratio
Fixed asset turnover ratio = sales / average non-current assets
Pioneer Foods Tiger Brands RCL
2014 2013 2012 2014 2014
17 698.6 /5 393.7 = 3.28 times
16 240.9 /5 445.8 = 2.98 times
15 534.5 / 5 282.2 = 2.94 times
30 126 / 14 939.6 = 2.02 times
19 720 /10 859.5 = 1.82 times
The fixed asset turnover ratio measures the
utilization of all the company’s operating assets in
relation to sales revenue (Correia et al., 2013). This
ratio is of particular interest as Pioneer Foods falls
within the manufacturing industry. The ratio has
shown a favorable increase from 2013 (2.98 times)
to 2014 (3.28 times). This means that the company
has over the years used its assets to generate higher
returns. This ratio is 1.26 times and 1.46 times
higher, respectively, than those of Tiger Brands
(2.02 times) and RCL Foods (1.82 times). This
means that Pioneer Foods utilizes its fixed assets
more efficiently than its competitors.
4.5. Trade payable days. Trade payable days are calculated according to the formula:
Trade payable days = average trade payable* / cost of sales × 365,
where * is calculated using trade payable as found
in the Notes to the Financial Statements.
Measure the number of days on average, it takes a
company to pay its creditors (Correia et al., 2013).
Pioneer Foods has taken, on average, 1.15 days
longer to pay their trade creditors in 2014 (49.76
Investment Management and Financial Innovations, Volume 13, Issue 2, 2016
35
days) than in 2013 (48.61 days). The increase in
trade payable days indicates that the company is
taking advantage of the credit that is available to
them, allowing themselves a longer time to recover
the funds to pay creditors (Correia et al., 2013). This
ratio is certainly favorable as it is higher than the
average collection period of debtors calculated
above to be 32.36 days in 2014. This means that
Pioneer Foods is receiving money owed to it before
having to pay their creditors – a favorable cash flow
position.
This has not put the company at an increased risk of
incurring interest on overdue accounts, since perusal
of its financial statements reveals that it has not
incurred any interest on trade payables (Pioneer
Foods, 2014). The Pioneer Foods ratio is 19.66 days
longer than that of Tiger Brands (30.10 days) and
1.84 days longer than that of RCL Foods, thus
giving Pioneer Foods a better cash flow position
than the industry at large, which is a positive
indicator for investors (Correia et al., 2013).
Table 13. Working capital cycle
Working capital cycle = inventory turnover days + average collectionperiod – Trade payables days
Pioneer Foods Tiger Brands RCL
71.46 + 32.36 – 49.76 = 54.06 days
83.11 + 42.17 – 30.10 = 95.18 days
40.88 + 40.79 – 47.92= 33.75 days
The longer the working capital cycle of an entity,
the longer the working capital of the business is tied
up in the cycle without earning a return on it
(Correia et al., 2013). For the year 2014, Pioneer
Foods (54.06 days) has a working capital cycle that
is 41.12 days shorter than that of Tiger Brands
(95.18 days), but 20.31 days longer than that of
RCL (33.75 days).
In this respect, Pioneer is earning returns on its
working capital at a much faster rate than Tiger
Brands, but at a slighter slower rate than RCL
Foods. The company may improve its cycle by
encouraging debtors to pay it sooner or by
researching alternate ways in which it may improve
inventory turnover. However, as discussed above,
the comparison between Tiger Brands and Pioneer
Foods has greater significance as these two
companies produce similar goods, whereas the
major focus of RCL Foods is on poultry. Analysis of
the asset management ratios indicates a favorable
trend in the efficiency of asset utilization by Pioneer
Foods. This is a positive indicator for both existing
and prospective investors, particularly, if the trend
continues.
4.6. Market value. Market value ratios provide an
indication of the market perception of the
company’s past performance and future prospects
(Correia et al., 2013).
Table 14. Dividend yield ratio
Dividend yield ratio = dividend per share* / price per share#
Pioneer Foods Tiger Brands RCL
2014 2013 2012 2014 2014
221c /11 800c =
1.87%
132c /8 750c = 1.51%
114c / 5 300c = 2.15%
940c / 31 543c =
2.98%
20c /1 580c = 1.27%
Notes: * The Pioneer Foods dividend per share for 2014
excludes the dividend in specie declared with the unbundling of
Quantum Foods. # The share price utilized in all market ratio
calculations is the price at year end for all the companies. Year
ends as follows: Pioneer Foods and Tiger Brands year end: 30
September; RCL Foods: 30 June. This affects analysis as
market forces and conditions prevailing on 30 June 2014 differ
from market conditions on 30 September 2014.
Dividend yield shows how much a company pays out in dividends each year relative to its share price (Investopedia, 2015a). The dividend yield for Pioneer Foods decreased by 0.64 percent in 2013 (1.51 percent) from 2012 (2.15 percent), but shows a favorable increase of 0.36 percent in 2014 (1.87 percent). This means that shareholders received a higher return on their investment in the form of dividends in 2014 compared to 2013.
The return received by Pioneer Foods shareholders is 0.6 percent higher than the return for RCL Foods (1.27 percent), but is 1.11 percent lower than the return for Tiger Brands (2.98 percent). This indicates that Tiger Brands is likely to be the most favorably viewed of the three companies by investors as its shareholders receive the highest return on their investment.
Table 15. Earnings yield
Earnings yield = headline earnings per share / price per share
Pioneer Foods Tiger Brands RCL
2014 2013 2012 2014 2014
575.6c / 11 800c =
4.88%
389.8c / 8 750c = 4.45%
337.1c / 5 300c = 6.36%
1 816c / 31 543c =
5.76%
-47.7c / 1 580c =-
3.02%
Earnings yield indicates the yield investors are demanding (Correia et al., 2013). Earnings yield declined by 1.91 percent in 2013 (4.45 percent), from 6.36 percent in 2012. It has favorably increased by 0.43 percent in 2014 (4.88 percent).
The earnings yield achieved by Pioneer Foods for 2014 is 0.88 percent lower than that achieved by Tiger Brands (5.76 percent). In relation to RCL Foods, Pioneer Foods has an earnings yield that is 7.9 percent more favorable.
Table 16. Dividend cover ratio
Dividend cover ratio = headline earnings per share / dividend per share
Pioneer Foods Tiger
BrandsRCL
2014 2013 2012 2014 2014
575.6c / 221c =
2.60 times
389.8c / 132c =
2.95 times
337.1c / 114c =
2.95 times
1 816c / 940c =
1.93 times
-47.7c / 20c = 2.39 times

Investment Management and Financial Innovations, Volume 13, Issue 2, 2016
36
The dividend cover ratio measures the earnings that
are being paid out in the form of dividends (Correia
et al., 2013). In 2012 and 2013, the dividend cover
ratio remained constant for Pioneer Foods at a factor
of 2.95, and, then, declined by 0.35 in 2014 to 2.60.
A larger percentage of earnings is, thus, being
retained by Pioneer Foods for future reinvestments,
which may not discourage investors as their long-
term wealth is being taken into account.
Pioneer Foods also retains more of its earnings, in
comparison with its competitors. Tiger Brands
(1.93) and RCL Foods (-2.39) have ratios that,
respectively, are 0.67 times and 4.99 times lower
than that of Pioneer Foods. This is indicative of the
competitors adopting different strategic approaches
to that of Pioneer.
Table 17. Price: earnings ratio
Price-earnings ratio = price per share / headline earnings per share
Pioneer Foods Tiger Brands RCL
2014 2013 2012 2014 2014
11 800c / 575.6 =
20.51 times
8 750c / 389.8c =
22.45 times
5 300c /337.1c =
15.72 times
31 543c / 1 816c =
17.37 times
1 580c / -47.7c =-
33.1 times
The price-earnings ratio is the inverse of the earnings yield ratio. It is ratio of a company’s current share price compared to its per-share earnings (Investopedia, 2014). Pioneer Foods’ ratio has shown a positive increase by a factor of 6.73 in 2013 (22.45 times) from 2012 (15.72 times). The price-earnings ratio (P/E ratio) declined by a factor of 1.94 in 2014 (20.51 times).
Despite the decrease in the P/E ratio, investors are still willing to pay more per rand of reported profits for Pioneer Foods than for its competitors. Tiger Brands has a ratio (17.37 times) that is lower than that of Pioneer Foods by a factor of 3.14, while the ratio for RCL Foods (-33.1 times) is lower than that of Pioneer Foods by a factor of 53.61. This shows that Pioneer Foods is perceived as having high growth prospects in the future (Investopedia, 2014).
Using the P/E ratio, it should, thus, be noted that investors would pay more money to receive R1.00 of Pioneer Foods earnings than for earnings from either Tiger Brands or RCL Foods.
Table 18. Market to book value ratio
Market to book value ratio = price per share / net asset value per share
Pioneer Foods Tiger Brands RCL
2014 2013 2012 2014 2014
11 800c / 575.6 =
20.51 times
8 750c / 389.8c =
22.45 times
5 300c /337.1c =
15.72 times
31 543c / 1 816c =
17.37 times
1 580c /-47.7c =
33.1 times
Market to book value ratio compares the market
value of the firm’s investment to its costs (Firer,
Ross, Westerfield and Jordan, 2004). The ratio for
Pioneer Foods increased year on year by 0.88 times
in 2013 (2.43 times) and by 1.13 times in 2014 (3.56
times). This indicates that Pioneer Foods has been
increasingly able to create value for its shareholders
(Firer et al., 2004).
Pioneer Foods’ ratio is 2012 times higher than that
of RCL (1.44 times) which indicates that Pioneer
Foods has been more successful in the creation of
shareholder wealth. Tiger Brands, however, has a
ratio 0.28 times higher than that of Pioneer Foods.
This is indicative of shareholder being willing to
pay more for a share in Tiger Brands than for
Pioneer Foods.
4.7. Earnings per share.
Table 19. Earnings per share (in cents)
Pioneer Foods* Tiger Brands RCL Foods
2014 2013 2014 2013 2014 2013
Basic EPS 516.6 385.5 1245.9 1574.9 (45.7) 4.5
Diluted basic EPS 492.9 376.3 1212.5 1535.8 (45.7) (4.4)
Headline EPS 637.4 466.5 1804.4 1574.3 (47.7) 4.8
Diluted headline EPS 608.2 455.2 1760.2 1535.2 (47.7) (4.8)
Notes: * Pioneer Foods’ headline earnings adjusted for the
impact of the share-based payment charge on the B-BBEE
Phase 1 transaction due to volatility and non-repetitive nature of
the Quantum Foods effect on profits (non-recurring item).
Table 20. EPS trends 2013-2014
2013-2014 trends Pioneer Foods Tiger Brands RCL Foods
Basic EPS +34.01% -21.08% -1115.56%
Diluted EPS +30.99% -21.05% -938.64%
Headline EPS +36.63% +14.62% -1093.75%
Diluted headline EPS +33.61% +11.14% -1093.75%
Earnings per share is a significant performance
measure that calculates the amount of profit that is
attributable to each issued ordinary share of the
company (Stainbank, Oakes, Razak, 2014). The
importance of this ratio stems from the fact that
investors are more interested in knowing how
efficiently their individual share in the company has
been utilized in generating profits, rather than merely
having an overview of the total profits achieved by
the entity (Stainbank, Oakes, Razak, 2014).
The 34.01 percent increase in basic earnings per
share experienced by Pioneer Foods over the year
puts it in a favorable position in relation to Tiger
Brands and RCL Foods, whose basic earnings per
share have decreased by 21.08 percent and 1115.56
percent, respectively. Although Tiger Brands and
RCL Foods have experienced an increase in the
number of ordinary shares in issue, earnings have
evidently failed to compensate for that increase.
Diluted earnings per share indicates the lowest
possible earnings per share, assuming that potential
shares currently in existence are converted into

Investment Management and Financial Innovations, Volume 13, Issue 2, 2016
37
ordinary shares (Service, 2014). Diluted earnings
per share for Pioneer Foods increased by 30.99
percent from 2013 to 2014. This increase shows
growth in the company, as there was an increase in
the number of weighted average shares for the year.
Tiger Brands and RCL Foods have experienced
decreases, respectively, of 21.05 percent and 938.64
percent, which is only slightly lower than their
respective basic earnings per share.
It should be borne in mind that the basic earnings
per share calculation may be extremely volatile, as it
includes all items of income and expenses, including
abnormal items that do not regularly occur. This
volatility is compensated for by the calculation of
headline earnings, which more accurately represents
maintainable earnings of the entity (Service, 2014).
Headline earnings per share is a JSE listing
disclosure requirement intended to calculate
earnings, as they relate to core trading activities of
the company (Stainbank et al., 2014). Headline
earnings per share for Pioneer Foods increased by
36.63 percent for the year, compared with decreases
for Tiger Brands and RCL Foods, respectively, of
14.62 percent and 1093.75 percent.
Based on this analysis, it becomes evident that
Pioneer Foods has made an overall improvement in
terms of trading performance and earnings per share
from 2013 to 2014. Although Tiger Brands has
experienced a decrease in basic earnings per share,
there has been an increase in headline earnings,
which is a positive indicator for shareholders. RCL
Foods, on the other hand, has performed
unfavorably for the reporting period, which is
mainly attributable to the fact that they failed to
generate enough returns to compensate for the
substantial increase in the number of ordinary
shares that occurred during the year. This being the
case, they have experienced a substantial decline in
the earnings per share.
The market value ratios give clear evidence that
choice of investment is between Tiger Brands and
Pioneer Foods, as RCL Foods has performed poorly
on the market and rendered negative returns for
shareholders. The performance of Tiger Brands and
Pioneer Foods can be interpreted in different ways.
Some investors may prefer to invest with Tiger
Brands, because they have exhibited a higher
earnings and dividend yield. Pioneer Foods, on the
other hand, has a higher EPS and has shown
evidence of high growth potential, which some
investors may prefer – particularly, if they are
interested in long-term investment and growth.
Lastly, there needs to be consideration for other
qualitative and market related factors that can help
investors to compare and contrast the two
companies other than ratio analysis.
5. Share price analysis
5.1. The industry. The consumer goods industry in
which Pioneer Foods and its competitors are located
is an extremely volatile market characterized by
virtually continuous and inevitable change and
uncertainty. Most consumers, regardless of price
increases, still need to purchase the staple consumer
goods that they require on a daily basis (Alsemgeest
et al., 2014).
One significant measure of a company’s industry
impact is its market cap, which is the total market
value of the company’s outstanding shares in rand
value, calculated by multiplying the total number of
outstanding shares by the current market price of the
share (Investopedia, 2015). Of the three companies
under discussion, Tiger Brands has the largest
market cap (R52 billion), followed by Pioneer
Foods (R42 billion) and RCL Foods (R16 billion).
5.2. Month-to-month share price. Refer below for
the share price graph (Figure 1).
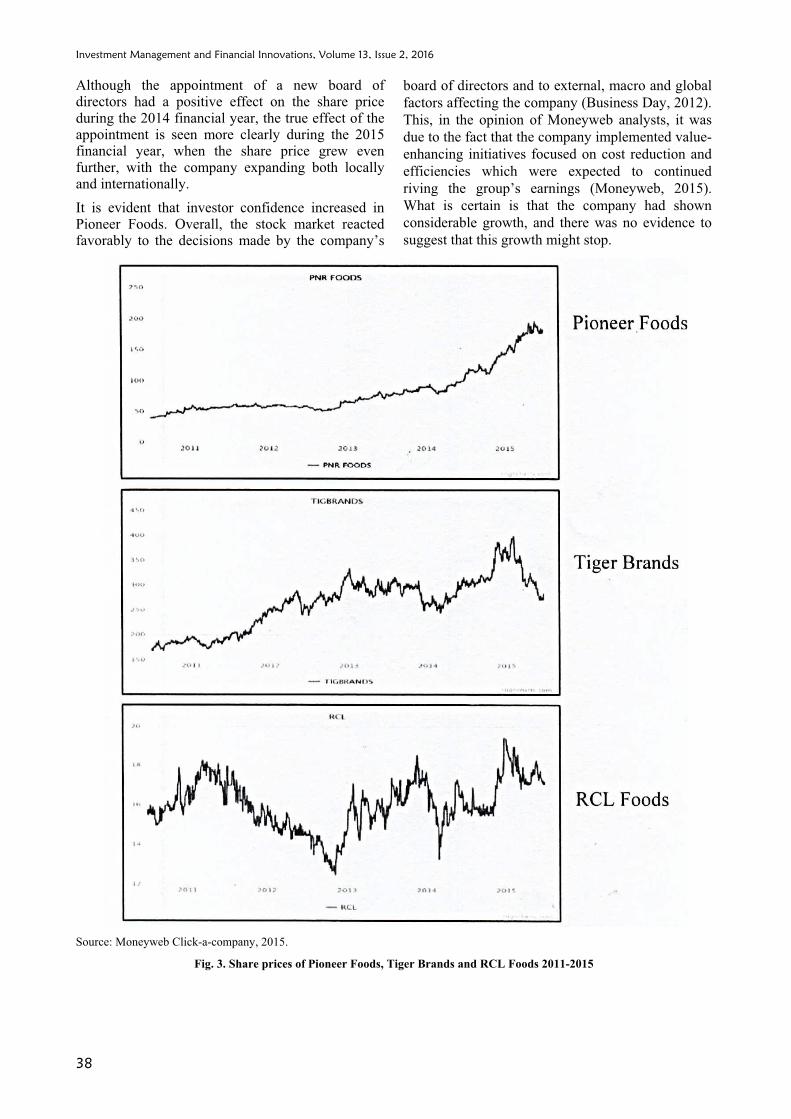
Over the five years leading up to 30 June 2015,
Pioneer Foods has been at frontier of growth in the
industry. In comparison with Tiger Brands and RCL
Foods, Pioneer Foods’ share price grew by 349.6
percent in this time period, while the corresponding
growth for Tiger Brands and RCL Foods was,
respectively, 62.54 percent and 6.75 percent
(Moneyweb, 2015).
In the period 1 January 2015 to 30 June 2015,
Pioneer Foods’ share price showed a positive
appreciation of 28.03 percent, while share prices for
Tiger Brands and RCL Foods declined by 25.14
percent and 11.5 percent, respectively. This is
mainly attributable to the fact that Pioneer Foods
does not deal in poultry. Tiger Brands and RCL, on
the other hand, both have interests in the poultry
industry, which is under severe strain after passing
of the AGOA (African Growth and Opportunity
Act) agreement allowing the United States to export
650 000 tons of chicken into the South African
market and leading investors to be wary of potential
saturation of the chicken market (News 24, 2015).
In a sign of growing investor confidence in the new
board of directors, Pioneer Foods closed the second
quarter (months ending 31 March 2014) favorably
with a share price of R83.50 per share. The share
price rose substantially over the remainder of the
year, reaching a financial year high of R128.07 on 3
September 2014, before closing the year strongly on
R118.00 per share, a 48.89 percent increase in share
price from 24 February 2014.
Investment Management and Financial Innovations, Volume 13, Issue 2, 2016
38
Although the appointment of a new board of directors had a positive effect on the share price during the 2014 financial year, the true effect of the appointment is seen more clearly during the 2015 financial year, when the share price grew even further, with the company expanding both locally and internationally.
It is evident that investor confidence increased in Pioneer Foods. Overall, the stock market reacted favorably to the decisions made by the company’s
board of directors and to external, macro and global
factors affecting the company (Business Day, 2012).
This, in the opinion of Moneyweb analysts, it was
due to the fact that the company implemented value-
enhancing initiatives focused on cost reduction and
efficiencies which were expected to continued
riving the group’s earnings (Moneyweb, 2015).
What is certain is that the company had shown
considerable growth, and there was no evidence to
suggest that this growth might stop.
Source: Moneyweb Click-a-company, 2015.
Fig. 3. Share prices of Pioneer Foods, Tiger Brands and RCL Foods 2011-2015
Investment Management and Financial Innovations, Volume 13, Issue 2, 2016
39
Summary and conclusions
Invest in Pioneer Foods or not?
Deciding whether to invest in Pioneer Foods is not a
simple matter of yes or no. There are pros and cons
which have a greater or lesser effect on investors
according to whether they are risk averse, or risk
seeking. To arrive at an impartial conclusion, both
the positives and the negatives must be considered
in comparison with the company’s main competitor,
Tiger Brands.
The cons:
In the DuPont analysis, Pioneer Foods’ return
on equity is 14.93 percent, 0.4 percent lower
than that of Tiger Brands (15.33 percent). Tiger
Brands’ performance can be attributed to the
higher profit margin of 6.62 percent compared
to Pioneer Foods’ profit margin of 5.35 percent.
Pioneer Foods is leveraged higher than Tiger
Brands by only 0.01 times. This indicates that
they make similar use of leverage, yet Tiger
Brands is more profitable. This DuPont analysis,
thus, shows that Tiger Brands would be more
beneficial to invest in, compared to Pioneer Foods.
Pioneer Foods’ debt-equity ratio is 0.48:1,
whereas the figure for Tiger Brands is 0.44:1.
This will be discouraging to the shareholder, as
it means Pioneer Foods has less in total assets to
pay off its total liabilities.
Tiger Brands has a higher return on
shareholder’s equity than Pioneer Foods, as for
every R1.00 investment in Tiger Brands
ordinary shareholders receive a return of
R15.33, compared to a return of R14. 93 from
Pioneer Foods.
Dividend yield ratio for Pioneer Foods
shareholders is 1.11 percent lower than for Tiger
Brands. This indicates that Tiger Brands is
likely to be more favorable in the eyes of
investors, as shareholders receive a higher
return on the price that they have paid to invest
in Tiger Brands.
The earnings yield achieved by Pioneer Foods is
0.88 percent lower than the figure for Tiger
Brands (5.76 percent). A higher percentage of
earnings is being retained by Pioneer Foods for
future reinvestment, which may not discourage
investors, as their long-term weal this being
considered, although this is a concern for the
majority of short-term investors.
The pros:
Profit for the year increased by R466.6 million
from R498.6 million in 2013 to R965.2 million
in 2014. Net cash generated from operations
also increased from R1429.1 million in 2013 to
R2153.6 million in 2014. Because of this,
Pioneer Foods increased operating cash
flow/turnover ratio from 2013 to 2014; Tiger
Brands, on the other hand, had a reduced
operating cash flow/turnover ratio. This
reduction in operating cash flow/turnover ratio
for the rest of the industry indicates that the
increase in operating cash flow/turnover ratio
for Pioneer Foods is most certainly a positive
sign for the investor.
Pioneer Foods free cash flow increased from
R368 million to R1 281.2 million, which is a
248 percent increase, which is most certainly a
positive sign the investor. Tiger Brands’ free
cash flow as decreased from 2013 to 2014, yet is
still double that of Pioneer Foods.
Pioneer Foods’ current ratio for 2014 is 1.38:1,
which is 0.24:1 greater than the current ratio for
Tiger Brands (1.14:1). This indicates that
Pioneer Foods is more liquid than the industry,
in regard to current ratio.
For the 2014 year, Pioneer Foods (54.06 days)
had a working capital cycle 41.12 days shorter
than that of Tiger Brands (95.18 days). From an
analysis of the asset management ratios, we can
conclude that there is a favorable trend in
efficiency of asset utilization by Pioneer Foods.
This is a positive indicator for both existing and
prospective investors, particularly, if the trend
continues.
Despite the decrease in the Pioneer Foods P/E
ratio from 2013 to 2014, investors were still
willing to pay more per rand of reported profits for
Pioneer Foods than for Tiger Brands. Tiger Brands
P/E ratio was 17.37 times, which is 3.14 times
lower than that of Pioneer Foods (20.51 times).
The investor would be satisfied that a constant
dividend pay-out has been paid (last nine out of
ten years). Dividends per share increased from 132
cents in 2013 to 211 cents in 2014.
Pioneer Foods experienced a 34.01 percent
increase in basic earnings per share over the
year, which placed it in a favorable position in
relation to Tiger Brands (which showed a
decrease of 21.08 percent). Headline earnings (a
more stable indicator) increased for both
Pioneer Foods (36.63 percent) and Tiger Brands
(14.62 percent).
During the period of 1 October 2011 to 30
September 2014, the Pioneer Foods’ share price,
rose by 349.6 percent, while the Tiger Brands
share price grew by only 62.54 percent. During
the more recent period of 1 January 2015 to 30
June 2015, Pioneer Foods’ share price showed a
positive appreciation of 28.03 percent,
compared with a 25.14 percent decline for Tiger
Brands. This was due to the fact that the company
Investment Management and Financial Innovations, Volume 13, Issue 2, 2016
40
implemented value-enhancing initiatives
(unbundled Quantum Foods in 2013, acquired
Future Life and a Nigerian company, and
appointed a new board of directors) focused on
cost reduction and efficiencies which were
expected to continue driving the group’s earnings
(Moneyweb, 2015).
Taking into account all the above-listed considerations,
long-term investors should invest in Pioneer Foods, as
the pros of the continuously increasing share price
attributable to growth initiatives coupled with the
impact of the new board of directors outweigh the cons
of a lower dividend and return on shareholders’ equity,
compared to Tiger Brands. What is certain is that the
company has had considerable growth and there is
little evidence to suggest that this growth may stop in
the near future.
It should, none the less, be noted that short-term investors would prefer an investment in Tiger Brands, as they would be receiving higher returns immediately.
This paper presents an exemplar of the DuPont system of financial analysis as applied to the top three firms in the South African food industry.
References
1. Accounting Coach. (2015). What is the statement of financial position? Available at: http://www.accounting
coach.com/blog/what-is-the-statement-of-financial-position.
2. Alsemgeest, L., DuToit, E., Ngwenya, S. and Thomas, K. (2014). Corporate Finance: a South African
Perspective. (G. Els, P. Alsemgeest, & S. Viviers, Eds.). Cape Town: Oxford University Press.
3. Agala, S.R., Jadhav, P.K.D. and Borhade, S. (2014). A significance of financial ratio analysis in decision making:
A case study of Kicons. Pvt. Ltd., Asian Journal of Multidisciplinary studies, 2 (10), pp. 205-211.
4. Bleby, M. (2010). Pioneer to pay R 500 million fine cancels dividend. Available at: http://www.bdlive.co.za/
articles/2010/11/02/pioneer-to-pay-r500-million-fine---cancels-dividend.
5. Blessing, A. and Onoja, E.E. (2015). The role of financial statements on investments decision making: A case of
United Bank of Africa PLC (2004-2013), European Journal of Business, Economics and Accountancy, 3 (2).
Available at: http://www.idpublications.org.
6. Collier, H.W., McGowan, C.B. and Muhammad, J. (2006). Financial analysis of financial institutions in an
involving environment. University of Wollongong. Faculty of Business Research Online. Available at:
http://[email protected].
7. Correia, C., Dillon, J., Flynn, O., Uliana, E. and Wormald, M. (2013). Financial Management. 8th Edition. Cape
Town: Juta Publishing.
8. Demmer, M. (2015). Improving profitability forecasts with information on Earning Quality. School of Business
and Economics. Discussion paper. Available at: http://www.diss.fu-berlin.de/docs/servlets/MCRFile
NodeServlet/FUDOCS_derivate_000000004923/discpaper2015_16.pdf
9. Fin24. (2015). SA Poultry producers shares fallon US chicken imports. Available at: http://www.news24.
com/Archives/City-Press/SA-bans-import-of-poultry-products-20150429.
10. Firer, C., Ross, S.A., Westerfield, R.W., Jordan, B.D. (2004). Fundamentals of CorporateFinance. 3rd Edition.
London: McGrawHill.
11. IFRS. (2013). A Guide through IFRS Part A. 2014 edition. London: IFRS Foundation.
12. Liesz, J.T. and Maranville, J.S. (2008). Ratio analysis featuring the DuPont method: an overlooked topic in the
finance module of small business management and entrepreneurship courses, Small Business Institute Journal,
Volume 1, pp. 17-34.
13. lnvestopedia. (2015a). Dividend Yield. Available at: http://www.investopedia.com/terms/d/dividendyield.asp.
14. lnvestopedia. (2015b). Market Capitalization. Available at: http://www.investopedia.com/terms/m/
marketcapitalization.asp.
15. lnvestopedia. (2015c). Price-Earnings Ratio. Available at: http://www.investopedia.com/terms/p/price-earnings
ratio.asp.
16. Loth, R. (2015). Analyze Cash Flow The Easy Way. Available at: http://www.investopedia.
com/articles/stocks/07/easycashflow.asp.
17. McClure, B. (2015a). Fundamental Analysis: The Balance Sheet. Available at: http://www.
investopedia.com/university/fundamentalanalysis/fundanalysis7.asp.
18. McClure, B. (2015b). Fundamental Analysis: The Cash Flow Statement. Available at: http://www.
investopedia.com/university/fundamentalanalysis/fundanalysis8.asp.
19. McGowan, C.B. and Stambaugh, A.R. (2012). Using disaggregated return on assets to conduct a financial analysis
of a commercial bank using an extension of the DuPont system of financial analysis, Accounting and Finance
Research, 1 (1) (online). Available at: http://www.sciedu.ca/afr.
20. Moneyweb. (2015a). Click-a-Company TBS. Available at: http://www.moneyweb.eo.za/tools-and-data/click-a-
company/?shareCode=TBS.
21. Moneyweb. (2015b). Click-a-Company RCL. Available at: http://www.moneyweb.co.za/tools-and-data/click-a-
company/?shareCode=RCL.
22. Moneyweb. (2015c). Click-a-Company PFG. Available at: http://www.moneyweb.eo.za/tools-and-data/click-a-
company/?shareCode=PFG.
Investment Management and Financial Innovations, Volume 13, Issue 2, 2016
41
23. Money-Zine. (2015). Analyzing the Balance Sheet. Available at: http://www.money-zine.com/
investing/investing/analyzing-the-balance-sheet/.
24. News 24. (2014). SA bans import of poultry products. Available at: http://www.news24.com/Archives/City-
Press/SA-bans-import-of-poultry-products-20150429.
25. News 24. Pioneer Foods to acquire 50 percent of Future life Health Products. Available at:
http://www.fin24.com/Companies/Retail/Pioneer-Foods-to-buy-50-of-Futurelife-20150423.
26. Onu, E. (2015). Pioneer Foods eyes Nigeria and beyond. Available at: http://www.bdlive.co.za/
business/retail/2015/03/20/Pioneer-foods-eyes-nigeria-and-beyond.
27. Penn State. (2015). Balance Sheet Analysis. Available at: http://extension.psu.edu/courses/meat-goat/financiaI-
information/farm-business-analysis/balance-sheet-analysis/.
28. Pioneer Foods. (2015). Annual Reports. Available at: http://www.Pioneerfoods.co.za.
29. Pioneer Foods. (2014). Annual Financial Statements. Available at: http://www.Pioneerfoods.co.za.
30. Reuters. (2015). Pioneer Food Group Ltd agrees to invest in Food Concepts Pioneer Limited. Available at:
http://www.reuters.com/finance/stocks/PFGJ.J/key developments/article/3165047.
31. Rogova, E. (2014). DuPont analysis of the efficiency and investment appeal of Russian oil-extracting companies.
8th International Scientific Conference. Business and Management. Vilnius, Lituania. Available at:
http://www.bm.vgtu.lt.
32. Service, C.L. (2014). Gripping Gaap. 15th Edition. Durban: Lexis Nexis.
33. Sharma, R. (2012). Comparing and analyzing financial statements to make investment decision: Case study of
Automotive Industry. University of Applied Sciences. Business Economics and Tourism. Available at:
https://www.theseus.fi/bitstream/handle/10024/43723/SHARMA_RAJU.pdf?sequence=1.
34. Sheela, C.S. and Karthikeyan, K. (2012). Financial performance of Pharmaceutical Industry in India using DuPont
Analysis, European Journal of Business and Management, 4 (14). Available at: http://www.iiste.org.
35. Soliman, M.T. (2008). The use of DuPont analysis by market participants, The Accounting Review, 83 (3), pp. 823-853.
36. Stainbank, L., Oakes, D., Razak, M. (2014). A Student’s Guide to International Financial Reporting. 9th Edition.
Eston, South Africa: S&O Publishing.
Investment Management and Financial Innovations, Volume 13, Issue 2, 2016
42
Appendix A: DuPont analysis
Fig. 2. DuPont analysis: RCL Foods
Investment Management and Financial Innovations, Volume 13, Issue 2, 2016
43
Fig. 3. DuPont analysis: Tiger Brands
Investment Management and Financial Innovations, Volume 13, Issue 2, 2016
44
Fig. 4. DuPont analysis: Pioneer Foods
Related Documents