1 Referência completa para citação: FREITAS (H.), BECKER (J.L.), JENKINS (M.), and KLADIS (C. M.). Using DSS to teach business students & managers to conceive their own tools aiming to improve the decision-making process. ISRC, Merrick School of Business, University of Baltimore (MD, EUA), WP ISRC No. 040398 , March 1998. 27 p. Using DSS to teach business students & managers to conceive their own tools aiming to improve the decision-making process 1 ISRC Working Paper 040398, March 1998 Henrique Freitas Visiting Researcher at ISRC, University of Baltimore (USA) Associate Professor, GESID - PPGA - Escola de Adm. da UFRGS and CNPq Researcher (Brazil) Docteur "nouveau régime" – Université Pierre Mendès France (Grenoble, France) [email protected] João Luiz Becker Professor, GESID - PPGA - Escola de Adm. da UFRGS and CNPq Researcher (Brazil) Ph.D. UCLA (Los Angeles, USA) [email protected] Milton Jenkins Professor and Director of ISRC, Information Systems Research Center, University of Baltimore (USA) Ph.D. on Management Information Systems, University of Minnesota (USA) [email protected] Constantin Metaxxa Kladis System analyst at PRODASEN, M.Sc. in Business Administration (Gesid-PPGA/UFRGS, Brazil) Abstract: Having designed and developed a tool assuring coherence in, and speeding up, the decision-making process called Industrial Decision Support System (IDSS), we designed a laboratory study, with a control and an experimental group, to assess its impact in the reduction of decision-maker difficulties. The 40 participants formed teams to produce a solution to a well-defined case. As we could expect, the results showed that IDSS helped to reduce the difficulties of the decision-maker over the decision process. Therefore, like with other tools, IDSS can be claimed to be a decision-making support tool that facilitates and streamlines the decision-making process as a whole. In fact, this experience allows us to point out a way to teach business students and managers the process of conceiving a case or problem solution. In so doing, we will help them in tasks, such as the definition and design of a specific information system, and we will help teachers show students, by taking the reported case as an example, the importance of the use of IT (information technology). Keywords: 1 This study was supported by the Information and Decision-Making Support Systems Research Group (GESID), a research group from the School of Management (PPGA/UFRGS, Brazil), and had the collaboration of Marcus Cunha Jr., Leila Dickow, Ângela Werner, Isabela Tochetto Badi, and Ricardo Formighieri de Bem. This research was partially supported by some of the main Brazilian Government Research agencies (CNPq, CAPES and FAPERGS). We wish to thank Professor Bob Zmud (Florida State University) for suggestions made to an very early draft of this manuscript. Of course, the authors take full responsability for eventual mistakes in the final text. This final version was prepared in cooperation between the ISRC (Information Systems Research Group, University of Baltimore, USA) and the GESID. The authors strongly acknowledge Mrs. Oveta Popjoy, Assistant Researcher at the ISRC, for the editing of this last text version.

Welcome message from author
This document is posted to help you gain knowledge. Please leave a comment to let me know what you think about it! Share it to your friends and learn new things together.
Transcript

1
Referência completa para citação: FREITAS (H.), BECKER (J.L.), JENKINS (M.), and KLADIS (C. M.). Using DSS to teach business students & managers to conceive their own tools aiming to improve the decision-making process. ISRC, Merrick School of Business, University of Baltimore (MD, EUA), WP ISRC No. 040398, March 1998. 27 p.
Using DSS to teach business students & managers
to conceive their own tools aiming to improve the decision-making process 1
ISRC Working Paper 040398, March 1998 Henrique Freitas Visiting Researcher at ISRC, University of Baltimore (USA) Associate Professor, GESID - PPGA - Escola de Adm. da UFRGS and CNPq Researcher (Brazil) Docteur "nouveau régime" – Université Pierre Mendès France (Grenoble, France) [email protected]
João Luiz Becker Professor, GESID - PPGA - Escola de Adm. da UFRGS and CNPq Researcher (Brazil) Ph.D. UCLA (Los Angeles, USA) [email protected]
Milton Jenkins Professor and Director of ISRC, Information Systems Research Center, University of Baltimore (USA) Ph.D. on Management Information Systems, University of Minnesota (USA) [email protected]
Constantin Metaxxa Kladis System analyst at PRODASEN, M.Sc. in Business Administration (Gesid-PPGA/UFRGS, Brazil) Abstract: Having designed and developed a tool assuring coherence in, and speeding up, the decision-making process called Industrial Decision Support System (IDSS), we designed a laboratory study, with a control and an experimental group, to assess its impact in the reduction of decision-maker difficulties. The 40 participants formed teams to produce a solution to a well-defined case. As we could expect, the results showed that IDSS helped to reduce the difficulties of the decision-maker over the decision process. Therefore, like with other tools, IDSS can be claimed to be a decision-making support tool that facilitates and streamlines the decision-making process as a whole. In fact, this experience allows us to point out a way to teach business students and managers the process of conceiving a case or problem solution. In so doing, we will help them in tasks, such as the definition and design of a specific information system, and we will help teachers show students, by taking the reported case as an example, the importance of the use of IT (information technology). Keywords: 1 This study was supported by the Information and Decision-Making Support Systems Research Group (GESID), a research group from the School of Management (PPGA/UFRGS, Brazil), and had the collaboration of Marcus Cunha Jr., Leila Dickow, Ângela Werner, Isabela Tochetto Badi, and Ricardo Formighieri de Bem. This research was partially supported by some of the main Brazilian Government Research agencies (CNPq, CAPES and FAPERGS). We wish to thank Professor Bob Zmud (Florida State University) for suggestions made to an very early draft of this manuscript. Of course, the authors take full responsability for eventual mistakes in the final text. This final version was prepared in cooperation between the ISRC (Information Systems Research Group, University of Baltimore, USA) and the GESID. The authors strongly acknowledge Mrs. Oveta Popjoy, Assistant Researcher at the ISRC, for the editing of this last text version.

2
Decision process - Decision support systems (DSS) - Decision-maker - IT - Education - MBA case

3
Using DSS to teach business students & managers to conceive their own tools aiming to improve the decision-making process
1. Introduction
It is already established and well-known that the decision-making process is affected by the
organization environments, both internal and external. As the environment gets more volatile, the decision-
making process becomes more complex. In third world countries, in particular, organizations must possess
more flexibility, creativity and adaptability in order to survive ever-changing circumstances. In addition to the
competitive environment, they must face the issue of economic and political instability. After each economic
intervention conceived and implemented by the government, quick and precise responses are needed to adapt
and stay in business. For example, changes made to the foreign trade policies demand immediate adaptive
responses from the organizations. It is within this context that managers perform their activities and are
required to be effective. Some authors [2] comment that, in an unstable environment, managers are pressed to
make decisions quickly and produce high quality results.
In the past two decades, we have witnessed the emergence of computer-based models designed to
help managers in their decision-making process, generally called Decision Support Systems (DSS). Although
the academic literature contains many papers addressing the issue of evaluating such systems [5, 13], most of
them are written from a theoretical perspective [21], proposing models and frameworks. It is very hard to find
empirical studies that focus on organizations [11], rather than on decision-makers.
Searching the exact ways a DSS effectively helps its users during the decision-making process is the
focus of this paper. DSS developers are usually biased, believing that the simple use of their carefully designed
systems will improve decision-maker capabilities. It is important to have evidence to support such a statement,
separating what could be a technological effect (such as a placebo) from what could (and should) be credited
to the DSS itself.
Having created and developed a tool called Industrial Decision-Making Support System (IDSS) [10,
16] to reduce the decision-maker’s difficulties, assuring coherence in and speeding up the decision-making
process, we designed a laboratory study to assess its impact. A group of 40 people was divided into two
subgroups: a control group and an experimental group. People were assembled into teams of four to
produce a solution to a well-defined case.

4
This paper reports the main results obtained, emphasizing the differences in performance between the
two groups, as well as the perceived reduction of difficulties. As a matter of fact, this experience allows us to
point out a way or ‘method’ to teach business students and managers the process of conceiving a case or
problem solution. A better conception of the process will help them in other tasks, such as definition and
design of a specific information system. By taking the reported case as an example, all may see the importance
of the use of IT (information technology) and its role as a facilitator of the better understanding of the
interdepartmental relationships.
We use a reference model for the decision-making process. Section 2 presents some associated
difficulties of the decision-maker in this process. Section 3 presents the method and instruments developed
and used in the evaluation of the impact of IDSS. Section 4 presents the IDSS operational characteristics,
associating them with the decision-maker difficulties. The results of the lab study are analyzed in section 5, and
the overall global impact of IDSS is presented. Section.6 concludes the paper, pointing out the limitations of
the experiment, presenting some perspectives for future research on the subject, and mainly proposing the use
of this study design to teach business students and managers to conceive their own tools aiming to improve the
decision-making process.
2. The decision-making process and its difficulties
SIMON [22] proposes a decision-making process model divided into three phases, Intelligence,
Design and Choice, with continuous feedback. In a later work, SIMON [23, 24] extended the model to
include a Review phase, indicating that the chosen alternative is implemented, monitored, and the new,
modified situation is followed-up. When the decision process takes place, the decision-maker faces several
difficulties, which are, in fact, restrictive factors that jeopardize the final result of the process. KENDALL &
KENDALL [13] identify some difficulties, relating them to Simon’s model. FREITAS & KLADIS [7, 9]
further add the difficulty in processing new information, related to the Review phase and Feedback.
Figure 1 represents Simon’s model with the difficulties likely to occur in each phase of the decision-
making process. These difficulties were used in the evaluation method utilized in this study.

5
Decision-making Model Difficulties to:
Intelligence - Identify the problem- Define the problem- Classify the problem
Design
Choice
- Generate alternatives- Quantify or describe alternatives- Establish performance criteria
- Identify the method of selection- Organize and present information- Select alternatives
Review- Process new information
Figure 1 - The difficulties of the decision-maker in each phase of the decision-making process.
3. Material and methods
This research was conducted as a laboratory experiment with a control group and post-testing only
[19, 3, 14, 15]. Both groups (experimental and control) were submitted to the same decision situation, and
were allowed to use similar technological resources (hardware and software), except for one thing: the
experimental group used a decision support tool, the IDSS (therefore called IDSS group), while the control
group used general spreadsheet software. Both software packages were supported by Windows®, and the
groups had the help of a facilitator with complete knowledge of the tools. In order to assure the same
conditions, we provided the control group with the mathematical formulas upon which IDSS is based.
We were interested in observing and comparing the behavior of the groups regarding the difficulties
found in the decision-making process phases described in Section 2. Two objective measures were used to
evaluate the difficulties: number of alternatives generated and time to generate each of them, both in the
design and in the review phases. Further, a number of indicators measuring the perception of the difficulties
faced by the decision-maker, in each phase, were captured by a questionnaire, using a 7-point Likert scale
[17].
The following instruments were used in the experiment:
• a text-case, with a description of the decision-making situation (see section 4.1); • the IDSS or the decision support tool (see section 4.4)

6
• a questionnaire (Appendix A).

7
The facilitators took notes and audiotaped all sessions. Twenty undergraduate students and twenty
graduate students, majoring in Business Administration, volunteered for the experiment. They were stratified
by school level and distributed randomly to form a control group and an IDSS group. Each control group and
each IDSS group were subdivided into 5 subgroups of two, four, or five students each, depending on the
attendance in the right time. The total of 10 subgroups were paired according to school level to face the
decision situation. The experiment was done in 5 sessions, in each one of which two paired subgroups were
observed. The final composition of the sample is presented in Table 1.
Control Group IDSS (experimental) Group
Undergrad Students Grad Students Undergrad Students Grad Students
Subgroup # of people Subgroup # of people Subgroup # of people Subgroup # of people 01 05 05 02 02 05 06 02 03 05 07 04 04 05 08 04 09 04 10 04
Subtotals 10 10 10 10 Total for Control Group 20 Total for IDSS (experimental) Group 20 Total = 40
Table 1 - Composition of the sample
Although MATTAR [18] argues that because the groups were not pre-tested, there will always be
doubts if both groups were effectively identical prior to being exposed to the treatment, this experimental
design is acceptable for our purposes.
This study was designed and executed as shown in Table 1, and it was necessary to have a DSS tool,
which finally became our main result, as well as the design procedure by itself, which means that using a group
with some ‘DSS’ technology and another group with other technology (or even without), instructors or
consultants can show managers or students the real value of a special, or well-defined method, or technology,
or system. It is even more true when you are able to propose or create an initial situation, as described at the
beginning of the following Section, where the managers or the students need to conceive the solution and then
design a system, and only then build something as a software or computing solution. The value of any
technology will then be in a good way for the involved students or managers.

8
4. The Decision Support System in an Industrial context (IDSS)
The process of decision-making within an organization has received much attention from practitioners
and researchers. Apart from operational decisions, which, being well structured, might be easily standardized
and disseminated through the organization; tactical and strategical decisions have received more attention,
mainly due to their broad range of consequences in long and medium time periods.
Managers, consultants, and researchers, mainly in the areas of computer science and administration,
have concentrated their efforts on better understanding this process, searching for ways to help the decision-
maker [28, 26, 6, 8]. The IDSS which we will describe below is a result of such efforts, in a specific
company: we can consider here as if it was the result of a action-research. The IDSS helps managers to face
non-routine and non-structured situations considered critical to the overall performance of the organization.
A posteriori, it could be easier for someone to say that it is a routine or a structured situation that the IDSS
allows to face. Of course, after the researchers analyze the situation, it becomes like that; but it remains non-
routine and non-structured for the managers in that situation. In the mind of people working day to day, it is
the ‘enterprise war situation of each month or even of each day’, unless they develop the knowledge and
the experience here reported.
Following Silver [21], we might classify IDSS as a model for intervention. In fact, IDSS is a normative
system for managers, and a descriptive system for the company. It describes how the company evaluates
policies (like pricing, supplying, distributing, etc.), forcing managers to follow suit, as it embeds mathematical
and logical relations. On the other hand, it does consider the feelings and special abilities of managers, allowing
them to be in full charge of the decision situation. The system does not decide for them. It is like a tool of the
trade, augmenting a person’s decision-making capabilities.
In the following sections, we describe the specific case, or the industrial situation, with which we work
in order to find and propose a solution (4.1). We then define some mathematical formulas (4.2) and the
relations (4.3), which allow us to design the system and its operational characteristics (4.4), specifically relating
to the difficulties facing the manager, in the process of decision-making (4.5).
4.1 Text-case
Here we present some details and data about the industrial environment in which we ‘put the students’
in the experiment. However, this is a description from a true situation that we decided to adapt to this study.
9
4.1.1 - The context and some basic data concerning the situation
The company: METALXXA is a (hypothetical) manufacturer company in the metal-mechanic
industry with over ten years in the market. In spite of an unstable economy, the company has a stable financial
and market situation. This company produces five products. The necessary raw materials for these products
are only in three categories, and the relationship with domestic and foreign suppliers is normal. The social,
economic, and political environments affecting the company are similar to those existing today in real life.
The participants: the group that will participate in the decision-making situations should play the role
of the top level managers (marketing, financial, administration, production) of METALXXA. Such managers
operate in an interactive way and have total autonomy to decide upon actions to be taken by the company.
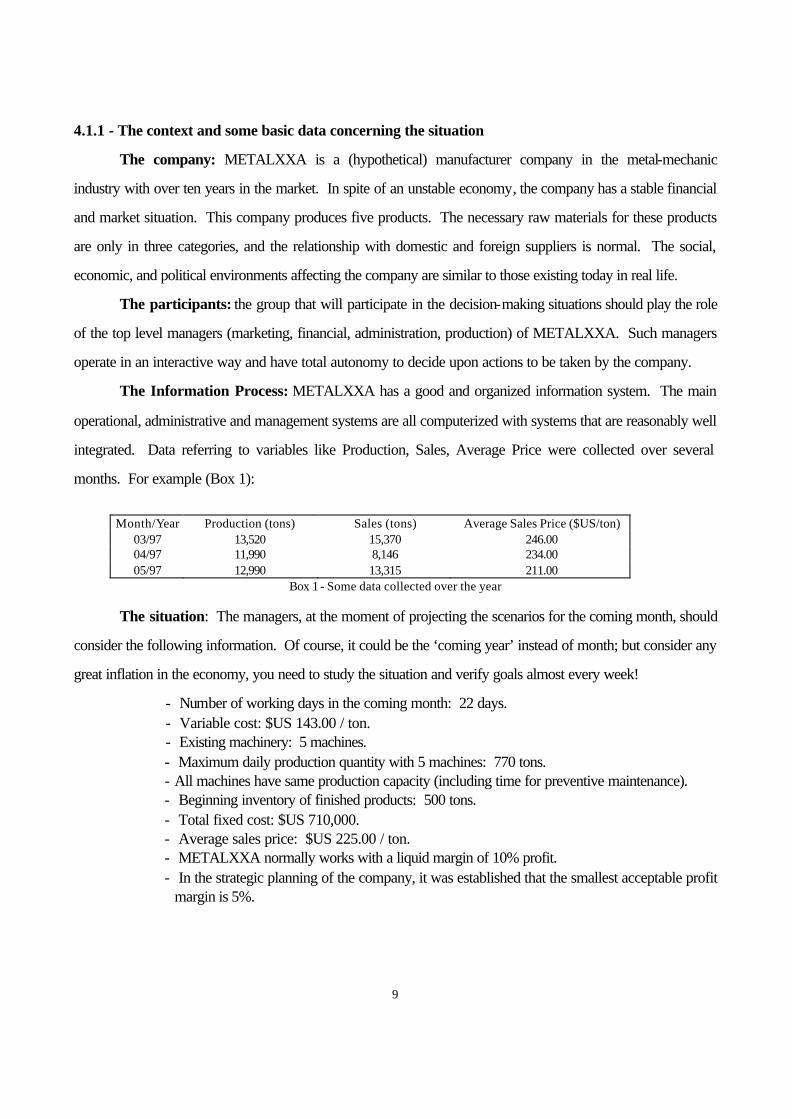
The Information Process: METALXXA has a good and organized information system. The main
operational, administrative and management systems are all computerized with systems that are reasonably well
integrated. Data referring to variables like Production, Sales, Average Price were collected over several
months. For example (Box 1):
Month/Year Production (tons) Sales (tons) Average Sales Price ($US/ton)
03/97 13,520 15,370 246.00 04/97 11,990 8,146 234.00 05/97 12,990 13,315 211.00
Box 1 - Some data collected over the year
The situation: The managers, at the moment of projecting the scenarios for the coming month, should
consider the following information. Of course, it could be the ‘coming year’ instead of month; but consider any
great inflation in the economy, you need to study the situation and verify goals almost every week!
- Number of working days in the coming month: 22 days. - Variable cost: $US 143.00 / ton. - Existing machinery: 5 machines. - Maximum daily production quantity with 5 machines: 770 tons. - All machines have same production capacity (including time for preventive maintenance). - Beginning inventory of finished products: 500 tons. - Total fixed cost: $US 710,000. - Average sales price: $US 225.00 / ton. - METALXXA normally works with a liquid margin of 10% profit. - In the strategic planning of the company, it was established that the smallest acceptable profit
margin is 5%.

10
The constraints: Let us consider that the variable costs and the fixed costs cannot be modified,
because the scenario test is for the coming month, and an immediate action upon such costs is not possible.
US Dollars will be used as currency.
4.1.2 - First proposed situation to the case-study
In this context, and with data described, we can propose a situation in order to allow the students (or
managers) to work toward a solution. Other situations can be proposed after this first one, following the same
structure described below. It is important for this study to record the time when the activity of each group
begins and ends.
Proposed situation: METALXXA has a privileged position regarding to price establishing. Being a
market leader, responsible for 35% of the overall sales in the Country, it has influence on evaluating prices in
this market. Nevertheless, competition decided to keep their prices at $US 215.00 / ton for the next month.
When the next month begins, it is necessary to have an inventory of 500 tons to comply with commitments. At
this point, the company's management is in a meeting to decide what behavior should be adopted for the next
month. For that reason, it should generate alternative behaviors and choose the one that is optimal. All of the
information given above should be considered.
Alternative behaviors: Each behavior is a deliberate choice or strategy of the group. The group
must determine data as illustrated below (Box 2). The same kind of data should be recorded for other
‘behaviors’ or scenarios if they are able or if they have time to study more than one.
Behavior or strategy 1 - __________________________________ a. Ending inventory in the period (tons) : ____________________ b. Sale price per ton ($US/ton):____________________________ c. Quantity to be sold in the period (tons):____________________ d. Quantity to be produced in the period (tons):________________ e. Profit or loss projected for the period ($US):________________ The time required for this activity: ___________
Box 2 - Data regarding each solution
11
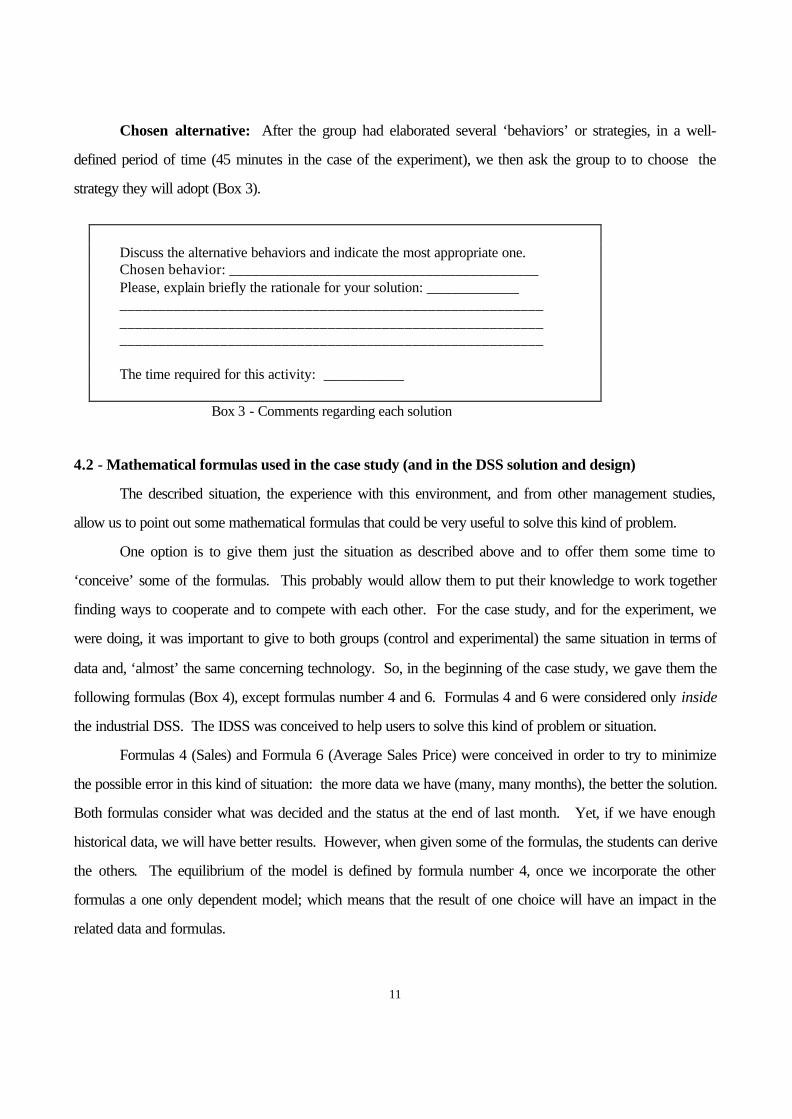
Chosen alternative: After the group had elaborated several ‘behaviors’ or strategies, in a well-
defined period of time (45 minutes in the case of the experiment), we then ask the group to to choose the
strategy they will adopt (Box 3).
Discuss the alternative behaviors and indicate the most appropriate one. Chosen behavior: _________________________________________ Please, explain briefly the rationale for your solution: _____________ _______________________________________________________ _______________________________________________________ _______________________________________________________ The time required for this activity: ___________
Box 3 - Comments regarding each solution 4.2 - Mathematical formulas used in the case study (and in the DSS solution and design)
The described situation, the experience with this environment, and from other management studies,
allow us to point out some mathematical formulas that could be very useful to solve this kind of problem.
One option is to give them just the situation as described above and to offer them some time to
‘conceive’ some of the formulas. This probably would allow them to put their knowledge to work together
finding ways to cooperate and to compete with each other. For the case study, and for the experiment, we
were doing, it was important to give to both groups (control and experimental) the same situation in terms of
data and, ‘almost’ the same concerning technology. So, in the beginning of the case study, we gave them the
following formulas (Box 4), except formulas number 4 and 6. Formulas 4 and 6 were considered only inside
the industrial DSS. The IDSS was conceived to help users to solve this kind of problem or situation.
Formulas 4 (Sales) and Formula 6 (Average Sales Price) were conceived in order to try to minimize
the possible error in this kind of situation: the more data we have (many, many months), the better the solution.
Both formulas consider what was decided and the status at the end of last month. Yet, if we have enough
historical data, we will have better results. However, when given some of the formulas, the students can derive
the others. The equilibrium of the model is defined by formula number 4, once we incorporate the other
formulas a one only dependent model; which means that the result of one choice will have an impact in the
related data and formulas.

12
Key: EI = Ending Inventory BI = Beginning Inventory FC = Fixed Costs VC = Variable Costs NWD = Number of Working Days ASP = Average Sales Price X and Y = Calculated by regression of historical series APC = Average Production Costs
(1) Production = Sales + EI - BI
(2) Production = FC / (APC - VC)
(3) Sales = Production - EI + BI
(4) Sales = (X - Y * ASP) * NWD + [ (previous month prediction - previous month occurrence) * (present NWD / previous NWD) ]
(5) ASP = APC * (1 + Margin)
(6)ASP = { { {Sales - [ (previous month prediction - previous month occurrence) * (present NWD / previous NWD) ] } / NWD} - X}/ - Y
(7) EI = Production - Sales + BI
(8) APC = VC + (FC / Production)
(9) APC = ASP / (1 + Margin)
(10) Margin = (ASP / APC) - 1
(11) Profit = Sales * ASP * Margin
Box 4 - The DSS formulas to solve the problem 4.3 - The ‘logical’ and mathematical relations
There are eleven variables used in this case-study and, of course in the design of the IDSS (Section
4.4). They are: Production, Sales, Margin, Profit, Beginning Inventory, Ending Inventory, Fixed Costs,
Variable Costs, Number of Working Days, Average Sales Price, and Average Production Cost. They are all
closely related through mathematical and logical relations. Four of the variables (Number of Working Days,
Beginning Inventory, Fixed Costs and Variable Costs) should always be given at the start, because these data
depend on the previous month. If we would lilke to “play” also with Fixed costs and Variable Costs, in this

13
case it would be necessary to rebuild the decision tree defined (Box 5), in order to give people a choice also
concerning an action on these two variables.

14
The decision tree below shows all possible sequences for inputting the other variables, using the
existing degrees of freedom (only three) and computing (automatically) the remaining variables. For example, if
we define a ‘strategy’ in order to ‘play’ on the PRODUCTION, the AVERAGE PRODUCTION COSTS
(APC) will be calculated automatically using the Formula 8. We then used our first choice of strategy or
behavior, and a second choice, or even a third one, remains. In this example, we can still choose to ‘play’ on
(to change) one the following variables: SALES, ASP, EI or MARGIN. But, in this case, when we choose
one, all others variables will be calculated immediately, using the formulas in the order indicated by the column
‘order of calculation’. For example, if we decide to act on SALES, the formulas will be calculated in this
order: 7, 6, 10 and 11. And, we will have a value for each of the variables of the model.
Key: EI = Ending Inventory BI = Beginning Inventory FC = Fixed Costs VC = Variable Costs NWD = Number of Working Days ASP = Average Sales Price APC = Average Production Costs
1st. Variable
Calculated automatically
2nd. Variable
Order of Aut. Calculation
3rd. Variable Order of Aut. Calculation
PRODUCTION APC(8) SALES (7) (6) (10) (11) ASP (4) (7) (10) (11) EI (3) (6) (10) (11) MARGIN (5) (4) ( 7) (11) _______________________________________________________________________________________________________ APC PRODUCTION(2) SALES (7) (6) (10) (11) ASP (4) (7) (10) (11) EI (3) (6) (10) (11) MARGIN (5) (4) ( 7) (11) _______________________________________________________________________________________________________ SALES ASP(6) PRODUCTION (7) (8) (10) (11) APC (2) (7) (10) (11) EI (1) (8) (10) (11) MARGIN (9) (2) ( 7) (11) ________________________________________________________________________________________________________ ASP SALES(4) PRODUCTION (7) (8) (10) (11) APC (2) (7) (10) (11) EI (1) (8) (10) (11) MARGIN (9) (2) ( 7) (11) ________________________________________________________________________________________________________ EI SALES (1) (6) (8) (10) (11) PRODUCTION (3) (6) (8) (10) (11) ASP (4) (1) (8) (10) (11) APC (2) (3) (6) (10) (11) MARGIN ---------------------------------> SALES (6) (9) (2) (11) PRODUCTION (8) (5) (3) (11) ASP (9) (4) (1) (11) APC (5) (4) (1) (11) ________________________________________________________________________________________________________ MARGIN SALES (6) (9) (2) (7) (11) PRODUCTION (8) (5) (4) (7) (11) ASP (9) (2) (4) (7) (11) EI --------------------------------------------> SALES (6) (9) (2) (11) PRODUCTION (8) (5) (3) (11)

15
ASP (9) (4) (1) (11) APC (5) (4) (1) (11)
Box 5 - The combination of possibilities or actions and the implications

16
4.4 - Industrial Decision Support System (IDSS): integrating relations and formulas in an end-user tool
IDSS is a tool we developed in order to help managers and students to simulate scenarios inside the
company, considering some variables associated with the production process, marketing and finance. The
manager may modify the value of the variables at will, in any order, and simulate the consequences. By
generating several scenarios, the manager (or a group) can easily compare them and choose the most
appropriate within a given context.
All of the variables involved (Figure 2) are predictions, with the exception of the beginning inventory
and the number of working days. The scenarios are built by computing other variables, following
mathematical formulas and relations already presented in Sections 4.2 and 4.3. Figure 2 represents the main
screen of the system, in which the user can see connections (colored) lines indicating the logical and
mathematical relations among the variables.
Figure 2 - IDSS main screen
In the largest window of the main screen (Figure 2), the following variables are considered:
• number of working days in a month, or in a given period of time; • beginning inventory at the start of the period, measured in tons;

17
• variable production cost in $US per ton; • fixed production cost in $US; • ending inventory at the close of the period, measured in tons; • average sales price per ton (cash, in $US); • sales during the period in tons; • production during the period in tons; • average production cost, in $US per ton; • profit margin, as a percent; • total profit during the period, in $US.
The IDSS end-user normally works in the major portion of the window (top left), where he or she has
access to the variables. The system behaves as explained in the decision tree (Section 4.3), with the idea of
‘freedom’, which means if he or she decides to determine the SALES, so that the ASP will be calculated using
formula 6 and the user will have a new freedom to choose.
The other portions of the window offer two sets of supporting tools. If we look at Figure 2, the main
screen, IDSS is supposed to offer some assistance concerning printers, e-mail, schedule, and on-line help. A
password opens the way for the master user to update the X and Y constants, which are the data that allow
the mathematical and logical model to stabilize. Each period of time (each month in this case-study), it is
important to make a regression analysis with the updated data (historical series) and to verify the correct values
concerning X and Y (using the following formula: Sales = (X - Y * ASP) * NWD ). The main screen offers
this set of specific supporting tools at the right of the screen, where we can find different options as follows:
• Historical data: the user can verify any data concerning all of the variables in the main screen (sales, production, and so on, and even other interesting data concerning the economics or the environment of the enterprise).
• Basic scenario: the user can define a specific scenario (which he or she elaborated and saved previously in order to have the data from this scenario definition as a ‘hidden scenario’ in the main screen. This means that, if he or she decides to ‘click’ on sales, the proposed value for sales will be the value already saved in the scenario now defined as a ‘basic scenario’; so, even if the main screen is not filled, the user knows he or she will have a ‘suggested value’ when choosing any variable available.
• Reference: the user can decide if he or she
wants to create news scenarios based on the values of a well-defined scenario (fixed reference, all scenarios are a version based on this one), or if he or she decides that each scenario created will be based on the last one he or she defined ‘right before’ (which we defined as a sequential reference).
Figure 2 a - Fixed or sequential reference basis

18
• Short or long term: If the user chooses long term, it will be possible to have more ‘freedom’, to act on and fixed costs and variable costs, which is not possible, in this model, in the short term.
• Show basic scenario (or other): The user will be able to verify some of the values whenever he or she needs.
• Comparisons: The system offers the option of comparing some of the saved scenarios. • Data management: A resource that all systems need to offer to the user, the ability to update data. • Reinitialization: The way the user can save the current scenario and then begin again to define a new
scenario. • Messages ON/OFF: Provides only a possibility to facilitate the way the user uses the system, which
means, if he or she knows the system very well, it is not necessary to have the messages on the screen. The messages can be hidden.
• Negotiation and Customers: Both are possibilities to improve the way the managers do business today, but these choices are only ideas, not yet developed, as a way to give better information during a customer call.
4.5 - IDSS and difficulties of the decision-maker
As we are also interested to see if the system reduces the difficulties of the decision-maker in the
decision process, we now describe how IDSS deals with the difficulties identified in our theoretical framework
(Figure 1).
In the Intelligence Phase, the environment is examined and data are processed to search for signs that
might identify problems and opportunities, and the variables related to the situation are collected and
highlighted. The decision-maker might face difficulties to identify, define, and / or classify the problem. This
relates to his or her perception of the problem, as well as his or her capacity to recognize its characteristics and
limits.
The development of IDSS within the company followed a period of intense discussion among top
management, dominant stockholders, and consultants, in which the recognition of the problem (and its
classification as a top priority) occurred, together with the identification of the important variables related to it.
A record of core variables was built as a result of these discussions. Therefore, in some sense, one can argue
that the development of IDSS per se was a result of the intelligence phase, faced collectively. It assures
stockholders that management will work as their agents on the “right” problem with the proper parameters.
The managers feel more comfortable with their decision, and do not lose time and energy with valueless data.
On the other hand, users of the system have access, to historical data of all variables at their fingertips, allowing
them to better understand the environment in which the company and the problem are embedded.

19
In the Design Phase, the creative process takes place and the development and analysis of possible
courses of action are identified. The decision-maker elaborates the problem, builds up and checks available
alternatives based on their potential applicability. He or she might face difficulties to generate, quantify, or even
describe alternatives, and to establish performance criteria.
Here is where IDSS makes its main contribution, permitting different approaches to the problem. The
user may modify the value of the variables, in any order, simulating the consequences upon the others. This is
possible because the system is based upon a number of logical and mathematical relations among all variables,
assuring complete coherence of results. Of course, since the number of variables and equations is determined,
the manager will use his or her privilege of choice up to a certain point, in which the degrees of freedom
vanishes and the system fills the contents of the other variables. With this enhanced simulation capacity, the
IDSS user generates as many alternatives as he or she wants, each time from a new standpoint. Each
simulation encompasses a full set of descriptors of the alternative being generated. By continuously using the
system, the user will refine his or her feelings and knowledge of the problem, certainly helping him or her to
establish performance criteria.
In the Choice Phase, the best among the available alternatives is selected. The decision-maker might
face difficulties to identify the method of selection, to organize and present information, as well as to select
alternatives.
IDSS helps the users in many ways. To support the selection of alternatives, it permits visualization at
any time of the result of any simulation already completed. Users use this feature to support their thoughts,
performing intellectual tasks such as comparing, confirming, exploring, and so on. It is very much dependent
on each user’s cognitive process.
IDSS provides two types of strategies for exploration, inspired by the tree search literature: deep
search (depth-first) and travel search (breadth-first) [1]. Using the deep search strategy, the decision-maker
starts from a given set of values for the variables (scenario) and compares it successively with new scenarios
built from modifications of the last one visited. As the decision-maker proceeds with the strategy, the basis of
comparison evolves, and the resultant scenario improves. In the travel search strategy, the decision-maker
fixes a given scenario as a basis and examines a whole set of new scenarios built from modifications of the
value of some variables in the base scenario. All scenarios being analyzed are derivations of the first one built.
Using a mental model resembling a branch and bound procedure for integer programming, the user makes his
or her choices, either abandoning a whole part of the tree or going further and exploring new alternatives.

20

21
It is important to point out that, in this process of navigation, the decision-maker will need to save a
given set of particular scenarios for further (and perhaps deeper) comparison. IDSS provides a special
supporting tool called COMPARISON to help him or her in comparing selected alternatives.
Although conceptually the Review and Feedback Phase are presented linearly, the decision-maker
navigates from one to another constantly. Jumping from the Choice Phase to the Intelligence Phase or to the
Design Phase, or from the Design Phase to the Intelligence Phase gives valuable feedback to the process.
Despite being inherently dependent on the decision-maker’s abilities or disabilities, this difficulty might
be minimized by any user-friendly system. IDSS was conceived to be a very easy and friendly system to use.
This is apparent by the fact that the user works essentially in only one screen. See Figure 2. In addition, IDSS
pulls together several areas of the company, especially marketing, production, and finance. Consequently, it
might be used by different people for different purposes. Nevertheless, each person learns the impact of his or
her simulated decision upon other areas. It might be used collectively, forming groups, working synchronously
or independently.
5. Analysis of Results
Several sources of data were used to accomplish the objectives of the research. Data collected from
the questionnaire (Appendix A), audiotape transcriptions, notes taken during the experiment, and interviews
conducted at the end of each lab session. Considering that many studies already have shown the value and the
importance of a DSS, the important thing here is to point out that this procedure allows us to learn that students
and managers need to be educated in order to be able to conceive their own solutions, like the process
reported in Section 4.
5.1 - Statistical tools employed
For the analysis of the questionnaire data, the following statistical tools were applied:
• Cronbach’s Alpha coefficient [4] to check the reliability of the additive scales used to measure the
level of difficulty of the decision-maker during the phases of decision-making. All of the scales used
to measure the difficulties in the Intelligence Phase (α=0.7775), Design Phase (α=0.8473), and
Choice Phase (α=0.8033), and the overall (α=0.9202) decision-making process, were reliable.
• Student’s t test [12, 25, 18] to compare the average difficulty scores of the groups with or
without IDSS (in the Intelligence, Design and Choice Phases and the overall difficulty).

22
• Mann-Whitney’s U test [20] to compare the distribution of the difficulty scores of the groups with
or without IDSS.
5.2 - Involvement of the participants in the experiment
One of the disadvantages of experimental research in social science is its artificiality. However, it was
observed during the experiment, that the participants became actively involved in the situations proposed by
the text-case. The variables connected to this refer to the intensity with which the participants played the roles
of managers during the experiment (Appendix A, Item 2.18), and if he or she could embody the problems
confronted by industry (Item 2.19), according to the text-case. Figure 3 presents the average score of both
items.
Involvement of the participants in the experiment
5.88
5.82
5.76
1 2 3 4 5 6 7
Average with IDSS
Average without IDSS
Average both groups
Figure 3 - Involvement of participants
(not involved at all 1 7 very much involved)
Considering the small difference between the averages of the two groups with and without the IDSS
(5.76 and 5.88), we conclude there was a satisfactory level of involvement in both groups.

23
5.3 - The impact of IDSS in the decision-making phases
In this subsection, we present the average aggregate scores of each phase of decision-making and
compare them for the groups with or without IDSS. For the sake of completeness, we also present the
average scores of each variable related to the phases of decision-making.
5.3.1 - Intelligence Phase
Figure 4 presents the comparison between the groups in terms of the overall score in the intelligence
phase.
Intelligence Phase
4.41
5.89
1 2 3 4 5 6 7
Average with IDSS
Average without IDSS
Figure 4 - Overall average scores in the Intelligence Phase ( t = 8.96 p = 0.000)
(more perceived difficulties 1 7 less perceived difficulties)
The difference of the perceived difficulties in the Intelligence Phase between the IDSS group and the
control group is significant. The IDSS group found it easier to conceive and develop the situation proposed by
the case. The result suggests that the IDSS user interface facilitates the understanding of the situation since it
shows both historically and graphically all variables affecting the performance of the company. The interface
also displays the relationship and the diagram of influences among the variables. Therefore, it is easy to set
objectives for simulation (taking action on prices, profit margin, production, and so on). Table 2 presents the
average scores of each indicator related to the Intelligence Phase.
Indicators With IDSS Without IDSS U p x s x s 2.1 - Perception of the problem 6.00 1.08 4.90 1.07 94.00 0.0031 2.2 - Delimitation of the problem 5.35 0.93 3.80 0.95 59.50 0.0001 2.3 - Urgency of the problem 5.70 1.08 5.10 1.12 128.00 0.0400 2.4 - Context of the company 6.00 1.21 4.50 1.28 70.00 0.0003 2.5 - Importance of the decision 6.50 0.76 5.40 0.88 72.00 0.0003 2.6 - Quantity of information supplied 5.55 1.00 3.45 1.54 63.00 0.0001 2.7 - Quality of the information supplied 6.15 1.18 3.75 1.65 47.50 0.0000
Table 2 - Intelligence Phase Indicators

24
We can observe that using IDSS produces a significant difference in all variables or indicators. The smallest difference (p=0.04) was obtained for the indicator corresponding to the urgency of the problem, the average scores for both groups being high in the 7 point likert scale (5.70 for the IDSS group and 5.10 for the control group). These values may be due to the way the experiment was carried out, since the groups should strictly respect the time limit (45 min) set for decision-making. The facilitators were instructed to compel the groups to meet the deadline using arguments stressing the urgency of the decision-making.
5.3.2 - Design Phase
Figure 5 presents the comparison between the groups in terms of the overall score in this phase.
Design Phase
5.99
3.95
1 2 3 4 5 6 7
Average with IDSS
Average without IDSS
Figure 5 - Overall average scores in the Design Phase ( t = 8.94 p = 0.000)
(more perceived difficulties 1 7 less perceived difficulties)
The difference of the perceived difficulties in the Design Phase between the IDSS group and the
control group is significant. The IDSS group found it easier to design the situation proposed by the case. The
result suggests that the IDSS user-interface facilitates the generation of alternative scenarios and their
evaluations. Table 3 presents the average scores of each indicator related to the Design Phase.
Indicators With IDSS Without IDSS U p
x s x s 2.8 - Generation of alternatives 6.15 0.99 4.30 1.45 57.50 0.0001 2.9 - Presentation of alternatives 6.05 1.00 4.10 1.02 39.00 0.0000 2.10 - Evaluation of alternatives 5.95 1.28 4.25 1.02 60.00 0.0001 2.11 - Conception of strategies 5.40 1.23 3.85 0.87 59.00 0.0001 2.12 - Time to solve the problem 6.40 0.94 3.25 1.80 31.50 0.0000
Table 3- Design Phase Indicators As observed in the Intelligence Phase, all indicators of the Design Phase present a significant
difference between the two groups. Particularly the indicator referring to the perceived difficulties in the
generation of alternatives showed a great difference between the IDSS group average (6.15) and the control
group average (4.30) with U=57.5 and p=0.0001. In fact, the average number of alternatives generated by
the IDSS group was 6.65, twice as many as the 3.05 average for the control group (Figure 6). The system

25
offers an option in the main screen allowing the participant to easily generate new scenarios.

26
Number of Alternatives generatedin the Design Phase
3.05
6.65
0 1 2 3 4 5 6 7 8
Average with IDSS (s = 1.27)
Average without IDSS(s = 0.89)
Figure 6 - Average number of alternatives generated in the Design Phase ( t = 10.40 p = 0.000)
It is worth noticing how long each group took to generate the first alternative. The IDSS group took
13 minutes while the control group spent 25 minutes, on average. Table 4 shows the corresponding figures for
the first three scenarios. In general, using IDSS reduces by half the time to generate each scenario. The
figures depicted give a hint of the learning pattern of generating scenarios: each new scenario takes less time
than the previous one, independently of the system being used.
Group 1st scenario 2nd scenario 3rd scenario Total for 3 scenarios
With IDSS 13 min. 5 min. 4 min. 22 min.
Without IDSS 25 min. 12 min. 8 min. 45 min.
Table 4 - Average amount of time spent in the generation of up to 3 alternatives in the Design Phase
These differences indicate, not only that the IDSS group had less difficulty in generating the first
scenario, but also that the functioning of the system possesses a low degree of complexity, as the participants
were able to understand its operation in a short period of time. It is believed that the functions of the system
responsible for simplifying the elaboration of scenarios were Basic Scenario and Reference. The IDSS group
made use of these functions, thus facilitating the setting of the variables.
27
5.3.3 - Choice Phase
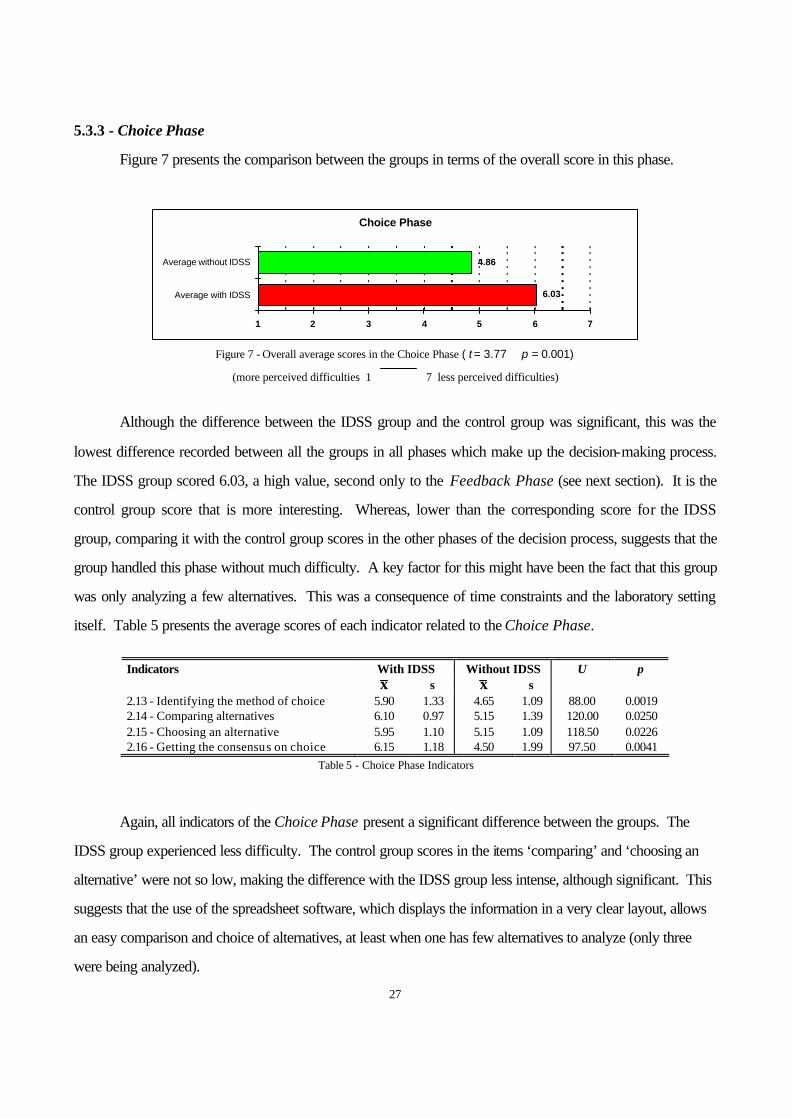
Figure 7 presents the comparison between the groups in terms of the overall score in this phase.
Choice Phase
4.86
6.03
1 2 3 4 5 6 7
Average with IDSS
Average without IDSS
Figure 7 - Overall average scores in the Choice Phase ( t = 3.77 p = 0.001)
(more perceived difficulties 1 7 less perceived difficulties)
Although the difference between the IDSS group and the control group was significant, this was the
lowest difference recorded between all the groups in all phases which make up the decision-making process.
The IDSS group scored 6.03, a high value, second only to the Feedback Phase (see next section). It is the
control group score that is more interesting. Whereas, lower than the corresponding score for the IDSS
group, comparing it with the control group scores in the other phases of the decision process, suggests that the
group handled this phase without much difficulty. A key factor for this might have been the fact that this group
was only analyzing a few alternatives. This was a consequence of time constraints and the laboratory setting
itself. Table 5 presents the average scores of each indicator related to the Choice Phase.
Indicators With IDSS Without IDSS U p x s x s
2.13 - Identifying the method of choice 5.90 1.33 4.65 1.09 88.00 0.0019 2.14 - Comparing alternatives 6.10 0.97 5.15 1.39 120.00 0.0250 2.15 - Choosing an alternative 5.95 1.10 5.15 1.09 118.50 0.0226 2.16 - Getting the consensus on choice 6.15 1.18 4.50 1.99 97.50 0.0041
Table 5 - Choice Phase Indicators
Again, all indicators of the Choice Phase present a significant difference between the groups. The
IDSS group experienced less difficulty. The control group scores in the items ‘comparing’ and ‘choosing an
alternative’ were not so low, making the difference with the IDSS group less intense, although significant. This
suggests that the use of the spreadsheet software, which displays the information in a very clear layout, allows
an easy comparison and choice of alternatives, at least when one has few alternatives to analyze (only three
were being analyzed).

28
5.3.4 - Review phase (and Feedback)
The Review Phase was measured differently from the difficulties related to other phases. It was
measured directly from the perception of the decision-makers using the questionnaire. After the first decision
had been made by the groups, new information was supplied (such as “machine 1 has just broken”), thus
forcing them to generate a new set of alternatives in a similar way to what happened in the Design Phase. We
used the number of alternatives generated in the new situation and the time to generate the first two of the
alternatives to measure the degree of difficulty to process new information. Figure 8 and Table 6 present the
results obtained.
Number of Alternatives generatedin the Review Phase
2.70
4.70
1 2 3 4 5
Average with IDSS(s = 1.27)
Average without IDSS(s = 0.89)
Figure 8 - Average number of alternatives generated in the Review Phase (t = 7.07 p = 0.000)
Group 1st scenario 2nd scenario Total for 2 scenarios
With IDSS 9 min. 4 min. 13 min.
Without IDSS 20 min. 9 min. 29 min.
Table 6 - Average amount of time spent in the generation of up to 2 alternatives in the Review Phase
The average number of alternatives generated by the IDSS group (4.70) was higher than the control
group (2.70). Considering the time spent to generate the first two alternatives, a large difference is also
observed.
The facility offered by the IDSS system in the conception of new scenarios is believed to have greatly
helped the handling of new information aggregated to the process. The functions Reference and Show Basic
Scenario may also have contributed to the observed difference.

29
5.4 - The global impact of the IDSS on the decision-making process
In order to test the impact of the IDSS on the decision-making process as a whole, all indicators were
aggregated to produce an overall score. Figure 9 shows the results, demonstrating that, while facing the
decision situation, the IDSS group perceived less difficulties than the control group.
Overall Decision-making process
4.37
5.97
1 2 3 4 5 6 7
Average with IDSS
Average without IDSS
Figure 9 - Overall average scores in the Decision-Making Process (t = 9.39 p = 0.000)
(more perceived difficulties 1 7 less perceived difficulties)
The results allow us to conclude, as might be expected, that IDSS helped to reduce the difficulties of
the decision-maker over the decision-making process. Therefore, IDSS can be claimed to be a decision-
making support tool that facilitates and streamlines the decision-making process as a whole.
6. Concluding remarks
6.1 - The bottom line: IDSS relieves the decision-maker's difficulties
The global analysis done in the previous section shows the main results and contributions of this study.
To study the impact of IDSS on the reduction of the decision-maker's difficulties, a laboratory experiment was
conducted, based on Simon’s pattern (Intelligence, Design, Choice and Review Phases, and Feedback).
Forty persons were gathered 40 and divided into experimental and control groups. It was verified that IDSS
contributed globally to diminish the decision-maker's difficulties.
The perceived difficulties of the IDSS group were very small in all phases of the decision-making
process, compared to the group that did not use IDSS. As a matter of fact, on a scale of 1 to 7, ranging from
most difficult to least difficult, IDSS group averages were around 6, while control group averages were around
4.5.
The IDSS as a decision support tool, may help managers to propose alternatives and to make
decisions, facilitating the decision-making process, either individually or in a group. For instance, managers

30
may get together and use IDSS to help them collectively to grasp a specific situation, as was done in the
experiment. Alternatively, although not done in the experiment, a particular scenario may be sent from a
manager to others through electronic-mail, allowing them to work on the same cases, thus offering better
conditions for further discussion. The use of IDSS by managers could speed up and improve the decision-
making process within organizations.
6.2 - The study-case and the system design as a ‘learning’ tool
A by-product that comes up from this work is the case and the IDSS itself (Section 4), allowing
someone to create a management game. Such a management game could be used for academic study or for
management training. Considering the results a posteriori the IDSS may not have a special impact, interest or
value to the IS community. Maybe the main contribution of this study is the process of definition of the
situation and the design of the system. We should insist that the result we obtained was obvious, as some IS
researchers and even some IS professionals will quickly conclude. But it was a posteriori. However, what the
decision-making theories explain (DSS improves decision-making process) is not what the scientists point out
in many studies, as we can read in Todd & Benbasat [27]: so, even the obvious, as we pointed out, has value!
Overall, this experience allows us to point out a way or ‘method’ to teach business students and
managers the process of conceiving a case or problem solution, in order to help them to define and design a
specific information system or application, or, by taking the reported case as an example, to help teachers to
show them the importance of the using of IT (information technology). The enterprise situation described in
Subsection 4.1 could be used by students or managers without any IT, or with a software package like
ACCESS®, EXCEL®, or another. This idea of building scenarios could also be useful to show people, in
practical terms, the difference between a spreadsheet (Excel®) and a database (Access®).
6.3 - Limitations and perspectives for further research
As in any research, this study has certain limitations. First, the IDSS was developed as a prototype for
a specific (and real) situation in a particular company. Although it was used in the experiment, this does not
make it a general system outside of that environment. In addition, a prototype is never completed, and the
users might expect something that it cannot offer. Second, a lab experiment, in spite of all advantages, has at
least two basic weaknesses [14]: (a) its artificiality, given that the experiment was conducted in a contrived
environment; and (b) the lack of generalizability. For instance, the participants in the experiment were all

31
graduate and undergraduate students.
32
Despite the limitations, we believe it is important to continue researching the impact and the
contribution of Decision Support Systems (DSS) for the decision-making process. Following the research
directions outlined in this study, other work could be developed, such as: (a) replication of the experiment
using other DSS; (b) observation of the influence of a DSS in a real situation; and (c) introduction of new
factors in the experiment, such as pressure for decision, studying the performance of the decision-makers.
REFERENCES
01. AHO, A. V. ; HOPCROFT, J.E. & ULLMAN, J. D. Data Structures and Algorithms. Reading: Addison-Wesley, 1983. 427pp.
02. BOURGEOIS, L. J. ; EISENHARDT, K. Strategic decision processes in high velocity environments: four cases in the microcomputer industry . Management Science, 34, 7 (1988), 816-835
03. CAMPBELL, D. T. ; STANLEY, J. C. Experimental and quasi-experimental designs for research. Chicago: Rand McNally, 1966.
04. CRONBACH, L. J. Psychological tests and personnel decisions . University of Illinois Press, 1957. 165pp.
05. EVANS, G. E. & RIHA, J. R. Assessing DSS effectiveness using evaluation research methods. Information & management, 16 (1989), 197-206
06. FREITAS, H. M. R. A informação como ferramenta gerencial (Information as a Managenent Tool). Porto Alegre/Brazil: Ortiz Ed., 1993. 355pp.
07. FREITAS, H. M. R. & KLADIS, C. M. O processo decisório: modelos e dificuldades (The decision process: models and difficulties). Revista Decidir, II, 8 (March 1995), 30-34
08. FREITAS, H. M. R. & KLADIS, C. M. Da informação à política informacional das organizações: um quadro conceitual (From the information itself to an information strategy for the organizations). RAP/FGV, 29, 3 (July-Sept 1995), 73-86
09. FREITAS, H. M. R. & KLADIS, C. M. Os sistemas de apoio à decisão - SAD (The Decision Support Systems (DSS). Revista Decidir, II, 12 (July 1995), 22-28
10. FREITAS, H. M. R. ; KLADIS, C. M. & BECKER, J. L. Verificação do impacto de um SAD na redução das dificuldades do decisor: um delineamento experimental (com grupos ad hoc) em laboratório (Evaluation of a DSS impact on the reduction of the decision-maker difficulties: a lab experimental design with ad hoc groups). Anais do 19º ENANPAD, 1, 4, Administração da Informação (Sept. 1995), 105-133
11. GARDNER, C. L., MARSDEN, J. R. & PINGRY, D. E. The design and use of laboratory experiments for DSS evaluation. DSS - Decision Support Systems, 9, 4 (June 1993), 369-379
12. KAZMIER, L. J. Basic statistics for business and economics . NY: McGraw-Hill, 1979. 457pp.
13. KENDALL, K. E. & KENDALL, J. E. Systems analysis and design. Englewood Cliffs: Prentice-Hall, 1988.
14. KERLINGER, F. N. Foundations of behavioral research. New York: Holt, Rinehart and Winston, 1973. 741pp.
15. KERLINGER, F. N. Behavioral research - a conceptual approach. NY: Holt, Rinehart and Winston, 1979.
16. KLADIS, C. M. Concepção e desenvolvimento de um sistema de apoio à decisão (SAD) e verificação de seu impacto na redução das dificuldades do decisor: um delineamento experimental em laboratório (Design and development of a DSS and evaluation of its impact on the reduction of the decision-maker difficulties: a lab experimental design).- Porto Alegre/Brazil, M.Sc. thesis, PPGA - UFRGS, Dec. 1994, 170pp.
17. LIKERT, R. The human organization, its management and value. New York: McGraw-Hill, 1967.
18. MATTAR, F. N. Pesquisa de Marketing (Marketing research). São Paulo: Atlas, 1993. v.1, 350pp., v.2, 225pp.

33
19. SELLTIZ, C. ; JAHODA, M. ; DEUTSCH, M. & COOK, S. Research Methods in Social Relations. New York: Holt, Rinehart and Winston, 1951.
20. SIEGEL, S. Nonparametric statistics for the behavioral sciences . New York: McGraw-Hill, 1956.
21. SILVER, M. S. Systems that support decision makers: description and anlysis. N. York: J. Wiley, 1991. 254pp.
22. SIMON, H. A. Administrative behavior: a study of decision-making processes in administrative organization. New York: MacMillan, 1947. 259pp.
23. IMON, H. A. The shape of automation: a psychological analysis of conflict, choice and commitment. New York: Macmillan, 1977.
24. SIMON, H. A. The new science of management decision. New York: Harper & Row, 1977.
25. STEVENSON, W.J. Business Statistics: Concepts and Applications . New York: Harper & Row, 1978.
26. TE'ENI, D. Proccess feedback on Decision Support Systems. Accounting, management and information technology, 2 (1992), 1-18
27. TODD, P. & BENBASAT, I. The use of information in decision-making: an experimental investigation of the impact of computer-based decision aids. MIS Quarterly, 16 (3), Sept. 1992, 373-393
28. ZACHARY, W. W. Decision Support Systems: designing to extend the cognitive limits. Amsterdam: HCI - Human-Computer Interaction, North Holland, 1988, 997-1030
34
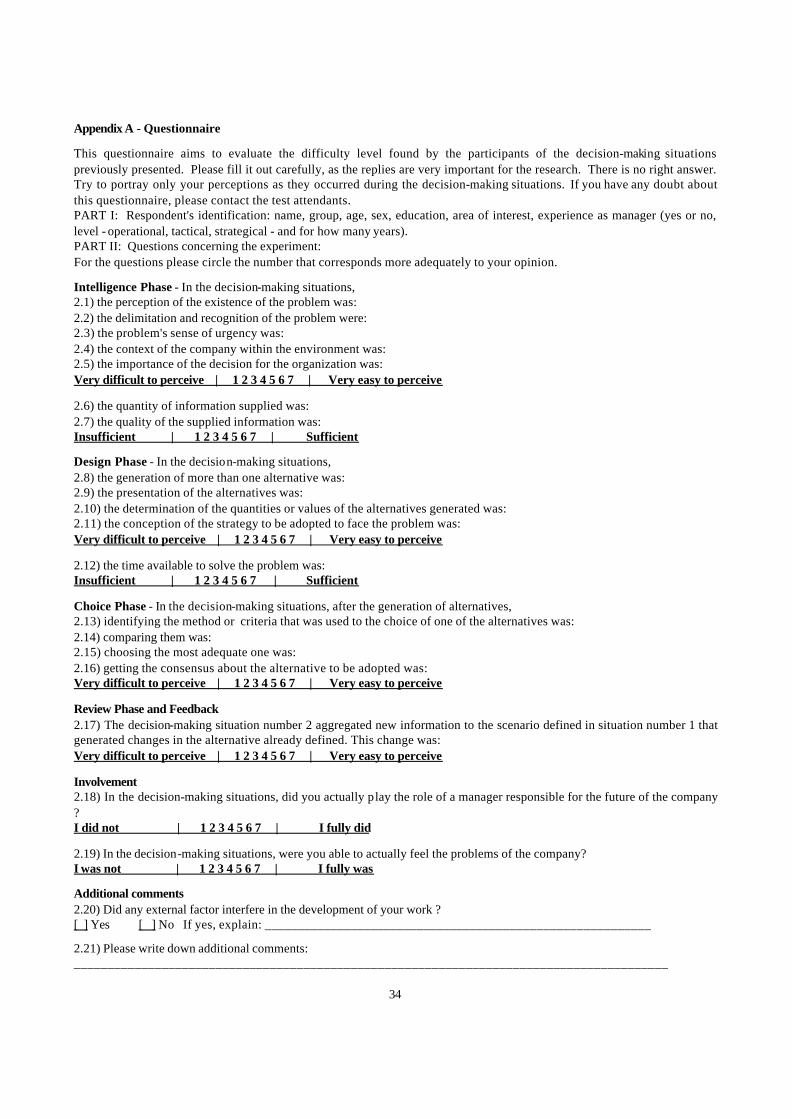
Appendix A - Questionnaire
This questionnaire aims to evaluate the difficulty level found by the participants of the decision-making situations previously presented. Please fill it out carefully, as the replies are very important for the research. There is no right answer. Try to portray only your perceptions as they occurred during the decision-making situations. If you have any doubt about this questionnaire, please contact the test attendants. PART I: Respondent's identification: name, group, age, sex, education, area of interest, experience as manager (yes or no, level - operational, tactical, strategical - and for how many years). PART II: Questions concerning the experiment: For the questions please circle the number that corresponds more adequately to your opinion.
Intelligence Phase - In the decision-making situations, 2.1) the perception of the existence of the problem was: 2.2) the delimitation and recognition of the problem were: 2.3) the problem's sense of urgency was: 2.4) the context of the company within the environment was: 2.5) the importance of the decision for the organization was: Very difficult to perceive | 1 2 3 4 5 6 7 | Very easy to perceive
2.6) the quantity of information supplied was: 2.7) the quality of the supplied information was: Insufficient | 1 2 3 4 5 6 7 | Sufficient
Design Phase - In the decision-making situations, 2.8) the generation of more than one alternative was: 2.9) the presentation of the alternatives was: 2.10) the determination of the quantities or values of the alternatives generated was: 2.11) the conception of the strategy to be adopted to face the problem was: Very difficult to perceive | 1 2 3 4 5 6 7 | Very easy to perceive
2.12) the time available to solve the problem was: Insufficient | 1 2 3 4 5 6 7 | Sufficient
Choice Phase - In the decision-making situations, after the generation of alternatives, 2.13) identifying the method or criteria that was used to the choice of one of the alternatives was: 2.14) comparing them was: 2.15) choosing the most adequate one was: 2.16) getting the consensus about the alternative to be adopted was: Very difficult to perceive | 1 2 3 4 5 6 7 | Very easy to perceive
Review Phase and Feedback 2.17) The decision-making situation number 2 aggregated new information to the scenario defined in situation number 1 that generated changes in the alternative already defined. This change was: Very difficult to perceive | 1 2 3 4 5 6 7 | Very easy to perceive
Involvement 2.18) In the decision-making situations, did you actually play the role of a manager responsible for the future of the company ? I did not | 1 2 3 4 5 6 7 | I fully did
2.19) In the decision-making situations, were you able to actually feel the problems of the company? I was not | 1 2 3 4 5 6 7 | I fully was
Additional comments 2.20) Did any external factor interfere in the development of your work ? [ ] Yes [ ] No If yes, explain: __________________________________________________________
2.21) Please write down additional comments: ________________________________________________________________________________________
Related Documents