Using digital image processing for counting whiteflies on soybean leaves ☆ Jayme Garcia Arnal Barbedo Embrapa Agricultural Informatics, Av. André Tosello, 209-Barão Geraldo, C.P. 6041, 13083-886 Campinas, SP, Brazil abstract article info Article history: Received 10 February 2014 Revised 26 June 2014 Accepted 28 June 2014 Available online 8 July 2014 Keywords: Digital image processing Whiteflies Soybean leaves Counting This paper presents a new system, based on digital image processing, to quantify whiteflies on soybean leaves. This approach allows counting to be fully automated, considerably speeding up the process in comparison with the manual approach. The proposed algorithm is capable of detecting and quantifying not only adult white- flies, but also specimens in the nymph stage. A complete performance evaluation is presented, with emphasis on the conditions and situations for which the algorithm succeeds, and also on the circumstances that need further work. Although this proposal was entirely developed using soybean leaves, it can be easily extended to other kinds of crops with little or no changes in the algorithm. The system employs only widely used image processing operations, so it can be easily implemented in any image processing software package. © 2014 Korean Society of Applied Entomology, Taiwan Entomological Society and Malaysian Plant Protection Society. Published by Elsevier B.V. All rights reserved. Introduction The whitefly is a small insect that feeds from the sap of a wide variety of plants (Flint, 2002). According to Martin and Mound (2007), there are more than 1500 identified species of whiteflies. This is one of the main pests that affect agriculture, with damages coming both from sap loss and from the transmission of a variety of diseases carried by the whiteflies. In order to reduce the losses caused by whiteflies, two kinds of ac- tions are normally carried out: 1) monitoring crops in order to detect infestations as soon as possible, so control measures can be implement- ed more effectively; 2) research on more effective means to monitor crops and control the pest. In both cases, counting the number of insects (nymphs and adults) is a fundamental part of the process. The most direct way of measuring whitefly infestation is to manually identify and count the insects inside a selected region. In general, this approach does not require sophisticated apparatus and, more impor- tantly, relies on the remarkable human ability to resolve ambiguities and unclear situations, even under far from ideal conditions. On the other hand, human beings are susceptible to physiological and psycho- logical phenomena that may be important sources of error: fatigue, vi- sual illusions, boredom, among others. Also, humans are usually much slower than machines in performing simple tasks like counting. Two main strategies for automatically counting whiteflies can be found in the literature, one using sticky traps, and the other using plant leaves directly. The first strategy employs a trap consisting of a piece of paper contain- ing a sticky substance (Boissard et al., 2008), which is placed in the green- house or field. Then, the insects caught by the trap are counted. The advantage of this approach is that it provides a smooth and neutral sur- face, making the counting easier. On the other hand, only specimens capa- ble of flying are captured, which implies that insects in the early stages of development (nymphs) are not taken into account. The method proposed by Cho et al. (2007) explores size and color features to identify and count whiteflies, aphids and thrips, using color transformations, simple mathe- matical morphology operations, and thresholding. Boissard et al. (2008) proposed a cognitive vision system that combines image processing, neural learning and knowledge-based techniques to detect and count pests. Following this system, Martin et al. (2011) proposed a video camera network for detecting and counting whiteflies and aphids, with the objec- tive of reducing the amount of pesticides used in greenhouse crops; the detection is based on visual cues like size, shape and color. Video cameras were also used by Bechar and Moisan (2010) to count whiteflies; the insects are identified by means of a sophisticated parametric approach, which employs techniques like Mixture-of-Gaussians and Principal Component Analysis to extract small spots present on the scene. In the second strategy, the count is performed directly on the leaves, which may or may not be removed from the plant. In this case, non- flying individuals (nymphs and eggs) may be taken into consideration. The drawback is that imperfections, lesions and veins present in the leaves may hamper the count by mimicking or concealing the objects of interest (insects). Huddar et al. (2012) proposed a method capable of counting insects not only in greenhouses, but also in open farms; the algorithm has four steps: color conversion, segmentation based on the relative difference in pixel intensities, noise reduction by erosion, and counting based on Moore neighbor tracing and Jacob's stopping Journal of Asia-Pacific Entomology 17 (2014) 685–694 ☆ This work was funded by the Brazilian Agricultural Research Corporation, under grant n. 03.12.01.002.00.00. E-mail address: [email protected]. http://dx.doi.org/10.1016/j.aspen.2014.06.014 1226-8615/© 2014 Korean Society of Applied Entomology, Taiwan Entomological Society and Malaysian Plant Protection Society. Published by Elsevier B.V. All rights reserved. Contents lists available at ScienceDirect Journal of Asia-Pacific Entomology journal homepage: www.elsevier.com/locate/jape

Welcome message from author
This document is posted to help you gain knowledge. Please leave a comment to let me know what you think about it! Share it to your friends and learn new things together.
Transcript
Journal of Asia-Pacific Entomology 17 (2014) 685–694
Contents lists available at ScienceDirect
Journal of Asia-Pacific Entomology
j ourna l homepage: www.e lsev ie r .com/ locate / jape
Using digital image processing for counting whiteflies onsoybean leaves☆
Jayme Garcia Arnal BarbedoEmbrapa Agricultural Informatics, Av. André Tosello, 209-Barão Geraldo, C.P. 6041, 13083-886 Campinas, SP, Brazil
☆ This workwas funded by the Brazilian Agricultural Ren. 03.12.01.002.00.00.
E-mail address: [email protected].
http://dx.doi.org/10.1016/j.aspen.2014.06.0141226-8615/© 2014 Korean Society of Applied Entomolo
a b s t r a c t
a r t i c l e i n f oArticle history:Received 10 February 2014Revised 26 June 2014Accepted 28 June 2014Available online 8 July 2014
Keywords:Digital image processingWhitefliesSoybean leavesCounting
This paper presents a new system, based on digital image processing, to quantify whiteflies on soybean leaves.This approach allows counting to be fully automated, considerably speeding up the process in comparisonwith themanual approach. The proposed algorithm is capable of detecting and quantifying not only adult white-flies, but also specimens in the nymph stage. A complete performance evaluation is presented, with emphasis onthe conditions and situations for which the algorithm succeeds, and also on the circumstances that need furtherwork. Although this proposal was entirely developed using soybean leaves, it can be easily extended to otherkinds of crops with little or no changes in the algorithm. The system employs onlywidely used image processingoperations, so it can be easily implemented in any image processing software package.© 2014 Korean Society of Applied Entomology, Taiwan Entomological Society and Malaysian Plant Protection
Society. Published by Elsevier B.V. All rights reserved.
Introduction
The whitefly is a small insect that feeds from the sap of a wide varietyof plants (Flint, 2002). According to Martin and Mound (2007), there aremore than 1500 identified species of whiteflies. This is one of the mainpests that affect agriculture, with damages coming both from sap lossand from the transmission of a variety of diseases carried by thewhiteflies.
In order to reduce the losses caused by whiteflies, two kinds of ac-tions are normally carried out: 1) monitoring crops in order to detectinfestations as soon as possible, so control measures can be implement-ed more effectively; 2) research on more effective means to monitorcrops and control the pest. In both cases, counting the number of insects(nymphs and adults) is a fundamental part of the process.
Themost directway ofmeasuringwhitefly infestation is tomanuallyidentify and count the insects inside a selected region. In general, thisapproach does not require sophisticated apparatus and, more impor-tantly, relies on the remarkable human ability to resolve ambiguitiesand unclear situations, even under far from ideal conditions. On theother hand, human beings are susceptible to physiological and psycho-logical phenomena that may be important sources of error: fatigue, vi-sual illusions, boredom, among others. Also, humans are usually muchslower than machines in performing simple tasks like counting.
Two main strategies for automatically counting whiteflies can befound in the literature, one using sticky traps, and the other usingplant leaves directly.
search Corporation, under grant
gy, Taiwan Entomological Society an
Thefirst strategy employs a trap consisting of a piece of paper contain-ing a sticky substance (Boissard et al., 2008), which is placed in the green-house or field. Then, the insects caught by the trap are counted. Theadvantage of this approach is that it provides a smooth and neutral sur-face,making the counting easier. On theother hand, only specimens capa-ble of flying are captured, which implies that insects in the early stages ofdevelopment (nymphs) are not taken into account. Themethodproposedby Cho et al. (2007) explores size and color features to identify and countwhiteflies, aphids and thrips, using color transformations, simple mathe-matical morphology operations, and thresholding. Boissard et al. (2008)proposed a cognitive vision system that combines image processing,neural learning and knowledge-based techniques to detect and countpests. Following this system,Martin et al. (2011) proposed a video cameranetwork for detecting and countingwhiteflies and aphids,with the objec-tive of reducing the amount of pesticides used in greenhouse crops; thedetection is based on visual cues like size, shape and color. Video cameraswere also used by Bechar and Moisan (2010) to count whiteflies; theinsects are identified by means of a sophisticated parametric approach,which employs techniques like Mixture-of-Gaussians and PrincipalComponent Analysis to extract small spots present on the scene.
In the second strategy, the count is performed directly on the leaves,which may or may not be removed from the plant. In this case, non-flying individuals (nymphs and eggs) may be taken into consideration.The drawback is that imperfections, lesions and veins present in theleaves may hamper the count by mimicking or concealing the objectsof interest (insects). Huddar et al. (2012) proposed a method capableof counting insects not only in greenhouses, but also in open farms;the algorithm has four steps: color conversion, segmentation based onthe relative difference in pixel intensities, noise reduction by erosion,and counting based on Moore neighbor tracing and Jacob's stopping
d Malaysian Plant Protection Society. Published by Elsevier B.V. All rights reserved.
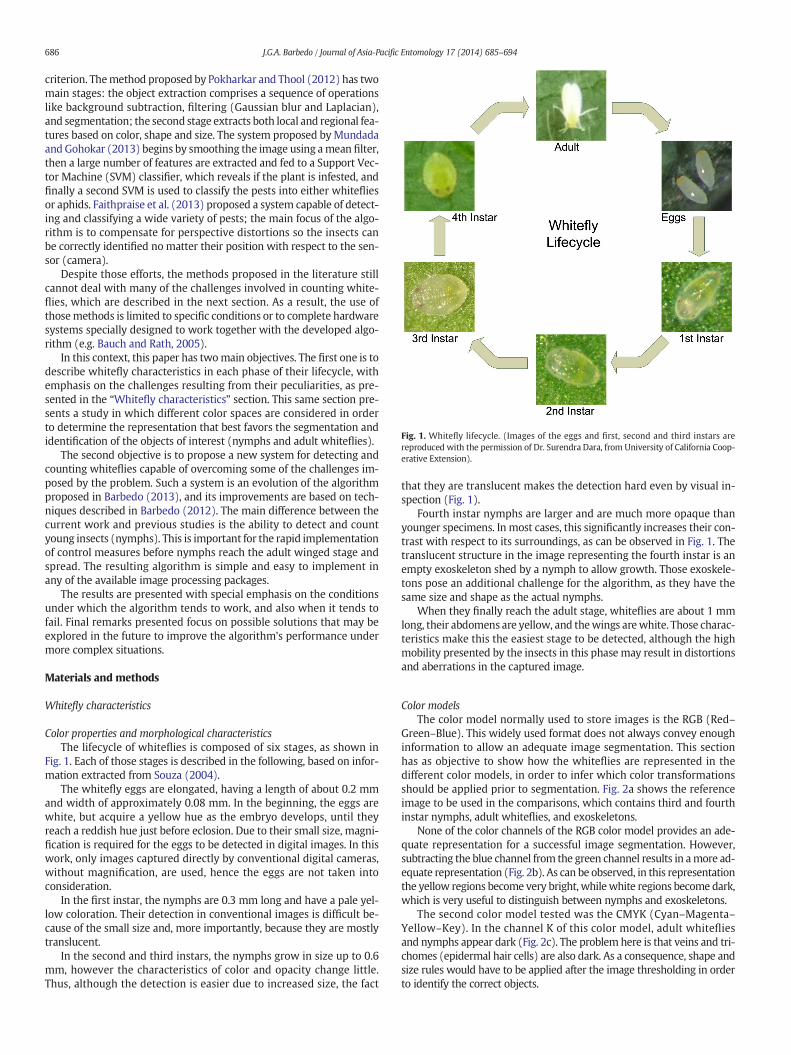
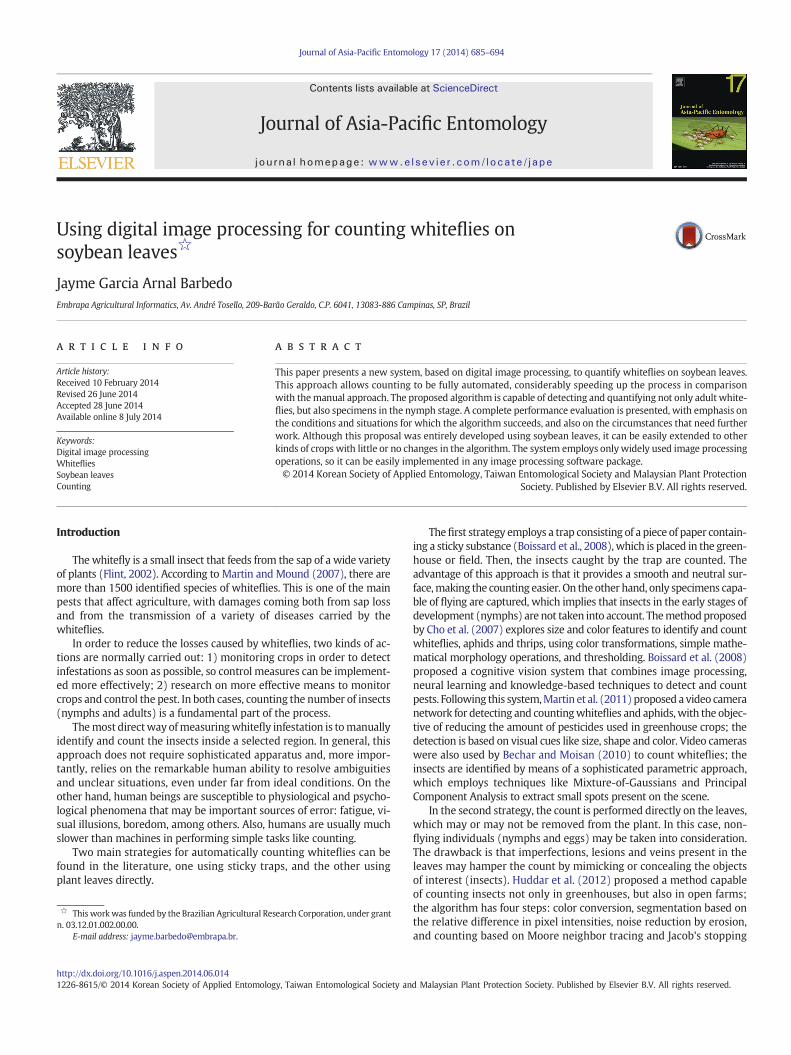
Fig. 1. Whitefly lifecycle. (Images of the eggs and first, second and third instars arereproduced with the permission of Dr. Surendra Dara, from University of California Coop-erative Extension).
686 J.G.A. Barbedo / Journal of Asia-Pacific Entomology 17 (2014) 685–694
criterion. Themethod proposed by Pokharkar and Thool (2012) has twomain stages: the object extraction comprises a sequence of operationslike background subtraction, filtering (Gaussian blur and Laplacian),and segmentation; the second stage extracts both local and regional fea-tures based on color, shape and size. The system proposed byMundadaand Gohokar (2013) begins by smoothing the image using amean filter,then a large number of features are extracted and fed to a Support Vec-tor Machine (SVM) classifier, which reveals if the plant is infested, andfinally a second SVM is used to classify the pests into either whitefliesor aphids. Faithpraise et al. (2013) proposed a system capable of detect-ing and classifying a wide variety of pests; the main focus of the algo-rithm is to compensate for perspective distortions so the insects canbe correctly identified no matter their position with respect to the sen-sor (camera).
Despite those efforts, the methods proposed in the literature stillcannot deal with many of the challenges involved in counting white-flies, which are described in the next section. As a result, the use ofthosemethods is limited to specific conditions or to complete hardwaresystems specially designed to work together with the developed algo-rithm (e.g. Bauch and Rath, 2005).
In this context, this paper has twomain objectives. The first one is todescribe whitefly characteristics in each phase of their lifecycle, withemphasis on the challenges resulting from their peculiarities, as pre-sented in the “Whitefly characteristics” section. This same section pre-sents a study in which different color spaces are considered in orderto determine the representation that best favors the segmentation andidentification of the objects of interest (nymphs and adult whiteflies).
The second objective is to propose a new system for detecting andcounting whiteflies capable of overcoming some of the challenges im-posed by the problem. Such a system is an evolution of the algorithmproposed in Barbedo (2013), and its improvements are based on tech-niques described in Barbedo (2012). The main difference between thecurrent work and previous studies is the ability to detect and countyoung insects (nymphs). This is important for the rapid implementationof control measures before nymphs reach the adult winged stage andspread. The resulting algorithm is simple and easy to implement inany of the available image processing packages.
The results are presented with special emphasis on the conditionsunder which the algorithm tends to work, and also when it tends tofail. Final remarks presented focus on possible solutions that may beexplored in the future to improve the algorithm's performance undermore complex situations.
Materials and methods
Whitefly characteristics
Color properties and morphological characteristicsThe lifecycle of whiteflies is composed of six stages, as shown in
Fig. 1. Each of those stages is described in the following, based on infor-mation extracted from Souza (2004).
The whitefly eggs are elongated, having a length of about 0.2 mmand width of approximately 0.08 mm. In the beginning, the eggs arewhite, but acquire a yellow hue as the embryo develops, until theyreach a reddish hue just before eclosion. Due to their small size, magni-fication is required for the eggs to be detected in digital images. In thiswork, only images captured directly by conventional digital cameras,without magnification, are used, hence the eggs are not taken intoconsideration.
In the first instar, the nymphs are 0.3 mm long and have a pale yel-low coloration. Their detection in conventional images is difficult be-cause of the small size and, more importantly, because they are mostlytranslucent.
In the second and third instars, the nymphs grow in size up to 0.6mm, however the characteristics of color and opacity change little.Thus, although the detection is easier due to increased size, the fact
that they are translucent makes the detection hard even by visual in-spection (Fig. 1).
Fourth instar nymphs are larger and are much more opaque thanyounger specimens. In most cases, this significantly increases their con-trast with respect to its surroundings, as can be observed in Fig. 1. Thetranslucent structure in the image representing the fourth instar is anempty exoskeleton shed by a nymph to allow growth. Those exoskele-tons pose an additional challenge for the algorithm, as they have thesame size and shape as the actual nymphs.
When they finally reach the adult stage, whiteflies are about 1 mmlong, their abdomens are yellow, and thewings arewhite. Those charac-teristics make this the easiest stage to be detected, although the highmobility presented by the insects in this phase may result in distortionsand aberrations in the captured image.
Color modelsThe color model normally used to store images is the RGB (Red–
Green–Blue). This widely used format does not always convey enoughinformation to allow an adequate image segmentation. This sectionhas as objective to show how the whiteflies are represented in thedifferent color models, in order to infer which color transformationsshould be applied prior to segmentation. Fig. 2a shows the referenceimage to be used in the comparisons, which contains third and fourthinstar nymphs, adult whiteflies, and exoskeletons.
None of the color channels of the RGB color model provides an ade-quate representation for a successful image segmentation. However,subtracting the blue channel from the green channel results in amore ad-equate representation (Fig. 2b). As can be observed, in this representationthe yellow regions become very bright, whilewhite regions become dark,which is very useful to distinguish between nymphs and exoskeletons.
The second color model tested was the CMYK (Cyan–Magenta–Yellow–Key). In the channel K of this color model, adult whitefliesand nymphs appear dark (Fig. 2c). The problem here is that veins and tri-chomes (epidermal hair cells) are also dark. As a consequence, shape andsize rules would have to be applied after the image thresholding in orderto identify the correct objects.
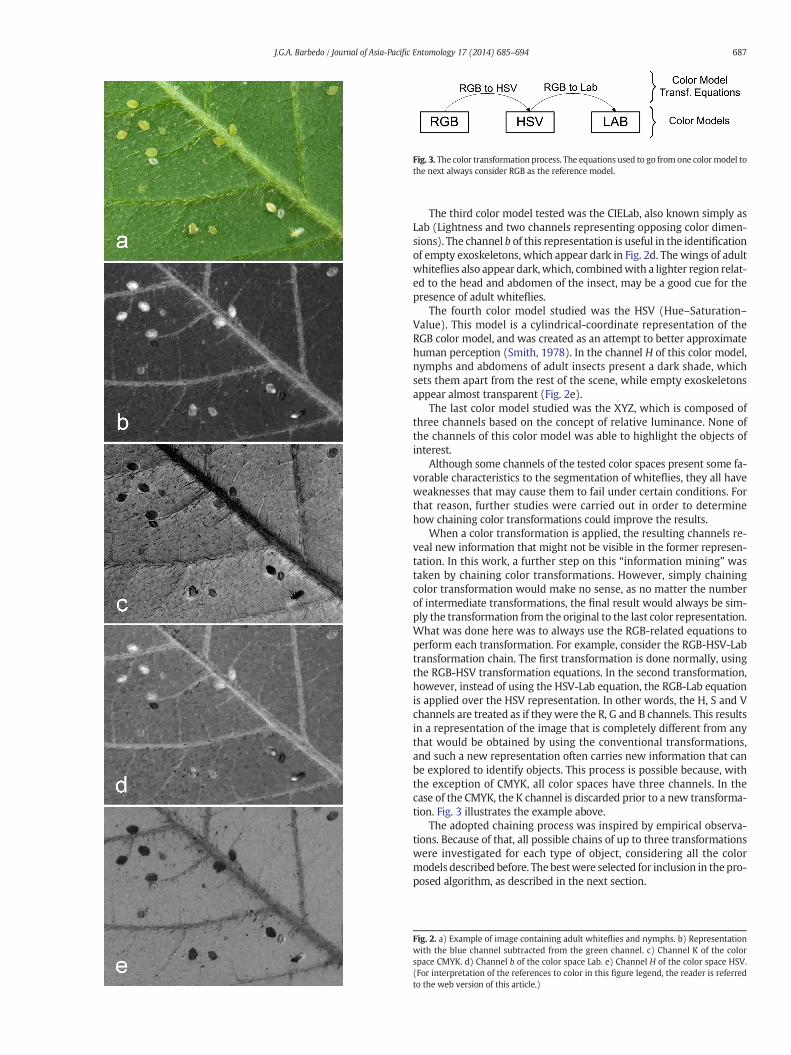
Fig. 3. The color transformation process. The equations used to go from one colormodel tothe next always consider RGB as the reference model.
687J.G.A. Barbedo / Journal of Asia-Pacific Entomology 17 (2014) 685–694
The third color model tested was the CIELab, also known simply asLab (Lightness and two channels representing opposing color dimen-sions). The channel b of this representation is useful in the identificationof empty exoskeletons, which appear dark in Fig. 2d. The wings of adultwhiteflies also appear dark, which, combinedwith a lighter region relat-ed to the head and abdomen of the insect, may be a good cue for thepresence of adult whiteflies.
The fourth color model studied was the HSV (Hue–Saturation–Value). This model is a cylindrical-coordinate representation of theRGB color model, and was created as an attempt to better approximatehuman perception (Smith, 1978). In the channel H of this color model,nymphs and abdomens of adult insects present a dark shade, whichsets them apart from the rest of the scene, while empty exoskeletonsappear almost transparent (Fig. 2e).
The last color model studied was the XYZ, which is composed ofthree channels based on the concept of relative luminance. None ofthe channels of this color model was able to highlight the objects ofinterest.
Although some channels of the tested color spaces present some fa-vorable characteristics to the segmentation of whiteflies, they all haveweaknesses that may cause them to fail under certain conditions. Forthat reason, further studies were carried out in order to determinehow chaining color transformations could improve the results.
When a color transformation is applied, the resulting channels re-veal new information that might not be visible in the former represen-tation. In this work, a further step on this “information mining” wastaken by chaining color transformations. However, simply chainingcolor transformation would make no sense, as no matter the numberof intermediate transformations, the final result would always be sim-ply the transformation from the original to the last color representation.What was done here was to always use the RGB-related equations toperform each transformation. For example, consider the RGB-HSV-Labtransformation chain. The first transformation is done normally, usingthe RGB-HSV transformation equations. In the second transformation,however, instead of using the HSV-Lab equation, the RGB-Lab equationis applied over the HSV representation. In other words, the H, S and Vchannels are treated as if theywere the R, G and B channels. This resultsin a representation of the image that is completely different from anythat would be obtained by using the conventional transformations,and such a new representation often carries new information that canbe explored to identify objects. This process is possible because, withthe exception of CMYK, all color spaces have three channels. In thecase of the CMYK, the K channel is discarded prior to a new transforma-tion. Fig. 3 illustrates the example above.
The adopted chaining process was inspired by empirical observa-tions. Because of that, all possible chains of up to three transformationswere investigated for each type of object, considering all the colormodels described before. Thebestwere selected for inclusion in thepro-posed algorithm, as described in the next section.
Fig. 2. a) Example of image containing adult whiteflies and nymphs. b) Representationwith the blue channel subtracted from the green channel. c) Channel K of the colorspace CMYK. d) Channel b of the color space Lab. e) Channel H of the color space HSV.(For interpretation of the references to color in this figure legend, the reader is referredto the web version of this article.)
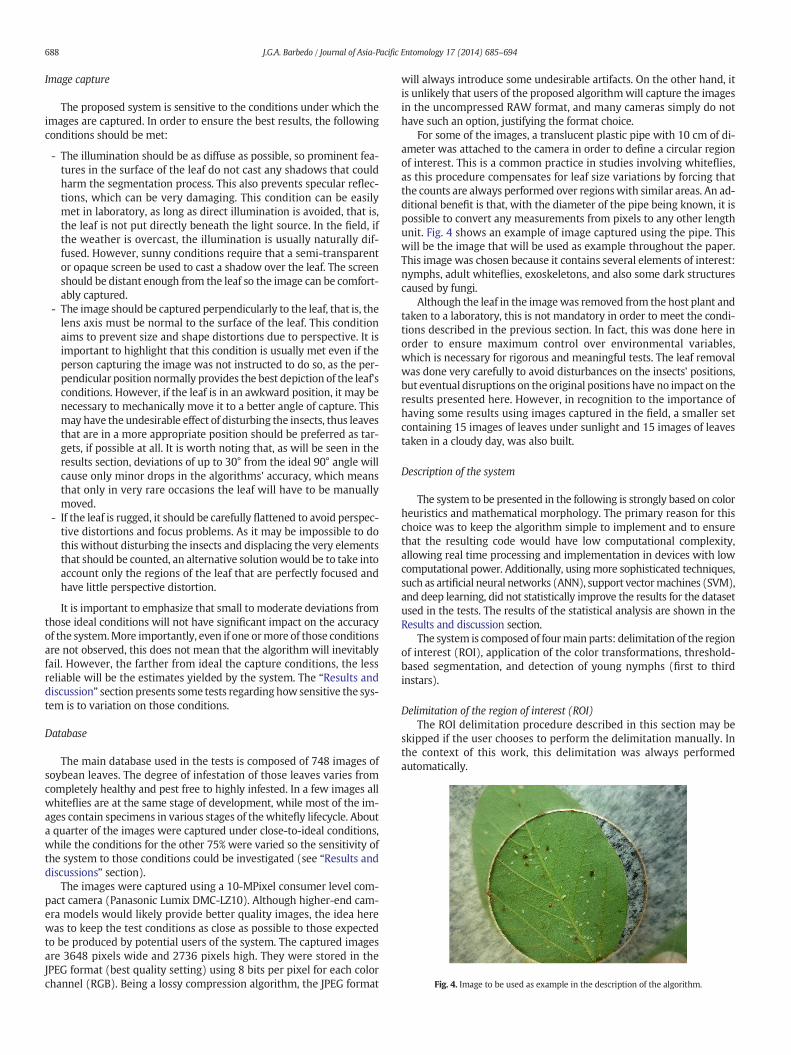
Fig. 4. Image to be used as example in the description of the algorithm.
688 J.G.A. Barbedo / Journal of Asia-Pacific Entomology 17 (2014) 685–694
Image capture
The proposed system is sensitive to the conditions under which theimages are captured. In order to ensure the best results, the followingconditions should be met:
- The illumination should be as diffuse as possible, so prominent fea-tures in the surface of the leaf do not cast any shadows that couldharm the segmentation process. This also prevents specular reflec-tions, which can be very damaging. This condition can be easilymet in laboratory, as long as direct illumination is avoided, that is,the leaf is not put directly beneath the light source. In the field, ifthe weather is overcast, the illumination is usually naturally dif-fused. However, sunny conditions require that a semi-transparentor opaque screen be used to cast a shadow over the leaf. The screenshould be distant enough from the leaf so the image can be comfort-ably captured.
- The image should be captured perpendicularly to the leaf, that is, thelens axis must be normal to the surface of the leaf. This conditionaims to prevent size and shape distortions due to perspective. It isimportant to highlight that this condition is usually met even if theperson capturing the image was not instructed to do so, as the per-pendicular position normally provides the best depiction of the leaf'sconditions. However, if the leaf is in an awkward position, it may benecessary to mechanically move it to a better angle of capture. Thismay have the undesirable effect of disturbing the insects, thus leavesthat are in a more appropriate position should be preferred as tar-gets, if possible at all. It is worth noting that, as will be seen in theresults section, deviations of up to 30° from the ideal 90° angle willcause only minor drops in the algorithms' accuracy, which meansthat only in very rare occasions the leaf will have to be manuallymoved.
- If the leaf is rugged, it should be carefully flattened to avoid perspec-tive distortions and focus problems. As it may be impossible to dothis without disturbing the insects and displacing the very elementsthat should be counted, an alternative solutionwould be to take intoaccount only the regions of the leaf that are perfectly focused andhave little perspective distortion.
It is important to emphasize that small to moderate deviations fromthose ideal conditions will not have significant impact on the accuracyof the system.More importantly, even if one ormore of those conditionsare not observed, this does not mean that the algorithm will inevitablyfail. However, the farther from ideal the capture conditions, the lessreliable will be the estimates yielded by the system. The “Results anddiscussion” section presents some tests regarding how sensitive the sys-tem is to variation on those conditions.
Database
The main database used in the tests is composed of 748 images ofsoybean leaves. The degree of infestation of those leaves varies fromcompletely healthy and pest free to highly infested. In a few images allwhiteflies are at the same stage of development, while most of the im-ages contain specimens in various stages of the whitefly lifecycle. Abouta quarter of the images were captured under close-to-ideal conditions,while the conditions for the other 75% were varied so the sensitivity ofthe system to those conditions could be investigated (see “Results anddiscussions” section).
The images were captured using a 10-MPixel consumer level com-pact camera (Panasonic Lumix DMC-LZ10). Although higher-end cam-era models would likely provide better quality images, the idea herewas to keep the test conditions as close as possible to those expectedto be produced by potential users of the system. The captured imagesare 3648 pixels wide and 2736 pixels high. They were stored in theJPEG format (best quality setting) using 8 bits per pixel for each colorchannel (RGB). Being a lossy compression algorithm, the JPEG format
will always introduce some undesirable artifacts. On the other hand, itis unlikely that users of the proposed algorithmwill capture the imagesin the uncompressed RAW format, and many cameras simply do nothave such an option, justifying the format choice.
For some of the images, a translucent plastic pipe with 10 cm of di-ameter was attached to the camera in order to define a circular regionof interest. This is a common practice in studies involving whiteflies,as this procedure compensates for leaf size variations by forcing thatthe counts are always performed over regionswith similar areas. An ad-ditional benefit is that, with the diameter of the pipe being known, it ispossible to convert any measurements from pixels to any other lengthunit. Fig. 4 shows an example of image captured using the pipe. Thiswill be the image that will be used as example throughout the paper.This image was chosen because it contains several elements of interest:nymphs, adult whiteflies, exoskeletons, and also some dark structurescaused by fungi.
Although the leaf in the imagewas removed from the host plant andtaken to a laboratory, this is not mandatory in order to meet the condi-tions described in the previous section. In fact, this was done here inorder to ensure maximum control over environmental variables,which is necessary for rigorous and meaningful tests. The leaf removalwas done very carefully to avoid disturbances on the insects' positions,but eventual disruptions on the original positions have no impact on theresults presented here. However, in recognition to the importance ofhaving some results using images captured in the field, a smaller setcontaining 15 images of leaves under sunlight and 15 images of leavestaken in a cloudy day, was also built.
Description of the system
The system to be presented in the following is strongly based on colorheuristics and mathematical morphology. The primary reason for thischoice was to keep the algorithm simple to implement and to ensurethat the resulting code would have low computational complexity,allowing real time processing and implementation in devices with lowcomputational power. Additionally, usingmore sophisticated techniques,such as artificial neural networks (ANN), support vectormachines (SVM),and deep learning, did not statistically improve the results for the datasetused in the tests. The results of the statistical analysis are shown in theResults and discussion section.
The system is composed of fourmain parts: delimitation of the regionof interest (ROI), application of the color transformations, threshold-based segmentation, and detection of young nymphs (first to thirdinstars).
Delimitation of the region of interest (ROI)The ROI delimitation procedure described in this section may be
skipped if the user chooses to perform the delimitation manually. Inthe context of this work, this delimitation was always performedautomatically.
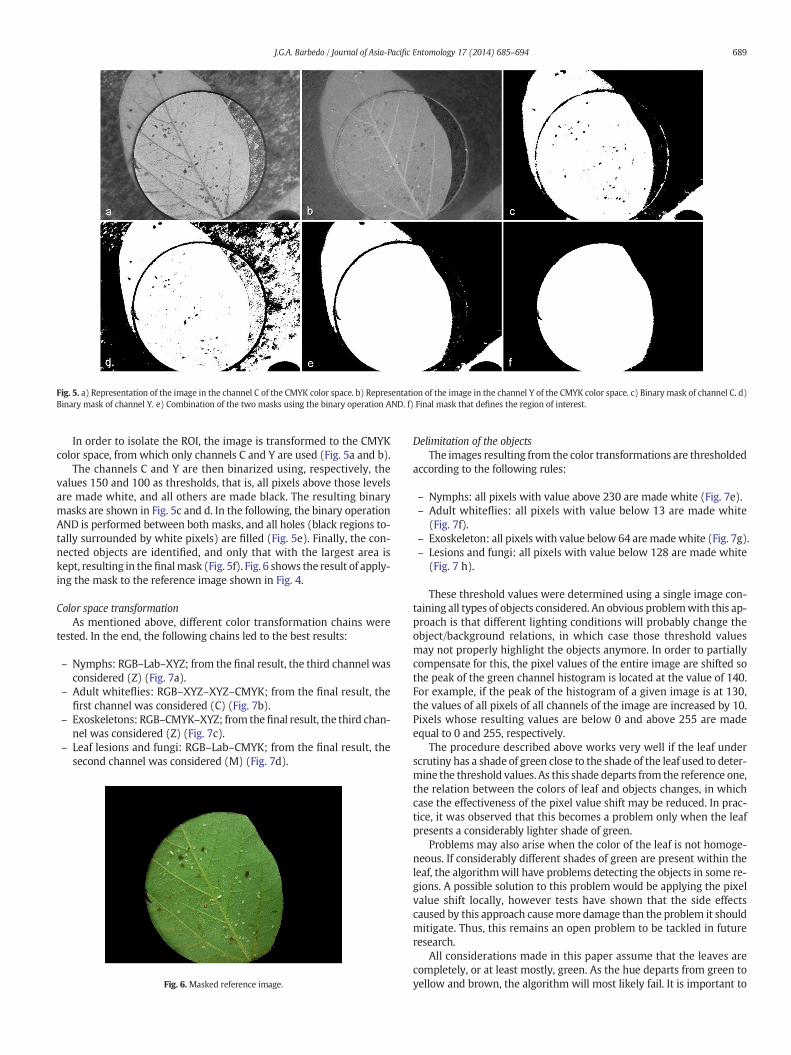
Fig. 5. a) Representation of the image in the channel C of the CMYK color space. b) Representation of the image in the channel Y of the CMYK color space. c) Binary mask of channel C. d)Binary mask of channel Y. e) Combination of the two masks using the binary operation AND. f) Final mask that defines the region of interest.
689J.G.A. Barbedo / Journal of Asia-Pacific Entomology 17 (2014) 685–694
In order to isolate the ROI, the image is transformed to the CMYKcolor space, from which only channels C and Y are used (Fig. 5a and b).
The channels C and Y are then binarized using, respectively, thevalues 150 and 100 as thresholds, that is, all pixels above those levelsare made white, and all others are made black. The resulting binarymasks are shown in Fig. 5c and d. In the following, the binary operationAND is performed between both masks, and all holes (black regions to-tally surrounded by white pixels) are filled (Fig. 5e). Finally, the con-nected objects are identified, and only that with the largest area iskept, resulting in thefinalmask (Fig. 5f). Fig. 6 shows the result of apply-ing the mask to the reference image shown in Fig. 4.
Color space transformationAs mentioned above, different color transformation chains were
tested. In the end, the following chains led to the best results:
– Nymphs: RGB–Lab–XYZ; from the final result, the third channel wasconsidered (Z) (Fig. 7a).
– Adult whiteflies: RGB–XYZ–XYZ–CMYK; from the final result, thefirst channel was considered (C) (Fig. 7b).
– Exoskeletons: RGB–CMYK–XYZ; from thefinal result, the third chan-nel was considered (Z) (Fig. 7c).
– Leaf lesions and fungi: RGB–Lab–CMYK; from the final result, thesecond channel was considered (M) (Fig. 7d).
Fig. 6.Masked reference image.
Delimitation of the objectsThe images resulting from the color transformations are thresholded
according to the following rules:
– Nymphs: all pixels with value above 230 are made white (Fig. 7e).– Adult whiteflies: all pixels with value below 13 are made white
(Fig. 7f).– Exoskeleton: all pixels with value below 64 are madewhite (Fig. 7g).– Lesions and fungi: all pixels with value below 128 are made white
(Fig. 7 h).
These threshold values were determined using a single image con-taining all types of objects considered. An obvious problemwith this ap-proach is that different lighting conditions will probably change theobject/background relations, in which case those threshold valuesmay not properly highlight the objects anymore. In order to partiallycompensate for this, the pixel values of the entire image are shifted sothe peak of the green channel histogram is located at the value of 140.For example, if the peak of the histogram of a given image is at 130,the values of all pixels of all channels of the image are increased by 10.Pixels whose resulting values are below 0 and above 255 are madeequal to 0 and 255, respectively.
The procedure described above works very well if the leaf underscrutiny has a shade of green close to the shade of the leaf used to deter-mine the threshold values. As this shade departs from the reference one,the relation between the colors of leaf and objects changes, in whichcase the effectiveness of the pixel value shift may be reduced. In prac-tice, it was observed that this becomes a problem only when the leafpresents a considerably lighter shade of green.
Problems may also arise when the color of the leaf is not homoge-neous. If considerably different shades of green are present within theleaf, the algorithmwill have problems detecting the objects in some re-gions. A possible solution to this problem would be applying the pixelvalue shift locally, however tests have shown that the side effectscaused by this approach causemore damage than the problem it shouldmitigate. Thus, this remains an open problem to be tackled in futureresearch.
All considerations made in this paper assume that the leaves arecompletely, or at least mostly, green. As the hue departs from green toyellow and brown, the algorithm will most likely fail. It is important to
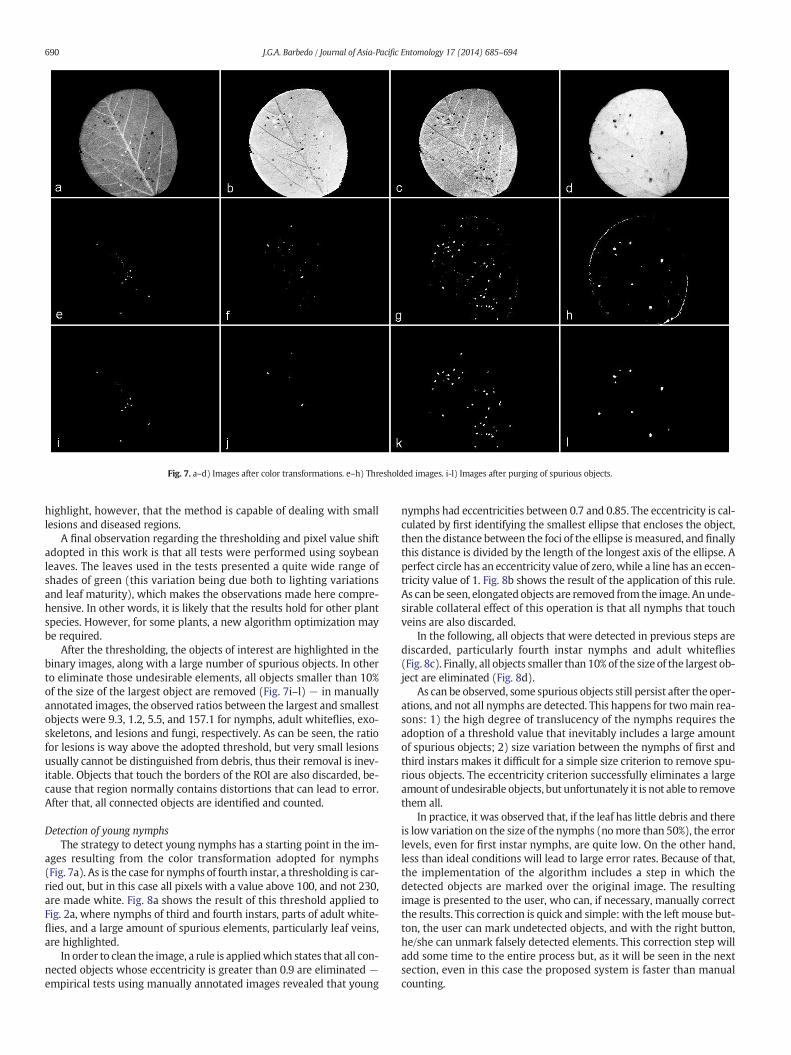
Fig. 7. a–d) Images after color transformations. e–h) Thresholded images. i-l) Images after purging of spurious objects.
690 J.G.A. Barbedo / Journal of Asia-Pacific Entomology 17 (2014) 685–694
highlight, however, that the method is capable of dealing with smalllesions and diseased regions.
A final observation regarding the thresholding and pixel value shiftadopted in this work is that all tests were performed using soybeanleaves. The leaves used in the tests presented a quite wide range ofshades of green (this variation being due both to lighting variationsand leaf maturity), which makes the observations made here compre-hensive. In other words, it is likely that the results hold for other plantspecies. However, for some plants, a new algorithm optimization maybe required.
After the thresholding, the objects of interest are highlighted in thebinary images, along with a large number of spurious objects. In otherto eliminate those undesirable elements, all objects smaller than 10%of the size of the largest object are removed (Fig. 7i–l) − in manuallyannotated images, the observed ratios between the largest and smallestobjects were 9.3, 1.2, 5.5, and 157.1 for nymphs, adult whiteflies, exo-skeletons, and lesions and fungi, respectively. As can be seen, the ratiofor lesions is way above the adopted threshold, but very small lesionsusually cannot be distinguished from debris, thus their removal is inev-itable. Objects that touch the borders of the ROI are also discarded, be-cause that region normally contains distortions that can lead to error.After that, all connected objects are identified and counted.
Detection of young nymphsThe strategy to detect young nymphs has a starting point in the im-
ages resulting from the color transformation adopted for nymphs(Fig. 7a). As is the case for nymphs of fourth instar, a thresholding is car-ried out, but in this case all pixels with a value above 100, and not 230,are made white. Fig. 8a shows the result of this threshold applied toFig. 2a, where nymphs of third and fourth instars, parts of adult white-flies, and a large amount of spurious elements, particularly leaf veins,are highlighted.
In order to clean the image, a rule is appliedwhich states that all con-nected objects whose eccentricity is greater than 0.9 are eliminated −empirical tests using manually annotated images revealed that young
nymphs had eccentricities between 0.7 and 0.85. The eccentricity is cal-culated by first identifying the smallest ellipse that encloses the object,then the distance between the foci of the ellipse ismeasured, and finallythis distance is divided by the length of the longest axis of the ellipse. Aperfect circle has an eccentricity value of zero, while a line has an eccen-tricity value of 1. Fig. 8b shows the result of the application of this rule.As can be seen, elongated objects are removed from the image. An unde-sirable collateral effect of this operation is that all nymphs that touchveins are also discarded.
In the following, all objects that were detected in previous steps arediscarded, particularly fourth instar nymphs and adult whiteflies(Fig. 8c). Finally, all objects smaller than 10% of the size of the largest ob-ject are eliminated (Fig. 8d).
As can be observed, some spurious objects still persist after the oper-ations, and not all nymphs are detected. This happens for twomain rea-sons: 1) the high degree of translucency of the nymphs requires theadoption of a threshold value that inevitably includes a large amountof spurious objects; 2) size variation between the nymphs of first andthird instars makes it difficult for a simple size criterion to remove spu-rious objects. The eccentricity criterion successfully eliminates a largeamount of undesirable objects, but unfortunately it is not able to removethem all.
In practice, it was observed that, if the leaf has little debris and thereis low variation on the size of the nymphs (nomore than 50%), the errorlevels, even for first instar nymphs, are quite low. On the other hand,less than ideal conditions will lead to large error rates. Because of that,the implementation of the algorithm includes a step in which thedetected objects are marked over the original image. The resultingimage is presented to the user, who can, if necessary, manually correctthe results. This correction is quick and simple: with the left mouse but-ton, the user can mark undetected objects, and with the right button,he/she can unmark falsely detected elements. This correction step willadd some time to the entire process but, as it will be seen in the nextsection, even in this case the proposed system is faster than manualcounting.
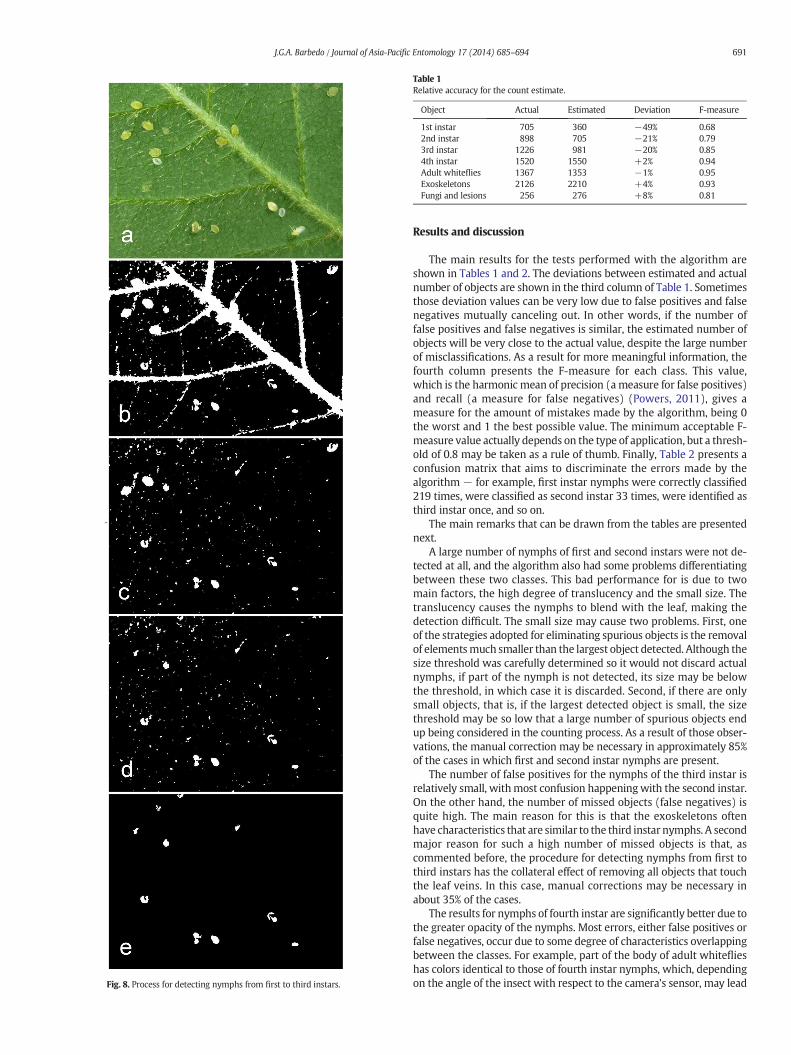
Table 1Relative accuracy for the count estimate.
Object Actual Estimated Deviation F-measure
1st instar 705 360 −49% 0.682nd instar 898 705 −21% 0.793rd instar 1226 981 −20% 0.854th instar 1520 1550 +2% 0.94Adult whiteflies 1367 1353 −1% 0.95Exoskeletons 2126 2210 +4% 0.93Fungi and lesions 256 276 +8% 0.81
}
Fig. 8. Process for detecting nymphs from first to third instars.
691J.G.A. Barbedo / Journal of Asia-Pacific Entomology 17 (2014) 685–694
Results and discussion
The main results for the tests performed with the algorithm areshown in Tables 1 and 2. The deviations between estimated and actualnumber of objects are shown in the third column of Table 1. Sometimesthose deviation values can be very low due to false positives and falsenegatives mutually canceling out. In other words, if the number offalse positives and false negatives is similar, the estimated number ofobjects will be very close to the actual value, despite the large numberof misclassifications. As a result for more meaningful information, thefourth column presents the F-measure for each class. This value,which is the harmonic mean of precision (ameasure for false positives)and recall (a measure for false negatives) (Powers, 2011), gives ameasure for the amount of mistakes made by the algorithm, being 0the worst and 1 the best possible value. The minimum acceptable F-measure value actually depends on the type of application, but a thresh-old of 0.8 may be taken as a rule of thumb. Finally, Table 2 presents aconfusion matrix that aims to discriminate the errors made by thealgorithm − for example, first instar nymphs were correctly classified219 times, were classified as second instar 33 times, were identified asthird instar once, and so on.
The main remarks that can be drawn from the tables are presentednext.
A large number of nymphs of first and second instars were not de-tected at all, and the algorithm also had some problems differentiatingbetween these two classes. This bad performance for is due to twomain factors, the high degree of translucency and the small size. Thetranslucency causes the nymphs to blend with the leaf, making thedetection difficult. The small size may cause two problems. First, oneof the strategies adopted for eliminating spurious objects is the removalof elementsmuch smaller than the largest object detected. Although thesize threshold was carefully determined so it would not discard actualnymphs, if part of the nymph is not detected, its size may be belowthe threshold, in which case it is discarded. Second, if there are onlysmall objects, that is, if the largest detected object is small, the sizethreshold may be so low that a large number of spurious objects endup being considered in the counting process. As a result of those obser-vations, the manual correction may be necessary in approximately 85%of the cases in which first and second instar nymphs are present.
The number of false positives for the nymphs of the third instar isrelatively small, withmost confusion happeningwith the second instar.On the other hand, the number of missed objects (false negatives) isquite high. The main reason for this is that the exoskeletons oftenhave characteristics that are similar to the third instar nymphs. A secondmajor reason for such a high number of missed objects is that, ascommented before, the procedure for detecting nymphs from first tothird instars has the collateral effect of removing all objects that touchthe leaf veins. In this case, manual corrections may be necessary inabout 35% of the cases.
The results for nymphs of fourth instar are significantly better due tothe greater opacity of the nymphs. Most errors, either false positives orfalse negatives, occur due to some degree of characteristics overlappingbetween the classes. For example, part of the body of adult whiteflieshas colors identical to those of fourth instar nymphs, which, dependingon the angle of the insect with respect to the camera's sensor, may lead
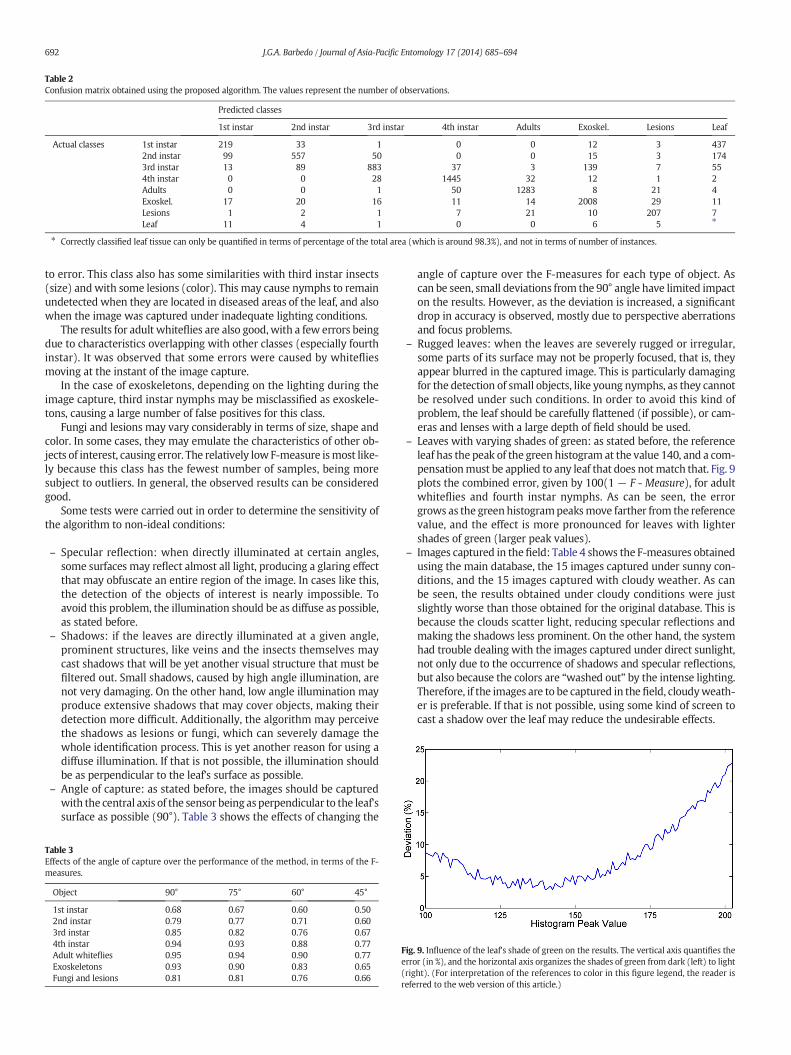
Table 2Confusion matrix obtained using the proposed algorithm. The values represent the number of observations.
Predicted classes
1st instar 2nd instar 3rd instar 4th instar Adults Exoskel. Lesions Leaf
Actual classes 1st instar 219 33 1 0 0 12 3 4372nd instar 99 557 50 0 0 15 3 1743rd instar 13 89 883 37 3 139 7 554th instar 0 0 28 1445 32 12 1 2Adults 0 0 1 50 1283 8 21 4Exoskel. 17 20 16 11 14 2008 29 11Lesions 1 2 1 7 21 10 207 7Leaf 11 4 1 0 0 6 5 ⁎
⁎ Correctly classified leaf tissue can only be quantified in terms of percentage of the total area (which is around 98.3%), and not in terms of number of instances.
692 J.G.A. Barbedo / Journal of Asia-Pacific Entomology 17 (2014) 685–694
to error. This class also has some similarities with third instar insects(size) andwith some lesions (color). This may cause nymphs to remainundetected when they are located in diseased areas of the leaf, and alsowhen the image was captured under inadequate lighting conditions.
The results for adult whiteflies are also good,with a few errors beingdue to characteristics overlapping with other classes (especially fourthinstar). It was observed that some errors were caused by whitefliesmoving at the instant of the image capture.
In the case of exoskeletons, depending on the lighting during theimage capture, third instar nymphs may be misclassified as exoskele-tons, causing a large number of false positives for this class.
Fungi and lesions may vary considerably in terms of size, shape andcolor. In some cases, they may emulate the characteristics of other ob-jects of interest, causing error. The relatively low F-measure ismost like-ly because this class has the fewest number of samples, being moresubject to outliers. In general, the observed results can be consideredgood.
Some tests were carried out in order to determine the sensitivity ofthe algorithm to non-ideal conditions:
– Specular reflection: when directly illuminated at certain angles,some surfaces may reflect almost all light, producing a glaring effectthat may obfuscate an entire region of the image. In cases like this,the detection of the objects of interest is nearly impossible. Toavoid this problem, the illumination should be as diffuse as possible,as stated before.
– Shadows: if the leaves are directly illuminated at a given angle,prominent structures, like veins and the insects themselves maycast shadows that will be yet another visual structure that must befiltered out. Small shadows, caused by high angle illumination, arenot very damaging. On the other hand, low angle illumination mayproduce extensive shadows that may cover objects, making theirdetection more difficult. Additionally, the algorithm may perceivethe shadows as lesions or fungi, which can severely damage thewhole identification process. This is yet another reason for using adiffuse illumination. If that is not possible, the illumination shouldbe as perpendicular to the leaf's surface as possible.
– Angle of capture: as stated before, the images should be capturedwith the central axis of the sensor being as perpendicular to the leaf'ssurface as possible (90°). Table 3 shows the effects of changing the
Table 3Effects of the angle of capture over the performance of the method, in terms of the F-measures.
Object 90° 75° 60° 45°
1st instar 0.68 0.67 0.60 0.502nd instar 0.79 0.77 0.71 0.603rd instar 0.85 0.82 0.76 0.674th instar 0.94 0.93 0.88 0.77Adult whiteflies 0.95 0.94 0.90 0.77Exoskeletons 0.93 0.90 0.83 0.65Fungi and lesions 0.81 0.81 0.76 0.66
angle of capture over the F-measures for each type of object. Ascan be seen, small deviations from the 90° angle have limited impacton the results. However, as the deviation is increased, a significantdrop in accuracy is observed, mostly due to perspective aberrationsand focus problems.
– Rugged leaves: when the leaves are severely rugged or irregular,some parts of its surface may not be properly focused, that is, theyappear blurred in the captured image. This is particularly damagingfor the detection of small objects, like young nymphs, as they cannotbe resolved under such conditions. In order to avoid this kind ofproblem, the leaf should be carefully flattened (if possible), or cam-eras and lenses with a large depth of field should be used.
– Leaves with varying shades of green: as stated before, the referenceleaf has the peak of the green histogram at the value 140, and a com-pensationmust be applied to any leaf that does notmatch that. Fig. 9plots the combined error, given by 100(1 − F Measure), for adultwhiteflies and fourth instar nymphs. As can be seen, the errorgrows as the green histogrampeaksmove farther from the referencevalue, and the effect is more pronounced for leaves with lightershades of green (larger peak values).
– Images captured in thefield: Table 4 shows the F-measures obtainedusing the main database, the 15 images captured under sunny con-ditions, and the 15 images captured with cloudy weather. As canbe seen, the results obtained under cloudy conditions were justslightly worse than those obtained for the original database. This isbecause the clouds scatter light, reducing specular reflections andmaking the shadows less prominent. On the other hand, the systemhad trouble dealing with the images captured under direct sunlight,not only due to the occurrence of shadows and specular reflections,but also because the colors are “washed out” by the intense lighting.Therefore, if the images are to be captured in the field, cloudyweath-er is preferable. If that is not possible, using some kind of screen tocast a shadow over the leaf may reduce the undesirable effects.
Fig. 9. Influence of the leaf's shade of green on the results. The vertical axis quantifies theerror (in %), and the horizontal axis organizes the shades of green from dark (left) to light(right). (For interpretation of the references to color in this figure legend, the reader isreferred to the web version of this article.)
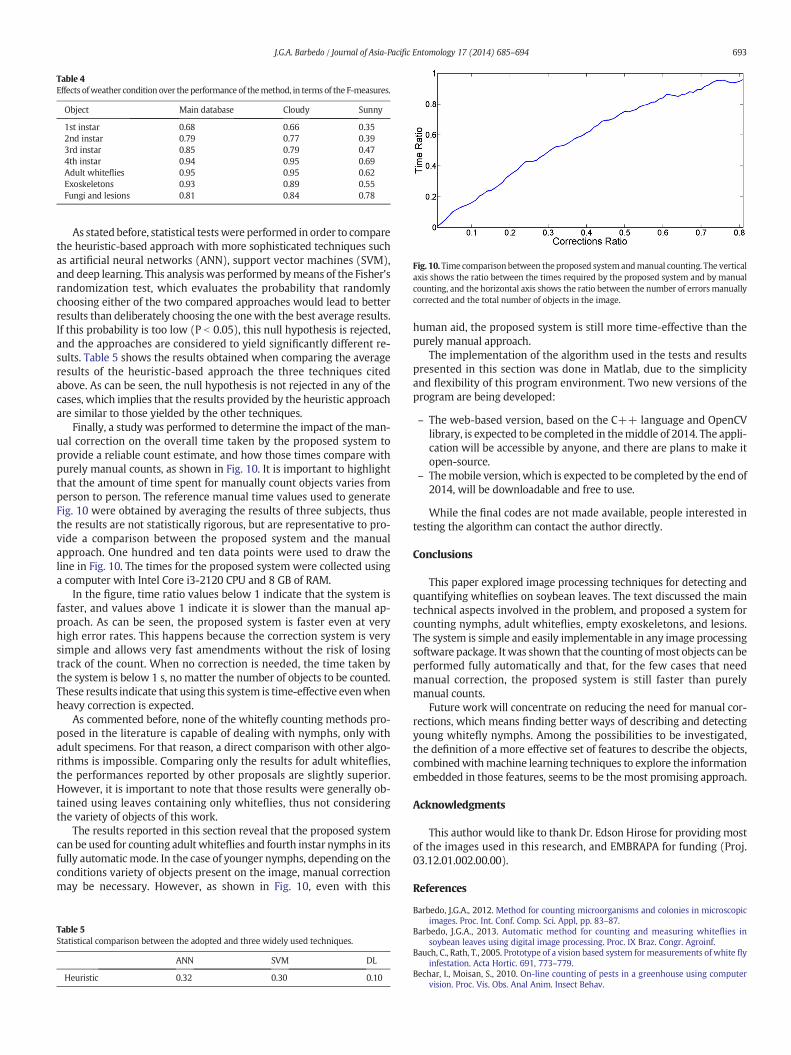
Table 4Effects ofweather condition over the performance of themethod, in terms of the F-measures.
Object Main database Cloudy Sunny
1st instar 0.68 0.66 0.352nd instar 0.79 0.77 0.393rd instar 0.85 0.79 0.474th instar 0.94 0.95 0.69Adult whiteflies 0.95 0.95 0.62Exoskeletons 0.93 0.89 0.55Fungi and lesions 0.81 0.84 0.78
Fig. 10. Time comparison between theproposed systemandmanual counting. The verticalaxis shows the ratio between the times required by the proposed system and by manualcounting, and the horizontal axis shows the ratio between the number of errors manuallycorrected and the total number of objects in the image.
693J.G.A. Barbedo / Journal of Asia-Pacific Entomology 17 (2014) 685–694
As stated before, statistical testswere performed in order to comparethe heuristic-based approach with more sophisticated techniques suchas artificial neural networks (ANN), support vector machines (SVM),and deep learning. This analysis was performed bymeans of the Fisher'srandomization test, which evaluates the probability that randomlychoosing either of the two compared approaches would lead to betterresults than deliberately choosing the onewith the best average results.If this probability is too low (P b 0.05), this null hypothesis is rejected,and the approaches are considered to yield significantly different re-sults. Table 5 shows the results obtained when comparing the averageresults of the heuristic-based approach the three techniques citedabove. As can be seen, the null hypothesis is not rejected in any of thecases, which implies that the results provided by the heuristic approachare similar to those yielded by the other techniques.
Finally, a study was performed to determine the impact of the man-ual correction on the overall time taken by the proposed system toprovide a reliable count estimate, and how those times compare withpurely manual counts, as shown in Fig. 10. It is important to highlightthat the amount of time spent for manually count objects varies fromperson to person. The reference manual time values used to generateFig. 10 were obtained by averaging the results of three subjects, thusthe results are not statistically rigorous, but are representative to pro-vide a comparison between the proposed system and the manualapproach. One hundred and ten data points were used to draw theline in Fig. 10. The times for the proposed system were collected usinga computer with Intel Core i3-2120 CPU and 8 GB of RAM.
In the figure, time ratio values below 1 indicate that the system isfaster, and values above 1 indicate it is slower than the manual ap-proach. As can be seen, the proposed system is faster even at veryhigh error rates. This happens because the correction system is verysimple and allows very fast amendments without the risk of losingtrack of the count. When no correction is needed, the time taken bythe system is below 1 s, nomatter the number of objects to be counted.These results indicate that using this system is time-effective evenwhenheavy correction is expected.
As commented before, none of the whitefly counting methods pro-posed in the literature is capable of dealing with nymphs, only withadult specimens. For that reason, a direct comparison with other algo-rithms is impossible. Comparing only the results for adult whiteflies,the performances reported by other proposals are slightly superior.However, it is important to note that those results were generally ob-tained using leaves containing only whiteflies, thus not consideringthe variety of objects of this work.
The results reported in this section reveal that the proposed systemcan be used for counting adult whiteflies and fourth instar nymphs in itsfully automatic mode. In the case of younger nymphs, depending on theconditions variety of objects present on the image, manual correctionmay be necessary. However, as shown in Fig. 10, even with this
Table 5Statistical comparison between the adopted and three widely used techniques.
ANN SVM DL
Heuristic 0.32 0.30 0.10
human aid, the proposed system is still more time-effective than thepurely manual approach.
The implementation of the algorithm used in the tests and resultspresented in this section was done in Matlab, due to the simplicityand flexibility of this program environment. Two new versions of theprogram are being developed:
– The web-based version, based on the C++ language and OpenCVlibrary, is expected to be completed in themiddle of 2014. The appli-cation will be accessible by anyone, and there are plans to make itopen-source.
– Themobile version, which is expected to be completed by the end of2014, will be downloadable and free to use.
While the final codes are not made available, people interested intesting the algorithm can contact the author directly.
Conclusions
This paper explored image processing techniques for detecting andquantifying whiteflies on soybean leaves. The text discussed the maintechnical aspects involved in the problem, and proposed a system forcounting nymphs, adult whiteflies, empty exoskeletons, and lesions.The system is simple and easily implementable in any image processingsoftware package. Itwas shown that the counting ofmost objects can beperformed fully automatically and that, for the few cases that needmanual correction, the proposed system is still faster than purelymanual counts.
Future work will concentrate on reducing the need for manual cor-rections, which means finding better ways of describing and detectingyoung whitefly nymphs. Among the possibilities to be investigated,the definition of a more effective set of features to describe the objects,combinedwithmachine learning techniques to explore the informationembedded in those features, seems to be the most promising approach.
Acknowledgments
This author would like to thank Dr. Edson Hirose for providing mostof the images used in this research, and EMBRAPA for funding (Proj.03.12.01.002.00.00).
References
Barbedo, J.G.A., 2012. Method for counting microorganisms and colonies in microscopicimages. Proc. Int. Conf. Comp. Sci. Appl, pp. 83–87.
Barbedo, J.G.A., 2013. Automatic method for counting and measuring whiteflies insoybean leaves using digital image processing. Proc. IX Braz. Congr. Agroinf.
Bauch, C., Rath, T., 2005. Prototype of a vision based system formeasurements of white flyinfestation. Acta Hortic. 691, 773–779.
Bechar, I., Moisan, S., 2010. On-line counting of pests in a greenhouse using computervision. Proc. Vis. Obs. Anal Anim. Insect Behav.

694 J.G.A. Barbedo / Journal of Asia-Pacific Entomology 17 (2014) 685–694
Boissard, P., Martin, V., Moisan, S., 2008. A cognitive vision approach to early pest detec-tion in greenhouse crops. Comput. Electron. Agric. 62, 81–93.
Cho, J., Choi, J., Qiao, M., Ji, C.W., Kim, H.Y., Uhm, K.B., Chon, T.S., 2007. Automatic identi-fication of whiteflies, aphids and thrips in greenhouse based on image analysis. J.Math. Comput. Simul. 1, 46–53.
Faithpraise, F., Birch, P., Young, R., Obu, J., Faithpraise, B., Chatwin, C., 2013. Automaticplant pest detection and recognition using k-means clustering algorithm and corre-spondence filters. Int. J. Adv. Biotechnol. Res. 4, 189–199.
Flint, M., 2002. Whiteflies: integrated pest management for home gardeners and profes-sional landscapers. University of California, Davies, Tech. Report.
Huddar, S., Gowri, S., Keerthana, K., Vasanthi, S., Rupanagudi, S., 2012. Novel algorithm forsegmentation and automatic identification of pests on plants using image processing.Proc. Int. Conf. Comp. Comm. & Netw. Tech, pp. 1–5.
Martin, J., Mound, L., 2007. An annotated check list of the world's whiteflies (Insecta:Hemiptera: Aleyrodidae). Zootaxa 1492, 1–84.
Martin, V., Moisan, S., Paris, B., Nicolas, O., 2011. Towards a video camera network forearly pest detection in greenhouses. Proc. Int. Conf. Diversif. Crop Prot. , pp. 12–15.
Mundada, R., Gohokar, V., 2013. Detection and classification of pests in greenhouseusing image processing. IOSR J. Electr. Commun. Eng. 5, 57–63.
Pokharkar, S.R., Thool, V.R., 2012. Early pest identification in greenhouse crops usingimage processing techniques. Int. J. Comput. Sci. Netw. 1, 1–6.
Powers, D.M.W., 2011. Evaluation: from precision, recall and F-measure to ROC,informedness, markedness & correlation. J. Mach. Learn. Technol. 2, 37–63.
Smith, A.R., 1978. Color gamut transform pairs. Comp. Graph. 12, 12–19.Souza, A.P., 2004. Atividade inseticida e modo de ação de extratos de meliáceas sobre
Bemisia tabaci (Genn., 1889) biótipo B(Dissertation) University of São Paulo.
Related Documents