ORIGINAL RESEARCH ARTICLE published: 14 May 2013 doi: 10.3389/fnint.2013.00031 Using diffusion anisotropy to characterize neuronal morphology in gray matter: the orientation distribution of axons and dendrites in the NeuroMorpho.org database Mikkel B. Hansen 1 , Sune N. Jespersen 1,2 *, Lindsey A. Leigland 3 and Christopher D. Kroenke 3,4 * 1 Center for Functionally Integrative Neuroscience and MINDLab, NeuroCampus Aarhus, Aarhus University, Aarhus, Denmark 2 Department of Physics and Astronomy, Aarhus University, Aarhus, Denmark 3 Department of Behavioral Neuroscience, Advanced Imaging Research Center, Oregon Health and Science University, Portland, OR, USA 4 Division of Neuroscience, Oregon National Primate Research Center, Oregon Health and Science University, Portland, OR, USA Edited by: Alpay Özcan, Virginia Polytechnic and State University, USA Reviewed by: Robert Turner, Max Planck Institute for Human Cognitive and Brain Sciences, Germany Yong Wang, Washington University in St. Louis, USA Peng Sun, Washington University in St. Louis, USA Tsang-Wei Tu, National Institute of Health, Taiwan Junzhong Xu, Vanderbilt University, USA *Correspondence: Sune N. Jespersen, Center for Functionally Integrative Neuroscience and MINDLab, NeuroCampus Aarhus, Aarhus University, Nørrebrogade 44, bygn 10G, DK-8000 Aarhus C, Denmark. e-mail: sune@cfin.au.dk; Christopher D. Kroenke, Department of Behavioral Neuroscience, Advanced Imaging Research Center, Oregon Health and Science University, 3181 SW Sam Jackson Park Road, Portland, OR 97239, USA. e-mail: [email protected] Accurate mathematical modeling is integral to the ability to interpret diffusion magnetic resonance (MR) imaging data in terms of cellular structure in brain gray matter (GM). In previous work, we derived expressions to facilitate the determination of the orientation distribution of axonal and dendritic processes from diffusion MR data. Here we utilize neuron reconstructions available in the NeuroMorpho database (www.neuromorpho.org) to assess the validity of the model we proposed by comparing morphological properties of the neurons to predictions based on diffusion MR simulations using the reconstructed neuron models. Initially, the method for directly determining neurite orientation distributions is shown to not depend on the line length used to quantify cylindrical elements. Further variability in neuron morphology is characterized relative to neuron type, species, and laboratory of origin. Subsequently, diffusion MR signals are simulated based on human neocortical neuron reconstructions. This reveals a bias in which diffusion MR data predict neuron orientation distributions to have artificially low anisotropy. This bias is shown to arise from shortcomings (already at relatively low diffusion weighting) in the Gaussian approximation of diffusion, in the presence of restrictive barriers, and data analysis methods involving higher moments of the cumulant expansion are shown to be capable of reducing the magnitude of the observed bias. Keywords: neuron morphology, MRI, diffusion, simulation, kurtosis, cytoarchitecture, cerebral cortex INTRODUCTION Quantitative characterization of the dependence of the diffusion- attenuated magnetic resonance imaging (MRI) signal intensity on diffusion sensitization strength and direction provides a non- invasive strategy to study cellular morphology of neurons and glia in brain tissue (Beaulieu, 2002; Le Bihan, 2003; Mori and Zhang, 2006). Diffusion tensor imaging (DTI) and variants of DTI for characterizing water diffusion in brain have been utilized in a wide range of studies directed at normal brain white matter (WM) anatomy, and studies of WM development and pathology (Le Bihan, 2003; Mori and Zhang, 2006; Wozniak et al., 2006). Recently, the potential of diffusion MRI for characterizing cell morphology within brain gray matter (GM) structures has also been the subject of increasing recognition. Two GM structures that have been shown to be particularly well suited for diffu- sion MRI-based study are the cerebral cortex (McKinstry et al., 2002; Maas et al., 2004; deIpolyi et al., 2005; Kroenke et al., 2007, 2009; Huang et al., 2008, 2009; Jespersen et al., 2010; Budde et al., 2011; Takahashi et al., 2011; Leuze et al., 2012) (and see Leigland and Kroenke, 2010 for review) and hippocampus (Zhang et al., 2002; Shepherd et al., 2006; Laitinen et al., 2010; Delgado y Palacios et al., 2011; Vestergaard-Poulsen et al., 2011). In both contexts, a prominent morphological feature is the apical dendrite of pyramidal neurons. Anisotropy in water diffusion in GM, first observed in (Thornton et al., 1997), tends to be oriented paral- lel to this dominant organization. Within the developing cerebral cortex, morphological differentiation is associated with a loss of water diffusion anisotropy (Leigland and Kroenke, 2010), and the trajectory of diffusion anisotropy changes in cortex has been demonstrated to be sufficiently sensitive to enable the detection of abnormal morphological development (Sizonenko et al., 2007; Bock et al., 2010). In the mature human cortex, high-resolution diffusion MRI has revealed depth dependent anisotropy patterns, where superficial layers preferentially show tangential diffusion, Frontiers in Integrative Neuroscience www.frontiersin.org May2013 | Volume 7 | Article 31 | 1 INTEGRATIVE NEUROSCIENCE

Welcome message from author
This document is posted to help you gain knowledge. Please leave a comment to let me know what you think about it! Share it to your friends and learn new things together.
Transcript
ORIGINAL RESEARCH ARTICLEpublished: 14 May 2013
doi: 10.3389/fnint.2013.00031
Using diffusion anisotropy to characterize neuronalmorphology in gray matter: the orientation distribution ofaxons and dendrites in the NeuroMorpho.org databaseMikkel B. Hansen1, Sune N. Jespersen1,2*, Lindsey A. Leigland3 and Christopher D. Kroenke3,4*
1 Center for Functionally Integrative Neuroscience and MINDLab, NeuroCampus Aarhus, Aarhus University, Aarhus, Denmark2 Department of Physics and Astronomy, Aarhus University, Aarhus, Denmark3 Department of Behavioral Neuroscience, Advanced Imaging Research Center, Oregon Health and Science University, Portland, OR, USA4 Division of Neuroscience, Oregon National Primate Research Center, Oregon Health and Science University, Portland, OR, USA
Edited by:
Alpay Özcan, Virginia Polytechnicand State University, USA
Reviewed by:
Robert Turner, Max Planck Institutefor Human Cognitive and BrainSciences, GermanyYong Wang, Washington Universityin St. Louis, USAPeng Sun, Washington University inSt. Louis, USATsang-Wei Tu, National Institute ofHealth, TaiwanJunzhong Xu, Vanderbilt University,USA
*Correspondence:
Sune N. Jespersen, Center forFunctionally IntegrativeNeuroscience and MINDLab,NeuroCampus Aarhus, AarhusUniversity, Nørrebrogade 44, bygn10G, DK-8000 Aarhus C, Denmark.e-mail: [email protected];
Christopher D. Kroenke, Departmentof Behavioral Neuroscience,Advanced Imaging Research Center,Oregon Health and ScienceUniversity, 3181 SW Sam JacksonPark Road, Portland, OR 97239,USA.e-mail: [email protected]
Accurate mathematical modeling is integral to the ability to interpret diffusion magneticresonance (MR) imaging data in terms of cellular structure in brain gray matter(GM). In previous work, we derived expressions to facilitate the determination ofthe orientation distribution of axonal and dendritic processes from diffusion MRdata. Here we utilize neuron reconstructions available in the NeuroMorpho database(www.neuromorpho.org) to assess the validity of the model we proposed by comparingmorphological properties of the neurons to predictions based on diffusion MR simulationsusing the reconstructed neuron models. Initially, the method for directly determiningneurite orientation distributions is shown to not depend on the line length used to quantifycylindrical elements. Further variability in neuron morphology is characterized relative toneuron type, species, and laboratory of origin. Subsequently, diffusion MR signals aresimulated based on human neocortical neuron reconstructions. This reveals a bias in whichdiffusion MR data predict neuron orientation distributions to have artificially low anisotropy.This bias is shown to arise from shortcomings (already at relatively low diffusion weighting)in the Gaussian approximation of diffusion, in the presence of restrictive barriers, and dataanalysis methods involving higher moments of the cumulant expansion are shown to becapable of reducing the magnitude of the observed bias.
Keywords: neuron morphology, MRI, diffusion, simulation, kurtosis, cytoarchitecture, cerebral cortex
INTRODUCTIONQuantitative characterization of the dependence of the diffusion-attenuated magnetic resonance imaging (MRI) signal intensityon diffusion sensitization strength and direction provides a non-invasive strategy to study cellular morphology of neurons andglia in brain tissue (Beaulieu, 2002; Le Bihan, 2003; Mori andZhang, 2006). Diffusion tensor imaging (DTI) and variants ofDTI for characterizing water diffusion in brain have been utilizedin a wide range of studies directed at normal brain white matter(WM) anatomy, and studies of WM development and pathology(Le Bihan, 2003; Mori and Zhang, 2006; Wozniak et al., 2006).Recently, the potential of diffusion MRI for characterizing cellmorphology within brain gray matter (GM) structures has alsobeen the subject of increasing recognition. Two GM structuresthat have been shown to be particularly well suited for diffu-sion MRI-based study are the cerebral cortex (McKinstry et al.,2002; Maas et al., 2004; deIpolyi et al., 2005; Kroenke et al., 2007,
2009; Huang et al., 2008, 2009; Jespersen et al., 2010; Budde et al.,2011; Takahashi et al., 2011; Leuze et al., 2012) (and see Leiglandand Kroenke, 2010 for review) and hippocampus (Zhang et al.,2002; Shepherd et al., 2006; Laitinen et al., 2010; Delgado yPalacios et al., 2011; Vestergaard-Poulsen et al., 2011). In bothcontexts, a prominent morphological feature is the apical dendriteof pyramidal neurons. Anisotropy in water diffusion in GM, firstobserved in (Thornton et al., 1997), tends to be oriented paral-lel to this dominant organization. Within the developing cerebralcortex, morphological differentiation is associated with a loss ofwater diffusion anisotropy (Leigland and Kroenke, 2010), andthe trajectory of diffusion anisotropy changes in cortex has beendemonstrated to be sufficiently sensitive to enable the detectionof abnormal morphological development (Sizonenko et al., 2007;Bock et al., 2010). In the mature human cortex, high-resolutiondiffusion MRI has revealed depth dependent anisotropy patterns,where superficial layers preferentially show tangential diffusion,
Frontiers in Integrative Neuroscience www.frontiersin.org May 2013 | Volume 7 | Article 31 | 1
INTEGRATIVE NEUROSCIENCE

Hansen et al. The orientation distribution of neurons measured with dMRI
and deeper layers have both radial and tangential diffusionanisotropy depending on depth and cortical location (Leuze et al.,2012; McNab et al., 2013). Within the hippocampus, neuron mor-phological changes associated with the response to stress havebeen demonstrated to be detectable with diffusion MRI (Delgadoy Palacios et al., 2011; Vestergaard-Poulsen et al., 2011).
In order to facilitate the interpretation of diffusion MRI data interms of underlying anatomical properties of cells in GM, mod-eling plays an important role. A successful model of the diffusionweighted signal must be based on realistic assumptions, and facil-itate tractable and physically transparent analyses. For complextissue such as the brain, it is challenging to avoid introducingoverly simplistic assumptions about tissue structures. Therefore,it is necessary to incorporate simplifications into a modelingstrategy while retaining the features of most importance for thediffusion signal. While physical intuition can guide the develop-ment of the model, proper subsequent testing, and validation ofthe model is clearly crucial.
We have previously proposed a biophysical model that relatesthe observed MRI signal to microstructural parameters includ-ing neurite volume fraction, intrinsic diffusion anisotropy withincellular axon/dendrite processes as well as the organization ofcellular processes (Kroenke et al., 2004; Jespersen et al., 2007,2012). The fundamental assumption of the model is that diffusioncan be described in terms of two non-exchanging components.One component is associated with diffusion in cylindrically sym-metric structures, such as cell processes with exchange of waterbeing sufficiently slow to be considered impermeable on the timescale of the diffusion experiment. Dendrites and axons, collec-tively termed neurites, were assumed to fulfill these assumptions.The second component of the diffusion signal accounts for dif-fusion everywhere else, in particular in cell bodies, extracellularspace, and glia cells. Here diffusion is assumed to be hindered,and molecular displacement is approximated to be a Gaussianfunction of displacement distance. The latter component is char-acterized by an effective diffusion tensor. This model has beenshown to fit diffusion-weighted MRI data well (Jespersen et al.,2007) and to compare to histology and stereology with goodagreement (Jespersen et al., 2010). More recently, experimentalvalidation was sought for the ability to characterize the neuriteorientation distribution, a characteristic of cellular morphology,using diffusion MRI data (Jespersen et al., 2012). This was doneby expressing the orientation distribution of axonal and dendriticprocesses as a scatter matrix (or orientation matrix), and defin-ing fractional anisotropy (FA) in the scatter matrix by referenceto its eigenvalues in a manner analogous to DTI calculations. Inthe regime in which molecular displacement is Gaussian, FA inwater diffusion is predicted to be linearly related to FA in thescatter matrix, and a linear relationship was observed betweenexperimentally determined scatter matrices and diffusion tensorsin post mortem brain tissue (Jespersen et al., 2012). However,the limitations of the Gaussian approximation in the context ofcomparing scatter matrices to diffusion MRI data have yet to becharacterized.
The aim of the current work is to further develop the theorylinking diffusion MRI data to neuron morphology by examin-ing the Gaussian regime predictions in (Jespersen et al., 2012)
for the intra-neuronal water component using numerical sim-ulations. Specifically, the goodness-of-fit of the diffusion ten-sor model, which follows from the Gaussian phase approxima-tion, is known to increase with decreasing b-value (Stepišnik,1999; Sukstanskii and Yablonskiy, 2002; Zielinski and Sen, 2003;Kiselev, 2011). In order to characterize this phenomenon, we usethe NeuroMorpho.org database (http://www.neuromorpho.org),which is a centralized repository for 3D recordings of neuralmorphologies (Ascoli, 2006; Ascoli et al., 2007), to obtain digitalrepresentations of real neurons, allowing us specifically to addressthe model simplifications concerning the geometric structure ofneurons as collections of long cylinders. This approach has atleast three advantages: (1) by focusing on only the intra-cellularcompartment, we avoid possible confounding with other sim-plifications in the modeling, (2) the model component is testedunder conditions representative of GM and (3) the ground truthis known.
METHODSDETERMINATION OF THE SCATTER MATRICES, T, FOR NEOCORTICALNEURONS IN THE NeuroMorpho DATABASEWe previously proposed a relationship between diffusionweighted MRI measurements and the distribution of cellularprocess orientations in brain tissue (Jespersen et al., 2012).Quantification of the orientation distribution of cellular pro-cesses is facilitated by the scatter matrix, T (Fisher and Embleton,1987), which by the theory in Jespersen et al. (2012) is relatedto the diffusion tensor D. A complete description of diffusion inbiological tissue is clearly of a non-gaussian nature (e.g., Mitraand Halperin, 1995; Stepišnik, 1999; Sukstanskii and Yablonskiy,2002; Jespersen et al., 2007; Ozcan, 2010; Kiselev, 2011); nev-ertheless, the diffusion tensor remains a well-defined quantitywhich can be estimated from the cumulant expansion (Kiselev,2011). Herein, scatter matrices are determined from the axonaland dendritic arbors of each neocortical neuron obtained fromthe NeuroMorpho.org database1, version 5.4 (Ascoli, 2006; Ascoliet al., 2007). Neuron reconstructions were downloaded fromNeuroMorpho.org in SWC format (see Cannon et al., 1998;Ascoli, 2006; Ascoli et al., 2007, as well as the website, for a def-inition of this file structure), along with relevant reconstructionmetadata, e.g., species, neuron type, laboratory of origin, etc. Inorder to retrieve the metadata for each neuron, a custom Internetinformation harvester written in python was created, and a localdatabase connecting the neuron reconstruction data with themetadata was made. We have chosen to focus on a subset of theavailable 4639 neocortical neurons, yielding a total of 4558 neu-rons, distributed as: Human: N = 2147, monkey: N = 360, rat:N = 936, mouse: N = 1019, cat: N = 20, and elephant: N = 76.
1Reconstructions were downloaded from the following archives ofNeuroMorpho.Org: “Allman,” “Barbour,” “Bergstrom,” “Bikson,” “Brown,”“Brumberg,” “Cauli,” “DeFelipe,” “Dendritica,” “Destexhe,” “Eysel,”“Gonzalez-Burgos,” “Helmstaedter,” “Hirsch,” “Hirsch, DIADEM,” “Jacobs,”“Kawaguchi,” “Kilb,” “Korngreen,” “Kubota,” “Lewis,” “Luebke,” “Markram,”“Martin,” “Meyer,” “Monyer,” “Nolan,” “Poorthuis,” “Povysheva,” “Smith,”“Staiger,” “Sun_Prince,” “Svoboda,” “Timofeev,” “Vuksic,” “Wearne_Hof,”and “Yuste”. A total of 62 publications are associated with these 37 Archivesand could not be cited here, but are included in Appendix B.
Frontiers in Integrative Neuroscience www.frontiersin.org May 2013 | Volume 7 | Article 31 | 2
Hansen et al. The orientation distribution of neurons measured with dMRI
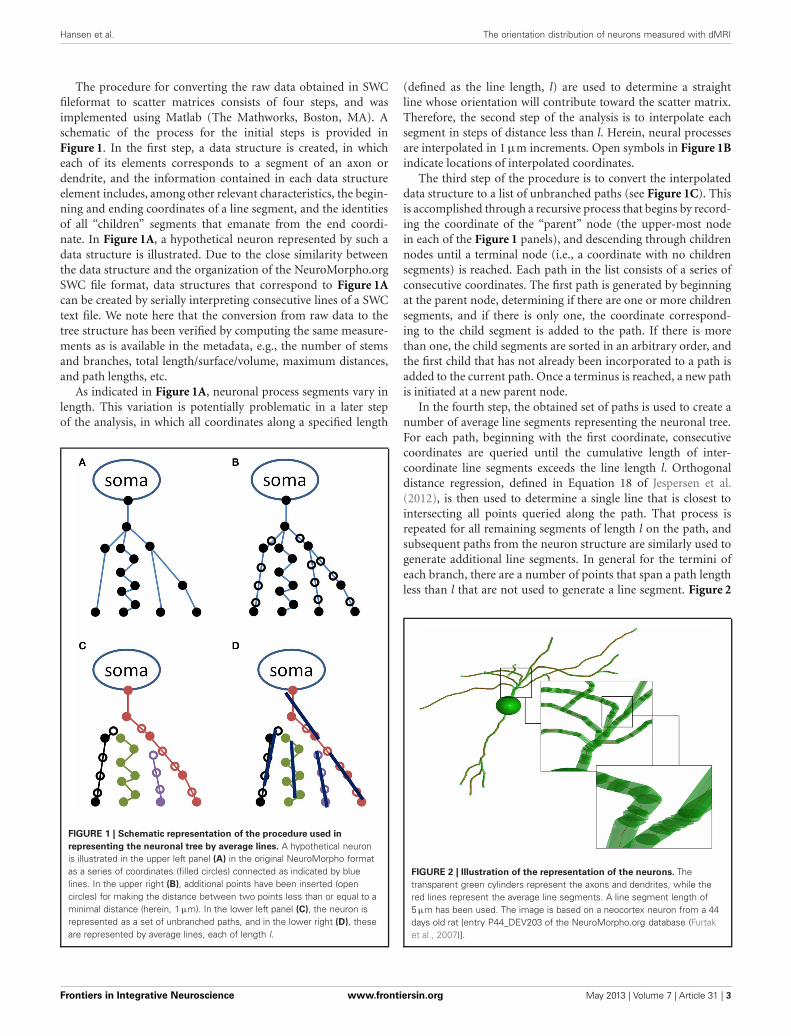
The procedure for converting the raw data obtained in SWCfileformat to scatter matrices consists of four steps, and wasimplemented using Matlab (The Mathworks, Boston, MA). Aschematic of the process for the initial steps is provided inFigure 1. In the first step, a data structure is created, in whicheach of its elements corresponds to a segment of an axon ordendrite, and the information contained in each data structureelement includes, among other relevant characteristics, the begin-ning and ending coordinates of a line segment, and the identitiesof all “children” segments that emanate from the end coordi-nate. In Figure 1A, a hypothetical neuron represented by such adata structure is illustrated. Due to the close similarity betweenthe data structure and the organization of the NeuroMorpho.orgSWC file format, data structures that correspond to Figure 1Acan be created by serially interpreting consecutive lines of a SWCtext file. We note here that the conversion from raw data to thetree structure has been verified by computing the same measure-ments as is available in the metadata, e.g., the number of stemsand branches, total length/surface/volume, maximum distances,and path lengths, etc.
As indicated in Figure 1A, neuronal process segments vary inlength. This variation is potentially problematic in a later stepof the analysis, in which all coordinates along a specified length
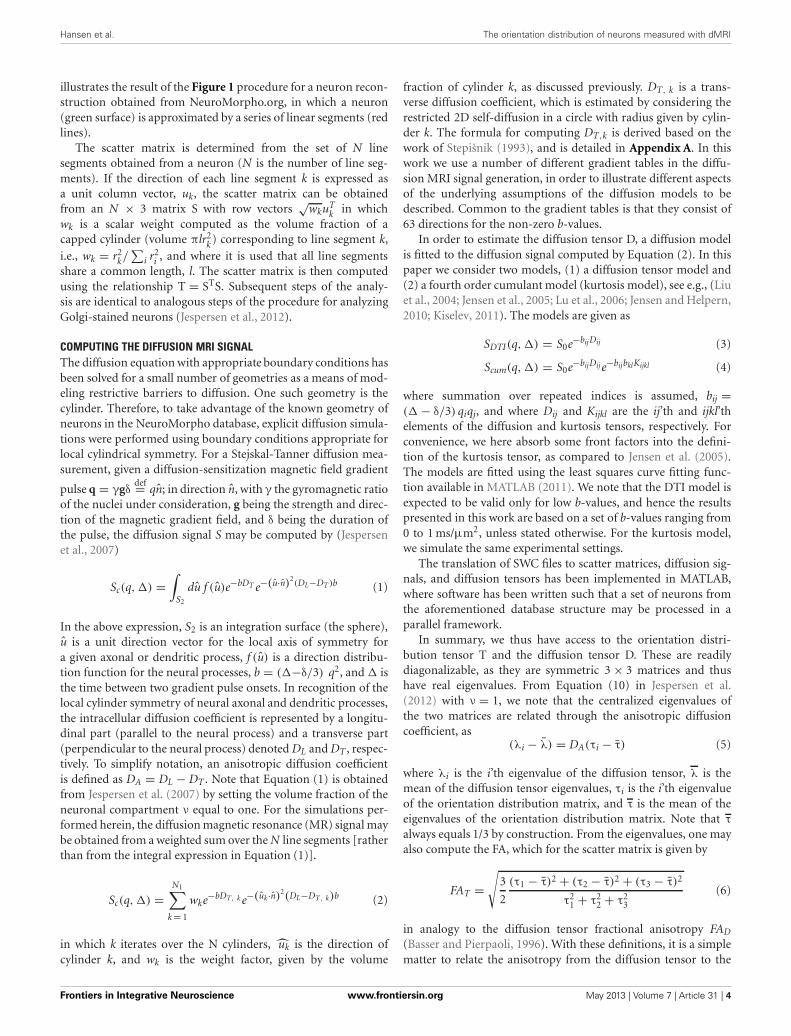
FIGURE 1 | Schematic representation of the procedure used in
representing the neuronal tree by average lines. A hypothetical neuronis illustrated in the upper left panel (A) in the original NeuroMorpho formatas a series of coordinates (filled circles) connected as indicated by bluelines. In the upper right (B), additional points have been inserted (opencircles) for making the distance between two points less than or equal to aminimal distance (herein, 1 μm). In the lower left panel (C), the neuron isrepresented as a set of unbranched paths, and in the lower right (D), theseare represented by average lines, each of length l.
(defined as the line length, l) are used to determine a straightline whose orientation will contribute toward the scatter matrix.Therefore, the second step of the analysis is to interpolate eachsegment in steps of distance less than l. Herein, neural processesare interpolated in 1 μm increments. Open symbols in Figure 1Bindicate locations of interpolated coordinates.
The third step of the procedure is to convert the interpolateddata structure to a list of unbranched paths (see Figure 1C). Thisis accomplished through a recursive process that begins by record-ing the coordinate of the “parent” node (the upper-most nodein each of the Figure 1 panels), and descending through childrennodes until a terminal node (i.e., a coordinate with no childrensegments) is reached. Each path in the list consists of a series ofconsecutive coordinates. The first path is generated by beginningat the parent node, determining if there are one or more childrensegments, and if there is only one, the coordinate correspond-ing to the child segment is added to the path. If there is morethan one, the child segments are sorted in an arbitrary order, andthe first child that has not already been incorporated to a path isadded to the current path. Once a terminus is reached, a new pathis initiated at a new parent node.
In the fourth step, the obtained set of paths is used to create anumber of average line segments representing the neuronal tree.For each path, beginning with the first coordinate, consecutivecoordinates are queried until the cumulative length of inter-coordinate line segments exceeds the line length l. Orthogonaldistance regression, defined in Equation 18 of Jespersen et al.(2012), is then used to determine a single line that is closest tointersecting all points queried along the path. That process isrepeated for all remaining segments of length l on the path, andsubsequent paths from the neuron structure are similarly used togenerate additional line segments. In general for the termini ofeach branch, there are a number of points that span a path lengthless than l that are not used to generate a line segment. Figure 2
FIGURE 2 | Illustration of the representation of the neurons. Thetransparent green cylinders represent the axons and dendrites, while thered lines represent the average line segments. A line segment length of5 μm has been used. The image is based on a neocortex neuron from a 44days old rat [entry P44_DEV203 of the NeuroMorpho.org database (Furtaket al., 2007)].
Frontiers in Integrative Neuroscience www.frontiersin.org May 2013 | Volume 7 | Article 31 | 3
Hansen et al. The orientation distribution of neurons measured with dMRI
illustrates the result of the Figure 1 procedure for a neuron recon-struction obtained from NeuroMorpho.org, in which a neuron(green surface) is approximated by a series of linear segments (redlines).
The scatter matrix is determined from the set of N linesegments obtained from a neuron (N is the number of line seg-ments). If the direction of each line segment k is expressed asa unit column vector, uk, the scatter matrix can be obtainedfrom an N × 3 matrix S with row vectors
√wkuT
k in whichwk is a scalar weight computed as the volume fraction of acapped cylinder (volume πlr2
k ) corresponding to line segment k,i.e., wk = r2
k/∑
i r2i , and where it is used that all line segments
share a common length, l. The scatter matrix is then computedusing the relationship T = STS. Subsequent steps of the analy-sis are identical to analogous steps of the procedure for analyzingGolgi-stained neurons (Jespersen et al., 2012).
COMPUTING THE DIFFUSION MRI SIGNALThe diffusion equation with appropriate boundary conditions hasbeen solved for a small number of geometries as a means of mod-eling restrictive barriers to diffusion. One such geometry is thecylinder. Therefore, to take advantage of the known geometry ofneurons in the NeuroMorpho database, explicit diffusion simula-tions were performed using boundary conditions appropriate forlocal cylindrical symmetry. For a Stejskal-Tanner diffusion mea-surement, given a diffusion-sensitization magnetic field gradient
pulse q = γgδdef= qn; in direction n, with γ the gyromagnetic ratio
of the nuclei under consideration, g being the strength and direc-tion of the magnetic gradient field, and δ being the duration ofthe pulse, the diffusion signal S may be computed by (Jespersenet al., 2007)
Sc(q,�) =∫
S2
du f (u)e−bDT e−(u·n)2(DL−DT )b (1)
In the above expression, S2 is an integration surface (the sphere),u is a unit direction vector for the local axis of symmetry fora given axonal or dendritic process, f (u) is a direction distribu-tion function for the neural processes, b = (�−δ/3) q2, and � isthe time between two gradient pulse onsets. In recognition of thelocal cylinder symmetry of neural axonal and dendritic processes,the intracellular diffusion coefficient is represented by a longitu-dinal part (parallel to the neural process) and a transverse part(perpendicular to the neural process) denoted DL and DT , respec-tively. To simplify notation, an anisotropic diffusion coefficientis defined as DA = DL − DT . Note that Equation (1) is obtainedfrom Jespersen et al. (2007) by setting the volume fraction of theneuronal compartment ν equal to one. For the simulations per-formed herein, the diffusion magnetic resonance (MR) signal maybe obtained from a weighted sum over the N line segments [ratherthan from the integral expression in Equation (1)].
Sc(q,�) =N1∑
k = 1
wke−bDT, k e−(uk·n)2(DL−DT, k)b (2)
in which k iterates over the N cylinders, uk is the direction ofcylinder k, and wk is the weight factor, given by the volume
fraction of cylinder k, as discussed previously. DT, k is a trans-verse diffusion coefficient, which is estimated by considering therestricted 2D self-diffusion in a circle with radius given by cylin-der k. The formula for computing DT,k is derived based on thework of Stepišnik (1993), and is detailed in Appendix A. In thiswork we use a number of different gradient tables in the diffu-sion MRI signal generation, in order to illustrate different aspectsof the underlying assumptions of the diffusion models to bedescribed. Common to the gradient tables is that they consist of63 directions for the non-zero b-values.
In order to estimate the diffusion tensor D, a diffusion modelis fitted to the diffusion signal computed by Equation (2). In thispaper we consider two models, (1) a diffusion tensor model and(2) a fourth order cumulant model (kurtosis model), see e.g., (Liuet al., 2004; Jensen et al., 2005; Lu et al., 2006; Jensen and Helpern,2010; Kiselev, 2011). The models are given as
SDTI(q,�) = S0e−bijDij (3)
Scum(q,�) = S0e−bijDij e−bijbklKijkl (4)
where summation over repeated indices is assumed, bij =(� − δ/3) qiqj, and where Dij and Kijkl are the ij’th and ijkl’thelements of the diffusion and kurtosis tensors, respectively. Forconvenience, we here absorb some front factors into the defini-tion of the kurtosis tensor, as compared to Jensen et al. (2005).The models are fitted using the least squares curve fitting func-tion available in MATLAB (2011). We note that the DTI model isexpected to be valid only for low b-values, and hence the resultspresented in this work are based on a set of b-values ranging from0 to 1 ms/μm2, unless stated otherwise. For the kurtosis model,we simulate the same experimental settings.
The translation of SWC files to scatter matrices, diffusion sig-nals, and diffusion tensors has been implemented in MATLAB,where software has been written such that a set of neurons fromthe aforementioned database structure may be processed in aparallel framework.
In summary, we thus have access to the orientation distri-bution tensor T and the diffusion tensor D. These are readilydiagonalizable, as they are symmetric 3 × 3 matrices and thushave real eigenvalues. From Equation (10) in Jespersen et al.(2012) with ν = 1, we note that the centralized eigenvalues ofthe two matrices are related through the anisotropic diffusioncoefficient, as
(λi − λ) = DA(τi − τ) (5)
where λi is the i’th eigenvalue of the diffusion tensor, λ is themean of the diffusion tensor eigenvalues, τi is the i’th eigenvalueof the orientation distribution matrix, and τ is the mean of theeigenvalues of the orientation distribution matrix. Note that τ
always equals 1/3 by construction. From the eigenvalues, one mayalso compute the FA, which for the scatter matrix is given by
FAT =√
3
2
(τ1 − τ)2 + (τ2 − τ)2 + (τ3 − τ)2
τ21 + τ2
2 + τ23
(6)
in analogy to the diffusion tensor fractional anisotropy FAD
(Basser and Pierpaoli, 1996). With these definitions, it is a simplematter to relate the anisotropy from the diffusion tensor to the
Frontiers in Integrative Neuroscience www.frontiersin.org May 2013 | Volume 7 | Article 31 | 4
Hansen et al. The orientation distribution of neurons measured with dMRI
one for the orientation matrix (Jespersen et al., 2012), the resultbeing
FAD
√λ2
1 + λ22 + λ2
3 = DAFAT
√τ2
1 + τ22 + τ2
3 (7)
As a final comment we note that the cell somas are treated asisotropic diffusion media (in Figure 2, the cell soma is repre-sented by a sphere), which does not contribute to the separationof transverse and longitudinal diffusion. As a natural conse-quence, the cell somas are not included in the calculation of thediffusion signal.
To assess the influence of non-gaussian effects on the compar-ison between diffusion tensor and scatter matrix eigenvalues, anadditional set of simulations were performed. In these, the MRIsignal was calculated on the basis of a distribution of infinitelylong and narrow cylinders with a diffusion coefficient D equal to1 μm2/ms. We used the Gaussian approximation for diffusion ineach single cylinder; thus, the signal contribution from a cylinderpointing along the direction u is exp(−bD(n · u)2) when diffu-sion weighting b is applied along n. The diffusion signal was thencomputed using 10,000 such cylinders with directions u randomlydrawn from a Watson distribution (Fisher and Embleton, 1987;Jespersen et al., 2012)
f (u) ∝ exp(κ
(u · z
)2)
(8)
with a given concentration parameter κ and principal orientationz; and this process was repeated for 191 concentration parametersranging from 1 to 20. The apparent diffusion coefficient, obtainedby fitting a monoexponential decay in signal intensity with b-value, in a direction parallel to z, is equal to the largest eigenvalueof the diffusion tensor, and the apparent diffusion coefficient per-pendicular to the principal orientation is equal to the smallesttwo eigenvalues (for positive Watson concentration parameters asused here). Correspondingly, the largest eigenvalue τ1 of the scat-ter matrix is determined by numerically averaging (u · z)2 over
the 10,000 cylinder directions, whereas the other two eigenval-ues are determined using τ2 = τ3 = (1 − τ1)/2. The resultingcharacterization of diffusion and scatter matrices enables anadditional and independent evaluation of Equations (5) and (7).
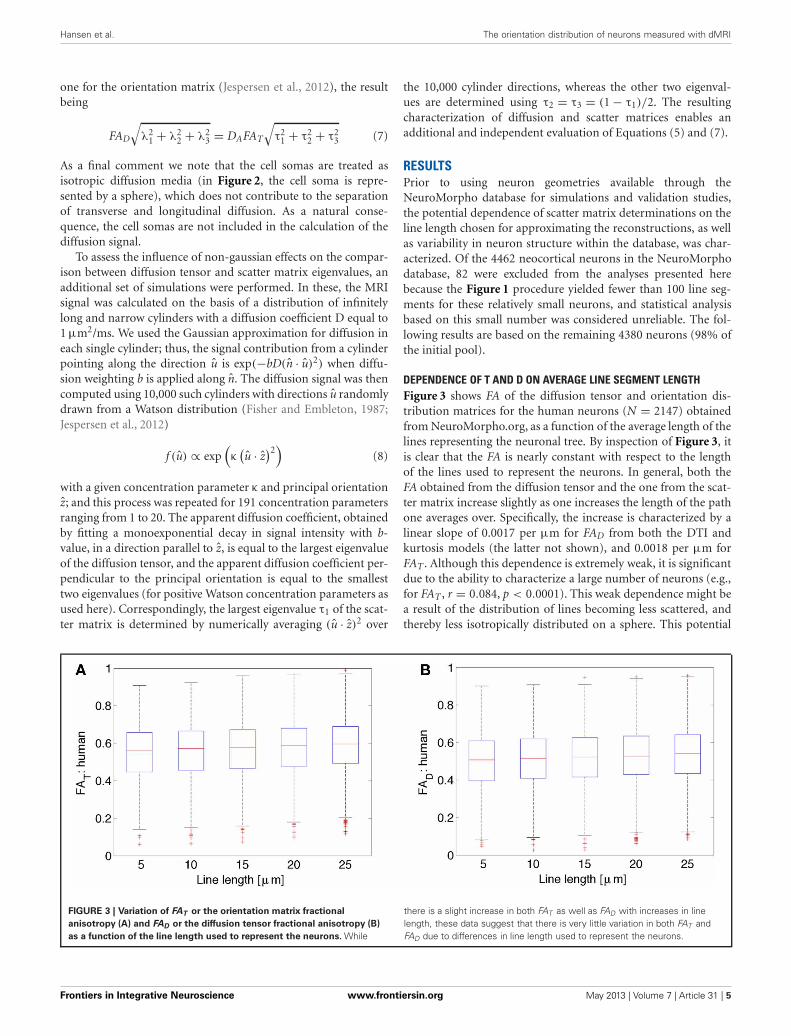
RESULTSPrior to using neuron geometries available through theNeuroMorpho database for simulations and validation studies,the potential dependence of scatter matrix determinations on theline length chosen for approximating the reconstructions, as wellas variability in neuron structure within the database, was char-acterized. Of the 4462 neocortical neurons in the NeuroMorphodatabase, 82 were excluded from the analyses presented herebecause the Figure 1 procedure yielded fewer than 100 line seg-ments for these relatively small neurons, and statistical analysisbased on this small number was considered unreliable. The fol-lowing results are based on the remaining 4380 neurons (98% ofthe initial pool).
DEPENDENCE OF T AND D ON AVERAGE LINE SEGMENT LENGTHFigure 3 shows FA of the diffusion tensor and orientation dis-tribution matrices for the human neurons (N = 2147) obtainedfrom NeuroMorpho.org, as a function of the average length of thelines representing the neuronal tree. By inspection of Figure 3, itis clear that the FA is nearly constant with respect to the lengthof the lines used to represent the neurons. In general, both theFA obtained from the diffusion tensor and the one from the scat-ter matrix increase slightly as one increases the length of the pathone averages over. Specifically, the increase is characterized by alinear slope of 0.0017 per μm for FAD from both the DTI andkurtosis models (the latter not shown), and 0.0018 per μm forFAT . Although this dependence is extremely weak, it is significantdue to the ability to characterize a large number of neurons (e.g.,for FAT , r = 0.084, p < 0.0001). This weak dependence might bea result of the distribution of lines becoming less scattered, andthereby less isotropically distributed on a sphere. This potential
FIGURE 3 | Variation of FAT or the orientation matrix fractional
anisotropy (A) and FAD or the diffusion tensor fractional anisotropy (B)
as a function of the line length used to represent the neurons. While
there is a slight increase in both FAT as well as FAD with increases in linelength, these data suggest that there is very little variation in both FAT andFAD due to differences in line length used to represent the neurons.
Frontiers in Integrative Neuroscience www.frontiersin.org May 2013 | Volume 7 | Article 31 | 5
Hansen et al. The orientation distribution of neurons measured with dMRI
trend is consistent with the expected result for the limiting caseof approximating an arbitrary neuronal tree by a single line, inwhich the scatter matrix has two zero eigenvalues, yielding unit(i.e., maximal) FA. Similar results as the ones presented for thehuman neocortical neurons were also obtained for other species(data not shown). Given the weak dependence of FAT and FAD online length, subsequent calculations presented here have utilizeda line length of 10 μm, as was done in earlier studies (Jespersenet al., 2012).
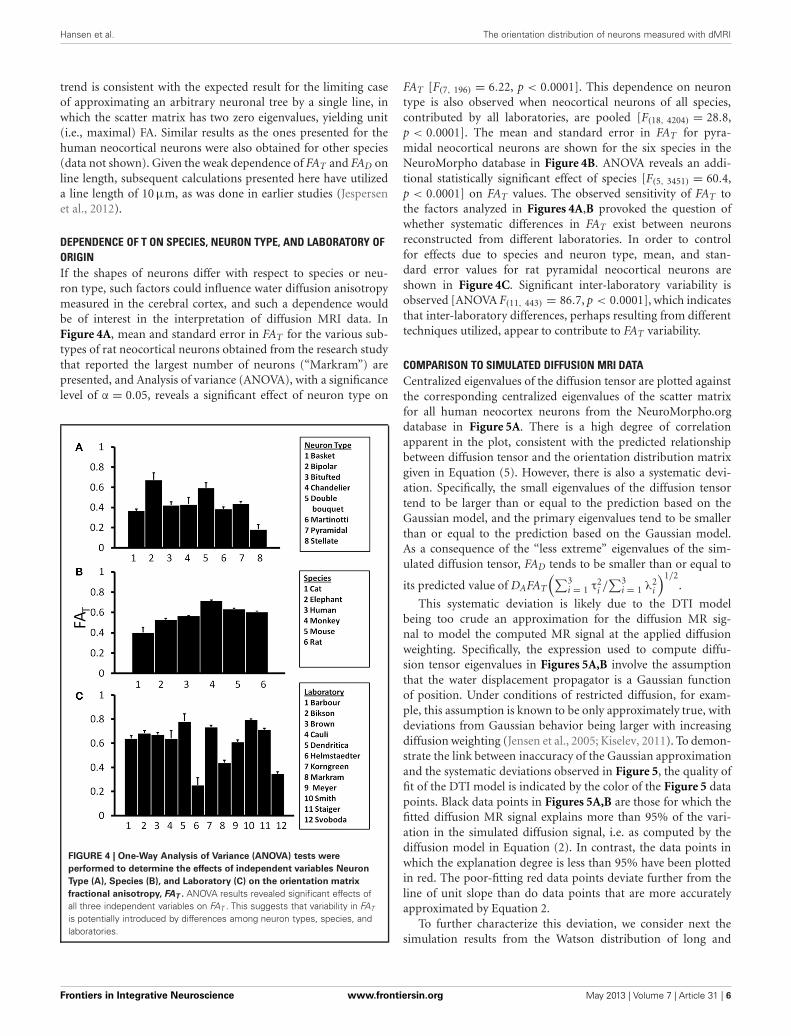
DEPENDENCE OF T ON SPECIES, NEURON TYPE, AND LABORATORY OFORIGINIf the shapes of neurons differ with respect to species or neu-ron type, such factors could influence water diffusion anisotropymeasured in the cerebral cortex, and such a dependence wouldbe of interest in the interpretation of diffusion MRI data. InFigure 4A, mean and standard error in FAT for the various sub-types of rat neocortical neurons obtained from the research studythat reported the largest number of neurons (“Markram”) arepresented, and Analysis of variance (ANOVA), with a significancelevel of α = 0.05, reveals a significant effect of neuron type on
FIGURE 4 | One-Way Analysis of Variance (ANOVA) tests were
performed to determine the effects of independent variables Neuron
Type (A), Species (B), and Laboratory (C) on the orientation matrix
fractional anisotropy, FAT . ANOVA results revealed significant effects ofall three independent variables on FAT . This suggests that variability in FAT
is potentially introduced by differences among neuron types, species, andlaboratories.
FAT [F(7, 196) = 6.22, p < 0.0001]. This dependence on neurontype is also observed when neocortical neurons of all species,contributed by all laboratories, are pooled [F(18, 4204) = 28.8,p < 0.0001]. The mean and standard error in FAT for pyra-midal neocortical neurons are shown for the six species in theNeuroMorpho database in Figure 4B. ANOVA reveals an addi-tional statistically significant effect of species [F(5, 3451) = 60.4,p < 0.0001] on FAT values. The observed sensitivity of FAT tothe factors analyzed in Figures 4A,B provoked the question ofwhether systematic differences in FAT exist between neuronsreconstructed from different laboratories. In order to controlfor effects due to species and neuron type, mean, and stan-dard error values for rat pyramidal neocortical neurons areshown in Figure 4C. Significant inter-laboratory variability isobserved [ANOVA F(11, 443) = 86.7, p < 0.0001], which indicatesthat inter-laboratory differences, perhaps resulting from differenttechniques utilized, appear to contribute to FAT variability.
COMPARISON TO SIMULATED DIFFUSION MRI DATACentralized eigenvalues of the diffusion tensor are plotted againstthe corresponding centralized eigenvalues of the scatter matrixfor all human neocortex neurons from the NeuroMorpho.orgdatabase in Figure 5A. There is a high degree of correlationapparent in the plot, consistent with the predicted relationshipbetween diffusion tensor and the orientation distribution matrixgiven in Equation (5). However, there is also a systematic devi-ation. Specifically, the small eigenvalues of the diffusion tensortend to be larger than or equal to the prediction based on theGaussian model, and the primary eigenvalues tend to be smallerthan or equal to the prediction based on the Gaussian model.As a consequence of the “less extreme” eigenvalues of the sim-ulated diffusion tensor, FAD tends to be smaller than or equal to
its predicted value of DAFAT
(∑3i = 1 τ2
i /∑3
i = 1 λ2i
)1/2.
This systematic deviation is likely due to the DTI modelbeing too crude an approximation for the diffusion MR sig-nal to model the computed MR signal at the applied diffusionweighting. Specifically, the expression used to compute diffu-sion tensor eigenvalues in Figures 5A,B involve the assumptionthat the water displacement propagator is a Gaussian functionof position. Under conditions of restricted diffusion, for exam-ple, this assumption is known to be only approximately true, withdeviations from Gaussian behavior being larger with increasingdiffusion weighting (Jensen et al., 2005; Kiselev, 2011). To demon-strate the link between inaccuracy of the Gaussian approximationand the systematic deviations observed in Figure 5, the quality offit of the DTI model is indicated by the color of the Figure 5 datapoints. Black data points in Figures 5A,B are those for which thefitted diffusion MR signal explains more than 95% of the vari-ation in the simulated diffusion signal, i.e. as computed by thediffusion model in Equation (2). In contrast, the data points inwhich the explanation degree is less than 95% have been plottedin red. The poor-fitting red data points deviate further from theline of unit slope than do data points that are more accuratelyapproximated by Equation 2.
To further characterize this deviation, we consider next thesimulation results from the Watson distribution of long and
Frontiers in Integrative Neuroscience www.frontiersin.org May 2013 | Volume 7 | Article 31 | 6

Hansen et al. The orientation distribution of neurons measured with dMRI
FIGURE 5 | In (A), the centralized eigenvalues (λ1, λ2, λ3) of the
diffusion tensor matrix (D) are plotted as a function of the
corresponding eigenvalues of the orientation distribution matrix (T).
In (B), the diffusion tensor fractional anisotropy (FAD ) is plotted as afunction of a scaled version of the orientation matrix fractionalanisotropy (FAT ), see text for details. The results of fitting the simulated
diffusion MRI data using a cumulant expansion expression are presentedfor centralized eigenvalues (C) and FA (D). The black and red symbolscorrespond to points where the DTI model explains more (black) or less(red) than 95% of the signal variation. Human neocortical neurons fromthe NeuroMorpho.org database were used for this analysis. Theeigenvalues are in units of μm2/ms.
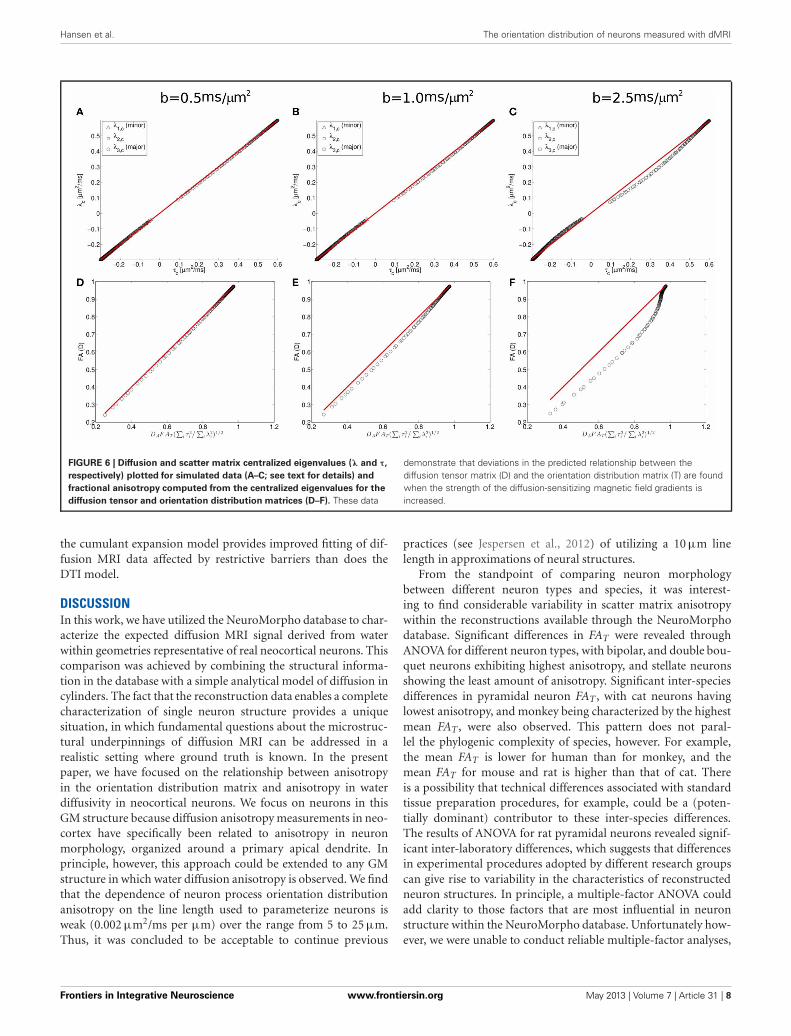
narrow cylinders. Consistent with the pattern shown in Figure 5,the simulation results determined from the Watson distribution(Figure 6) clearly display similar systematic deviations of theeigenvalues from the Gaussian model. As shown in Figure 5,the centralized eigenvalues of the diffusion tensor are “lessextreme” than the scatter matrix eigenvalues, resulting in
smaller FAD values than DAFAT
(∑3i = 1 τ2
i /∑3
i = 1 λ2i
)1/2shown
in Figures 5A,D. Moreover, these systematic trends becomemore pronounced when the effects of restricted diffusion areaccentuated by increasing the strength of the diffusion-sensitizingmagnetic field gradients. For b = 0.5 ms/μm2 the simulatedeigenvalues nearly coincide with the Equation (1.5) prediction(shown as a line in Figure 5), with the maximal differencebetween the predicted and observed FAD being 0.0173 at an FAD
value of 0.522. Increasing deviations are found when increas-ing the b-value to 1 and 2.5 ms/μm2 (Figures 6B,E and 6C,F,respectively), in which maximal differences between observed andpredicted FAD values being 0.040 at FAD value 0.586, and 0.142 atFAD value 0.580, respectively.
The Gaussian approximation can be viewed as the first termin the cumulant expansion, a systematic series expansion in dif-fusion weighting b of the log diffusion signal (Kiselev, 2011).Retaining the next term in the cumulant expansion correspondsto the so-called diffusion kurtosis imaging, which is a methodthat has been used previously to account for the effects ofnon-Gaussian displacements in diffusion MRI (Liu et al., 2004;Jensen et al., 2005; Lu et al., 2006; Jensen and Helpern, 2010;Kiselev, 2011), resulting in a more accurate description of thediffusion signal over a wider range of diffusion weightings. Theadditional degrees of freedom in this expression relative to adiffusion tensor have also been found to yield more accurateestimates of the diffusion tensor (Veraart et al., 2011). Theresults of fitting the simulated diffusion MRI data using a sec-ond order cumulant expansion expression [Equation (1.4)] arepresented for centralized eigenvalues and FA in Figures 5C,D,respectively. As expected, improved agreement with the Equation(1.5) prediction is observed in Figures 5C,D than in the cor-responding Figure 5 panels A and B, as made evident by thenarrower confidence bands (dashed lines in Figure 5), because
Frontiers in Integrative Neuroscience www.frontiersin.org May 2013 | Volume 7 | Article 31 | 7
Hansen et al. The orientation distribution of neurons measured with dMRI
FIGURE 6 | Diffusion and scatter matrix centralized eigenvalues (λ and τ,
respectively) plotted for simulated data (A–C; see text for details) and
fractional anisotropy computed from the centralized eigenvalues for the
diffusion tensor and orientation distribution matrices (D–F). These data
demonstrate that deviations in the predicted relationship between thediffusion tensor matrix (D) and the orientation distribution matrix (T) are foundwhen the strength of the diffusion-sensitizing magnetic field gradients isincreased.
the cumulant expansion model provides improved fitting of dif-fusion MRI data affected by restrictive barriers than does theDTI model.
DISCUSSIONIn this work, we have utilized the NeuroMorpho database to char-acterize the expected diffusion MRI signal derived from waterwithin geometries representative of real neocortical neurons. Thiscomparison was achieved by combining the structural informa-tion in the database with a simple analytical model of diffusion incylinders. The fact that the reconstruction data enables a completecharacterization of single neuron structure provides a uniquesituation, in which fundamental questions about the microstruc-tural underpinnings of diffusion MRI can be addressed in arealistic setting where ground truth is known. In the presentpaper, we have focused on the relationship between anisotropyin the orientation distribution matrix and anisotropy in waterdiffusivity in neocortical neurons. We focus on neurons in thisGM structure because diffusion anisotropy measurements in neo-cortex have specifically been related to anisotropy in neuronmorphology, organized around a primary apical dendrite. Inprinciple, however, this approach could be extended to any GMstructure in which water diffusion anisotropy is observed. We findthat the dependence of neuron process orientation distributionanisotropy on the line length used to parameterize neurons isweak (0.002 μm2/ms per μm) over the range from 5 to 25 μm.Thus, it was concluded to be acceptable to continue previous
practices (see Jespersen et al., 2012) of utilizing a 10 μm linelength in approximations of neural structures.
From the standpoint of comparing neuron morphologybetween different neuron types and species, it was interest-ing to find considerable variability in scatter matrix anisotropywithin the reconstructions available through the NeuroMorphodatabase. Significant differences in FAT were revealed throughANOVA for different neuron types, with bipolar, and double bou-quet neurons exhibiting highest anisotropy, and stellate neuronsshowing the least amount of anisotropy. Significant inter-speciesdifferences in pyramidal neuron FAT , with cat neurons havinglowest anisotropy, and monkey being characterized by the highestmean FAT , were also observed. This pattern does not paral-lel the phylogenic complexity of species, however. For example,the mean FAT is lower for human than for monkey, and themean FAT for mouse and rat is higher than that of cat. Thereis a possibility that technical differences associated with standardtissue preparation procedures, for example, could be a (poten-tially dominant) contributor to these inter-species differences.The results of ANOVA for rat pyramidal neurons revealed signif-icant inter-laboratory differences, which suggests that differencesin experimental procedures adopted by different research groupscan give rise to variability in the characteristics of reconstructedneuron structures. In principle, a multiple-factor ANOVA couldadd clarity to those factors that are most influential in neuronstructure within the NeuroMorpho database. Unfortunately how-ever, we were unable to conduct reliable multiple-factor analyses,
Frontiers in Integrative Neuroscience www.frontiersin.org May 2013 | Volume 7 | Article 31 | 8

Hansen et al. The orientation distribution of neurons measured with dMRI
because there was little overlap between laboratories in the speciesand neuron types studied, and this precluded our ability to quan-tify interactions between the proposed factors influencing FAT .
The results of the MR diffusion simulations were used to com-pare the orientation distribution estimated based on Equation 7to that determined directly from neuronal reconstructions. Forhuman neocortical neurons, a systematic deviation was observedbetween the MR-predicted and actual orientation distributions,such that the anisotropy in orientation distributions are erro-neously predicted to be low (Figure 5B). This effect is due to bothan underestimation of the primary eigenvalue, and overestima-tion of minor eigenvalues of the orientation matrices, and thesystematic discrepancy is larger for intermediate FA values thanfor extreme FA (Figures 5A,B).
One factor that contributes to the difference between predictedand observed orientation matrix eigenvectors is the approxima-tion that the MR signal decays as a mono-exponential functionof b (the Gaussian approximation). However, the accuracy ofthe Gaussian approximation is influenced by the amount of dif-fusion weighting as well as the form of the neurite orientationdistribution. Therefore, an additional series of calculations wereperformed specifically for Watson-distributed sets of neurites formultiple diffusion weighting conditions. The more pronounceddiscrepancy observed at higher b-values (Figure 6) supports thatthe Gaussian approximation is the source of the observed sys-tematic deviations, because the effects of restricted diffusion,which lead to non-monoexponential decay in MR signal inten-sity with b-value, are larger at higher b-values. Previous work(Veraart et al., 2011), has demonstrated that more general alter-natives to the DTI model of water diffusion, such as the cumulantexpansion/kurtosis models (Liu et al., 2004; Jensen et al., 2005;Lu et al., 2006; Jensen and Helpern, 2010; Kiselev, 2011), facil-itate improved accuracy in the description of water diffusionwithin tissue. Here we found that accounting for non-gaussianeffects by incorporating higher-order cumulant expansion termsinto the expression for water diffusion provided improved agree-ment between observed and MR-predicted neurite orientationdistribution eigenvalues (Figures 5C,D).
Some limitations in our ability to use results obtained here inthe interpretation of diffusion MR data obtained from biologicaltissue merit recognition. First, the NeuroMorpho database doesnot provide information related to the structure of the extra-cellular space. In ours and others previous work (Assaf et al.,2004; Jespersen et al., 2007; Alexander et al., 2010), a parameterrepresenting the volume fraction of the compartment exhibitinglocal cylindrical symmetry has been made explicit. This has been
equated to the volume fraction of the neuropil in our applicationsof diffusion MR to studies of brain GM (Jespersen et al., 2010,2012). Herein, the volume fraction of the cylindrical compart-ment has been fixed at a value of 1, reflecting our exclusive focuson diffusion within neurites from individual neurons, rather thanon tissue volume elements as in our previous work. Further,another assumption of our previously-described model concernsthe slow exchange of water across neuronal cell membranes. Thevalidity of this assumption is supported by the highly selectiveexpression of aquaporins (membrane water channels) in astro-cytes, but not in neurons (Amiry-Moghaddam and Ottersen,2003). It is also consistent with MR (Quirk et al., 2003; He et al.,2012) and PET (Larson et al., 1987) studies indicating a neu-ronal residence time of several seconds compared to a typicaldiffusion time of tens of milliseconds in diffusion MR experi-ments. However, it was not possible to specifically characterizethe effect of water exchange in the context of neuron reconstruc-tions provided by the NeuroMorpho database. Last, the effect ofmyelin on water diffusion anisotropy, which has been proposed toinfluence water diffusion anisotropy even within GM structuressuch as the mature cerebral cortex (Leuze et al., 2012; McNabet al., 2013) could not be addressed in this study due to thelack of glial cells in the NeuroMorpho data. Thus, although theanalyses presented here do provide a unique opportunity to char-acterize the influence of diffusion in known neuron structureson diffusion-weighted MR data, there are factors that influencewater diffusion in tissue that could not be addressed in thisstudy.
In conclusion, reconstructed neurons from the NeuroMorphodatabase were shown to span a wide range of scatter matrixanisotropy, making them suitable for extensive testing and modelvalidation. Here we used them to verify a close relationshipbetween the scatter matrix of neuronal structures and the dif-fusion tensors characterizing diffusion MRI, especially if care istaken to account for violations of Gaussian diffusion which affectthe estimation of the diffusion tensor. These results will be help-ful for a quantitative interpretation of GM diffusion anisotropy interms of neuronal morphology.
ACKNOWLEDGMENTSMikkel B. Hansen and Sune N. Jespersen were supported bythe Danish Ministry of Science, Technology, and Innovation’sUniversity Investment Grant (MINDLab). Support from NIHgrants R01 NS070022 and P51 RR000163 (Christopher D.Kroenke), and T32AG023477 (Lindsey A. Leigland) is alsoacknowledged.
REFERENCESAlexander, D. C., Hubbard, P. L.,
Hall, M. G., Moore, E. A., Ptito,M., Parker, G. J., et al. (2010).Orientationally invariant indicesof axon diameter and density fromdiffusion MRI. Neuroimage 52,1374–1389.
Amiry-Moghaddam, M., and Ottersen,O. P. (2003). The molecularbasis of water transport in the
brain. Nat. Rev. Neurosci. 4,991–1001.
Ascoli, G. A. (2006). Mobilizingthe base of neuroscience data:the case of neuronal mor-phologies. Nat. Rev. Neurosci. 7,318–324.
Ascoli, G. A., Donohue, D.E., and Halavi, M. (2007).NeuroMorpho.Org: a cen-tral resource for neuronal
morphologies. J. Neurosci. 27,9247–9251.
Assaf, Y., Freidlin, R. Z., Rohde, G. K.,and Basser, P. J. (2004). New model-ing and experimental framework tocharacterize hindered and restrictedwater diffusion in brain white mat-ter. Magn. Reson. Med. 52, 965–978.
Basser, P. J., and Pierpaoli, C. (1996).Microstructural and physiologicalfeatures of tissues elucidated by
quantitative-diffusion-tensor MRI.J. Mag. Reson. B 111, 209–219.
Beaulieu, C. (2002). The basis ofanisotropic water diffusion in thenervous system - a technical review.NMR Biomed. 15, 435–455.
Bock, A. S., Olavarria, J. F., Leigland,L. A., Taber, E. N., Jespersen, S.N., and Kroenke, C. D. (2010).Diffusion tensor imaging detectsearly cerebral cortex abnormalities
Frontiers in Integrative Neuroscience www.frontiersin.org May 2013 | Volume 7 | Article 31 | 9

Hansen et al. The orientation distribution of neurons measured with dMRI
in neuronal architecture inducedby bilateral neonatal enucleation:an experimental model in the fer-ret. Front. Syst. Neurosci. 4:149. doi:10.3389/fnsys.2010.00149
Budde, M. D., Janes, L., Gold, E.,Turtzo, L. C., and Frank, J. A.(2011). The contribution of glio-sis to diffusion tensor anisotropyand tractography following trau-matic brain injury: validation inthe rat using Fourier analysis ofstained tissue sections. Brain 134,2248–2260.
Cannon, R. C., Turner, D. A., Pyapali,G. K., and Wheal, H. V. (1998).An on-line archive of reconstructedhippocampal neurons. J. Neurosci.Methods 84, 49–54.
deIpolyi, A. R., Mukherjee, P., Gill,K., Henry, R. G., Partridge,S. C., Veeraraghavan, S., et al.(2005).Comparing microstructuraland macrosctructural developmentof the cerebral cortex in prema-ture newborns: diffusion tensorimaging versus cortical gyration.Neuroimage 27, 579–586.
Delgado y Palacios, R., Campo, A.,Henningsen, K., Verhoye, M.,Poot, D., Dijkstra, J., et al. (2011).Magnetic resonance imaging andspectroscopy reveal differentialhippocampal changes in anhedo-nic and resilient subtypes of thechronic mild stress rat model. Biol.Psychiatry 70, 449–457.
Fisher, T. L. N. I., and Embleton,B. J. J. (1987). Statistical Analysisof Spherical Data. Cambridge:Cambridge University Press.
Furtak, S. C., Moyer, J. R. Jr., andBrown, T. H. (2007). Morphologyand ontogeny of rat perirhinal cor-tical neurons. J. Comp. Neurol. 505,493–510.
He, X., Raichle, M. E., and Yablonskiy,D. A. (2012). Transmembranedynamics of water exchange inhuman brain. Magn. Reson. Med.67, 562–571.
Huang, H., Xue, R., Zhang, J., Ren, T.,Richards, L. J., Yarowsky, P., et al.(2009).Anatomical characterizationof human fetal brain developmentwith diffusion tensor magnetic res-onance imaging. J. Neurosci. 29,4263–4273.
Huang, H., Yamamoto, A., Hossain,M. A., Younes, L., and Mori, S.(2008). Quantitative cortical map-ping of fractional anisotropy indeveloping rat brains. J. Neurosci.28, 1427–1433.
Jensen, J. H., and Helpern, J. A.(2010). MRI quantification of non-Gaussian water diffusion by kur-tosis analysis. NMR Biomed. 23,698–710.
Jensen, J. H., Helpern, J. A., Ramani,A., Lu, H. Z., and Kaczynski, K.(2005). Diffusional kurtosis imag-ing: the quantification of non-Gaussian water diffusion by meansof magnetic resonance imaging.Magn. Reson. Med. 53, 1432–1440.
Jespersen, S. N., Bjarkam, C. R.,Nyengaard, J. R., Chakravarty,M. M., Hansen, B., Vosegaard,T., et al. (2010). Neurite den-sity from magnetic resonancediffusion measurements at ultra-high field: comparison withlight microscopy and electronmicroscopy. Neuroimage 49,205–216.
Jespersen, S. N., Kroenke, C. D.,Ostergaard, L., Ackerman, J. J., andYablonskiy, D. A. (2007). Modelingdendrite density from magneticresonance diffusion measurements.Neuroimage 34, 1473–1486.
Jespersen, S. N., Leigland, L. A.,Cornea, A., and Kroenke, C. D.(2012).Determination of axonaland dendritic orientation distri-butions within the developingcerebral cortex by diffusion tensorimaging. IEEE Trans. Med. Imaging31, 16–32.
Kiselev, V. G. (2011). “The cumu-lant expansion: an overarchingmathematical framework forunderstanding diffusion NMR,” inDiffusion MRI: Theory, Methods,and Applications, ed D. K. Jones(Oxford: Oxford University Press),152–168.
Kroenke, C. D., Ackerman, J. J., andYablonskiy, D. A. (2004). On thenature of the NAA diffusion atten-uated MR signal in the central ner-vous system. Magn. Reson. Med. 52,1052–1059.
Kroenke, C. D., Taber, E. N., Leigland,L. A., Knutsen, A. K., and Bayly, P.V. (2009). Regional patterns of cere-bral cortical differentiation deter-mined by diffusion tensor MRI.Cereb. Cortex 19, 2916–2929.
Kroenke, C. D., Van Essen, D. C.,Inder, T. E., Rees, S., Bretthorst,G. L., and Neil, J. J. (2007).Microstructural changes of thebaboon cerebral cortex duringgestational development reflectedin magnetic resonance imagingdiffusion anisotropy. J. Neurosci. 27,12506–12515.
Laitinen, T., Sierra, A., Pitkanen, A.,and Grohn, O. (2010). Diffusiontensor MRI of axonal plasticity inthe rat hippocampus. Neuroimage51, 521–530.
Larson, K. B., Markham, J., and Raichle,M. E. (1987). Tracer-kinetic mod-els for measuring cerebral bloodflow using externally detected
radiotracers. J. Cereb. Blood Flow.Metab. 7, 443–463.
Le Bihan, D. (2003). Looking intothe functional architecture of thebrain with diffusion MRI. Nat. Rev.Neurosci. 4, 469–480.
Leigland, L. A., and Kroenke, C. D.(2010). “A comparative analysis ofcellular morphological differentia-tion within the cerebral cortex usingdiffusion tensor imaging,” in AnimalModels of Behavioral Analysis, edJ. Raber (New York, NY: HumanaPress), 50, 329–352.
Leuze, C. W., Anwander, A., Bazin, P.L., Dhital, B., Stuber, C., Reimann,K., et al. (2012). Layer-specificintracortical connectivity revealedwith diffusion MRI. Cereb. Cortex.doi: 10.1093/cercor/bhs311. [Epubahead of print].
Liu, C. L., Bammer, R., Acar, B.,and Moseley, M. E. (2004).Characterizing non-Gaussiandiffusion by using generalized dif-fusion tensors. Magn. Reson. Med.51, 924–937.
Lu, H. Z., Jensen, J. H., Ramani,A., and Helpern, J. A. (2006).Three-dimensional characterizationof non-gaussian water diffusionin humans using diffusion kur-tosis imaging. NMR Biomed. 19,236–247.
Maas, L. C., Mukherjee, P., Carballido-Gamio, J., Veeraraghavan, S., Miller,S. P., Partridge, S. C., et al. (2004).Early laminar organization of thehuman cerebrum demonstratedwith diffusion tensor imagingin extremely premature infants.Neuroimage 22, 1134–1140.
MATLAB. (2011). 7.13.0.564 (R2011b).Natick, MA: MathWorks.
McKinstry, R. C., Mathur, A., Miller,J. P., Ozcan, A. O., Snyder, A. Z.,Schefft, G. L., et al. (2002). Radialorganization of developing humancerebral cortex revealed by non-invasive water diffusion anisotropyMRI. Cereb. Cortex 12, 1237–1243.
McNab, J. A., Polimeni, J. R., Wang,R., Augustinack, J. C., Fujimoto,K., Stevens, A., et al. (2013).Surface based analysis of diffusionorientation for identifying archi-tectonic domains in the in vivohuman cortex. Neuroimage 69,87–100.
Mitra, P. P., and Halperin, B. I. (1995).Effects of finite gradient-pulsewidths in pulsed-field-gradientdiffusion measurements. J. Magn.Reson. A 113, 94–101.
Mori, S., and Zhang, J. (2006).Principles of diffusion tensor imag-ing and its applications to basicneuroscience research. Neuron 51,527–539.
Ozcan, A. (2010). A new model fordiffusion weighted MRI: completeFourier direct MRI. Conf. Proc.IEEE Eng. Med. Biol. Soc. 2010,2710–2713.
Quirk, J. D., Bretthorst, G. L., Duong,T. Q., Snyder, A. Z., Springer,C. S. Jr., Ackerman, J. J., et al.(2003). Equilibrium water exchangebetween the intra- and extra-cellular spaces of mammalianbrain. Magn. Reson. Med. 50,493–499.
Shepherd, T. M., Ozarslan, E., King, M.A., Mareci, T. H., and Blackband,S. J. (2006). Structural insightsfrom high-resolution diffusiontensor imaging and tractographyof the isolated rat hippocampus.Neuroimage 32, 1499–1509.
Sizonenko, S. V., Camm, E. J., Garbow,J. R., Maier, S. E., Inder, T. E.,Williams, C. E., et al. (2007).Developmental changes andinjury induced disruption of theradial organization of the cor-tex in the immature rat brainrevealed by in vivo diffusiontensor MRI. Cereb. Cortex 17,2609–2617.
Stepišnik, J. (1999). Validity limits ofGaussian approximation in cumu-lant expansion for diffusion atten-uation of spin echo. Phys. B 270,110–117.
Stepišnik, J. (1993). Time-dependentself-diffusion by nmr spin-echo.Phys. B 183, 343–350.
Sukstanskii, A. L., and Yablonskiy, D.A. (2002). Effects of restricted dif-fusion on MR signal formation.J. Magn. Reson. 157, 92–105.
Takahashi, E., Dai, G., Rosen, G. D.,Wang, R., Ohki, K., Folkerth, R. D.,et al. (2011). Developing neocor-tex organization and connectivity incats revealed by direct correlationof diffusion tractography and histol-ogy. Cereb. Cortex 21, 200–211.
Thornton, J. S., Ordidge, R. J.,Penrice, J., Cady, E. B., Amess,P. N., Punwani, S., et al. (1997).Anisotropic water diffusion in whiteand gray matter of the neonatalpiglet brain before and after tran-sient hypoxia-ischaemia. Magn.Reson Imaging 15, 433–440.
Veraart, J., Poot, D. H., Van Hecke,W., Blockx, I., Van der Linden,A., Verhoye, M., et al. (2011).More accurate estimation ofdiffusion tensor parametersusing diffusion Kurtosis imag-ing. Magn. Reson. Med. 65,138–145.
Vestergaard-Poulsen, P., Wegener,G., Hansen, B., Bjarkam, C. R.,Blackband, S. J., Nielsen, N. C., et al.(2011). Diffusion-weighted MRI
Frontiers in Integrative Neuroscience www.frontiersin.org May 2013 | Volume 7 | Article 31 | 10
Hansen et al. The orientation distribution of neurons measured with dMRI
and quantitative biophysical model-ing of hippocampal neurite loss inchronic stress. PLoS ONE 6:e20653.doi: 10.1371/journal.pone.0020653
Wozniak, J. R., Mueller, B. A., Chang,P. N., Muetzel, R. L., Caros, L.,and Lim, K. O. (2006). Diffusiontensor imaging in children withfetal alcohol spectrum disor-ders. Alcohol. Clin. Exp. Res. 30,1799–1806.
Zielinski, L. J., and Sen, P. N. (2003).Effects of finite-width pulses in
the pulsed-field gradient measure-ment of the diffusion coefficient inconnected porous media. J. Magn.Reson. 165, 153–161.
Zhang, J., van Zijl, P. C. M., and Mori,S. (2002). Three-dimensional dif-fusion tensor magnetic resonancemicroimaging of adult mouse brainand hippocampus. Neuroimage 15,892–901.
Conflict of Interest Statement: Theauthors declare that the research
was conducted in the absence of anycommercial or financial relationshipsthat could be construed as a potentialconflict of interest.
Received: 29 October 2012; accepted: 16April 2013; published online: 14 May2013.Citation: Hansen MB, Jespersen SN,Leigland LA and Kroenke CD (2013)Using diffusion anisotropy to character-ize neuronal morphology in gray mat-ter: the orientation distribution of axons
and dendrites in the NeuroMorpho.orgdatabase. Front. Integr. Neurosci. 7:31.doi: 10.3389/fnint.2013.00031Copyright © 2013 Hansen, Jespersen,Leigland and Kroenke. This is an open-access article distributed under the termsof the Creative Commons AttributionLicense, which permits use, distributionand reproduction in other forums, pro-vided the original authors and sourceare credited and subject to any copy-right notices concerning any third-partygraphics etc.
Frontiers in Integrative Neuroscience www.frontiersin.org May 2013 | Volume 7 | Article 31 | 11
Hansen et al. The orientation distribution of neurons measured with dMRI
APPENDIX AESTIMATING THE TRANSVERSE DIFFUSION COEFFICIENTIn this appendix, we present the key points in deriving an expres-sion for the transverse diffusion coefficient DT . Following thework of Stepišnik (1993), one may compute the diffusion of a sin-gle proton based on a cumulant expansion of the self-diffusionexpression. We choose to truncate the expansion at second order,yielding
S(q,�) = S0e−bDT = S0e−β(�) (A1)
where β (�) is the second order term in the cumulant expansion,and it has been used that the longitudinal part of the diffusionsignal is zero, as we focus solely on diffusion orthogonal to thecylinder direction. In Equation (A1), the first equality is the sig-nal corresponding to Equation (2) for a single proton diffusingtransversely in a cylinder. The second equality models the phaseof a single proton, and depends on the type of experiment per-formed, the boundaries if the diffusion compartment, etc., seeStepišnik (1993). Relating the left and right hand sides of thesecond equality sign, one obtains an expression for DT
DT = 1
bβ(�) (A2)
Following the derivations in Stepišnik (1993), we now expressβ (�) in terms of the longitudinal diffusivity DL and the neuriteradius R, as
β (�) = 2
(γG
DL
)∑k
Bk
a2k
[akDLδ − 1
+ e−akDLδ + e−akDL� (1 − cosh (akDLδ))
](A3)
where γ is the gyromagnetic ratio of the nuclei under consid-eration, g is the magnetic field gradient strength. In Equation(A3), Bk and ak depend on the boundaries of the self-diffusioncompartment. In the case of a cylindrical compartment of radiusR, which is the relevant compartment in our case, one obtains(Stepišnik, 1993)
Bk = 2(R/μk)
2
μ2k − 1
and ak =(μk
R
)2(A4)
where μk is the k’th root of the first derivative of the first orderBessel function of the first kind. It is now a simple task to combineEquations (A2), (A3), and (A4) to obtain an expression for thetransverse diffusion coefficient in terms of a fixed radius and pulseparameters � and δ. The final expression being
DT = 4R6 ((δD)2 (� − δ/3)
)−1 ∑k
(μ6
k
(μ2
k − 1))−1
[μ2
kDδ
R2− 1 + e
− μ2k Dδ
R2 + e− μ2
k D�
R2
− 1
2e− μ2
k D(� − δ)
R2 + 1
2e− μ2
k D(� + δ)
R2
](A5)
In which it has been used that b = (γgδ
)2(� − δ/3). In this
work the summation in Equation (A5) is truncated after the tenthroot, which is deemed sufficient in terms of convergence of theseries.
APPENDIX BADDITIONAL INFORMATION: NeuroMorpho.org REFERENCESAnderson, K., Bones, B., Robinson, B., Hass, C., Lee, H., Ford, K., et al. (2009). The
morphology of supragranular pyramidal neurons in the human insular cortex:a quantitative Golgi study. Cereb. Cortex 19, 2131–2144.
Anderson, S. A., Classey, J. D., Conde, F., Lund, J. S., and Lewis, D. A.(1995). Synchronous development of pyramidal neuron dendritic spines andparvalbumin-immunoreactive chandelier neuron axon terminals in layer III ofmonkey prefrontal cortex. Neuroscience 67, 7–22.
Ballesteros-Yanez, I., Valverde, O., Ledent, C., Maldonado, R., and DeFelipe, J.(2007). Chronic cocaine treatment alters dendritic arborization in the adultmotor cortex through a CB1 cannabinoid receptor-dependent mechanism.Neuroscience 146, 1536–1545.
Barbour, D. L., and Callaway, E. M. (2008). Excitatory local connections ofsuperficial neurons in rat auditory cortex. J. Neurosci. 28, 11174–11185.
Bar-Yehuda, D., and Korngreen, A. (2008). Space-clamp problems when voltageclamping neurons expressing voltage-gated conductances. J. Neurophysiol. 99,1127–1136.
Bergstrom, H. C., McDonald, C. G., French, H. T., and Smith, R. F. (2008).Continuous nicotine administration produces selective, age-dependent struc-tural alteration of pyramidal neurons from prelimbic cortex. Synapse 62, 31–39.
Bergstrom, H. C., Smith, R. F., Mollinedo, N. S., and McDonald, C. G. (2010).Chronic nicotine exposure produces lateralized, age-dependent dendriticremodeling in the rodent basolateral amygdala. Synapse 64, 754–764.
Contreras, D., Destexhe, A., and Steriade, M. (1997). Intracellular and computa-tional characterization of the intracortical inhibitory control of synchronizedthalamic inputs in vivo. J. Neurophysiol. 78, 335–350.
Cossart, R., Aronov, D., and Yuste, R. (2003). Attractor dynamics of network UPstates in the neocortex. Nature 423, 283–288.
Duan, H., Wearne, S. L., Morrison, J. H., and Hof, P. R. (2002). Quantitative anal-ysis of the dendritic morphology of corticocortical projection neurons in themacaque monkey association cortex. Neuroscience 114, 349–359.
Duan, H., Wearne, S. L., Rocher, A. B., Macedo, A., Morrison, J. H., and Hof, P. R.(2003). Age-related dendritic and spine changes in corticocortically projectingneurons in macaque monkeys. Cereb. Cortex 13, 950–961.
Dumitriu, D., Cossart, R., Huang, J., and Yuste, R. (2007). Correlation betweenaxonal morphologies and synaptic input kinetics of interneurons from mousevisual cortex. Cereb. Cortex 17, 81–91.
Furtak, S. C., Moyer, J. R. Jr., and Brown, T. H. (2007). Morphology and ontogenyof rat perirhinal cortical neurons. J. Comp. Neurol. 505, 493–510.
Garden, D. L., Dodson, P. D., O’Donnell, C., White, M. D., and Nolan, M. F.(2008). Tuning of synaptic integration in the medial entorhinal cortex to theorganization of grid cell firing fields. Neuron 60, 875–889.
Goldberg, J. H., Lacefield, C. O., and Yuste, R. (2004). Global dendritic calciumspikes in mouse layer 5 low threshold spiking interneurones: implications forcontrol of pyramidal cell bursting. J. Physiol. 558, 465–478.
Goldberg, J. H., Tamas, G., Aronov, D., and Yuste, R. (2003). Calciummicrodomains in aspiny dendrites. Neuron 40, 807–821.
Gonzalez-Burgos, G., Krimer, L. S., Povysheva, N. V., Barrionuevo, G., and Lewis,D. A. (2005). Functional properties of fast spiking interneurons and their synap-tic connections with pyramidal cells in primate dorsolateral prefrontal cortex.J. Neurophysiol. 93, 942–953.
Gonzalez-Burgos, G., Krimer, L. S., Urban, N. N., Barrionuevo, G., and Lewis, D.A. (2004). Synaptic efficacy during repetitive activation of excitatory inputs inprimate dorsolateral prefrontal cortex. Cereb. Cortex 14, 530–542.
Hay, E., Hill, S., Schurmann, F., Markram, H., and Segev, I. (2011). Models ofneocortical layer 5b pyramidal cells capturing a wide range of dendritic andperisomatic active properties. PLoS Comput. Biol. 7:e1002107. doi: 10.1371/journal.pcbi.1002107
Hayes, T. L., and Lewis, D. A. (1996). Magnopyramidal neurons in the anteriormotor speech region. Dendritic features and interhemispheric comparisons.Arch. Neurol. 53, 1277–1283.
Frontiers in Integrative Neuroscience www.frontiersin.org May 2013 | Volume 7 | Article 31 | 12

Hansen et al. The orientation distribution of neurons measured with dMRI
Helmstaedter, M., Sakmann, B., and Feldmeyer, D. (2009). The relation betweendendritic geometry, electrical excitability, and axonal projections of L2/3interneurons in rat barrel cortex. Cereb. Cortex 19, 938–950.
Hirsch, J. A., Martinez, L. M., Alonso, J. M., Desai, K., Pillai, C., and Pierre, C.(2002). Synaptic physiology of the flow of information in the cat’s visual cortexin vivo. J. Physiol. 540, 335–350.
Ikegaya, Y., Le Bon-Jego, M., and Yuste, R. (2005). Large-scale imaging of corticalnetwork activity with calcium indicators. Neurosci. Res. 52, 132–138.
Jacobs, B., Driscoll, L., and Schall, M. (1997). Life-span dendritic and spine changesin areas 10 and 18 of human cortex: a quantitative Golgi study. J. Comp. Neurol.386, 661–680.
Jacobs, B., Lubs, J., Hannan, M., Anderson, K., Butti, C., Sherwood, C. C., et al.(2011). Neuronal morphology in the African elephant (Loxodonta africana)neocortex. Brain Struct. Funct. 215, 273–298.
Jacobs, B., Schall, M., Prather, M., Kapler, E., Driscoll, L., Baca, S., et al. (2001).Regional dendritic and spine variation in human cerebral cortex: a quantitativegolgi study. Cereb. Cortex 11, 558–571.
Karagiannis, A., Gallopin, T., David, C., Battaglia, D., Geoffroy, H., Rossier, J., et al.(2009). Classification of NPY-expressing neocortical interneurons. J. Neurosci.29, 3642–3659.
Kawaguchi, Y., Karube, F., and Kubota, Y. (2006). Dendritic branch typing andspine expression patterns in cortical nonpyramidal cells. Cereb. Cortex 16,696–711.
Kisvarday, Z. F., and Eysel, U. T. (1992). Cellular organization of reciprocal patchynetworks in layer III of cat visual cortex (area 17). Neuroscience 46, 275–286.
Krimer, L. S., Zaitsev, A. V., Czanner, G., Kroner, S., Gonzalez-Burgos, G.,Povysheva, N. V., et al. (2005). Cluster analysis-based physiological classificationand morphological properties of inhibitory neurons in layers 2-3 of monkeydorsolateral prefrontal cortex. J. Neurophysiol. 94, 3009–3022.
Kubota, Y., Karube, F., Nomura, M., Gulledge, A. T., Mochizuki, A., Schertel, A.,et al. (2011). Conserved properties of dendritic trees in four cortical interneuronsubtypes. Sci. Rep. 1:89. doi: 10.1038/srep00089
Le Magueresse, C., Alfonso, J., Khodosevich, K., Arroyo Martin, A. A., Bark, C., andMonyer, H. (2011). Small axonless neurons: postnatally generated neocorticalinterneurons with delayed functional maturation. J. Neurosci. 31, 16731–16747.
MacLean, J. N., Watson, B. O., Aaron, G. B., and Yuste, R. (2005). Internal dynamicsdetermine the cortical response to thalamic stimulation. Neuron 48, 811–823.
Mainen, Z. F., and Sejnowski, T. J. (1996). Influence of dendritic structure on firingpattern in model neocortical neurons. Nature 382, 363–366.
Martinez, L. M., Wang, Q., Reid, R. C., Pillai, C., Alonso, J. M., Sommer, F. T., et al.(2005). Receptive field structure varies with layer in the primary visual cortex.Nat. Neurosci. 8, 372–379.
McDonald, C. G., Dailey, V. K., Bergstrom, H. C., Wheeler, T. L., Eppolito, A. K.,Smith, L. N., et al. (2005). Periadolescent nicotine administration producesenduring changes in dendritic morphology of medium spiny neurons fromnucleus accumbens. Neurosci. Lett. 385, 163–167.
McGarry, L. M., Packer, A. M., Fino, E., Nikolenko, V., Sippy, T., and Yuste,R. (2010). Quantitative classification of somatostatin-positive neocorticalinterneurons identifies three interneuron subtypes. Front. Neural Circuits 4:12.doi: 10.3389/fncir.2010.00012
Meyer, H. S., Wimmer, V. C., Hemberger, M., Bruno, R. M., de Kock, C. P., Frick, A.,et al. (2010). Cell type-specific thalamic innervation in a column of rat vibrissalcortex. Cereb. Cortex 20, 2287–2303.
Nikolenko, V., Poskanzer, K. E., and Yuste, R. (2007). Two-photon photostimula-tion and imaging of neural circuits. Nat. Methods 4, 943–950.
Packer, A. M., and Yuste, R. (2011). Dense, unspecific connectivity of neocorti-cal parvalbumin-positive interneurons: a canonical microcircuit for inhibition?J. Neurosci. 31, 13260–13271.
Poorthuis, R. B., Bloem, B., Schak, B., Wester, J., de Kock, C. P., and Mansvelder,H. D. (2013). Layer-specific modulation of the prefrontal cortex by nicotinicacetylcholine receptors. Cereb. Cortex. 23, 148–161.
Povysheva, N. V., Zaitsev, A. V., Kroner, S., Krimer, O. A., Rotaru, D. C.,Gonzalez-Burgos, G., et al. (2007). Electrophysiological differences betweenneurogliaform cells from monkey and rat prefrontal cortex. J. Neurophysiol. 97,1030–1039.
Radman, T., Ramos, R. L., Brumberg, J. C., and Bikson, M. (2009). Role of corticalcell type and morphology in subthreshold and suprathreshold uniform electricfield stimulation in vitro. Brain Stimul. 2, 215–28, 228.e1–228.e3.
Ramos, R. L., Tam, D. M., and Brumberg, J. C. (2008). Physiology and morphologyof callosal projection neurons in mouse. Neuroscience 153, 654–663.
Rocher, A. B., Crimins, J. L., Amatrudo, J. M., Kinson, M. S., Todd-Brown, M. A.,Lewis, J., et al. (2010). Structural and functional changes in tau mutant miceneurons are not linked to the presence of NFTs. Exp. Neurol 223, 385–393.
Sava, B. A., David, C. S., Teissier, A., Pierani, A., Staiger, J. F., Luhmann, H. J., et al.(2010). Electrophysiological and morphological properties of Cajal-Retzius cellswith different ontogenetic origins. Neuroscience 167, 724–734.
Schubert, D., Kotter, R., Luhmann, H. J., and Staiger, J. F. (2006). Morphology,electrophysiology and functional input connectivity of pyramidal neurons char-acterizes a genuine layer va in the primary somatosensory cortex. Cereb. Cortex16, 223–236.
Schubert, D., Kotter, R., Zilles, K., Luhmann, H. J., and Staiger, J. F. (2003).Cell type-specific circuits of cortical layer IV spiny neurons. J. Neurosci. 23,2961–2970.
Shepherd, G. M., and Svoboda, K. (2005). Laminar and columnar organization ofascending excitatory projections to layer 2/3 pyramidal neurons in rat barrelcortex. J. Neurosci. 25, 5670–5679.
Soloway, A. S., Pucak, M. L., Melchitzky, D. S., and Lewis, D. A. (2002). Dendriticmorphology of callosal and ipsilateral projection neurons in monkey prefrontalcortex. Neuroscience 109, 461–471.
Staiger, J. F., Flagmeyer, I., Schubert, D., Zilles, K., Kotter, R., and Luhmann, H.J. (2004). Functional diversity of layer IV spiny neurons in rat somatosen-sory cortex: quantitative morphology of electrophysiologically characterizedand biocytin labeled cells. Cereb. Cortex 14, 690–701.
Sun, Q. Q., Huguenard, J. R., and Prince, D. A. (2006). Barrel cortex microcircuits:thalamocortical feedforward inhibition in spiny stellate cells is mediated by asmall number of fast-spiking interneurons. J. Neurosci. 26, 1219–1230.
Travis, K., Ford, K., and Jacobs, B. (2005). Regional dendritic variation in neonatalhuman cortex: a quantitative Golgi study. Dev. Neurosci. 27, 277–287.
Trevelyan, A. J., Sussillo, D., Watson, B. O., and Yuste, R. (2006). Modular prop-agation of epileptiform activity: evidence for an inhibitory veto in neocortex.J. Neurosci. 26, 12447–12455.
Tsay, D., and Yuste, R. (2002). Role of dendritic spines in action potential back-propagation: a numerical simulation study. J. Neurophysiol. 88, 2834–2845.
Vetter, P., Roth, A., and Hausser, M. (2001). Propagation of action potentials indendrites depends on dendritic morphology. J. Neurophysiol. 85, 926–937.
Volgushev, M., Chauvette, S., Mukovski, M., and Timofeev, I. (2006). Precise long-range synchronization of activity and silence in neocortical neurons duringslow-wave oscillations [corrected]. J. Neurosci. 26, 5665–5672.
Vuksic, M., Petanjek, Z., Rasin, M. R., and Kostovic, I. (2002). Perinatal growth ofprefrontal layer III pyramids in Down syndrome. Pediatr. Neurol. 27, 36–38.
Wang, Y., Gupta, A., Toledo-Rodriguez, M., Wu, C. Z., and Markram, H. (2002).Anatomical, physiological, molecular and circuit properties of nest basket cellsin the developing somatosensory cortex. Cereb. Cortex 12, 395–410.
Watson, K. K., Jones, T. K., and Allman, J. M. (2006). Dendritic architecture of thevon Economo neurons. Neuroscience 141, 1107–1112.
Woodruff, A., Xu, Q., Anderson, S. A., and Yuste, R. (2009). Depolarizingeffect of neocortical chandelier neurons. Front. Neural Circuits 3:15. doi:10.3389/neuro.04.015.2009
Zaitsev, A. V., Gonzalez-Burgos, G., Povysheva, N. V., Kroner, S., Lewis, D. A., andKrimer, L. S. (2005). Localization of calcium-binding proteins in physiologi-cally and morphologically characterized interneurons of monkey dorsolateralprefrontal cortex. Cereb. Cortex 15, 1178–1186.
Frontiers in Integrative Neuroscience www.frontiersin.org May 2013 | Volume 7 | Article 31 | 13
Related Documents