Using data assimilation to identify diffuse recharge mechanisms from chemical and physical data in the unsaturated zone Gene-Hua Crystal Ng, 1 Dennis McLaughlin, 1 Dara Entekhabi, 1 and Bridget Scanlon 2 Received 9 February 2009; revised 21 May 2009; accepted 17 June 2009; published 16 September 2009. [1] It is difficult to estimate groundwater recharge in semiarid environments, where precipitation and evapotranspiration nearly balance. In such environments, groundwater supplies are sensitive to small changes in the processes that control recharge. Numerical modeling provides the temporal resolution needed to analyze these processes but is highly sensitive to model errors. Natural chloride tracer measurements in the unsaturated zone provide more robust indicators of low recharge rates but yield estimates at coarse time scales that mask most control mechanisms. This study presents a new probabilistic approach for analyzing diffuse recharge in semiarid environments, with an application to study sites in the U.S. southern High Plains. The approach uses data assimilation to combine model predictions and chloride-based recharge estimates. It has the advantage of providing probability distributions rather than point values for uncertain soil and vegetation properties. These can then be used to quantify recharge uncertainty. Estimates of moisture flux time series indicate that percolation (or potential recharge) at the data sites is episodic and exhibits interannual variability. Most percolation occurs during intense rains when crop roots are not fully developed and there is ample antecedent soil moisture. El Nin ˜o events can contribute to interannual variability of recharge if they bring rainy winters that provide wet antecedent conditions for spring precipitation. Data assimilation methods that combine modeling and chloride observations provide the high temporal resolution information needed to identify mechanisms controlling diffuse recharge and offer a way to examine the effects of land use change and climatic variability on groundwater resources. Citation: Ng, G.-H. C., D. McLaughlin, D. Entekhabi, and B. Scanlon (2009), Using data assimilation to identify diffuse recharge mechanisms from chemical and physical data in the unsaturated zone, Water Resour. Res., 45, W09409, doi:10.1029/2009WR007831. 1. Introduction and Background [2] Characterization of groundwater recharge is critical for sustainable management of water resources, control of subsurface contamination, and better understanding of hydrologic and ecological variability. It is well known that the primary controls on recharge are meteorology, soil properties, vegetation, and topography. These controls interact to create the distinctive conditions that result in recharge. Uncertainties about control mechanisms make it difficult to predict long-term effects of climate change, meteorological variability, and land use change on ground- water resources. [3] De Vries and Simmers [2002] categorize recharge as ‘‘diffuse’’ (or ‘‘direct’’) when it originates from precipitation that infiltrates vertically from the surface directly to the water table. By contrast, nondiffuse (‘‘localized’’ or ‘‘fo- cused’’) recharge travels laterally at (or near) the land surface and then collects in streams or topographic depres- sions before it infiltrates. Both diffuse and localized re- charge often travel via preferential pathways, such as through cracks or root tubules, rather than exclusively through the soil matrix. Preferential flow is especially difficult to characterize or predict. [4] Although diffuse recharge may occur infrequently in arid and semiarid climates, it can still have significant impact on the overall groundwater budget. Kearns and Hendrickx [1998] point out that small amounts of diffuse recharge spread over a large area can yield significant volumetric contributions to groundwater in semiarid regions of New Mexico. Also, in areas where deep-rooted vegeta- tion has been replaced by shallow-rooted crops or pasture, diffuse recharge rates can increase significantly [e.g., Cook et al., 1989; Scanlon et al., 2007]. In fact, increases in diffuse recharge induced by land use change have created major environmental problems in Australia, where salt trapped in the unsaturated zone has been flushed into valuable ground and surface water reservoirs [Cook et al., 1989; Leaney et al., 2003]. [5] In this paper we examine the interacting processes that control diffuse recharge, in order both to better under- stand the relevant mechanisms and to provide a better basis for predicting impacts of land use and climate change on subsurface water supplies. Gee and Hillel [1988] observed 1 Department of Civil and Environmental Engineering, Massachusetts Institute of Technology, Cambridge, Massachusetts, USA. 2 Bureau of Economic Geology, Jackson School of Geosciences, University of Texas at Austin, Austin, Texas, USA. Copyright 2009 by the American Geophysical Union. 0043-1397/09/2009WR007831$09.00 W09409 WATER RESOURCES RESEARCH, VOL. 45, W09409, doi:10.1029/2009WR007831, 2009 Click Here for Full Articl e 1 of 18

Welcome message from author
This document is posted to help you gain knowledge. Please leave a comment to let me know what you think about it! Share it to your friends and learn new things together.
Transcript
Using data assimilation to identify diffuse recharge mechanisms
from chemical and physical data in the unsaturated zone
Gene-Hua Crystal Ng,1 Dennis McLaughlin,1 Dara Entekhabi,1 and Bridget Scanlon2
Received 9 February 2009; revised 21 May 2009; accepted 17 June 2009; published 16 September 2009.
[1] It is difficult to estimate groundwater recharge in semiarid environments, whereprecipitation and evapotranspiration nearly balance. In such environments, groundwatersupplies are sensitive to small changes in the processes that control recharge. Numericalmodeling provides the temporal resolution needed to analyze these processes but is highlysensitive to model errors. Natural chloride tracer measurements in the unsaturated zoneprovide more robust indicators of low recharge rates but yield estimates at coarse timescales that mask most control mechanisms. This study presents a new probabilisticapproach for analyzing diffuse recharge in semiarid environments, with an application tostudy sites in the U.S. southern High Plains. The approach uses data assimilation tocombine model predictions and chloride-based recharge estimates. It has the advantage ofproviding probability distributions rather than point values for uncertain soil andvegetation properties. These can then be used to quantify recharge uncertainty. Estimatesof moisture flux time series indicate that percolation (or potential recharge) at the data sitesis episodic and exhibits interannual variability. Most percolation occurs during intenserains when crop roots are not fully developed and there is ample antecedent soil moisture.El Nino events can contribute to interannual variability of recharge if they bring rainywinters that provide wet antecedent conditions for spring precipitation. Data assimilationmethods that combine modeling and chloride observations provide the high temporalresolution information needed to identify mechanisms controlling diffuse recharge andoffer a way to examine the effects of land use change and climatic variability ongroundwater resources.
Citation: Ng, G.-H. C., D. McLaughlin, D. Entekhabi, and B. Scanlon (2009), Using data assimilation to identify diffuse recharge
mechanisms from chemical and physical data in the unsaturated zone, Water Resour. Res., 45, W09409, doi:10.1029/2009WR007831.
1. Introduction and Background
[2] Characterization of groundwater recharge is criticalfor sustainable management of water resources, control ofsubsurface contamination, and better understanding ofhydrologic and ecological variability. It is well known thatthe primary controls on recharge are meteorology, soilproperties, vegetation, and topography. These controlsinteract to create the distinctive conditions that result inrecharge. Uncertainties about control mechanisms make itdifficult to predict long-term effects of climate change,meteorological variability, and land use change on ground-water resources.[3] De Vries and Simmers [2002] categorize recharge as
‘‘diffuse’’ (or ‘‘direct’’) when it originates from precipitationthat infiltrates vertically from the surface directly to thewater table. By contrast, nondiffuse (‘‘localized’’ or ‘‘fo-cused’’) recharge travels laterally at (or near) the landsurface and then collects in streams or topographic depres-
sions before it infiltrates. Both diffuse and localized re-charge often travel via preferential pathways, such asthrough cracks or root tubules, rather than exclusivelythrough the soil matrix. Preferential flow is especiallydifficult to characterize or predict.[4] Although diffuse recharge may occur infrequently in
arid and semiarid climates, it can still have significantimpact on the overall groundwater budget. Kearns andHendrickx [1998] point out that small amounts of diffuserecharge spread over a large area can yield significantvolumetric contributions to groundwater in semiarid regionsof New Mexico. Also, in areas where deep-rooted vegeta-tion has been replaced by shallow-rooted crops or pasture,diffuse recharge rates can increase significantly [e.g., Cooket al., 1989; Scanlon et al., 2007]. In fact, increases indiffuse recharge induced by land use change have createdmajor environmental problems in Australia, where salttrapped in the unsaturated zone has been flushed intovaluable ground and surface water reservoirs [Cook et al.,1989; Leaney et al., 2003].[5] In this paper we examine the interacting processes
that control diffuse recharge, in order both to better under-stand the relevant mechanisms and to provide a better basisfor predicting impacts of land use and climate change onsubsurface water supplies. Gee and Hillel [1988] observed
1Department of Civil and Environmental Engineering, MassachusettsInstitute of Technology, Cambridge, Massachusetts, USA.
2Bureau of Economic Geology, Jackson School of Geosciences,University of Texas at Austin, Austin, Texas, USA.
Copyright 2009 by the American Geophysical Union.0043-1397/09/2009WR007831$09.00
W09409
WATER RESOURCES RESEARCH, VOL. 45, W09409, doi:10.1029/2009WR007831, 2009ClickHere
for
FullArticle
1 of 18
that diffuse recharge in semiarid regions is likely to occurepisodically rather than continuously. This has been docu-mented in a number of settings [see, e.g., Zhang et al.,1999a, 1999b; Lewis and Walker, 2002]. An understandingof the origin and timing of discrete events is needed forproper characterization of diffuse recharge. In particular, weneed to be able to determine the relative importance ofdownward moisture movement driven by precipitationevents and upward moisture movement driven by evapo-ration and root uptake. If downward forces prevail foreven a brief period, infiltrating precipitation can movefrom the surface past the root zone and eventually becomerecharge. Otherwise, it is taken up by vegetation and/orevaporated, and there is little or no moisture left torecharge groundwater.[6] Scanlon et al. [2002] provide a comprehensive review
of common methods for estimating recharge. One option isto use numerical models of the unsaturated zone to predictrecharge from precipitation observations and various soiland vegetation properties [e.g., Zhang et al., 1999b; Small,2005; Keese et al., 2005]. Although numerical models areundoubtedly useful, many studies [e.g., Gee and Hillel,1988; Allison et al., 1994; Phillips, 1994] caution againsttheir application in semiarid environments. Because diffuserecharge rates in such settings can be quite small relative toprecipitation and evaporation, they are very sensitive touncertain model parameterizations and input errors. For thisreason, tracer-based recharge estimation methods are fa-vored by Gee and Hillel [1988] and Allison et al. [1994] insemiarid environments. Natural tracers such as meteoricchloride are particularly popular due to their ubiquitousavailability and increased sensitivity at lower recharge rates.[7] Chloride concentrations in the unsaturated and/or
saturated zone are most often employed for recharge esti-mation using a simple chloride mass balance (CMB) ap-proach, which assumes that, over the long-term, the averagerate of chloride deposition with precipitation balances therate of chloride flushed out of unsaturated zone soil water(below the root zone) [Scanlon et al., 2002]. When surfacerunoff/run-on is negligible (such as in low-relief areas), soilwater chloride is of meteoric origin, and chloride is fullydisplaced via piston flow, this can be expressed as
P ClP½ � ¼ R ClSW½ �; ð1Þ
where P is the precipitation rate, [ClP] is the atmosphericchloride concentration (accounting for wet and dry fallout),R is the percolation rate below the root zone, and [Clsw] isthe soil water chloride concentration. Negligible amounts ofchloride are generally taken up by plants, making the abovean acceptable approximation. Although this steady statemass balance approach can provide robust average rechargeestimates, it cannot resolve the fine time-scale dynamics thatlink diffuse episodic recharge to transient surface conditions(weather and changes in vegetation).[8] Quasi-transient and generalized versions of chloride
mass balance (CMB) provide some temporal information byassociating particular portions of the unsaturated profilewith particular times in the past [Cook et al., 1992; Murphyet al., 1996; Ginn and Murphy, 1997]. The chloride frontdisplacement method tracks solute flushing caused bychanges in land use [Allison and Hughes, 1983; Walker et
al., 1991]. However, Cook et al. [1992] showed thatdispersion and mixing greatly limit the temporal resolutionof these alternatives. Chloride data do not appear to ade-quately capture seasonal effects, annual dynamics, or othershort-duration events responsible for episodic recharge.[9] In summary, it seems fair to say that numerical
modeling provides temporally detailed, yet potentially in-accurate, recharge estimates, while chloride-based rechargeestimation methods produce robust, but less detailed, time-integrated estimates when the CMB conditions cited aboveare met. Although the two methods are complementary,few studies have combined them to obtain rechargeestimates that have the temporal detail and accuracyneeded to fully describe episodic events. Some investiga-tors [e.g., Cook et al., 1992; Flint et al., 2002; Scanlon etal., 2003] use chloride measurements to validate numericalmodels, but they do not actually combine the two sourcesof information.[10] In this paper we estimate recharge with a probabi-
listic data assimilation approach that integrates model pre-dictions and unsaturated zone data while properlyaccounting for sources of uncertainty. Data assimilationmethods, including Kalman filtering and variational leastsquares methods, have been used in a number of otherhydrological applications [e.g., Kitanidis and Bras, 1980;McLaughlin et al., 1993; Reichle et al., 2001; Margulis etal., 2002; Reichle et al., 2002; Vrugt et al., 2005; Dunneand Entekhabi, 2006]. Here we use a particular dataassimilation approach commonly known as importancesampling (discussed more fully in section 2). This approachgenerates populations of physically plausible model param-eters (e.g., soil and vegetation properties), soil moistureprofiles, and recharge histories that are consistent withmodel predictions and field observations. Importance sam-pling explicitly accounts for both model and measurementuncertainty by weighting each source of informationaccording to its reliability.[11] In the discussion that follows, we distinguish perco-
lation, the moisture flux below the root zone (1.5 m in ourstudy), and recharge, the moisture flux at the water table.The two are generally equivalent over the long term becausepercolation, which we presume is beyond the influence ofevapotranspiration, eventually reaches the water table tobecome recharge (with some delay). Recharge is the quan-tity of most interest from the perspective of groundwatersupply. However, its temporal dynamics are significantlyattenuated, especially if the water table is deep. Becausepercolation responds more to episodic precipitation eventsand other surface conditions, it provides a clearer picture ofthe physical mechanisms that control recharge. For thisreason, our analysis is based on estimates of percolationrather than recharge. However, our ultimate interest is in theeffect of land use practices and climate on recharge.[12] This paper demonstrates how importance sampling
can be used to estimate episodic percolation in a semiaridregion affected by land use change and to provide theinsight needed to understand recharge mechanisms. Ourestimates of percolation and related quantities are derivedfrom physical and chemical field data collected at researchsites in the semiarid southern High Plains (SHP) region ofTexas. Over the past century, replacement of native grass-land at these sites with rain-fed (dryland) cotton crops has
2 of 18
W09409 NG ET AL.: RECHARGE MECHANISMS W09409
led to increased flushing of unsaturated zone chloride,resulting in increased diffuse recharge [Scanlon et al.,2007]. This land use change has provided a strong chloridesignal that facilitates estimation of generally unobservablesoil and vegetation properties.[13] Although CMB has been used in many past studies,
Gee et al. [2005] suggest that chloride-based rechargeestimates can be misleading when low chloride concentra-tions (due to increased flux) approach instrument detectionlevels. Those errors can be further compounded when soilwater chloride is not fully flushed with piston flow. Goodagreement between CMB and chloride front displacementcalculations in the SHP indicate that these are not majorconcerns and that measured chloride concentrations areinformative about flux rates at our study sites [Scanlon etal., 2007].[14] Our study of diffuse recharge mechanisms and relat-
ed soil and vegetation properties begins in section 2 with abrief review of Bayesian data assimilation concepts. Section3 illustrates the application of importance sampling to thediffuse recharge problem. Section 3 includes discussions ofthe field sites, the unsaturated zone model, selection ofmodel inputs, and representation of uncertainty. Section 4examines the percolation and property estimates obtainedby assimilating data from the SHP field sites. Theseestimates indicate how episodic percolation is controlledby a combination of meteorological, soil, and vegetationfactors. A comparison of percolation estimates with precip-itation records and cropping schedule reveals the specialconditions that make episodic percolation, and thus re-charge, possible at agricultural sites such as the two sitesconsidered here. These conditions are summarized insection 5.
2. Data Assimilation and Importance Sampling
[15] The two main components of a data assimilationproblem are a numerical model and a set of measurements.We assume these are described by a state equation model fand a measurement model h, respectively:
x1:T ¼ f x0; p; b1:T ; e1:Tð Þ ð2Þ
y1:T ¼ h x1:T ; h1:Tð Þ; ð3Þ
where x1:T is the vector of system states (prognosticvariables) defined over a time period of length T, x0 is theinitial state vector, p is the parameter vector, b1:T is theboundary condition vector over time, e1:T is the state modelerror vector not included in other inputs, y1:T is theobservation vector, and h1:T is the observation error vector.[16] For the recharge problem of interest here, f represents
a combined soil moisture and solute transport model; xincludes soil moisture, chloride concentrations, and mois-ture fluxes at different depths; p includes soil and vegetationparameters; b includes meteorological and solute depositionforcing at the ground surface; and y includes soil moistureand chloride concentration measurements in a verticalunsaturated zone profile. Percolation (the moisture flux at1.5 m) is a model output (diagnostic variable) that isdetermined completely by the model inputs and states. In
our study, measurements at each site are taken at only onetime, and thus (3) simplifies to
yT ¼ h xT ; hTð Þ: ð4Þ
Many model calibration methods are designed to estimate asingle parameter set that provides a ‘‘best fit’’ to observa-tions. When models and observations are highly uncertain,it may be more useful to provide probabilistic estimates thatreveal the range of possible values rather than a single ‘‘bestestimate.’’ In this case, the objective of the estimationprocedure is to derive the conditional (posterior) probabilitydensity p(Xjy) of an uncertain model input, state, or output(indicated by the generic symbol X). This conditionaldensity conveys everything we know about X givenuncertain information from the model and measurements.[17] Bayes’ theorem relates the conditional density p(Xjy)
to the unconditional (prior) probability density p(X) and tothe likelihood function p(yjX), expressed as a function of Xfor a given measurement y:
p X jyð Þ ¼ p yjXð Þp Xð Þp yð Þ : ð5Þ
It is sometimes possible to derive closed form expressionsfor the unconditional probability densities of the modelstates and outputs by combining the state equation given in(1) with specified input probability densities. Such a closedform derivation is not possible for our recharge problem.Instead, we adopt a Monte Carlo approach and work withsamples from the relevant densities rather than the densitiesthemselves. Our approach to Bayesian data assimilation iscarried out in three steps:[18] 1. Generate equally likely unconditional realizations
of uncertain model inputs (e.g., meteorological, soil, andvegetation properties) from specified input probability den-sity functions.[19] 2. Use Monte Carlo simulation to derive a corres-
ponding set of equally likely realizations of the uncondi-tional model states (e.g., the soil moisture and chlorideconcentration profiles) and model outputs (e.g., percola-tion). Each Monte Carlo sample includes a set of associatedinputs, states, and outputs.[20] 3. Use importance sampling to reweight each Monte
Carlo sample to reflect its ability to match observations. Thereweighted samples provide the information needed toconstruct approximate conditional probability densities forthe model inputs, states, and outputs.[21] Monte Carlo simulation and importance sampling
represent the probability densities appearing in (5) discretely,using a set of i = 1, . . ., N sample vectors (Xi) containinginput, state, and output variables, together with a set ofassociated unconditioned weights (wU
i ) or conditionedweights (wC
i ):
p Xð Þ �XNi¼1
wiUd X � X i
� �ð6Þ
p X jyð Þ �XNi¼1
wiCd X � X i
� �ð7Þ
XNi¼1
wiU ¼ 1
XNi¼1
wiC ¼ 1; ð8Þ
W09409 NG ET AL.: RECHARGE MECHANISMS
3 of 18
W09409
where d( ) is the Dirac delta function. The model inputvariables of Xi are drawn at random from a population ofequally likely prior samples that conform to a specifiedunconditional density p(X) (step 1 above). The correspond-ing model state or output component of Xi is derived byrunning the simulation model with the particular set ofrandom inputs (step 2 above). Usually only some of theinputs are treated as random variables, while the others areassumed to be deterministic (i.e., uncertainty is notaccounted for). Because each sample generated in theMonte Carlo procedure is equally likely, the unconditionalsample weights are all wU
i = 1/N.[22] The measurement conditioning process (step 3
above) is accomplished by adjusting the equal weightsassociated with the Monte Carlo samples to reflect theeffect of measurements. In particular, the weights wC
i ofthe conditional density are given by substituting (6), (7), (8),and wU
i = 1/N into (5) to obtain
wiC ¼ p yjX ið Þ
XNi¼1
p yjX i� � : ð9Þ
For example, if measurement errors are additive, then yT =h(xT, hT) = h(xT) + hT, and the likelihood function appearingin (9) may be computed from
p yjxi� �
¼ pyjxi yjxi� �
¼ phT y� h xiT� �� �
; ð10Þ
where the subscripts on the probability densities refer to therandom variables of interest while the arguments refer tothe threshold values used to evaluate probabilities. Themeasurement error probability density phT[hT] is usually
presumed to have a convenient closed form, such as aGaussian or uniform density. This density should reflect theeffects of instrumentation and recording errors, as well asrepresentativeness errors that account for scale differencesbetween the observation support and model grid cells.[23] The importance sampling approach to Bayesian
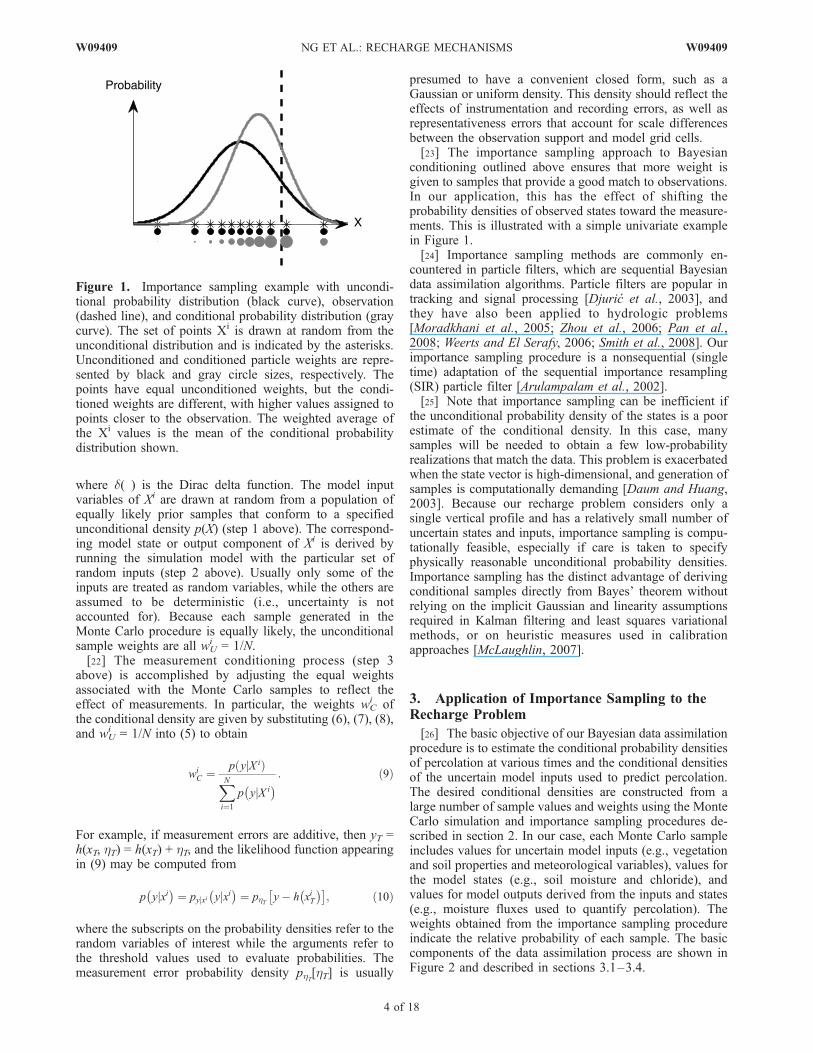
conditioning outlined above ensures that more weight isgiven to samples that provide a good match to observations.In our application, this has the effect of shifting theprobability densities of observed states toward the measure-ments. This is illustrated with a simple univariate examplein Figure 1.[24] Importance sampling methods are commonly en-
countered in particle filters, which are sequential Bayesiandata assimilation algorithms. Particle filters are popular intracking and signal processing [Djuric et al., 2003], andthey have also been applied to hydrologic problems[Moradkhani et al., 2005; Zhou et al., 2006; Pan et al.,2008; Weerts and El Serafy, 2006; Smith et al., 2008]. Ourimportance sampling procedure is a nonsequential (singletime) adaptation of the sequential importance resampling(SIR) particle filter [Arulampalam et al., 2002].[25] Note that importance sampling can be inefficient if
the unconditional probability density of the states is a poorestimate of the conditional density. In this case, manysamples will be needed to obtain a few low-probabilityrealizations that match the data. This problem is exacerbatedwhen the state vector is high-dimensional, and generation ofsamples is computationally demanding [Daum and Huang,2003]. Because our recharge problem considers only asingle vertical profile and has a relatively small number ofuncertain states and inputs, importance sampling is compu-tationally feasible, especially if care is taken to specifyphysically reasonable unconditional probability densities.Importance sampling has the distinct advantage of derivingconditional samples directly from Bayes’ theorem withoutrelying on the implicit Gaussian and linearity assumptionsrequired in Kalman filtering and least squares variationalmethods, or on heuristic measures used in calibrationapproaches [McLaughlin, 2007].
3. Application of Importance Sampling to theRecharge Problem
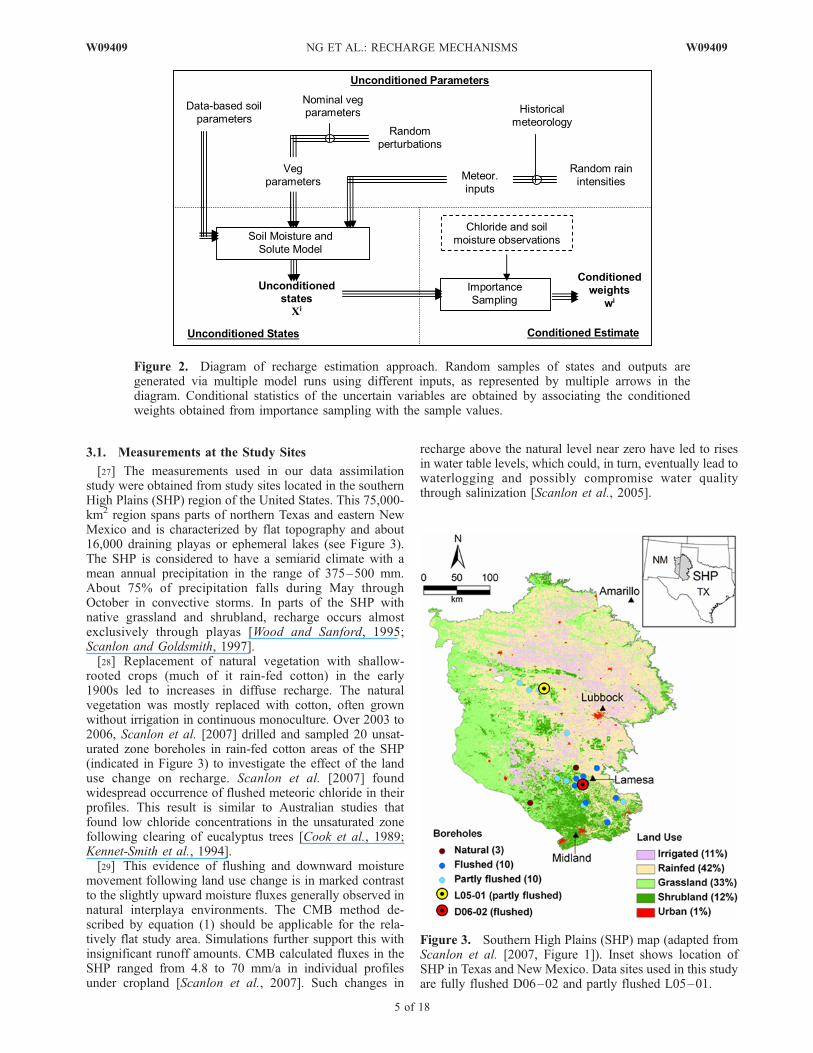
[26] The basic objective of our Bayesian data assimilationprocedure is to estimate the conditional probability densitiesof percolation at various times and the conditional densitiesof the uncertain model inputs used to predict percolation.The desired conditional densities are constructed from alarge number of sample values and weights using the MonteCarlo simulation and importance sampling procedures de-scribed in section 2. In our case, each Monte Carlo sampleincludes values for uncertain model inputs (e.g., vegetationand soil properties and meteorological variables), values forthe model states (e.g., soil moisture and chloride), andvalues for model outputs derived from the inputs and states(e.g., moisture fluxes used to quantify percolation). Theweights obtained from the importance sampling procedureindicate the relative probability of each sample. The basiccomponents of the data assimilation process are shown inFigure 2 and described in sections 3.1–3.4.
Figure 1. Importance sampling example with uncondi-tional probability distribution (black curve), observation(dashed line), and conditional probability distribution (graycurve). The set of points Xi is drawn at random from theunconditional distribution and is indicated by the asterisks.Unconditioned and conditioned particle weights are repre-sented by black and gray circle sizes, respectively. Thepoints have equal unconditioned weights, but the condi-tioned weights are different, with higher values assigned topoints closer to the observation. The weighted average ofthe Xi values is the mean of the conditional probabilitydistribution shown.
4 of 18
W09409 NG ET AL.: RECHARGE MECHANISMS W09409
3.1. Measurements at the Study Sites
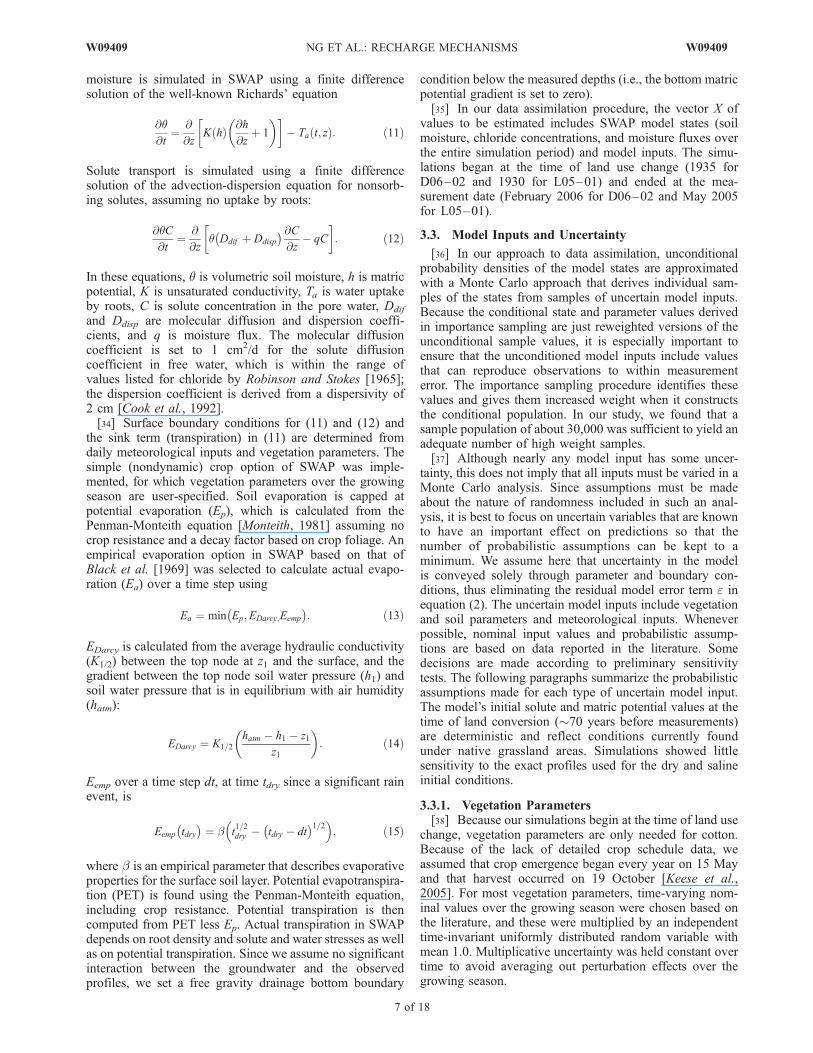
[27] The measurements used in our data assimilationstudy were obtained from study sites located in the southernHigh Plains (SHP) region of the United States. This 75,000-km2 region spans parts of northern Texas and eastern NewMexico and is characterized by flat topography and about16,000 draining playas or ephemeral lakes (see Figure 3).The SHP is considered to have a semiarid climate with amean annual precipitation in the range of 375–500 mm.About 75% of precipitation falls during May throughOctober in convective storms. In parts of the SHP withnative grassland and shrubland, recharge occurs almostexclusively through playas [Wood and Sanford, 1995;Scanlon and Goldsmith, 1997].[28] Replacement of natural vegetation with shallow-
rooted crops (much of it rain-fed cotton) in the early1900s led to increases in diffuse recharge. The naturalvegetation was mostly replaced with cotton, often grownwithout irrigation in continuous monoculture. Over 2003 to2006, Scanlon et al. [2007] drilled and sampled 20 unsat-urated zone boreholes in rain-fed cotton areas of the SHP(indicated in Figure 3) to investigate the effect of the landuse change on recharge. Scanlon et al. [2007] foundwidespread occurrence of flushed meteoric chloride in theirprofiles. This result is similar to Australian studies thatfound low chloride concentrations in the unsaturated zonefollowing clearing of eucalyptus trees [Cook et al., 1989;Kennet-Smith et al., 1994].[29] This evidence of flushing and downward moisture
movement following land use change is in marked contrastto the slightly upward moisture fluxes generally observed innatural interplaya environments. The CMB method de-scribed by equation (1) should be applicable for the rela-tively flat study area. Simulations further support this withinsignificant runoff amounts. CMB calculated fluxes in theSHP ranged from 4.8 to 70 mm/a in individual profilesunder cropland [Scanlon et al., 2007]. Such changes in
recharge above the natural level near zero have led to risesin water table levels, which could, in turn, eventually lead towaterlogging and possibly compromise water qualitythrough salinization [Scanlon et al., 2005].
Figure 2. Diagram of recharge estimation approach. Random samples of states and outputs aregenerated via multiple model runs using different inputs, as represented by multiple arrows in thediagram. Conditional statistics of the uncertain variables are obtained by associating the conditionedweights obtained from importance sampling with the sample values.
Figure 3. Southern High Plains (SHP) map (adapted fromScanlon et al. [2007, Figure 1]). Inset shows location ofSHP in Texas and New Mexico. Data sites used in this studyare fully flushed D06–02 and partly flushed L05–01.
W09409 NG ET AL.: RECHARGE MECHANISMS
5 of 18
W09409

[30] Half of the chloride profiles examined by Scanlon etal. [2007] exhibited low chloride concentrations throughout,suggesting that they were fully flushed with postdevelop-ment moisture fluxes. The remaining profiles exhibited highconcentration bulges at depth, suggesting the presence of apostdevelopment region affected by downward rechargelying above a predevelopment dry region that experiencedlittle or no recharge. The positions of chloride bulges in thepartially flushed profiles convey important informationabout the flux history, because deeper profile locationsreveal conditions further back in time. Scanlon et al.[2007] used this profile information to derive chloride frontdisplacement estimates that corroborated CMB results. Inthe analysis presented here, we examine a representativeprofile from each group: the fully flushed profile D06–02,and the partially flushed profile L05–01. Soil samples forthese profiles were collected on 14 February 2006 and 26May 2005, respectively.[31] Unsaturated zone profile measurements given by
Scanlon et al. [2007] include chloride concentration, soilmoisture, matric potential, and soil texture (percent clay,silt, and sand). Chloride concentrations were obtained byfirst drying soil samples, adding water, and shaking, andthen using ion chromatography to measure concentrations inthe supernatant. Soil moisture was measured gravimetrically.Data from the National Atmospheric Deposition Program(http://nadp.sws.uiuc.edu/) provided the basis for the atmo-spheric chloride deposition rates from precipitation, whichwere doubled to account for dry deposition and correspondto prebomb 36Cl/Cl ratios found in the region [Scanlon andGoldsmith, 1997]. Further details on measurement methodsare provided by Scanlon et al. [2007].
[32] In this study, we assimilate soil moisture and chlo-ride concentration data and use soil texture data to identifyunconditional soil property densities. Chloride and soilmoisture measurements in the root zone were omittedbecause the numerical unsaturated zone flow and transportmodel used in this study does not accurately simulate thetransient conditions in this region [Cook et al., 1992; Tylerand Walker, 1994]. Matric potential measurements from theSHP sites were not used because they appear to includeinconsistencies with soil moisture and chloride observationsin some partially flushed profiles [Scanlon et al., 2007].Chloride and soil moisture measurements below the rootzone provided sufficient constraint on model parameters andmoisture fluxes. In summary, our assimilation study relieson soil moisture and chloride profile measurements andmodel predictions from several depths below the root zone,representing snapshots in time at each site (14 February2006 for D06–02 and 26 May 2005 for L05–01). Thesemeasurements are plotted in Figure 4, and related informa-tion reported by Scanlon et al. [2007] is summarized inTable 1.
3.2. Unsaturated Zone Flow and Solute TransportModel
[33] The numerical model used in our data assimilationstudy is the soil-water-atmosphere-plant (SWAP) modelversion 3.0.3, which is described by Kroes and van Dam[2003]. SWAP has been used in a wide range of studies forvarious climate conditions [van Dam et al., 2008]. It is aone-dimensional vertical unsaturated zone model of soilmoisture transport, solute transport, and vegetation. Soil
Figure 4. Observed profiles for D06–02 (circles) and L05–01 (asterisks). Chloride and soil moistureobservations within root zone area, indicated in gray, are not included in the assimilation.
Table 1. Site Data From Scanlon et al. [2007]
D06–02 L05–01
Latitude, longitude 32.63�N, 102.09�W 33.93�N, 102.61�WWater table depth 10 m 36 m[Cl�] in precipitation 0.34 mg/L 0.28 mg/LElapsed time since land use change (time used in this work) 67–75 years (71 years) 70–85 years (76 years)Chloride mass balance (CMB) recharge estimate from Scanlon et al. [2007] 70 mm/a 14 mm/a
6 of 18
W09409 NG ET AL.: RECHARGE MECHANISMS W09409
moisture is simulated in SWAP using a finite differencesolution of the well-known Richards’ equation
@q@t
¼ @
@zK hð Þ @h
@zþ 1
� �� � Ta t; zð Þ: ð11Þ
Solute transport is simulated using a finite differencesolution of the advection-dispersion equation for nonsorb-ing solutes, assuming no uptake by roots:
@qC@t
¼ @
@zq Ddif þ Ddisp
� � @C@z
� qC
� : ð12Þ
In these equations, q is volumetric soil moisture, h is matricpotential, K is unsaturated conductivity, Ta is water uptakeby roots, C is solute concentration in the pore water, Ddif
and Ddisp are molecular diffusion and dispersion coeffi-cients, and q is moisture flux. The molecular diffusioncoefficient is set to 1 cm2/d for the solute diffusioncoefficient in free water, which is within the range ofvalues listed for chloride by Robinson and Stokes [1965];the dispersion coefficient is derived from a dispersivity of2 cm [Cook et al., 1992].[34] Surface boundary conditions for (11) and (12) and
the sink term (transpiration) in (11) are determined fromdaily meteorological inputs and vegetation parameters. Thesimple (nondynamic) crop option of SWAP was imple-mented, for which vegetation parameters over the growingseason are user-specified. Soil evaporation is capped atpotential evaporation (Ep), which is calculated from thePenman-Monteith equation [Monteith, 1981] assuming nocrop resistance and a decay factor based on crop foliage. Anempirical evaporation option in SWAP based on that ofBlack et al. [1969] was selected to calculate actual evapo-ration (Ea) over a time step using
Ea ¼ min Ep;EDarcy;Eemp
� �: ð13Þ
EDarcy is calculated from the average hydraulic conductivity(K1/2) between the top node at z1 and the surface, and thegradient between the top node soil water pressure (h1) andsoil water pressure that is in equilibrium with air humidity(hatm):
EDarcy ¼ K1=2hatm � h1 � z1
z1
� �: ð14Þ
Eemp over a time step dt, at time tdry since a significant rainevent, is
Eemp tdry� �
¼ b t1=2dry � tdry � dt
� �1=2 �; ð15Þ
where b is an empirical parameter that describes evaporativeproperties for the surface soil layer. Potential evapotranspira-tion (PET) is found using the Penman-Monteith equation,including crop resistance. Potential transpiration is thencomputed from PET less Ep. Actual transpiration in SWAPdepends on root density and solute and water stresses as wellas on potential transpiration. Since we assume no significantinteraction between the groundwater and the observedprofiles, we set a free gravity drainage bottom boundary
condition below the measured depths (i.e., the bottom matricpotential gradient is set to zero).[35] In our data assimilation procedure, the vector X of
values to be estimated includes SWAP model states (soilmoisture, chloride concentrations, and moisture fluxes overthe entire simulation period) and model inputs. The simu-lations began at the time of land use change (1935 forD06–02 and 1930 for L05–01) and ended at the mea-surement date (February 2006 for D06–02 and May 2005for L05–01).
3.3. Model Inputs and Uncertainty
[36] In our approach to data assimilation, unconditionalprobability densities of the model states are approximatedwith a Monte Carlo approach that derives individual sam-ples of the states from samples of uncertain model inputs.Because the conditional state and parameter values derivedin importance sampling are just reweighted versions of theunconditional sample values, it is especially important toensure that the unconditioned model inputs include valuesthat can reproduce observations to within measurementerror. The importance sampling procedure identifies thesevalues and gives them increased weight when it constructsthe conditional population. In our study, we found that asample population of about 30,000 was sufficient to yield anadequate number of high weight samples.[37] Although nearly any model input has some uncer-
tainty, this does not imply that all inputs must be varied in aMonte Carlo analysis. Since assumptions must be madeabout the nature of randomness included in such an anal-ysis, it is best to focus on uncertain variables that are knownto have an important effect on predictions so that thenumber of probabilistic assumptions can be kept to aminimum. We assume here that uncertainty in the modelis conveyed solely through parameter and boundary con-ditions, thus eliminating the residual model error term e inequation (2). The uncertain model inputs include vegetationand soil parameters and meteorological inputs. Wheneverpossible, nominal input values and probabilistic assump-tions are based on data reported in the literature. Somedecisions are made according to preliminary sensitivitytests. The following paragraphs summarize the probabilisticassumptions made for each type of uncertain model input.The model’s initial solute and matric potential values at thetime of land conversion (70 years before measurements)are deterministic and reflect conditions currently foundunder native grassland areas. Simulations showed littlesensitivity to the exact profiles used for the dry and salineinitial conditions.
3.3.1. Vegetation Parameters[38] Because our simulations begin at the time of land use
change, vegetation parameters are only needed for cotton.Because of the lack of detailed crop schedule data, weassumed that crop emergence began every year on 15 Mayand that harvest occurred on 19 October [Keese et al.,2005]. For most vegetation parameters, time-varying nom-inal values over the growing season were chosen based onthe literature, and these were multiplied by an independenttime-invariant uniformly distributed random variable withmean 1.0. Multiplicative uncertainty was held constant overtime to avoid averaging out perturbation effects over thegrowing season.
W09409 NG ET AL.: RECHARGE MECHANISMS
7 of 18
W09409
[39] The vegetation parameters used in our study aresummarized in Table 2. Sensitivity tests indicated that rootdepth has the greatest impact on percolation. Consequently,this parameter was assigned a reasonably high level ofuncertainty. Although the cited sources often report maxi-mum rooting depths greater than the nominal 1 m used here[e.g., Bland and Dugas, 1989; Sarwar and Feddes, 2000],smaller values were specified to reflect the fact that mostmoisture uptake is in the shallower active root zone.[40] The root density profile was assigned a deterministic
set of values based on those of G. L. Ritchie et al. (seehttp://pubs.caes.uga.edu/caespubs/pubs/PDF/B1252.pdf),with greatest root density near the surface. In effect, thelarge uncertainty in rooting depth accounts indirectly foruncertainties in the depth profile. Water and solute stressparameters were also assigned deterministic values fromSarwar and Feddes [2000] and the SWAP manual [Kroesand van Dam, 2003], because they have minimal impact onpercolation in our simulations.
3.3.2. Soil Parameters[41] Soil texture data in the study region provided the
basis for the soil parameters used in the simulations. SWAPuses the van Genuchten-Mualem soil moisture retention andunsaturated hydraulic conductivity functions given by vanGenuchten [1980]. The six soil parameter needed for thesefunctions were determined from soil texture using thepedotransfer model Rosetta [Schaap et al., 2001]. BecauseKeese et al. [2005] found soil layering to significantly affectrecharge, we used heterogeneous parameters that varybetween layers centered at the soil texture measurementlocations for each study site.[42] Uncertainty for the vertically heterogeneous soil
parameters was attributed to two sources: (1) the texturevalues entered into Rosetta and (2) the pedotransfer func-tions imbedded in Rosetta. Because nearby soils can beexpected to be similar, percent clay and silt profile densitiesin the SHP were assumed to be stationary Gaussian first-order autoregressive (AR-1) random processes over depth.Length-scale (aAR1) and standard deviation (sAR1) param-eters were based on texture data collected from 24 boreholesin the SHP [Scanlon et al., 2007]: aAR1 = 0.9964 andsAR1 = 1.7 for percent clay, and aAR1 = 0.9956 and sAR1 =1.9 for percent silt, using a 1-cm depth resolution.[43] The percent clay and silt profile samples used for our
data assimilation study were conditioned on the point textureobservations obtained from D06–02 and L05–01 (shown inFigure 4), assuming additive Gaussian measurement errors
with standard deviations of 5% clay and silt. The conditionalrandom sample profile was averaged over each soil layerinterval to give a single layer value. The resulting layervalues for percent clay, silt, and sand were entered intoRosetta, which provided corresponding layer values for thevan Genuchten-Mualem soil parameters. Possible errors inthe Rosetta pedotransfer function were represented by AR-1depth-correlated perturbations added to the parameter valuesproduced by Rosetta. Perturbations are scaled according toparameter uncertainty values produced by Rosetta.[44] The prior value for the evaporation model b in (15)
was drawn from the uniform density over [0.2, 0.6] cm/d1/2,based on the values given by Ritchie [1972]. Although theevaporation parameter is undoubtedly related to soil type, itsprior density was assigned independent of texture becauseliterature values were too sparse to infer correlations.
3.3.3. Meteorological Inputs[45] Meteorological inputs needed for SWAP are the
chloride concentration in precipitation, daily precipitation,minimum and maximum air temperature (Tmin and Tmax),solar radiation, vapor pressure, and wind speed. The chlo-ride concentrations in precipitation were obtained fromScanlon et al. [2007] (see Table 1). The four meteorologicalstations with long-term historical daily data closest to ourstudy sites are in Amarillo, Lubbock, Lamesa, and Midland,Texas (see Figure 3). Information on the daily meteorolog-ical data available at these four stations is provided inTable 3. Daily (or even finer) precipitation data are neededto resolve the episodic precipitation events that largelycontrol diffuse recharge in semiarid areas.[46] The closest station to D06–02 is Lamesa, which is
15 km away. The closest station to L05–01 is Lubbock,which is a relatively distant 77 km away. Data for eachstudy site were taken from the closest station when possible.Missing data at the closest station were reconstructed fromprecipitation and temperature records at the other stations,or by sampling seasonally appropriate historical records forthe station with missing data. Further details on the recon-struction of daily meteorological series for each study siteare provided by Ng [2008]. Preliminary simulations showedthat recharge response is relatively insensitive to nonpreci-pitation meteorological values. As a result, only precipita-tion was represented as uncertain.[47] Uncertainty was included in the daily rainfall inten-
sity to account for (1) differences between rainfall at thestudy sites and the meteorological stations, and (2) obser-vation errors at the meteorological station. Uncertainty in
Table 2. Vegetation Parameters
Nominal Value Literature Basis Unconditional Uncertainty
Root depth 1 m (max) Bland and Dugas [1989],Sarwar and Feddes [2000],Droogers [2000]
time-constant multiplicativeuniform noise [0.5, 1.5]
Leaf area index (LAI) 5 (max) Bland and Dugas [1989] time-constant multiplicativeuniform noise [0.75, 1.25]
Crop height 0.9 m (max) Askew and Wilcut [2002] time-constant multiplicativeuniform noise [2/3, 4/3]
Minimal crop resistance 90 s m�1 Kroes and van Dam [2003] multiplicative uniformnoise [2/3, 4/3]
Water stress parameters h1 = �10, h2 = �25, h3H,L = �500, �900,h4 = �16,000 cm
Sarwar and Feddes [2000] none
Solute stress parameters ECmax = 7.7 dS/m, ECslope = 5.2% dS�1 m�1 Kroes and van Dam [2003] none
8 of 18
W09409 NG ET AL.: RECHARGE MECHANISMS W09409
the timing of individual precipitation events was not includ-ed because it did not significantly influence percolationcharacteristics over the approximately 70 year study period,from which recharge mechanisms were inferred. Instead,uncertainty is included only in the daily rainfall intensitieson days that are recorded as rainy at the meteorologicalstations.[48] A simple random rainfall intensity model was con-
structed to produce different temporal daily rainfall intensitymeans and standard deviations for the different samplesgenerated in the data assimilation procedure. The resultingrain series from the model have the same pattern of rainoccurrence as that recorded at the meteorological stations,but the daily rain intensities on rainy days are randomized toaccount for uncertainty. While such a model cannot generatethe true rainfall series at the observation sites, it makes itpossible to include in the analysis uncertainty in temporalrainfall statistics. Details are given by Ng [2008].[49] The chloride mass flux rate, which is the product of
[Cl]p and the precipitation P, is uncertain. Since availabledata are insufficient to warrant an explicit distinctionbetween chloride concentration and precipitation uncertain-ties, we account for the net effect of these uncertainties onthe chloride mass flux through the precipitation term alone.
3.4. Measurement Error
[50] The measurement error probability density plays akey role in importance sampling because it determines,through the likelihood function, the conditional weight wC
i
assigned to each Monte Carlo sample. For this reason, careshould be taken to properly account for all the factors thatcontribute to measurement error. In our study, gravimetricsoil moisture measurements (g/cm3) were assumed to haveadditive zero-mean Gaussian observation errors wqg that areindependent at different depths. The associated volumetricsoil moisture values used for data assimilation can bewritten
yq ¼ rbyqg ¼ qþ rbwqg ; ð16Þ
where the bulk density rb is set to 1.6 g/cm3, the value usedfor the results reported by Scanlon et al. [2007]. We selecteda standard deviation of sqg = 0.03 for wqg. This value isintended to account for errors introduced during the soilcollection, weighing, and oven-drying process. Note thattreating bulk density as an uncertain parameter would resultin volumetric soil moisture and chloride concentration datavalues that differ from those reported by Scanlon et al.[2007]. To maintain consistency with that work, we assume
that bulk density is deterministic and constant. Alluncertainty related to soil moisture measurements isrepresented through the gravimetric soil moisture observa-tion error. We selected a standard deviation of sqg = 0.03 forwqg. This value is intended to account for errors introducedduring the soil collection, weighing, and oven-dryingprocess.[51] As described in section 3.1, measurements of chlo-
ride concentration in the pore water yC were derived fromthe measurement of chloride concentration in the samplesupernatant yS, using the following relationship:
yC ¼ REyS
yqg¼ REyS
qg þ wqg; ð17Þ
where the extraction ratio RE is the mass of water added tothe dried sample per mass of dried soil. For the same reasonas bulk density, exact RE values used for the results byScanlon et al. [2007] were implemented as deterministicvalues. As a controlled experimental input, actual RE shouldhave little uncertainty. Additive and multiplicative Gaussianchloride measurement errors were used to account for the±0.1 mg/L instrument error for ion chromatography[Scanlon, 2000] and the 9% mean difference between splittests for the chloride data [Scanlon et al., 2007],respectively. This gives the following expression for thesupernatant concentration measurement:
yS ¼ S þ wS1 þ SwS2; ð18Þ
where S (=Cqg/RE) is the true supernatant concentration andwS1 and wS2 are independent with means of 0 and 1,respectively, and standard deviations of sS1 = 0.1 mg/L andsS2 = 0.1.[52] Evaluating p(yq,yCjC,q) is problematic because (17)
is nonlinear in wqg, making yC non-Gaussian. We deal withthis problem by expanding (17) about wqg = 0, substituting(18) for yS, and ignoring higher order terms. This gives
yC ¼ C þ Ce1 þ e2 ð19Þ
e1 ¼ wS2 �wqg
qg�wS2wqg
qgð20Þ
e2 ¼REwS1
qg�REwS1wqg
q2g: ð21Þ
Table 3. Micrometeorological Data Availability and Sources for 1930–2005 in the U.S. Southern High Plains
Station (MAPa) Precipitation Temperature Solar Radiation/Vapor Pressure/WIND Data Sourceb
Amarillo (470 mm) 1948–2005 1948–2005 1961–2005 SAMSON, NSRDBLubbock (450 mm) 1930–2005 1930–2005 1961–2006 SAMSON, NSRDBLamesa (470 mm) 1930–2005 (750 missing) 1930–2005 (850 missing) none NCDCMidland (350 mm) 1948–2005 1948–2005 1961–2005 SAMSON, NSRDB
aMean annual precipitation for 1961–2005.bSAMSON, Solar and Meteorological Surface Observational Network 1961–1990, available with GEM weather generator [Hanson et al., 1994] data
set; NSRDB, National Solar and Radiation Data Base 1991–2005 update [National Renewable Energy Laboratory, 2007]; NCDC, daily surface datainventory (National Climatic Data Center; see http://www.ncdc.noaa.gov/oa/ncdc.html).
W09409 NG ET AL.: RECHARGE MECHANISMS
9 of 18
W09409

The conditional mean and covariance of the errors e1 and e2are then
E e1jC; q½ � ¼ E e2jC; q½ � ¼ 0 ð22Þ
s2e1 ¼ E e01e
01jC; q
� �¼ E e1e1jC; q½ � ¼ s2
S2 þr2
bs2qg
q2þr2bs
2S2s
2qg
q2
ð23Þ
s2e2 ¼ E e02e
02jC; q
� �¼ E e2e2jC; q½ � ¼ r2bR
2Es
2C1
q2þr4bR
2Es
2C1s
2qg
q4
ð24Þ
E e01e02jC; q
� �¼ E e1e2jC; q½ � ¼ 0 ð25Þ
(the primes represent the mean-removed variables). Tofacilitate our likelihood function calculations, we assumedthat e1 and e2 were Gaussian with the means, variances, andcovariance given in (22)–(25). Then, after determining theconditional covariance between soil moisture and chlorideconcentrations, the Gaussian likelihood function for aparticular depth can be described with the following meanand covariance:
EyCyq
� ���� C; q�
¼ C
q
� ð26Þ
CovyCyq
� ���� C; q� �
¼C2s2
e1 þ s2e2 �
Cs2qg
q
�Cs2
qg
qr2bs
2qg
2664
3775: ð27Þ
4. Results and Discussion
4.1. Soil Profiles and Long-Term Recharge
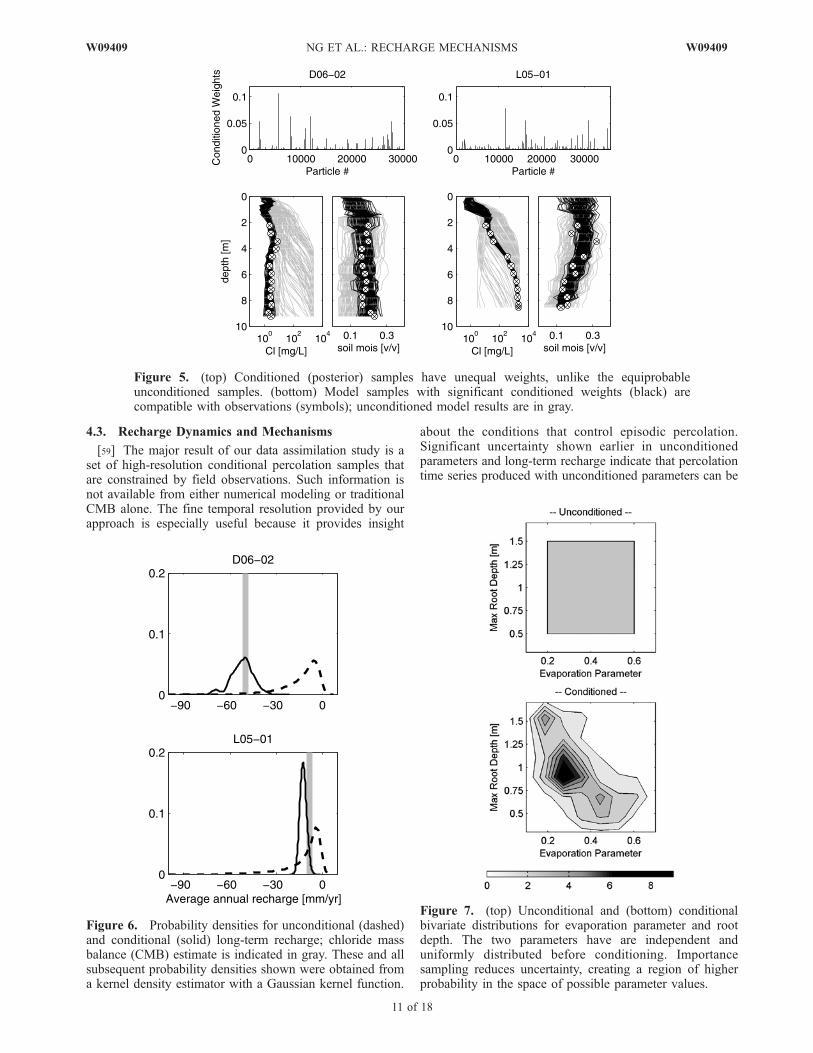
[53] The importance sampling procedure provides a set ofweighted samples that may be used to estimate conditionalprobability densities, statistics, and other quantities that canshed light on the mechanisms that control episodic diffuserecharge. The importance sampling results obtained for ourstudy sites are summarized in Figure 5 (top), which showsthe conditional weights assigned to each of the simulatedsamples. These weights reflect the quality of fit betweeneach sample and the soil moisture and chloride measure-ments, as determined by the likelihood function.[54] The black lines plotted in Figure 5 (bottom) show the
chloride and soil moisture profiles for the 100 most highlyweighted conditional samples (wc > 8 � 10�4 for D06–02and wc > 0.002 for L05–01). The gray lines show a randomsample of 100 equally weighted unconditional samples. It isapparent that the importance sampling procedure selects,out of the large sample of unconditional profiles, therelatively small number that gives the best fit to theobservations. Each of these high weight samples corre-sponds to a particular model simulation based on a partic-ular set of physically plausible inputs.[55] It is useful to compare percolation values from our
Monte Carlo and importance sampling procedure withtraditional chloride mass balance recharge values derivedfrom the same data sets. For this purpose, we computedlong-term average percolation for each Monte Carlo sample
by dividing the cumulative percolation over the approxi-mately 70 year simulation period by the simulation time(i.e., the time from land use change until the observationtime at the study site). Over such time scales, long-termaverage percolation and recharge are essentially equivalent.Figure 6 compares the long-term recharge probability densi-ties obtained from the conditional (unequal) and uncondi-tional (equal) weights. Negative values indicate downwardfluxes. The unconditional densities have long tails, demon-strating high uncertainty. By contrast, the conditional densi-ties are narrower, with peaks that are very close to the steadystate CMB estimates. The conditional peak for the fullyflushed D06–02 site is shifted noticeably toward greaterdownward flux values. The partially flushed L05–01 site hasa conditional density that does not differ as dramatically fromthe unconditional density as D06–02, yet its uncertainty issubstantially reduced. The significant shifts and uncertaintyreductions in the conditional percolation densities demon-strate that chloride measurements can contribute significantlyto unconditionalMonte Carlo predictions derived solely froma numerical model.
4.2. Model Parameters
[56] Our data assimilation approach has the advantage ofproviding information on unobservable model inputs, suchas soil and vegetation properties, as well as on model statesand recharge values. Conditional parameter estimates can beused to make deterministic or probabilistic recharge pre-dictions under different climate conditions or agriculturalpractices. These predictions are more robust than thosederived from unconditional parameter estimates becausethey are constrained by available observations.[57] The strongest impact of observations on the condi-
tional probability distributions were for maximum rootingdepth, certain shallow soil parameters, and the evaporationparameter b. Beyond providing estimates of individualparameters, the weights assigned by importance samplingcan be used to identify the groups of parameter values thatare most consistent with observations. This makes it possi-ble to describe the distinctive conditions needed to generateepisodic diffuse recharge. The basic idea can be illustratedby considering the unconditional and conditional bivariateprobability densities (Figure 7) for two particular modelinputs: the maximum root depth and the evaporation pa-rameter b. The diagonal strip of higher probability apparentin the conditional bivariate density plotted in Figure 7indicates that deep roots are most likely to occur when theparameter is low. Equation (15) suggests that evaporation isgreater when the evaporation parameter is large. A greaterrooting depth yields more transpiration. The observedprofiles are possible only if these two elements, whichcompete for moisture, are properly balanced. This balanceis achieved by selecting parameter values in the high-probability region of Figure 7.[58] Data-conditioned relationships among other vegeta-
tion parameters and soil parameters over depth are given byNg [2008]. Many weakly related unconditional parametersshow notable conditional correlations. Such probabilisticassimilation results provide a way to identify key interac-tions among the soil, vegetation, and meteorological factorsthat control recharge.
10 of 18
W09409 NG ET AL.: RECHARGE MECHANISMS W09409
4.3. Recharge Dynamics and Mechanisms
[59] The major result of our data assimilation study is aset of high-resolution conditional percolation samples thatare constrained by field observations. Such information isnot available from either numerical modeling or traditionalCMB alone. The fine temporal resolution provided by ourapproach is especially useful because it provides insight
about the conditions that control episodic percolation.Significant uncertainty shown earlier in unconditionedparameters and long-term recharge indicate that percolationtime series produced with unconditioned parameters can be
Figure 6. Probability densities for unconditional (dashed)and conditional (solid) long-term recharge; chloride massbalance (CMB) estimate is indicated in gray. These and allsubsequent probability densities shown were obtained froma kernel density estimator with a Gaussian kernel function.
Figure 5. (top) Conditioned (posterior) samples have unequal weights, unlike the equiprobableunconditioned samples. (bottom) Model samples with significant conditioned weights (black) arecompatible with observations (symbols); unconditioned model results are in gray.
Figure 7. (top) Unconditional and (bottom) conditionalbivariate distributions for evaporation parameter and rootdepth. The two parameters have are independent anduniformly distributed before conditioning. Importancesampling reduces uncertainty, creating a region of higherprobability in the space of possible parameter values.
W09409 NG ET AL.: RECHARGE MECHANISMS
11 of 18
W09409
misleading. Here we show that conditioning percolationtime series on data even reveals some differences intemporal patterns between the two study sites, despitecompatible meteorology and similar range of unconditionalpercolation simulations (Figure 5). This underscores theimportance of data conditioning in identifying rechargedynamics and mechanisms.
4.3.1. Recharge Time Series[60] Conditional estimates of weekly precipitation and
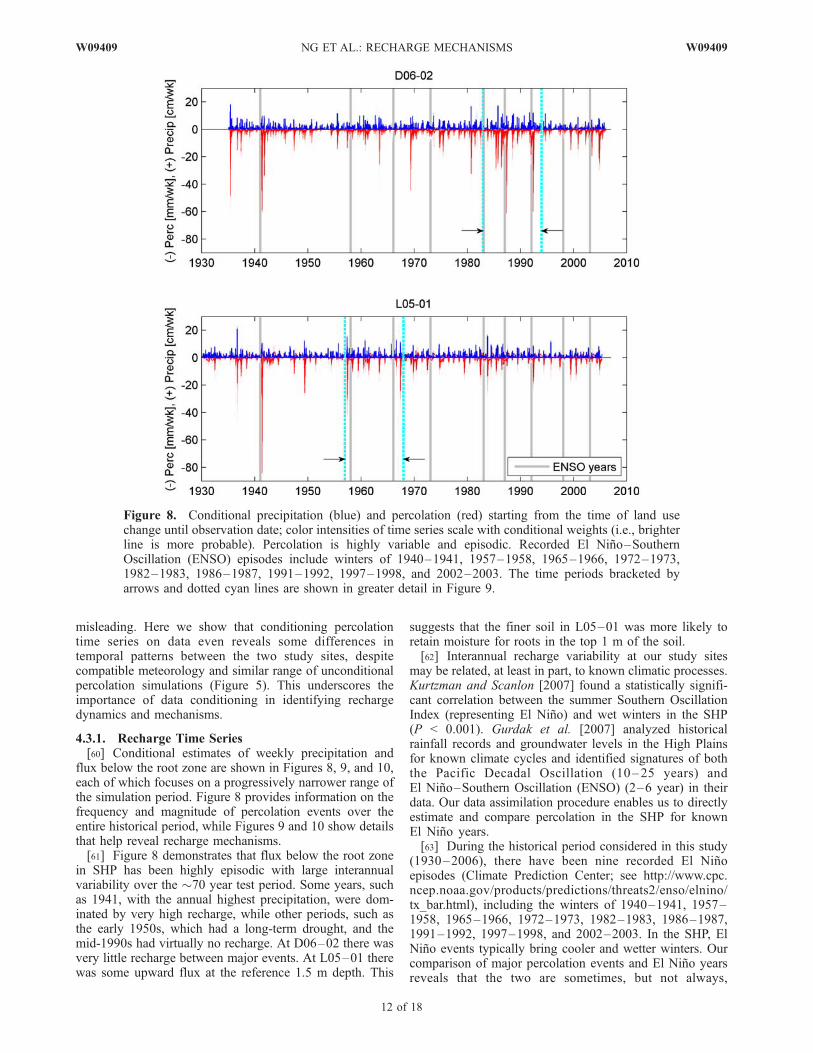
flux below the root zone are shown in Figures 8, 9, and 10,each of which focuses on a progressively narrower range ofthe simulation period. Figure 8 provides information on thefrequency and magnitude of percolation events over theentire historical period, while Figures 9 and 10 show detailsthat help reveal recharge mechanisms.[61] Figure 8 demonstrates that flux below the root zone
in SHP has been highly episodic with large interannualvariability over the 70 year test period. Some years, suchas 1941, with the annual highest precipitation, were dom-inated by very high recharge, while other periods, such asthe early 1950s, which had a long-term drought, and themid-1990s had virtually no recharge. At D06–02 there wasvery little recharge between major events. At L05–01 therewas some upward flux at the reference 1.5 m depth. This
suggests that the finer soil in L05–01 was more likely toretain moisture for roots in the top 1 m of the soil.[62] Interannual recharge variability at our study sites
may be related, at least in part, to known climatic processes.Kurtzman and Scanlon [2007] found a statistically signifi-cant correlation between the summer Southern OscillationIndex (representing El Nino) and wet winters in the SHP(P < 0.001). Gurdak et al. [2007] analyzed historicalrainfall records and groundwater levels in the High Plainsfor known climate cycles and identified signatures of boththe Pacific Decadal Oscillation (10–25 years) andEl Nino–Southern Oscillation (ENSO) (2–6 year) in theirdata. Our data assimilation procedure enables us to directlyestimate and compare percolation in the SHP for knownEl Nino years.[63] During the historical period considered in this study
(1930–2006), there have been nine recorded El Ninoepisodes (Climate Prediction Center; see http://www.cpc.ncep.noaa.gov/products/predictions/threats2/enso/elnino/tx_bar.html), including the winters of 1940–1941, 1957–1958, 1965–1966, 1972–1973, 1982–1983, 1986–1987,1991–1992, 1997–1998, and 2002–2003. In the SHP, ElNino events typically bring cooler and wetter winters. Ourcomparison of major percolation events and El Nino yearsreveals that the two are sometimes, but not always,
Figure 8. Conditional precipitation (blue) and percolation (red) starting from the time of land usechange until observation date; color intensities of time series scale with conditional weights (i.e., brighterline is more probable). Percolation is highly variable and episodic. Recorded El Nino–SouthernOscillation (ENSO) episodes include winters of 1940–1941, 1957–1958, 1965–1966, 1972–1973,1982–1983, 1986–1987, 1991–1992, 1997–1998, and 2002–2003. The time periods bracketed byarrows and dotted cyan lines are shown in greater detail in Figure 9.
12 of 18
W09409 NG ET AL.: RECHARGE MECHANISMS W09409
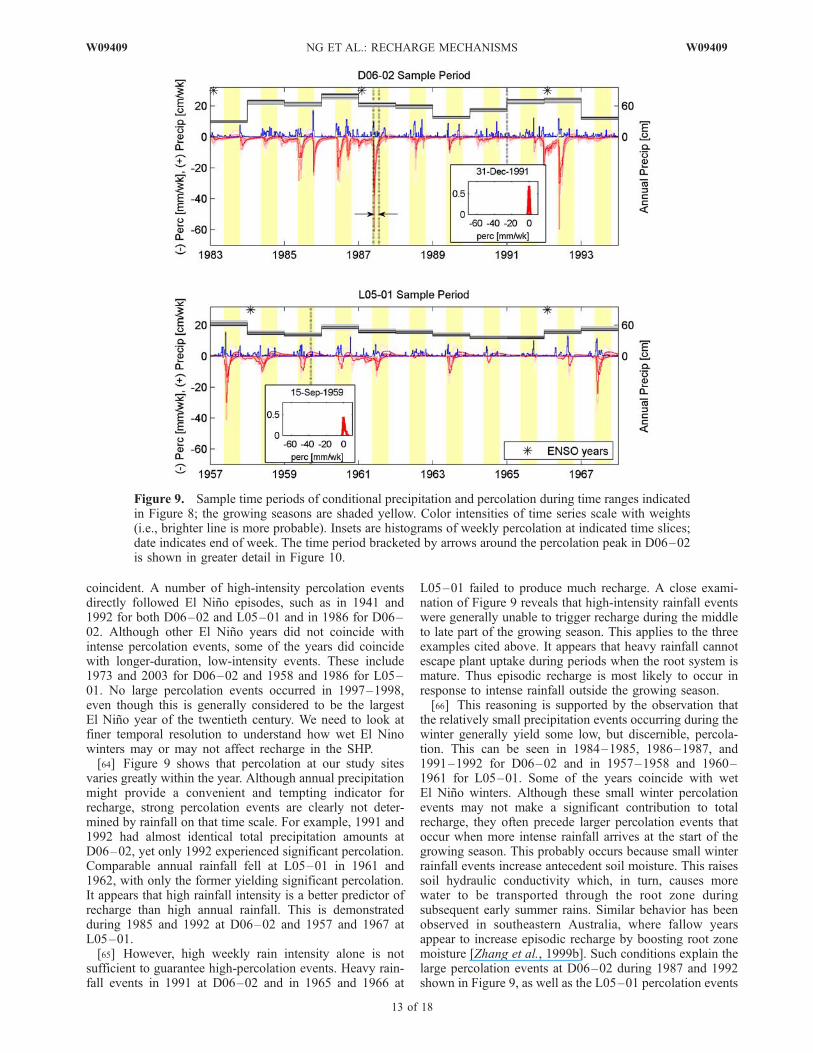
coincident. A number of high-intensity percolation eventsdirectly followed El Nino episodes, such as in 1941 and1992 for both D06–02 and L05–01 and in 1986 for D06–02. Although other El Nino years did not coincide withintense percolation events, some of the years did coincidewith longer-duration, low-intensity events. These include1973 and 2003 for D06–02 and 1958 and 1986 for L05–01. No large percolation events occurred in 1997–1998,even though this is generally considered to be the largestEl Nino year of the twentieth century. We need to look atfiner temporal resolution to understand how wet El Ninowinters may or may not affect recharge in the SHP.[64] Figure 9 shows that percolation at our study sites
varies greatly within the year. Although annual precipitationmight provide a convenient and tempting indicator forrecharge, strong percolation events are clearly not deter-mined by rainfall on that time scale. For example, 1991 and1992 had almost identical total precipitation amounts atD06–02, yet only 1992 experienced significant percolation.Comparable annual rainfall fell at L05–01 in 1961 and1962, with only the former yielding significant percolation.It appears that high rainfall intensity is a better predictor ofrecharge than high annual rainfall. This is demonstratedduring 1985 and 1992 at D06–02 and 1957 and 1967 atL05–01.[65] However, high weekly rain intensity alone is not
sufficient to guarantee high-percolation events. Heavy rain-fall events in 1991 at D06–02 and in 1965 and 1966 at
L05–01 failed to produce much recharge. A close exami-nation of Figure 9 reveals that high-intensity rainfall eventswere generally unable to trigger recharge during the middleto late part of the growing season. This applies to the threeexamples cited above. It appears that heavy rainfall cannotescape plant uptake during periods when the root system ismature. Thus episodic recharge is most likely to occur inresponse to intense rainfall outside the growing season.[66] This reasoning is supported by the observation that
the relatively small precipitation events occurring during thewinter generally yield some low, but discernible, percola-tion. This can be seen in 1984–1985, 1986–1987, and1991–1992 for D06–02 and in 1957–1958 and 1960–1961 for L05–01. Some of the years coincide with wetEl Nino winters. Although these small winter percolationevents may not make a significant contribution to totalrecharge, they often precede larger percolation events thatoccur when more intense rainfall arrives at the start of thegrowing season. This probably occurs because small winterrainfall events increase antecedent soil moisture. This raisessoil hydraulic conductivity which, in turn, causes morewater to be transported through the root zone duringsubsequent early summer rains. Similar behavior has beenobserved in southeastern Australia, where fallow yearsappear to increase episodic recharge by boosting root zonemoisture [Zhang et al., 1999b]. Such conditions explain thelarge percolation events at D06–02 during 1987 and 1992shown in Figure 9, as well as the L05–01 percolation events
Figure 9. Sample time periods of conditional precipitation and percolation during time ranges indicatedin Figure 8; the growing seasons are shaded yellow. Color intensities of time series scale with weights(i.e., brighter line is more probable). Insets are histograms of weekly percolation at indicated time slices;date indicates end of week. The time period bracketed by arrows around the percolation peak in D06–02is shown in greater detail in Figure 10.
W09409 NG ET AL.: RECHARGE MECHANISMS
13 of 18
W09409
in 1958 and 1961 following wet winters. In fact, thepresence of winter rain preceding strong spring rains seemsthe key difference between 1991 and 1992 at D06–02 and1961 and 1962 at L05–01. These years have similar annualrainfall histories, but much different recharge responses.[67] The above discussion indicates that antecedent mois-
ture resulting from above-average winter rains, often seenduring ENSO events, creates the conditions needed toobtain high recharge during intense spring rains. By con-trast, dry conditions that prevail during the growing season,when crops take up most available moisture, make high-percolation events unlikely during the late summer andearly fall, even when rainfall is intense. Late-year percola-tion events are rare at L05–01, where finer soils facilitateevapotranspiration of available moisture.[68] The spread of values shown in Figures 8–10 reveals
the uncertainty in the percolation time series generated byour probabilistic approach. The flux histograms shown atselected time slices in Figure 9 show that there is a highcertainty that both sites experienced negligible downwardflux between isolated high-percolation events, with someprobability of a slight upward flux at the end of the growingseasons at L05–01. This indication that downward moistureflux is very likely to be zero for extended periods betweenintense percolation events reinforces our characterization of
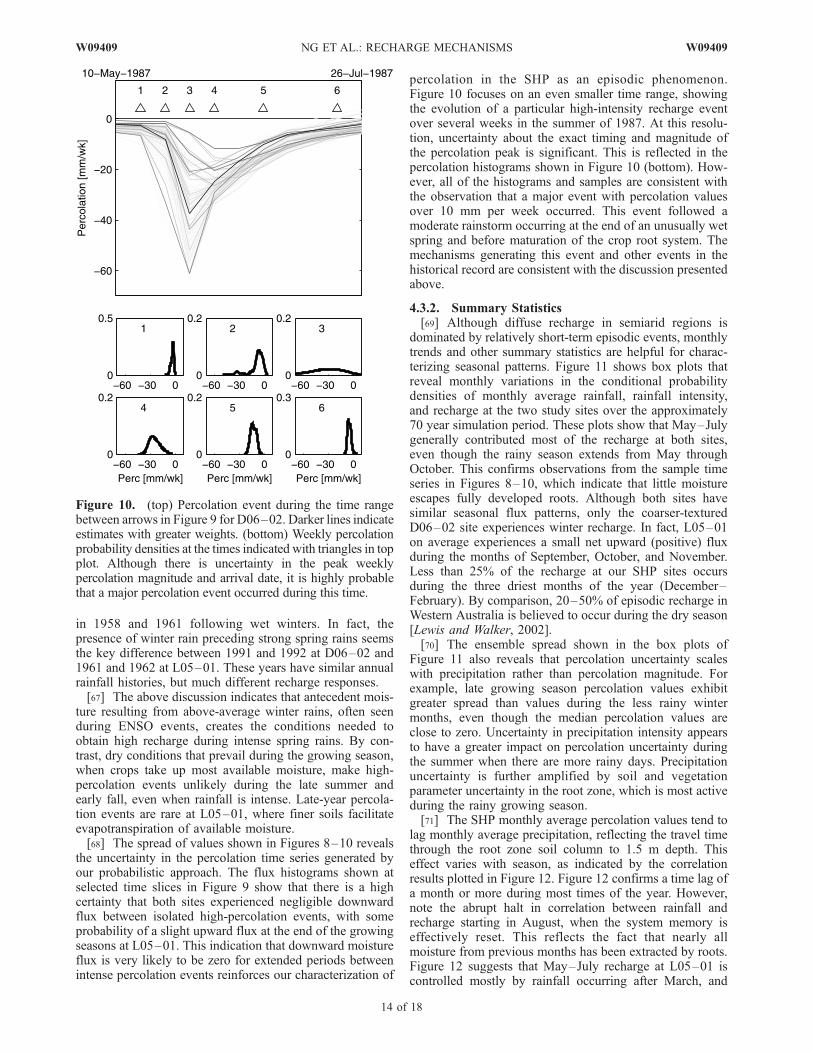
percolation in the SHP as an episodic phenomenon.Figure 10 focuses on an even smaller time range, showingthe evolution of a particular high-intensity recharge eventover several weeks in the summer of 1987. At this resolu-tion, uncertainty about the exact timing and magnitude ofthe percolation peak is significant. This is reflected in thepercolation histograms shown in Figure 10 (bottom). How-ever, all of the histograms and samples are consistent withthe observation that a major event with percolation valuesover 10 mm per week occurred. This event followed amoderate rainstorm occurring at the end of an unusually wetspring and before maturation of the crop root system. Themechanisms generating this event and other events in thehistorical record are consistent with the discussion presentedabove.
4.3.2. Summary Statistics[69] Although diffuse recharge in semiarid regions is
dominated by relatively short-term episodic events, monthlytrends and other summary statistics are helpful for charac-terizing seasonal patterns. Figure 11 shows box plots thatreveal monthly variations in the conditional probabilitydensities of monthly average rainfall, rainfall intensity,and recharge at the two study sites over the approximately70 year simulation period. These plots show that May–Julygenerally contributed most of the recharge at both sites,even though the rainy season extends from May throughOctober. This confirms observations from the sample timeseries in Figures 8–10, which indicate that little moistureescapes fully developed roots. Although both sites havesimilar seasonal flux patterns, only the coarser-texturedD06–02 site experiences winter recharge. In fact, L05–01on average experiences a small net upward (positive) fluxduring the months of September, October, and November.Less than 25% of the recharge at our SHP sites occursduring the three driest months of the year (December–February). By comparison, 20–50% of episodic recharge inWestern Australia is believed to occur during the dry season[Lewis and Walker, 2002].[70] The ensemble spread shown in the box plots of
Figure 11 also reveals that percolation uncertainty scaleswith precipitation rather than percolation magnitude. Forexample, late growing season percolation values exhibitgreater spread than values during the less rainy wintermonths, even though the median percolation values areclose to zero. Uncertainty in precipitation intensity appearsto have a greater impact on percolation uncertainty duringthe summer when there are more rainy days. Precipitationuncertainty is further amplified by soil and vegetationparameter uncertainty in the root zone, which is most activeduring the rainy growing season.[71] The SHP monthly average percolation values tend to
lag monthly average precipitation, reflecting the travel timethrough the root zone soil column to 1.5 m depth. Thiseffect varies with season, as indicated by the correlationresults plotted in Figure 12. Figure 12 confirms a time lag ofa month or more during most times of the year. However,note the abrupt halt in correlation between rainfall andrecharge starting in August, when the system memory iseffectively reset. This reflects the fact that nearly allmoisture from previous months has been extracted by roots.Figure 12 suggests that May–July recharge at L05–01 iscontrolled mostly by rainfall occurring after March, and
Figure 10. (top) Percolation event during the time rangebetween arrows in Figure 9 for D06–02. Darker lines indicateestimates with greater weights. (bottom) Weekly percolationprobability densities at the times indicated with triangles in topplot. Although there is uncertainty in the peak weeklypercolation magnitude and arrival date, it is highly probablethat a major percolation event occurred during this time.
14 of 18
W09409 NG ET AL.: RECHARGE MECHANISMS W09409
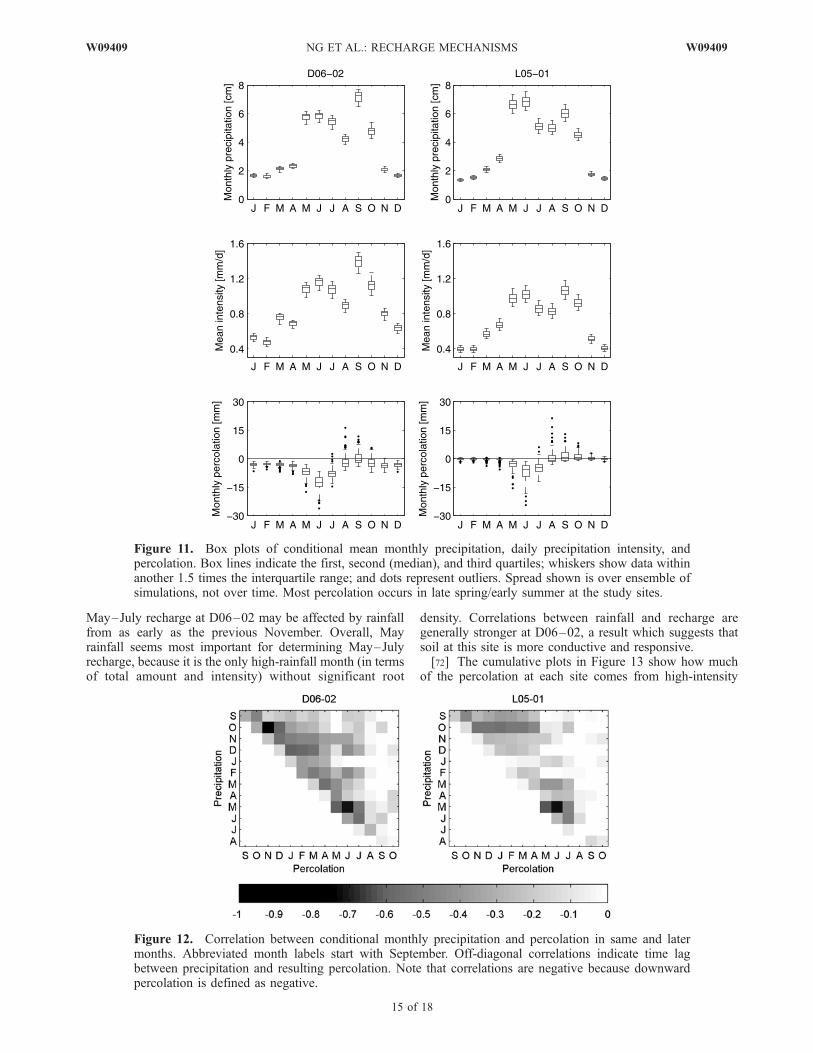
May–July recharge at D06–02 may be affected by rainfallfrom as early as the previous November. Overall, Mayrainfall seems most important for determining May–Julyrecharge, because it is the only high-rainfall month (in termsof total amount and intensity) without significant root
density. Correlations between rainfall and recharge aregenerally stronger at D06–02, a result which suggests thatsoil at this site is more conductive and responsive.[72] The cumulative plots in Figure 13 show how much
of the percolation at each site comes from high-intensity
Figure 11. Box plots of conditional mean monthly precipitation, daily precipitation intensity, andpercolation. Box lines indicate the first, second (median), and third quartiles; whiskers show data withinanother 1.5 times the interquartile range; and dots represent outliers. Spread shown is over ensemble ofsimulations, not over time. Most percolation occurs in late spring/early summer at the study sites.
Figure 12. Correlation between conditional monthly precipitation and percolation in same and latermonths. Abbreviated month labels start with September. Off-diagonal correlations indicate time lagbetween precipitation and resulting percolation. Note that correlations are negative because downwardpercolation is defined as negative.
W09409 NG ET AL.: RECHARGE MECHANISMS
15 of 18
W09409
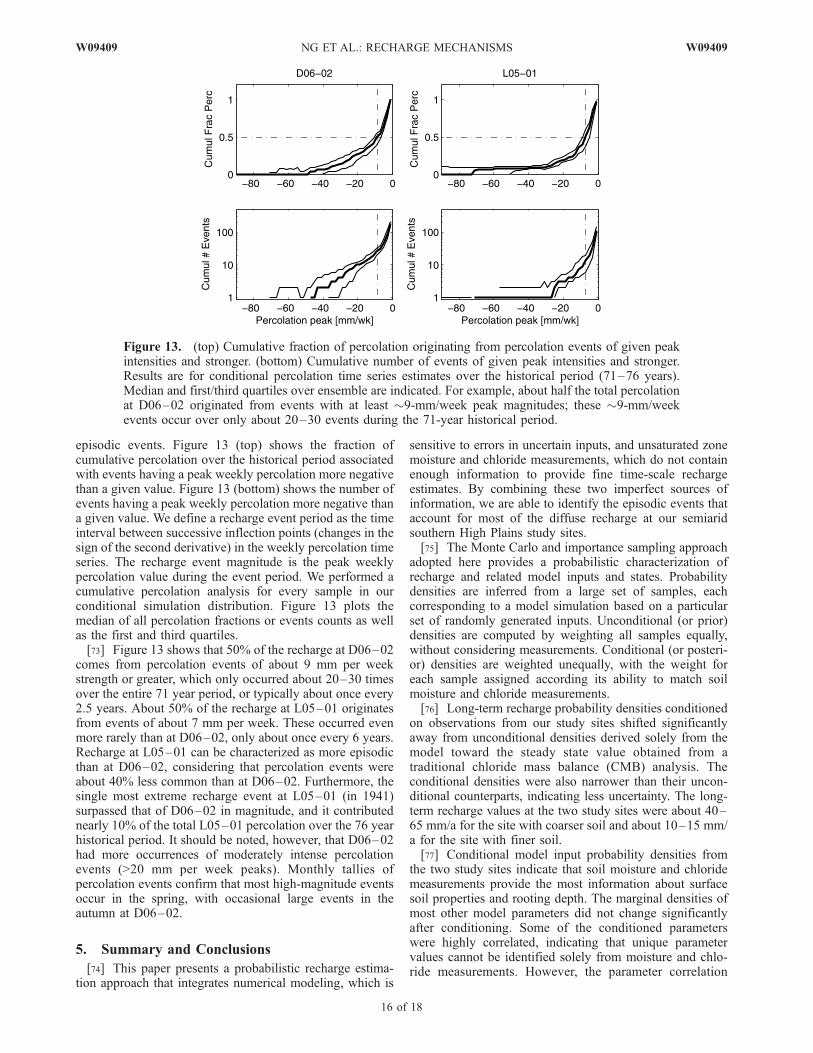
episodic events. Figure 13 (top) shows the fraction ofcumulative percolation over the historical period associatedwith events having a peak weekly percolation more negativethan a given value. Figure 13 (bottom) shows the number ofevents having a peak weekly percolation more negative thana given value. We define a recharge event period as the timeinterval between successive inflection points (changes in thesign of the second derivative) in the weekly percolation timeseries. The recharge event magnitude is the peak weeklypercolation value during the event period. We performed acumulative percolation analysis for every sample in ourconditional simulation distribution. Figure 13 plots themedian of all percolation fractions or events counts as wellas the first and third quartiles.[73] Figure 13 shows that 50% of the recharge at D06–02
comes from percolation events of about 9 mm per weekstrength or greater, which only occurred about 20–30 timesover the entire 71 year period, or typically about once every2.5 years. About 50% of the recharge at L05–01 originatesfrom events of about 7 mm per week. These occurred evenmore rarely than at D06–02, only about once every 6 years.Recharge at L05–01 can be characterized as more episodicthan at D06–02, considering that percolation events wereabout 40% less common than at D06–02. Furthermore, thesingle most extreme recharge event at L05–01 (in 1941)surpassed that of D06–02 in magnitude, and it contributednearly 10% of the total L05–01 percolation over the 76 yearhistorical period. It should be noted, however, that D06–02had more occurrences of moderately intense percolationevents (>20 mm per week peaks). Monthly tallies ofpercolation events confirm that most high-magnitude eventsoccur in the spring, with occasional large events in theautumn at D06–02.
5. Summary and Conclusions
[74] This paper presents a probabilistic recharge estima-tion approach that integrates numerical modeling, which is
sensitive to errors in uncertain inputs, and unsaturated zonemoisture and chloride measurements, which do not containenough information to provide fine time-scale rechargeestimates. By combining these two imperfect sources ofinformation, we are able to identify the episodic events thataccount for most of the diffuse recharge at our semiaridsouthern High Plains study sites.[75] The Monte Carlo and importance sampling approach
adopted here provides a probabilistic characterization ofrecharge and related model inputs and states. Probabilitydensities are inferred from a large set of samples, eachcorresponding to a model simulation based on a particularset of randomly generated inputs. Unconditional (or prior)densities are computed by weighting all samples equally,without considering measurements. Conditional (or posteri-or) densities are weighted unequally, with the weight foreach sample assigned according its ability to match soilmoisture and chloride measurements.[76] Long-term recharge probability densities conditioned
on observations from our study sites shifted significantlyaway from unconditional densities derived solely from themodel toward the steady state value obtained from atraditional chloride mass balance (CMB) analysis. Theconditional densities were also narrower than their uncon-ditional counterparts, indicating less uncertainty. The long-term recharge values at the two study sites were about 40–65 mm/a for the site with coarser soil and about 10–15 mm/a for the site with finer soil.[77] Conditional model input probability densities from
the two study sites indicate that soil moisture and chloridemeasurements provide the most information about surfacesoil properties and rooting depth. The marginal densities ofmost other model parameters did not change significantlyafter conditioning. Some of the conditioned parameterswere highly correlated, indicating that unique parametervalues cannot be identified solely from moisture and chlo-ride measurements. However, the parameter correlation
Figure 13. (top) Cumulative fraction of percolation originating from percolation events of given peakintensities and stronger. (bottom) Cumulative number of events of given peak intensities and stronger.Results are for conditional percolation time series estimates over the historical period (71–76 years).Median and first/third quartiles over ensemble are indicated. For example, about half the total percolationat D06–02 originated from events with at least 9-mm/week peak magnitudes; these 9-mm/weekevents occur over only about 20–30 events during the 71-year historical period.
16 of 18
W09409 NG ET AL.: RECHARGE MECHANISMS W09409
patterns, as exemplified in the plot of bivariate conditionalprobability densities, identify the combinations of parametervalues (e.g., root depth and evaporation parameters) re-quired to explain observed recharge patterns. Overall, theconditioning process narrows the set of possible inputcombinations, giving a better picture of uncertain soil andvegetation properties at the study sites. This type of uncer-tainty reduction cannot be obtained in a deterministic modelcalibration that focuses only on point estimates of individualinput variables.[78] Our study uses percolation (moisture flux at 1.5 m
depth, just below the root zone) to analyze recharge mech-anisms. Our model-based data assimilation procedure pro-vides conditional percolation probability densities at a finetime scale, enabling us to examine individual percolationevents that generate recharge. Percolation at the two sitesappears to be highly episodic and variable over the yearsand seasons, with 50% of long-term percolation originatingfrom events occurring only once in about 2.5 years at thesite with coarser soils, and once in about 6 years at the sitewith finer soils. In fact, at the finer-textured site, a singlerare intense episodic event probably contributed almost10% of the net percolation over the 76 year study period.[79] Conditional probability densities for monthly perco-
lation show that, on average, most recharge occurs in theearly growing season (May–July), when rains are heavy yetroots have not reached full maturity. This time of year alsohas the highest-magnitude percolation events, which typi-cally follow high-intensity rainfall. In contrast, heavy rainsin the middle to late growing season rarely trigger appre-ciable recharge, especially at the finer-textured L05–01 site.Rain that does fall during the winter dry season tends toprovide weak but sustained recharge. Furthermore, thesewinter events often provide the antecedent moisture con-ditions that facilitate strong recharge peaks in the latespring, when rains can be intense and crop roots are notyet well established. Thus wet winters, sometimes broughtby El Nino events, can contribute to both total and high-intensity recharge by directly yielding weak winter rechargeand providing moist soil conditions for springtime recharge.Overall, the recipe for high recharge at our study sites seemsto be a combination of moderate winter rainfall, whichprovides antecedent moisture, followed by intense springrainfall events that occur at times when root uptake is small.[80] Data assimilation techniques that rely on both models
and field observations provide the flexibility and temporalresolution needed to identify the factors responsible forepisodic recharge. Probabilistic approaches such as thecombination of Monte Carlo simulation and importancesampling used in our study are able to identify the combina-tions of meteorological conditions and soil and vegetationproperties that facilitate recharge. Episodic percolationevents that give rise to recharge may occur infrequently insemiarid regions, but they can account for a significant flux ofwater to subsurface aquifers. Improved understanding ofsuch events, derived from models and field observations,should enable us to make better predictions of the impacts ofland use and climate change on subsurface water supplies.
[81] Acknowledgments. Partial support for this work was providedby U.S. National Science Foundation grants 0003361, 0121182, 0530851,and 0540259. We would also like to thank Robert Reedy for assisting withthe soil profile data.
ReferencesAllison, G. B., and M. W. Hughes (1983), The use of natural tracers asindicators of soil-water movement in a temperate semi-arid region,J. Hydrol., 60, 157–173, doi:10.1016/0022-1694(83)90019-7.
Allison, G. B., G. W. Gee, and S. W. Tyler (1994), Vadose zone techniquesfor estimating groundwater recharge in arid and semiarid regions, SoilSci. Soc. Am. J., 58, 6–14.
Arulampalam, M. S., S. Maskell, N. Gordon, and T. Clapp (2002), Atutorial on particle filters for online nonlinear/non-Gaussian Bayesiantracking, IEEE Trans. Signal Processes, 50(2), 174–188, doi:10.1109/78.978374.
Askew, S. D., and J. W. Wilcut (2002), Pale smartweed interference andachene production cotton, Weed Sci., 50, 357–363, doi:10.1614/0043-1745(2002)050[0357:PSIAAP]2.0.CO;2.
Black, T. A., W. R. Gardner, and G. W. Thurtell (1969), The prediction ofevaporation, drainage, and soil water storage for a bare soil, Soil Sci. Soc.Am. J., 33, 655–660.
Bland, W. L., and W. A. Dugas (1989), Cotton root growth and soil waterextraction, Soil Sci. Soc. Am. J., 53, 1850–1855.
Cook, P. G., G. R. Walker, and I. D. Jolly (1989), Spatial variability ofgroundwater recharge in a semiarid region, J. Hydrol., 111, 195–212,doi:10.1016/0022-1694(89)90260-6.
Cook, P. G., W. M. Edmunds, and C. B. Gaye (1992), Estimating paleor-echarge and paleoclimate from unsaturated zone profiles, Water Resour.Res., 28(10), 2721–2731, doi:10.1029/92WR01298.
Daum, F., and J. Huang (2003), Curse of dimensionality and particle filters,IEEE Aerosp. Conf. Proc., 4, 4_1979–4_1993.
de Vries, J. J., and I. Simmers (2002), Groundwater recharge: An overviewof processes and challenges, Hydrogeol. J., 10, 5 –17, doi:10.1007/s10040-001-0171-7.
Djuric, P. M., J. H. Kotecha, J. Zhang, Y. Huang, T. Ghirmai, M. F.Bugallo, and J. Mıguez (2003), Applications of particle filtering to se-lected problems in communications: A review and new developments,Signal Processing Mag., 20(5), 19–38, doi:10.1109/MSP.2003.1236770.
Droogers, P. (2000), Estimating actual evapotranspiration using a detailedagro-hydrological model, J. Hydrol., 229, 50–58, doi:10.1016/S0022-1694(99)00198-5.
Dunne, S., and D. Entekhabi (2006), Land surface state and flux estimationusing the ensemble Kalman smoother during the Southern Great Plains1997 field experiment, Water Resour. Res., 42, W01407, doi:10.1029/2005WR004334.
Flint, A. L., L. E. Flint, E. M. Kwicklis, J. T. Fabryka-Martin, and G. S.Bodvarsson (2002), Estimating recharge at Yucca Mountain, Nevada,USA: Comparison of methods, Hydrogeol. J., 10 , 180 – 204,doi:10.1007/s10040-001-0169-1.
Gee, G. W., and D. Hillel (1988), Groundwater recharge in arid regions:Review and critique of estimation methods, Hydrol. Processes, 2,255–266, doi:10.1002/hyp.3360020306.
Gee, G. W., Z. F. Zhang, S. W. Tyler, W. H. Albright, and M. J. Singleton(2005), Chloride mass balance: Cautions in predicting increased rechargerates, Vadose Zone J., 4, 72–78, doi:10.2113/4.1.72.
Ginn, T. R., and E. M. Murphy (1997), A transient flux model for con-vective infiltration: Forward and inverse solutions for chloride massbalance studies, Water Resour. Res., 33(9), 2065–2079, doi:10.1029/97WR01618.
Gurdak, J. J., R. T. Hanson, P. B. McMahon, B. W. Bruce, J. E. McCray,G. D. Thyne, and R. C. Reedy (2007), Climate variability controls onunsaturated water and chemical movement, High Plains Aquifer, USA,Vadose Zone J., 6(2), 533–547, doi:10.2136/vzj2006.0087.
Hanson, C. L., K. A. Cumming, D. A. Woolhiser, and C. W. Richardson(1994), Microcomputer program for daily weather simulation, Publ.ARS-114, 38 pp., Agric. Res. Serv., U.S. Dep. of Agric., Washington,D. C.
Kearns, A. K., and J. M. H. Hendrickx (1998), Temporal variability ofdiffuse groundwater recharge in New Mexico, Tech. Rep. 309, 43 pp.,N. M. Water Resour. Res. Inst., Socorro.
Keese, K. E., B. R. Scanlon, and R. C. Reedy (2005), Assessing controls ondiffuse groundwater recharge using unsaturated flow modeling, WaterResour. Res., 41, W06010, doi:10.1029/2004WR003841.
Kennet-Smith, A., P. G. Cook, and G. R. Walker (1994), Factors affectinggroundwater recharge following clearing in the south western MurrayBasin, J. Hydrol., 154, 85–105, doi:10.1016/0022-1694(94)90213-5.
Kitanidis, P. K., and R. L. Bras (1980), Real-time forecasting with a con-ceptual hydrologic model: 1. Analysis of uncertainty, Water Resour. Res.,16(6), 1025–1033, doi:10.1029/WR016i006p01025.
W09409 NG ET AL.: RECHARGE MECHANISMS
17 of 18
W09409
Kroes, J. G. and J. C. van Dam (Eds.) (2003), Reference manual SWAPversion 3.0.3, Alterra Rep. 773, Alterra, Wageningen, Netherlands.
Kurtzman, D., and B. R. Scanlon (2007), El Nino–Southern Oscillationand Pacific Decadal Oscillation impacts on precipitation in the southernand central United States: Evaluation of spatial distribution and predic-tions, Water Resour. Res., 43, W10427, doi:10.1029/2007WR005863.
Leaney, F. W., A. L. Herczeg, and G. R. Walker (2003), Salinization of afresh paleo-ground water resource by enhanced recharge, Ground Water,41(1), 84–92, doi:10.1111/j.1745-6584.2003.tb02571.x.
Lewis, M. F., and G. R. Walker (2002), Assessing the potential for signifi-cant and episodic recharge in southwestern Australia using rainfall data,Hydrogeol. J., 10.229–10.237.
Margulis, S. A., D. McLaughlin, D. Entekhabi, and S. Dunne (2002), Landdata assimilation and estimation of soil moisture using measurementsfrom the Southern Great Plains 1997 Field Experiment, Water Resour.Res., 38(12), 1299, doi:10.1029/2001WR001114.
McLaughlin, D. (2007), A probabilistic perspective on nonlinear modelinversion and data assimilation, in Subsurface Hydrology: Data Integra-tion for Properties and Processes, Geophys. Monogr. Ser., vol. 171,edited by D. W. Hyndman, F. D. Day-Lewis, and K. Singha, pp. 243–253, AGU, Washington, D. C.
McLaughlin, D., L. B. Reid, S. G. Li, and J. Hyman (1993), A stochasticmethod for characterizing groundwater contamination, Ground Water,31(2), 237–249, doi:10.1111/j.1745-6584.1993.tb01816.x.
Monteith, J. L. (1981), Evaporation and surface temperature, Q. J. R. Soc.,107, 1–27, doi:10.1256/smsqj.45101.
Moradkhani, H., K.-L. Hsu, H. Gupta, and S. Sorooshian (2005), Uncer-tainty assessment of hydrologic model states and parameters: Sequentialdata assimilation using the particle filter, Water Resour. Res., 41,W05012, doi:10.1029/2004WR003604.
Murphy, E. M., T. R. Ginn, and J. L. Phillips (1996), Geochemical esti-mates of paleorecharge in the Pasco Basin: Evaluation of the chloridemass balance technique, Water Resour. Res., 32(9), 2853 – 2868,doi:10.1029/96WR01529.
National Renewable Energy Laboratory (2007), National Solar RadiationDatabase, 1991–2005 Update, Golden, Colo.
Ng, G. C. (2008), Probabilistic estimation and prediction of groundwaterrecharge in a semi-arid environment, Ph.D. dissertation, Dep. of Civ. andEnviron. Eng., Mass. Inst. of Technol., Cambridge.
Pan, M., E. F. Wood, R. Wojcik, and M. F. McCabeb (2008), Estimation ofregional terrestrial water cycle using multi-sensor remote sensing obser-vations and data assimilation, Remote Sens. Environ., 112(4), 1282–1294, doi:10.1016/j.rse.2007.02.039.
Phillips, F. M. (1994), Environmental tracers for water movement in desertsoils of the American Southwest, Soil Sci. Soc. Am. J., 58, 15–24.
Reichle, R. H., D. Entekhabi, and D. B. McLaughlin (2001), Downscalingof radio brightness measurements for soil moisture estimation: A four-dimensional variational data assimilation approach, Water Resour. Res.,37(9), 2353–2364, doi:10.1029/2001WR000475.
Reichle, R. H., D. B. McLaughlin, and D. Entekhabi (2002), Hydrologicdata assimilation with the ensemble Kalman filter, Mon. Weather Rev.,4(130), 103–114, doi:10.1175/1520-0493(2002)130<0103:HDAWTE>2.0.CO;2.
Ritchie, J. T. (1972), Model for predicting evaporation from a row crop withincomplete cover, Water Resour. Res., 8(5), 1204–1213, doi:10.1029/WR008i005p01204.
Robinson, R. A., and R. H. Stokes (1965), Electrolyte Solutions, 2nd ed.,Butterworth, London.
Sarwar, A., and R. A. Feddes (2000), Evaluating drainage design para-meters for the Fourth Drainage Project, Pakistan by using SWAP model:Part II. Modeling results, Irrig. Drain., 14, 281–299, doi:10.1023/A:1006416921124.
Scanlon, B. R. (2000), Uncertainties in estimating water fluxes and resi-dence times using environmental tracers in an arid unsaturated zone,Water Resour. Res., 36(2), 395–409, doi:10.1029/1999WR900240.
Scanlon, B. R., and R. S. Goldsmith (1997), Field study of spatial varia-bility in unsaturated flow beneath and adjacent to playas, Water Resour.Res., 33(10), 2239–2252, doi:10.1029/97WR01332.
Scanlon, B. R., R. W. Healy, and P. G. Cook (2002), Choosing appropriatetechniques for quantifying groundwater recharge, Hydrogeol. J., 10, 18–39, doi:10.1007/s10040-001-0176-2.
Scanlon, B. R., K. Keese, R. C. Reedy, J. Simunek, and B. J. Andraski(2003), Variations in flow and transport in thick desert vadose zones in
response to paleoclimatic forcing (0–90 kyr): Field measurements, mod-eling, and uncertainties, Water Resour. Res., 39(7), 1179, doi:10.1029/2002WR001604.
Scanlon, B. R., R. C. Reedy, D. A. Stonestrom, and D. E. Prudic (2005),Impact of land use and land cover change on groundwater recharge andquantity in the southwestern USA, Global Change Biol., 11, 1577–1593,doi:10.1111/j.1365-2486.2005.01026.x.
Scanlon, B. R., R. C. Reedy, and J. A. Tachovsky (2007), Semiarid un-saturated zone chloride profiles: Archives of past land use change im-pacts on water resources in the southern High Plains, United States,Water Resour. Res., 43, W06423, doi:10.1029/2006WR005769.
Schaap, M. G., F. J. Leij, and M. T. van Genuchten (2001), Rosetta: Acomputer program for estimating soil hydraulic parameters with hierarch-ical pedotransfer functions, J. Hydrol., 251, 163–176, doi:10.1016/S0022-1694(01)00466-8.
Small, E. E. (2005), Climatic controls on diffuse groundwater recharge insemiarid environments of the southwestern United States, Water Resour.Res., 41, W04012, doi:10.1029/2004WR003193.
Smith, P. J., K. J. Beven, and J. A. Tawn (2008), Detection of structuralinadequacy in process-based hydrological models: A particle-filteringapproach, Water Resour. Res., 44, W01410, doi:10.1029/2006WR005205.
Tyler, S. W., and G. R. Walker (1994), Root zone effects on tracer migrationin arid zones, Soil Sci. Soc. Am. J., 58, 25–31.
van Dam, J. C., P. Groenendijk, R. F. A. Hendriks, and J. G. Kroes (2008),Advances of modeling water flow in variably saturated soils with SWAP,Vadose Zone J., 7(2), 640–653, doi:10.2136/vzj2007.0060.
van Genuchten, M. T. (1980), A closed form equation for predicting thehydraulic conductivity of unsaturated soils, Soil Sci. Soc. Am. J., 44,892–898.
Vrugt, J. A., C. G. H. Diks, H. V. Gupta, W. Bouten, and J. M. Verstraten(2005), Improved treatment of uncertainty in hydrologic modeling: Com-bining the strengths of global optimization and data assimilation, WaterResour. Res., 41, W01017, doi:10.1029/2004WR003059.
Walker, G. R., I. D. Jolly, and P. G. Cook (1991), A new chloride leachingapproach to the estimation of diffuse recharge following a change in landuse, J. Hydrol., 128, 49–67, doi:10.1016/0022-1694(91)90131-Z.
Weerts, A. H., and G. Y. H. El Serafy (2006), Particle filtering and en-semble Kalman filtering for state updating with hydrological conceptualrainfall-runoff models, Water Resour. Res., 42, W09403, doi:10.1029/2005WR004093.
Wood, W. W., and W. E. Sanford (1995), Chemical and isotopic methodsfor quantifying ground-water recharge in a regional semiarid environ-ment, Ground Water, 33, 458 – 468, doi:10.1111/j.1745-6584.1995.tb00302.x.
Zhang, L., I. H. Hume, M. G. O’Connell, D. C. Mitchell, P. L. Milthorpe,M. Yee, W. R. Dawes, and T. J. Hatton (1999a), Estimating episodicrecharge under difference crop/pasture rotations in the Mallee region:Part 1. Experiments and model calibration, Agric. Water Manage., 42,219–235, doi:10.1016/S0378-3774(99)00035-9.
Zhang, L., W. R. Dawes, T. J. Hatton, I. H. Hume, M. G. O’Connell,D. C. Mitchell, P. L. Milthorpe, and M. Yee (1999b), Estimating epi-sodic recharge under different crop/pasture rotations in the Mallee re-gion: Part 2. Recharge control by agronomic practices, Agric. WaterManage., 42(2), 237–249, doi:10.1016/S0378-3774(99)00034-7.
Zhou, Y. H., D. McLaughlin, and D. Entekhabi (2006), Assessing theperformance of the ensemble Kalman filter for land surface data assim-ilation, Mon. Weather Rev., 134(8), 2128 – 2142, doi:10.1175/MWR3153.1.
����������������������������D. Entekhabi, Department of Civil and Environmental Engineering,
Massachusetts Institute of Technology, Parsons Laboratory, Building48-216G, Cambridge, MA 02139, USA.
D. McLaughlin, Department of Civil and Environmental Engineering,Massachusetts Institute of Technology, Parsons Laboratory, Building48-329, Cambridge, MA 02139, USA.
G.-H. C. Ng, Department of Civil and Environmental Engineering,Massachusetts Institute of Technology, Parsons Laboratory, Building48-208, Cambridge, MA 02139, USA. ([email protected])
B. Scanlon, Bureau of Economic Geology, Jackson School ofGeosciences, University of Texas at Austin, J. J. Pickle Research Campus,Building 130, 10100 Burnet Road, Austin, TX 78758-4445, USA.
18 of 18
W09409 NG ET AL.: RECHARGE MECHANISMS W09409
Related Documents


