Using Browser Interaction Data to Determine Page Reading Behavior David Hauger 1 and Alexandros Paramythis 1 and Stephan Weibelzahl 2 1 Institute for Information Processing and Microprocessor Technology Johannes Kepler University, Altenbergerstrasse 69, A-4040, Linz, Austria {hauger,alpar}@fim.uni-linz.ac.at 2 School of Computing, National College of Ireland, Mayor Street, IFSC, Dublin 1, Ireland [email protected] Abstract. The main source of information in most adaptive hyperme- dia systems are server monitored events such as page visits and link selections. One drawback of this approach is that pages are treated as “monolithic” entities, since the system cannot determine what portions may have drawn the user’s attention. Departing from this model, the work described here demonstrates that client-side monitoring and inter- pretation of users’ interactive behavior (such as mouse moves, clicks and scrolling) allows for detailed and significantly accurate predictions on what sections of a page have been looked at. More specifically, this pa- per provides a detailed description of an algorithm developed to predict which paragraphs of text in a hypertext document have been read, and to which extent. It also describes the user study, involving eye-tracking for baseline comparison, that served as the basis for the algorithm. Keywords: interaction monitoring, modeling algorithm, eye-tracking, empirical study 1 Introduction Server-side data collection is the most common source of information in adaptive hypermedia systems (AHS). The main drawback of relying solely on request- based information is that requesting a page is not necessarily equivalent to read- ing everything that is presented on this page. Therefore, more recent systems also utilize time between requests [10] and / or semantic information embedded in the requests to improve on derived assumptions. Client-side user behavior has long been identified as a potential additional source of information, but due to technical limitations it was difficult to access. Early attempts used custom browsers [15] or browser plugins [5] to enable client- side monitoring. With JavaScript now established as a commonly supported in- browser technology, more recent systems used this to reliably capture mouse and keyboard events on the client side. For instance, mouse movements have been used to identify learning types [14] [1] or as input for a neural network to

Welcome message from author
This document is posted to help you gain knowledge. Please leave a comment to let me know what you think about it! Share it to your friends and learn new things together.
Transcript

Using Browser Interaction Data to DeterminePage Reading Behavior
David Hauger1 and Alexandros Paramythis1 and Stephan Weibelzahl2
1 Institute for Information Processing and Microprocessor TechnologyJohannes Kepler University, Altenbergerstrasse 69, A-4040, Linz, Austria
{hauger,alpar}@fim.uni-linz.ac.at2 School of Computing, National College of Ireland,
Mayor Street, IFSC, Dublin 1, [email protected]
Abstract. The main source of information in most adaptive hyperme-dia systems are server monitored events such as page visits and linkselections. One drawback of this approach is that pages are treated as“monolithic” entities, since the system cannot determine what portionsmay have drawn the user’s attention. Departing from this model, thework described here demonstrates that client-side monitoring and inter-pretation of users’ interactive behavior (such as mouse moves, clicks andscrolling) allows for detailed and significantly accurate predictions onwhat sections of a page have been looked at. More specifically, this pa-per provides a detailed description of an algorithm developed to predictwhich paragraphs of text in a hypertext document have been read, andto which extent. It also describes the user study, involving eye-trackingfor baseline comparison, that served as the basis for the algorithm.
Keywords: interaction monitoring, modeling algorithm, eye-tracking,empirical study
1 Introduction
Server-side data collection is the most common source of information in adaptivehypermedia systems (AHS). The main drawback of relying solely on request-based information is that requesting a page is not necessarily equivalent to read-ing everything that is presented on this page. Therefore, more recent systemsalso utilize time between requests [10] and / or semantic information embeddedin the requests to improve on derived assumptions.
Client-side user behavior has long been identified as a potential additionalsource of information, but due to technical limitations it was difficult to access.Early attempts used custom browsers [15] or browser plugins [5] to enable client-side monitoring. With JavaScript now established as a commonly supported in-browser technology, more recent systems used this to reliably capture mouseand keyboard events on the client side. For instance, mouse movements havebeen used to identify learning types [14] [1] or as input for a neural network to
calculate a “level of activity” for a page [5]. Within “The Curious Browser” [4],Claypool et al. found that the amount of scrolling and the time spent on a pagemay be used to identify interests, and that the absence of individual scrollingactions or mouse clicks helped to identify the least interesting pages.
More recent work by the authors has examined the premise that increasedgranularity of information on a user’s client-side activities might help not onlyin making inferences on a page as a whole, but also in splitting pages and treat-ing the resulting fragments separately [6]. A first user study conducted to thisend [8] addressed the question of whether browser events (resulting from userinteraction) are generally suited for differentiating the user’s reading behavior indistinct parts of a page. In this study, users were asked to read a single news pageincluding several short articles. Their behavior was recorded with a purposelydeveloped JavaScript monitoring library. Results showed that some events (espe-cially clicks and text selections) are well suited to identifying whether the relatedtext fragment has been read, although the lack of explicit interactions reducesthe accuracy of assumptions. For instance, a selection in a paragraph is a strongindicator that the paragraph has been read; however, the more common case of“no selections” provides hardly any information at all. On the other hand, insome cases it is trivial to determine that something has not been read (e.g., theuser never scrolled to a part of the page), but increasing times of visibility oftext fragments –above the estimated time required for reading– by themselves,only slightly change the probabilities that something has been read. Using theamount of time the mouse pointer has hovered over articles was found to givesome additional information on whether some paragraph might have been read.
Following these first encouraging results, we went on to examine whether itis possible to increase the accuracy of predicting what a user has read while ata page, by identifying and interpreting specific patterns in the user’s interactivebehavior. A primary objective in this second study has been to perform themonitoring unobtrusively, allowing the user to behave naturally (in contrast toapproaches that enforce specific user behavior, such as blurring the screen andhighlighting only the area around the mouse pointer, to force the user to “readwith the mouse” [16]). Our overall goal was to find out how the observation ofusers’ normal and unencumbered mouse and keyboard behavior could be relatedto what users are currently reading. Correlations of mouse and eye positions insituations with many “required” mouse interactions like web browsing [3] andwithin search interfaces [2] [13] have already been measured. The same is truefor repeated visitation patterns [12] [11]. Our own results [7] showed a potentialfor learning environments as well, and we have been able to prove a number ofhypotheses based on interaction patterns that were then used as a basis for analgorithm that associates such patterns with the users’ reading behavior.
This paper reports on the aforementioned second study, along with the hy-potheses tested and the results obtained; the prediction algorithm developed onthe basis of these results; and the performance of the algorithm. The paper isconcluded with a discussion of the algorithm’s strengths and limitations, and anoutlook of our ongoing and forthcoming work in this area.

2 Method and Experimental Setup
2.1 Hypotheses
As a first step in developing an algorithm for predicting what users read ona page, we examined a number of hypotheses that attempted to relate specificinteraction patterns with reading behavior. These included (imprecise terms usedare defined in section 2.3, after discussing the experimental setup):
H1: For pages where users moved their mouse frequently: (a) there is strongcorrelation between the positions of the mouse pointer and the users’ gaze;(b) there is strong correlation between the positions of the mouse pointerand the users’ gaze, while the users are moving the mouse; (c) the paragraphunder the mouse pointer tends to be the same as the one being read; (d)the paragraph under the mouse pointer tends to be the same as the onebeing read, while the users are moving the mouse; and, (e) if the frequentmovement is vertical, the mouse pointer’s position is strongly correlated withthe position of the users’ gaze.
H2: An indicator for the user’s current reading position is: (a) moving the mouse;(b) clicking on text; and, (c) selecting text.
H3: For users using their mouse frequently, the mouse position may be used toidentify the relative position within the screen (e.g., top, middle, bottom)they most likely pay attention to (using the mouse position as indicator)
H4: After scrolling up, users are more likely to focus their attention on the itemsthat became visible and were not visible before.
H5: Users scrolling down at small increments, tend to read mostly within arelative area of the screen (top / center / bottom).
2.2 Experiment Setup
To test these hypotheses, we designed a study that allowed us to compare users’reading behavior when encountering different types of text, to their interactivebehavior while reading these texts in a browser. Reading behavior was deter-mined through eye-tracking (described in more detail later), whereas interactivebehavior was recorded through the purposely developed JavaScript library. Thestudy involved a total of 13 participants (6 male, 7 female) in Ireland. Partic-ipants were given five tasks to perform, each based on a different type of texttypically encountered online (one main task with seven pages of instructions andinformation for a board game, and four additional single-page tasks: a multiplechoice questionnaire on the board game, a set of search results, a health-relatedarticle, and a set of news items). User interaction with the texts, as well as withall other study-related materials and instructions, was through a browser.
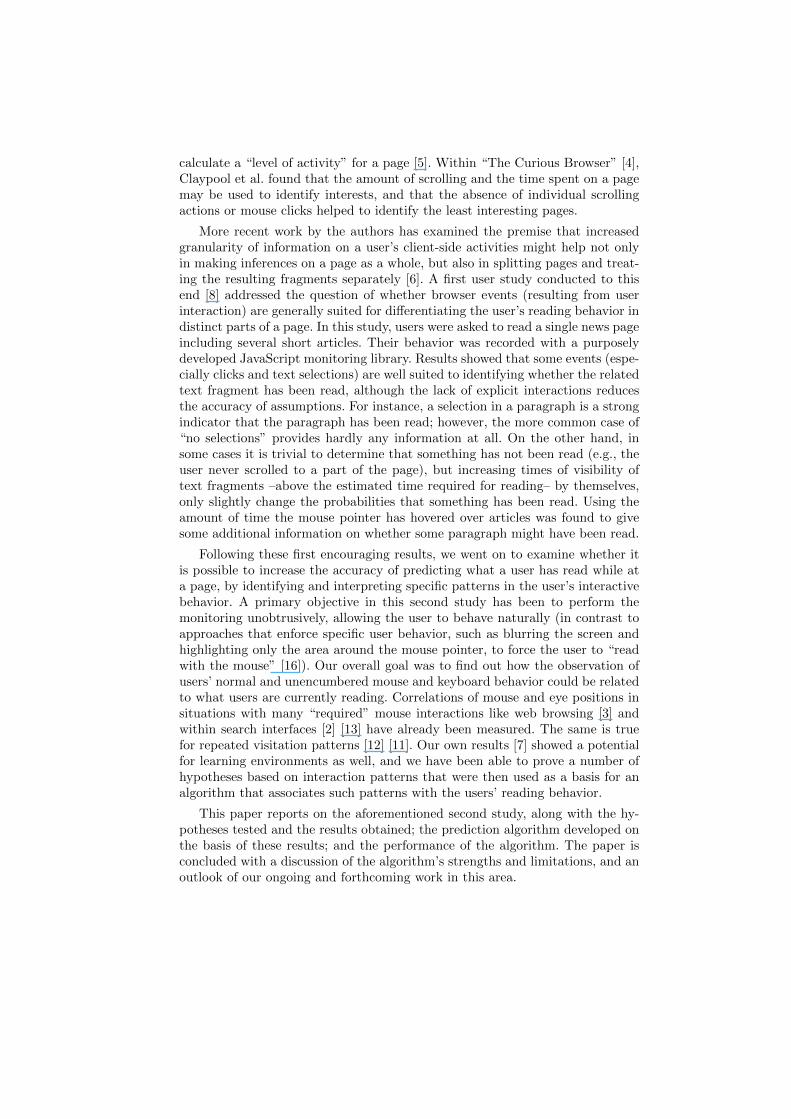
The main task involved the users learning about, and answering questionsregarding, the game of “Go”. The seven different pages comprised text (ca. 7010words), graphics (11) and pictures (5). A typical page is shown in Fig. 1. Partici-pants were free to navigate between pages, using the navigation bar or hyperlinks
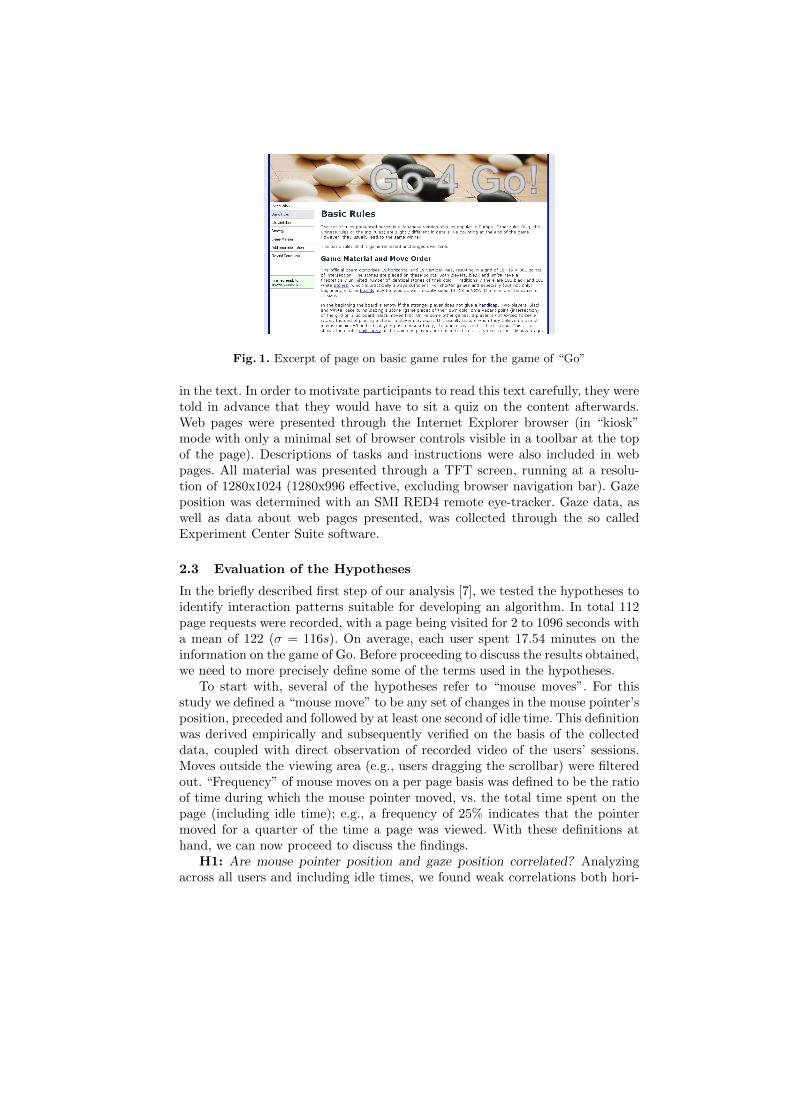
Fig. 1. Excerpt of page on basic game rules for the game of “Go”
in the text. In order to motivate participants to read this text carefully, they weretold in advance that they would have to sit a quiz on the content afterwards.Web pages were presented through the Internet Explorer browser (in “kiosk”mode with only a minimal set of browser controls visible in a toolbar at the topof the page). Descriptions of tasks and instructions were also included in webpages. All material was presented through a TFT screen, running at a resolu-tion of 1280x1024 (1280x996 effective, excluding browser navigation bar). Gazeposition was determined with an SMI RED4 remote eye-tracker. Gaze data, aswell as data about web pages presented, was collected through the so calledExperiment Center Suite software.
2.3 Evaluation of the Hypotheses
In the briefly described first step of our analysis [7], we tested the hypotheses toidentify interaction patterns suitable for developing an algorithm. In total 112page requests were recorded, with a page being visited for 2 to 1096 seconds witha mean of 122 (σ = 116s). On average, each user spent 17.54 minutes on theinformation on the game of Go. Before proceeding to discuss the results obtained,we need to more precisely define some of the terms used in the hypotheses.
To start with, several of the hypotheses refer to “mouse moves”. For thisstudy we defined a “mouse move” to be any set of changes in the mouse pointer’sposition, preceded and followed by at least one second of idle time. This definitionwas derived empirically and subsequently verified on the basis of the collecteddata, coupled with direct observation of recorded video of the users’ sessions.Moves outside the viewing area (e.g., users dragging the scrollbar) were filteredout. “Frequency” of mouse moves on a per page basis was defined to be the ratioof time during which the mouse pointer moved, vs. the total time spent on thepage (including idle time); e.g., a frequency of 25% indicates that the pointermoved for a quarter of the time a page was viewed. With these definitions athand, we can now proceed to discuss the findings.
H1: Are mouse pointer position and gaze position correlated? Analyzingacross all users and including idle times, we found weak correlations both hori-
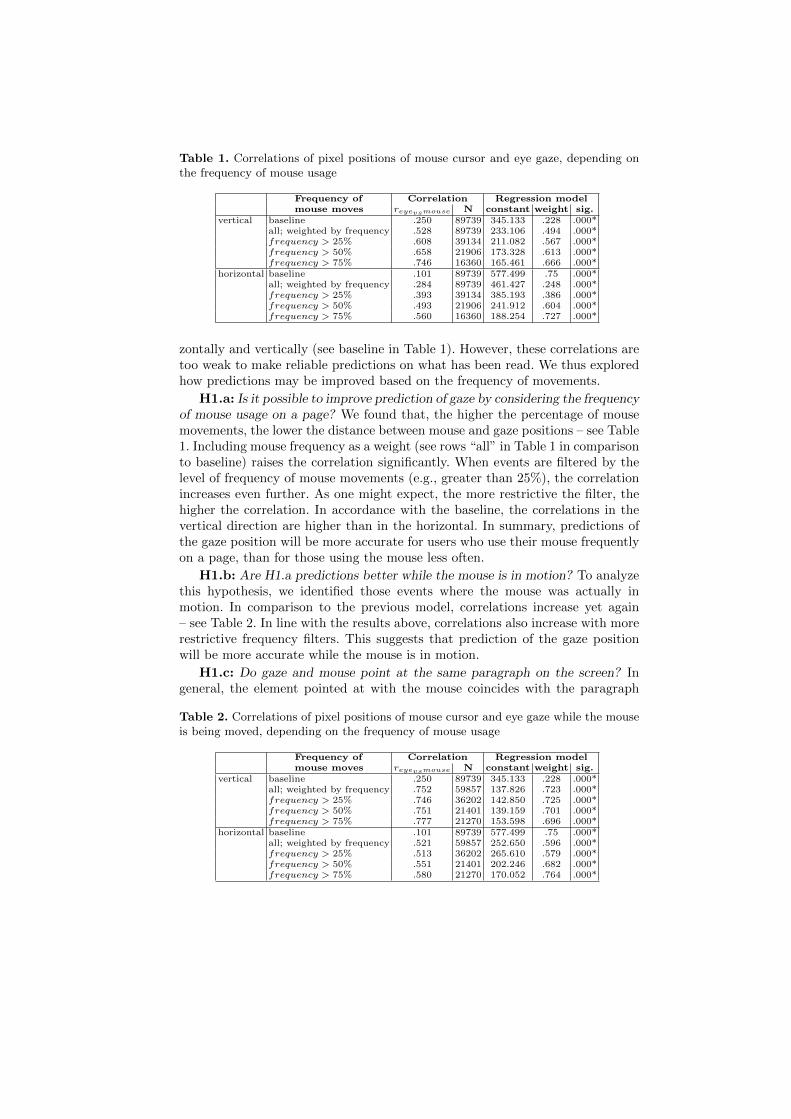
Table 1. Correlations of pixel positions of mouse cursor and eye gaze, depending onthe frequency of mouse usage
Frequency of Correlation Regression modelmouse moves reyevsmouse N constant weight sig.
vertical baseline .250 89739 345.133 .228 .000*all; weighted by frequency .528 89739 233.106 .494 .000*frequency > 25% .608 39134 211.082 .567 .000*frequency > 50% .658 21906 173.328 .613 .000*frequency > 75% .746 16360 165.461 .666 .000*
horizontal baseline .101 89739 577.499 .75 .000*all; weighted by frequency .284 89739 461.427 .248 .000*frequency > 25% .393 39134 385.193 .386 .000*frequency > 50% .493 21906 241.912 .604 .000*frequency > 75% .560 16360 188.254 .727 .000*
zontally and vertically (see baseline in Table 1). However, these correlations aretoo weak to make reliable predictions on what has been read. We thus exploredhow predictions may be improved based on the frequency of movements.
H1.a: Is it possible to improve prediction of gaze by considering the frequencyof mouse usage on a page? We found that, the higher the percentage of mousemovements, the lower the distance between mouse and gaze positions – see Table1. Including mouse frequency as a weight (see rows “all” in Table 1 in comparisonto baseline) raises the correlation significantly. When events are filtered by thelevel of frequency of mouse movements (e.g., greater than 25%), the correlationincreases even further. As one might expect, the more restrictive the filter, thehigher the correlation. In accordance with the baseline, the correlations in thevertical direction are higher than in the horizontal. In summary, predictions ofthe gaze position will be more accurate for users who use their mouse frequentlyon a page, than for those using the mouse less often.
H1.b: Are H1.a predictions better while the mouse is in motion? To analyzethis hypothesis, we identified those events where the mouse was actually inmotion. In comparison to the previous model, correlations increase yet again– see Table 2. In line with the results above, correlations also increase with morerestrictive frequency filters. This suggests that prediction of the gaze positionwill be more accurate while the mouse is in motion.
H1.c: Do gaze and mouse point at the same paragraph on the screen? Ingeneral, the element pointed at with the mouse coincides with the paragraph
Table 2. Correlations of pixel positions of mouse cursor and eye gaze while the mouseis being moved, depending on the frequency of mouse usage
Frequency of Correlation Regression modelmouse moves reyevsmouse N constant weight sig.
vertical baseline .250 89739 345.133 .228 .000*all; weighted by frequency .752 59857 137.826 .723 .000*frequency > 25% .746 36202 142.850 .725 .000*frequency > 50% .751 21401 139.159 .701 .000*frequency > 75% .777 21270 153.598 .696 .000*
horizontal baseline .101 89739 577.499 .75 .000*all; weighted by frequency .521 59857 252.650 .596 .000*frequency > 25% .513 36202 265.610 .579 .000*frequency > 50% .551 21401 202.246 .682 .000*frequency > 75% .580 21270 170.052 .764 .000*

Table 3. Frequency of element hovered by mouse matches element currently beinglooked at based on frequency of mouse moves – overall and while mouse being moved
Frequency overall filter: while mouse movedlevel of Frequency: Standard
NFrequency: Standard
Nmouse moves match Deviation match Deviation
0%-25% 21,00% .404 24331 59,00% .493 1255525%-50% 51,00% .500 9461 60,00% .490 851250%-75% 70,00% .458 3478 82,00% .387 331475%-100% 72,00% .451 13921 72,00% .449 13844
Total 26,00% .441 51191 65,00% .477 38225
looked at in 26% of the cases. When limiting the analysis to cases where peopleuse the mouse a lot, this rises up to 72% (see Table 3). Again, more restrictivefrequency filters increase the likelihood that the paragraphs are the same.
H1.d: Are H1.c predictions better while the mouse is in motion? In linewith H1.b results, predicting which paragraph has been looked at is easier whenthe mouse is in motion. In particular, for users that do not use the mouse alot (frequency level 0%− 25%), prediction increases strongly (compare columns“overall” and “filter: while mouse moved” in Table 3).
H1.e: If vertical predictions are better, should we select vertical moves ratherthan just frequent moves in any direction? While in all cases the predictions werebetter than the baseline and followed the same trends as the previous results(e.g., in motion better than not in motion), frequency of vertical movements didnot improve prediction over the levels observed for general frequency of mousemovements (e.g., r = .397 for vertical moves vs. r = .528 for general moves).
H2.a-c: When the mouse is actively used, users are likely to look at the regionthe mouse is positioned. The mean distance of mouse and eye position reducesto less than 50% when users are clicking, selecting text, or when the mouse ismoving (see Tables 4 and 5). Again, the horizontal correlation is lower than thevertical. This is in particular true for text selection activities, where users seemto read left to right, but keep the mouse at one end of the selected text. However,this improvement of prediction comes at the expense of very limited coverage. Inshort, when mouse actions occur, predictions will be good, but clicks, selectionsand movements occur only for a fraction of the total observation time.
H3, H4, H5: While we could not establish statistically significant supportfor these hypotheses, this may partly be due to the type of task we set. Forinstance, we observed only a limited number of scrolling-up events (H4) andvery few instances of small increment scrolling (H5). The analysis for relativeareas on the screen (e.g., top, middle, bottom) seems to be invalidated by the fact
Table 4. Mean distances in pixels between mouse cursor and eye gaze for selectedtypes of interactions
N mean distance Std. Error F Sigclick no 86838 383.9 .746 796.5 .000*
yes 2901 163.4 7.77select no 89706 382.0 .746 26.31 .000*
yes 33 136.3 47.8in move no 29882 404.7 .768 7063.5 .000*
yes 59857 222.1 2.033

Table 5. Regression models for user interactions
event Correlation Regression modelfilter reyevsmouse N constant weight sig.
vertical baseline .250 89739 345.133 .228 .000*click .873 2901 83.245 .820 .000*select .986 33 64.388 .826 .000*in move .672 59857 161.966 .659 .000*
horizontal baseline .101 89739 577.499 .075 .000*click .808 2901 98.057 .774 .000*select .494 33 334.191 .579 .004*in move .436 59857 330.684 .435 .000*
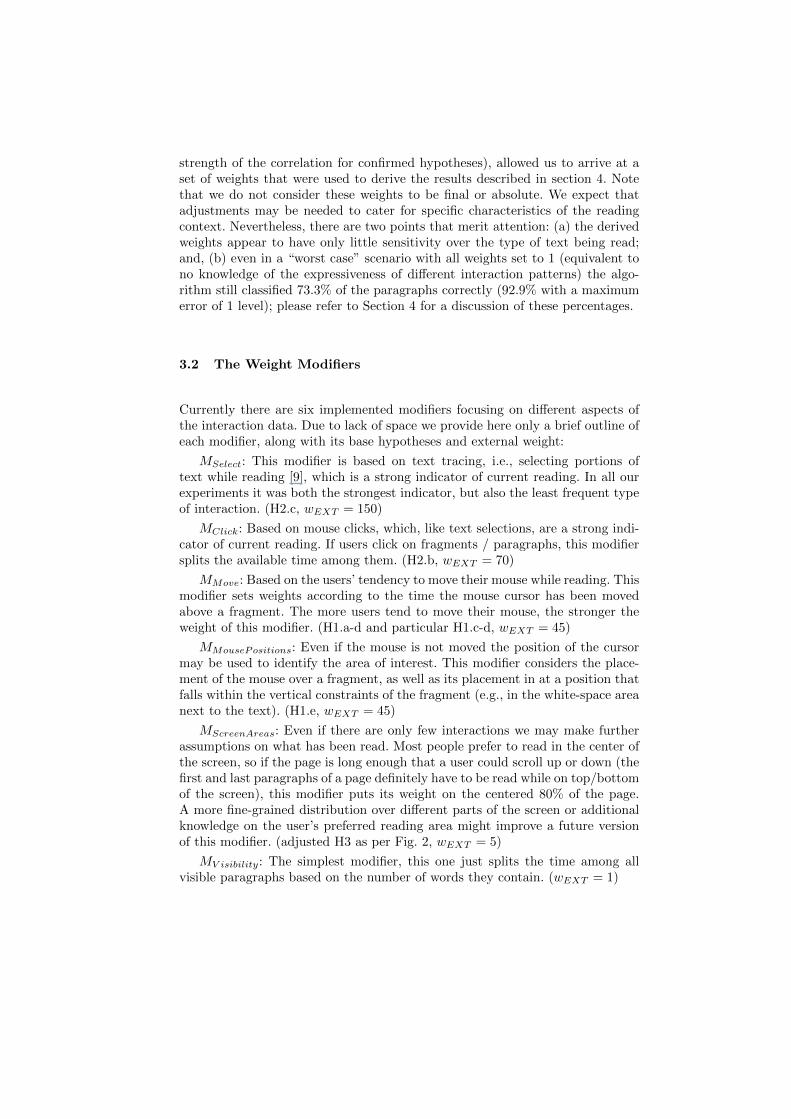
that almost everybody gazed at the middle part of the screen for the majorityof time (H3) (see Fig. 2); this finding (i.e. users tend to scroll down just for afew lines while they are reading to keep the currently read item at the centerof the screen), however, is in itself also quite useful in establishing a predictionalgorithm as we see later.
3 From Hypotheses to Algorithm
3.1 General Structure of the Algorithm
Based on the findings outlined in the previous section, an algorithm was de-veloped to calculate the extent to which paragraphs (or more generally: textfragments) of a page have been read. The main premise of the algorithm is the“splitting” of the time spent reading between the items visible at that time.Therefore each page view is split into “scroll windows”, i.e. the time windowwhere the visible items and their relative position on the screen remain constant(identified as the time spans between load, scroll or resize events).
For each such scroll window, the algorithm first calculates the “estimatedtime spent reading” (TE). This is based on the measured “available” duration ofthe scroll window (TA), but also takes into consideration interaction data thatmay provide additional information. For instance, if users usually exhibit con-siderable mouse activity, and then suddenly stop interacting, it is possible that
Fig. 2. Histogram of vertical eye position within the screen
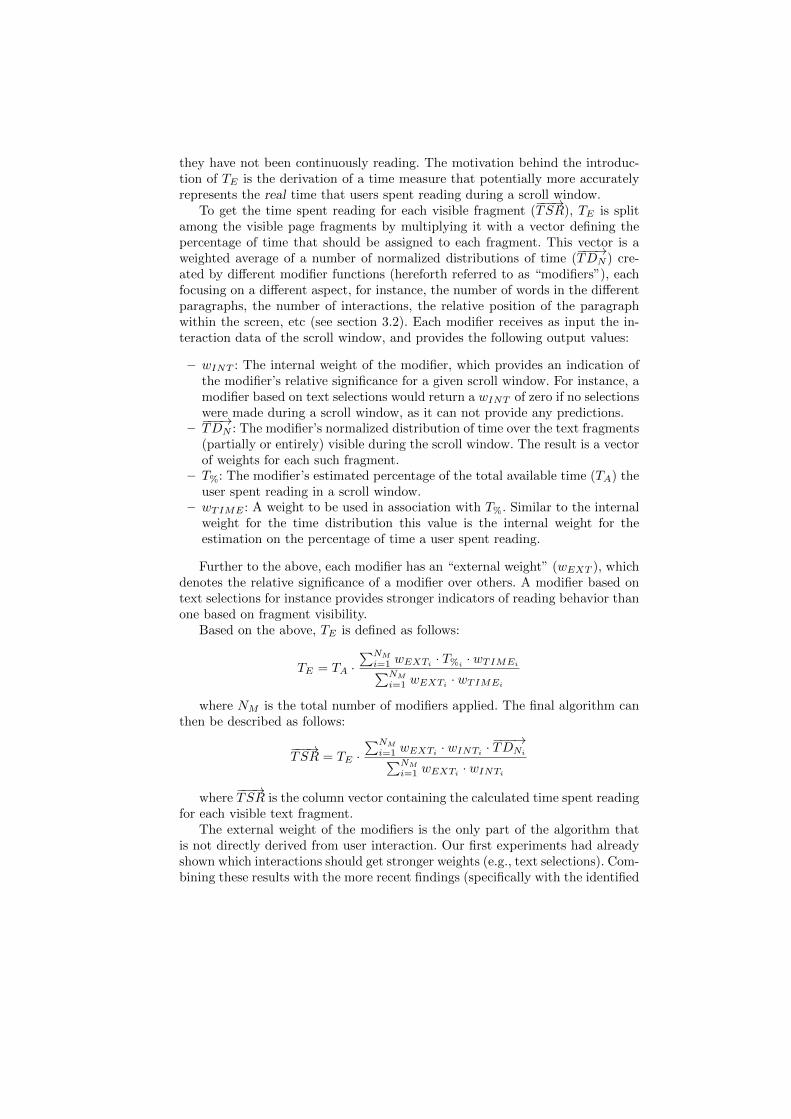
they have not been continuously reading. The motivation behind the introduc-tion of TE is the derivation of a time measure that potentially more accuratelyrepresents the real time that users spent reading during a scroll window.
To get the time spent reading for each visible fragment (−−−→TSR), TE is split
among the visible page fragments by multiplying it with a vector defining thepercentage of time that should be assigned to each fragment. This vector is aweighted average of a number of normalized distributions of time (
−−−→TDN ) cre-
ated by different modifier functions (hereforth referred to as “modifiers”), eachfocusing on a different aspect, for instance, the number of words in the differentparagraphs, the number of interactions, the relative position of the paragraphwithin the screen, etc (see section 3.2). Each modifier receives as input the in-teraction data of the scroll window, and provides the following output values:
– wINT : The internal weight of the modifier, which provides an indication ofthe modifier’s relative significance for a given scroll window. For instance, amodifier based on text selections would return a wINT of zero if no selectionswere made during a scroll window, as it can not provide any predictions.
–−−−→TDN : The modifier’s normalized distribution of time over the text fragments(partially or entirely) visible during the scroll window. The result is a vectorof weights for each such fragment.
– T%: The modifier’s estimated percentage of the total available time (TA) theuser spent reading in a scroll window.
– wTIME : A weight to be used in association with T%. Similar to the internalweight for the time distribution this value is the internal weight for theestimation on the percentage of time a user spent reading.
Further to the above, each modifier has an “external weight” (wEXT ), whichdenotes the relative significance of a modifier over others. A modifier based ontext selections for instance provides stronger indicators of reading behavior thanone based on fragment visibility.
Based on the above, TE is defined as follows:
TE = TA ·∑NM
i=1 wEXTi· T%i
· wTIMEi∑NM
i=1 wEXTi· wTIMEi
where NM is the total number of modifiers applied. The final algorithm canthen be described as follows:
−−−→TSR = TE ·
∑NM
i=1 wEXTi· wINTi
· −−−→TDNi∑NM
i=1 wEXTi· wINTi
where−−−→TSR is the column vector containing the calculated time spent reading
for each visible text fragment.The external weight of the modifiers is the only part of the algorithm that
is not directly derived from user interaction. Our first experiments had alreadyshown which interactions should get stronger weights (e.g., text selections). Com-bining these results with the more recent findings (specifically with the identified
strength of the correlation for confirmed hypotheses), allowed us to arrive at aset of weights that were used to derive the results described in section 4. Notethat we do not consider these weights to be final or absolute. We expect thatadjustments may be needed to cater for specific characteristics of the readingcontext. Nevertheless, there are two points that merit attention: (a) the derivedweights appear to have only little sensitivity over the type of text being read;and, (b) even in a “worst case” scenario with all weights set to 1 (equivalent tono knowledge of the expressiveness of different interaction patterns) the algo-rithm still classified 73.3% of the paragraphs correctly (92.9% with a maximumerror of 1 level); please refer to Section 4 for a discussion of these percentages.
3.2 The Weight Modifiers
Currently there are six implemented modifiers focusing on different aspects ofthe interaction data. Due to lack of space we provide here only a brief outline ofeach modifier, along with its base hypotheses and external weight:
MSelect: This modifier is based on text tracing, i.e., selecting portions oftext while reading [9], which is a strong indicator of current reading. In all ourexperiments it was both the strongest indicator, but also the least frequent typeof interaction. (H2.c, wEXT = 150)
MClick: Based on mouse clicks, which, like text selections, are a strong indi-cator of current reading. If users click on fragments / paragraphs, this modifiersplits the available time among them. (H2.b, wEXT = 70)
MMove: Based on the users’ tendency to move their mouse while reading. Thismodifier sets weights according to the time the mouse cursor has been movedabove a fragment. The more users tend to move their mouse, the stronger theweight of this modifier. (H1.a-d and particular H1.c-d, wEXT = 45)
MMousePositions: Even if the mouse is not moved the position of the cursormay be used to identify the area of interest. This modifier considers the place-ment of the mouse over a fragment, as well as its placement in at a position thatfalls within the vertical constraints of the fragment (e.g., in the white-space areanext to the text). (H1.e, wEXT = 45)
MScreenAreas: Even if there are only few interactions we may make furtherassumptions on what has been read. Most people prefer to read in the center ofthe screen, so if the page is long enough that a user could scroll up or down (thefirst and last paragraphs of a page definitely have to be read while on top/bottomof the screen), this modifier puts its weight on the centered 80% of the page.A more fine-grained distribution over different parts of the screen or additionalknowledge on the user’s preferred reading area might improve a future versionof this modifier. (adjusted H3 as per Fig. 2, wEXT = 5)
MV isibility: The simplest modifier, this one just splits the time among allvisible paragraphs based on the number of words they contain. (wEXT = 1)
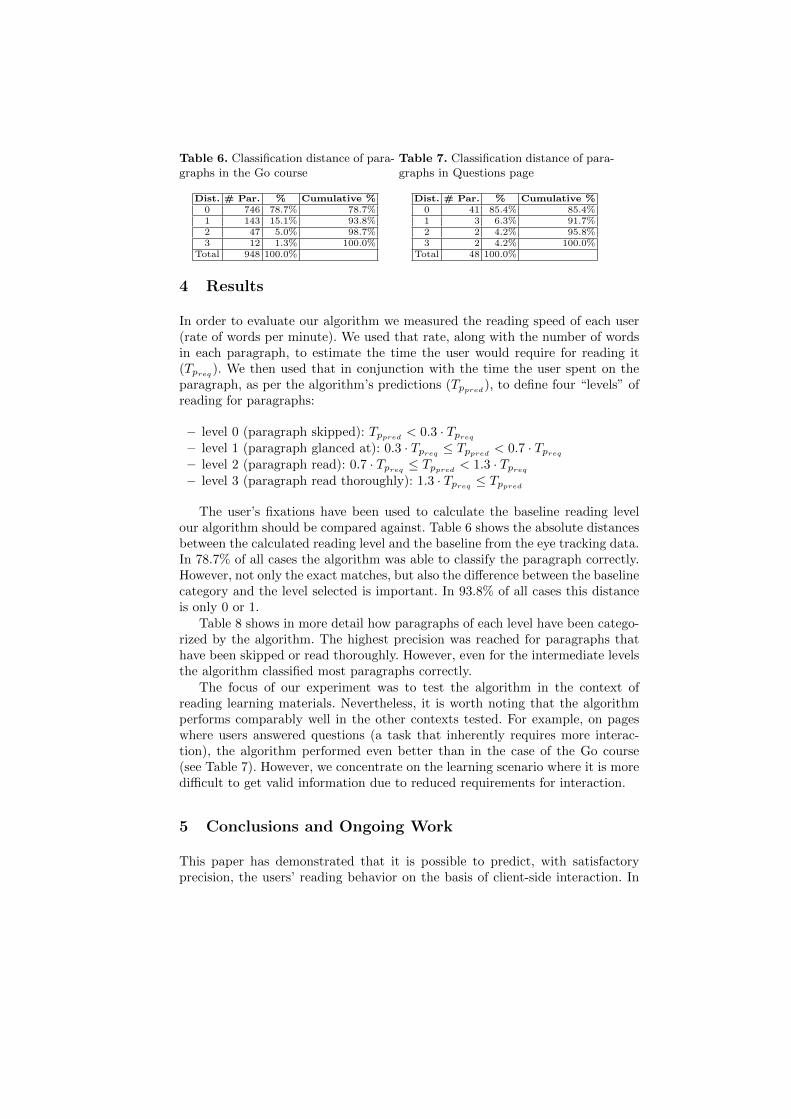
Table 6. Classification distance of para-graphs in the Go course
Dist. # Par. % Cumulative %0 746 78.7% 78.7%1 143 15.1% 93.8%2 47 5.0% 98.7%3 12 1.3% 100.0%
Total 948 100.0%
Table 7. Classification distance of para-graphs in Questions page
Dist. # Par. % Cumulative %0 41 85.4% 85.4%1 3 6.3% 91.7%2 2 4.2% 95.8%3 2 4.2% 100.0%
Total 48 100.0%
4 Results
In order to evaluate our algorithm we measured the reading speed of each user(rate of words per minute). We used that rate, along with the number of wordsin each paragraph, to estimate the time the user would require for reading it(Tpreq
). We then used that in conjunction with the time the user spent on theparagraph, as per the algorithm’s predictions (Tppred
), to define four “levels” ofreading for paragraphs:
– level 0 (paragraph skipped): Tppred< 0.3 · Tpreq
– level 1 (paragraph glanced at): 0.3 · Tpreq ≤ Tppred< 0.7 · Tpreq
– level 2 (paragraph read): 0.7 · Tpreq ≤ Tppred< 1.3 · Tpreq
– level 3 (paragraph read thoroughly): 1.3 · Tpreq≤ Tppred
The user’s fixations have been used to calculate the baseline reading levelour algorithm should be compared against. Table 6 shows the absolute distancesbetween the calculated reading level and the baseline from the eye tracking data.In 78.7% of all cases the algorithm was able to classify the paragraph correctly.However, not only the exact matches, but also the difference between the baselinecategory and the level selected is important. In 93.8% of all cases this distanceis only 0 or 1.
Table 8 shows in more detail how paragraphs of each level have been catego-rized by the algorithm. The highest precision was reached for paragraphs thathave been skipped or read thoroughly. However, even for the intermediate levelsthe algorithm classified most paragraphs correctly.
The focus of our experiment was to test the algorithm in the context ofreading learning materials. Nevertheless, it is worth noting that the algorithmperforms comparably well in the other contexts tested. For example, on pageswhere users answered questions (a task that inherently requires more interac-tion), the algorithm performed even better than in the case of the Go course(see Table 7). However, we concentrate on the learning scenario where it is moredifficult to get valid information due to reduced requirements for interaction.
5 Conclusions and Ongoing Work
This paper has demonstrated that it is possible to predict, with satisfactoryprecision, the users’ reading behavior on the basis of client-side interaction. In

Table 8. Classification of paragraphs split by the actual reading level (L0-3) – context:Go course
L0 # Par. % L1 # Par. % L2 # Par. % L3 # Par. %L0 596 89.1% L0 23 26.7% L0 7 8.0% L0 0 .0%L1 46 6.9% L1 34 39.5% L1 15 17.2% L1 14 13.2%L2 15 2.2% L2 18 20.9% L2 43 49.4% L2 19 17.9%L3 12 1.8% L3 11 12.8% L3 22 25.3% L3 73 68.9%
Total 669 100.0% Total 86 100.0% Total 87 100.0% Total 106 100.0%
our experiments, users visited all pages of provided hypertext material. A tra-ditional AHS might, thus, assume everything has been read. In contrast, usingthe proposed approach, we were able to determine that 70% of the paragraphswere not read, and users focused on certain paragraphs instead of reading entirepages. Our experiment has shown that the algorithm, using mouse and keyboardevents, can correctly identify a paragraph’s “reading level” in 78.7% of all cases(and in 93.8% of the cases calculate the correct level ±1).
The algorithm, in its current form, has weaknesses that need to be addressed.To start with, it is geared towards pages that contain one main column of text.While this may be typical for learning content, enhancements are required be-fore the algorithm can satisfactorily handle multi-column page content. A relatedquestion is how well the algorithm might perform in mobile settings, with dif-ferent screen factors (and, therefore, different amounts of text visible at a time)and potentially different interaction patterns (brought forth by the screen factor,or by alternative input techniques available). Another area that requires furtherwork is the establishment of the effects of external modifier weights in differentreading contexts (e.g., with less text visible at a time, the visible part of a pagemay be a stronger indicator on what is currently being read).
Among the strengths of this algorithm is its extensibility. For example, addi-tional input devices may be easily integrated through client-side “drivers” andthe introduction of corresponding modifiers (e.g. a webcam, eye tracking, etc.).The same is true for interaction patterns that may be established as evidencefor reading behavior in the future.
Further to the above, and specifically in the domain of learning, we intendto test the effects of having access to predictions of reading behavior on learnermodels and their use in adaptive educational hypermedia systems. Our nextexperiment will use the presented algorithm to make predictions on which ques-tions relating to course content a learner is likely to be able to answer, based onwhat that learner has (been predicted to have) read from that content.
Finally, as soon as the algorithm has matured and been shown to be ofgeneral applicability, we intend to make the implementation (along with theaccompanying JavaScript library for monitoring) publicly available.
Acknowledgments
The work reported in this paper is partially funded by the “Adaptive Supportfor Collaborative E-Learning” (ASCOLLA) project, supported by the AustrianScience Fund (FWF; project number P20260-N15).

References
1. Cha, H.J., Kim, Y.S., Park, S.H., Yoon, T.B., Jung, Y.M., Lee, J.H.: LearningStyles Diagnosis based on User Interface Behaviors for the Customization of Learn-ing Interfaces in an Intelligent Tutoring System. In: Intelligent Tutoring Systems.vol. 4053, pp. 513–524 (2006)
2. Chee, D.S.L., Khoo, C.S.: Users’ Mouse/Cursor Movements in Two Web-BasedLibrary Catalog Interfaces. In: Khalid, H., Helander, M., Yeo, A. (eds.) Work withComputing Systems, pp. 640–645. Damai Sciences, Kuala Lumpur (2004)
3. Chen, M.C., Anderson, J.R., Sohn, M.H.: What can a mouse cursor tell us more?:correlation of eye/mouse movements on web browsing. In: CHI ’01: CHI ’01 ext.abstracts on Human factors in computing systems, pp. 281–282. ACM (2001)
4. Claypool, M., Le, P., Wased, M., Brown, D.: Implicit interest indicators. In: Intel-ligent User Interfaces. pp. 33–40 (2001)
5. Goecks, J., Shavlik, J.W.: Learning Users’ Interests by Unobtrusively ObservingTheir Normal Behavior. In: Int. Conference on Intelligent User Interfaces - Proc.of the 5th Int. Conference on Intelligent User Interfaces. pp. 129–132 (2000)
6. Hauger, D.: Using Asynchronous Client-Side User Monitoring to Enhance UserModeling in Adaptive E-Learning Systems. In: UMAP 09: Adaptation and Per-sonalization for Web 2.0. Trento, Italy (2009)
7. Hauger, D., Paramythis, A., Weibelzahl, S.: Your Browser is Watching You: Dy-namically Deducing User Gaze from Interaction Data. In: UMAP 2010 - AdjunctProceedings of the 18th International Conference on User Modeling, Adaptation,and Personalization. pp. 10–12. Big Island of Hawaii, HI, USA (2010)
8. Hauger, D., Van Velsen, L.: Analyzing Client-Side Interactions to Determine Read-ing Behavior. In: ABIS 09 - Adaptivity and User Modeling in Interactive Systems.pp. 11–16. Darmstadt, Germany (2009)
9. Hijikata, Y.: Implicit user profiling for on demand relevance feedback. In: IUI ’04:Proceedings of the 9th international conference on Intelligent user interfaces. pp.198–205. ACM, New York, NY, USA (2004)
10. Hofmann, K., Reed, C., Holz, H.: Unobtrusive Data Collection for Web-BasedSocial Navigation. In: Workshop on the Social Navigation and Community basedAdaptation Technologies (2006)
11. Liu, C.C., Chung, C.W.: Detecting Mouse Movement with Repeated Visit Patternsfor Retrieving Noticed Knowledge Components on Web Pages. IEICE - Transac-tions on Information and Systems E90-D, 1687–1696 (October 2007)
12. Mueller, F., Lockerd, A.: Cheese: tracking mouse movement activity on websites, atool for user modeling. In: CHI ’01: CHI ’01 extended abstracts on Human factorsin computing systems, pp. 279–280. ACM, New York, NY, USA (2001)
13. Rodden, K., Fu, X., Aula, A., Spiro, I.: Eye-mouse coordination patterns on websearch results pages. In: CHI ’08: CHI ’08 extended abstracts on Human factors incomputing systems. pp. 2997–3002. ACM, New York, NY, USA (2008)
14. Spada, D., Sanchez-Montanes, M.A., Paredes, P., Carro, R.M.: Towards InferringSequential-Global Dimension of Learning Styles from Mouse Movement Patterns.In: AH. pp. 337–340 (2008)
15. Stephanidis, C., Paramythis, A., Karagiannidis, C., Savidis, A.: Supporting Inter-face Adaptation: The AVANTI Web-Browser. In: Stephanidis, C., Carbonell, N.(eds.) Proc. of the 3rd ERCIM Workshop “User Interfaces for All” (1997)
16. Ullrich, C., Melis, E.: The Poor Man’s Eyetracker Tool of ActiveMath. In: Proceed-ings of the World Conference on E-Learning in Corporate, Government, Healthcare,and Higher Education (eLearn-2002). vol. 4, pp. 2313–2316. Canada (2002)
Related Documents