Using Average True Range (ATR) with Point and Figure Charting www.bluechipoptions.com Chip Evans, Ph.D.

Welcome message from author
This document is posted to help you gain knowledge. Please leave a comment to let me know what you think about it! Share it to your friends and learn new things together.
Transcript
Using Average True Range (ATR) with Point and Figure Charting
www.bluechipoptions.com
Chip Evans, Ph.D.
Using Average True Range (ATR) with Point and Figure Charting
1
J. Welles Wilder Jr. is an American mechanical engineer, best known for his work in technical analysis. Wilder is the father of several technical indicators that are now considered to be core indicators in technical analysis software. These include Average True Range, the Relative Strength Index (RSI), Average Directional Index, and the Parabolic SAR. He is the author of the 1978 book New Concepts in Technical Trading Systems. Richard Demille Wyckoff (November 2, 1873 – March 19, 1934) was a stock market authority, founder and onetime editor of the Magazine of Wall Street (founding it in 1907), and editor of Stock Market Technique. He was one of the greatest stock traders of all time. http://en.wikipedia.org/wiki/Richard_Wyckoff I was brought up in Chicago in the early 1950’s. My Father, Robert G. Evans, was the sole licensee of Mr. Wyckoff’s principles and taught trading the stock market using the Wyckoff methodology through one of the first educational stock trading services. I began trading with Dad when I was eight (8) years old, making Point and Figure charts manually, 50 a day, for him. Point and Figure charting is not well known in today’s world, but a hugely valuable “no noise” charting system invented by Charles Dow in the 1890’s. http://www.ask.com/wiki/Point_and_figure_chart?lang=en As a lifelong trader (64 at this writing) I’ve used core principles from Wilder and Wyckoff as part of my trading and teaching, having a 7 time top ten award winning Stock System methodology that has been a Reader’s Choice award as in the top ten by the prestigious Stocks and Commodities Magazine for my service www.bluechipoptions.com But I am not selling a service, or promoting my business; instead, I hope to share more of what I’ve learned in 56 years of stock trading. I’ve written two books on the market: The Manual for S&P 100 Index Option Investing Mathematical and Psychological Trading Techniques for Reading Stock Market Momentum Projecting the Dow Using Fibonacci, Cycles and Historical Data to Effectively use the DJIA to Trade Stocks and Options

Using Average True Range (ATR) with Point and Figure Charting
2
This is the start to a new book, and a development on my studies of Wilder’s Average True Range, or A.T.R. I use ATR along with support/resistance and pivot points in a simple cross referencing of my calculations, and as another method in which to define stop loss and buy points. ATR, in conjunction with Fibonacci key numbers, and the use of Point and Figure charting can clearly show buy/sell, and eliminate the emotions of the market, fear and greed. Everything I do bases around Open/High/Low/Close for the stock or index for the day and then the average for a period of days. The simplicity of the market is its greatest disguise.©
The definition of a “true range”: The True Range indicator is the greatest of the following: - the current high less then the current low. -the absolute value of the current high less the previous close. -the absolute value of the current low less the previous close. The Average True Range is a moving average (generally 5 to 20 days, 14 day average) of the True Ranges. Once you have calculated the Average True Range (ATR) for a cash derivative option, such as the OEX (S&P100) or any stock, using the prior day close, there are several important studies you can do. We’ll use the OEX as our first example: First, add the ATR to the OEX low of the first hour. This projects the potential high of the day. Subtract the ATR from the OEX high of the first hour- this projects the potential low of the day. Use the high/low of prior day if unable to analyze first hour of the trading day. This simple technique allows you to know the potential HIGH or LOW of the OEX index that day, what should calculate to the absolute TOP or BOTTOM. By knowing this one can calculate just how high to take profits, or how low to exit.

Using Average True Range (ATR) with Point and Figure Charting
3
Here's an example. The ATR for September 1st, 2006 was 4.35. The OEX low of the first hour was 602.00. 602.00 plus 4.35 equals 606.35. This means the potential high of the market that day might be 606.35. Traders could then plan, if this were occurring, to know when to sell, or to buy, using the Average True Range. Secondly, a number of traders use ATR as a method of stop loss. Take the ATR times a % of 1, 1.5, 2.0, 2.5, or 3.0. This number you now subtract from the OEX high of the day you buy the option. The new OEX number is your stop loss. With ATR analysis you choose the risk level you are willing to take. With a multiplier of one, for example, you are saying that if the OEX moves down equal to the ATR, you’ll sell. It’s a “close” stop loss. At 1.5 times the ATR the stop loss is “deeper,” all the way to 3.0 times the ATR in which case the stop loss is more extreme. With this type of methodology you are choosing to subtract the ATR from the OEX high of the day you bought, and agreeing with yourself to sell the option, no matter what, if it hits that OEX number. At times we will specifically recommend an ATR multiplier stop loss in our alerts. Recently we have studied the entire 2005 year using a January 3rd, 2005 ATR - 4.00 (Closing Price of OEX Jan 3rd 590.00 ATR times 3 equals 12.00 (12.00) New OEX Price/Stop Loss 578 Sell the option if the OEX hits 578) multiplier on the ATR, averaged for the year at 4.01, and have found that an ATR of 5.53 deducted from, or added to, the option you are defining for stop loss (put=deduct 5.53, call=add 5.53) provides very conservative safety valve stop losses that are pre-defined. In 2005, we found with an ATR of 5.53 that the option will be stopped almost always during the ten-day period, typically in the first three days. 1/3 of the options recover, however, with rebound over the ten- day period. You may thusly want to begin the stop loss on the fourth day, also allowing the position to “trend out” after the purchase. Conservative, low risk traders should want to consider an ATR of 5.53, again using the HIGH of the OEX on the day they buy the option, or, using a multiplier to the actual ATR of that day that is fitting with Risk Management objectives. Remember, using a “tight stop loss” will protect your capital, but you will also lose money…and options do rebound. Refine this to your risk management goals.
Using Average True Range (ATR) with Point and Figure Charting
4
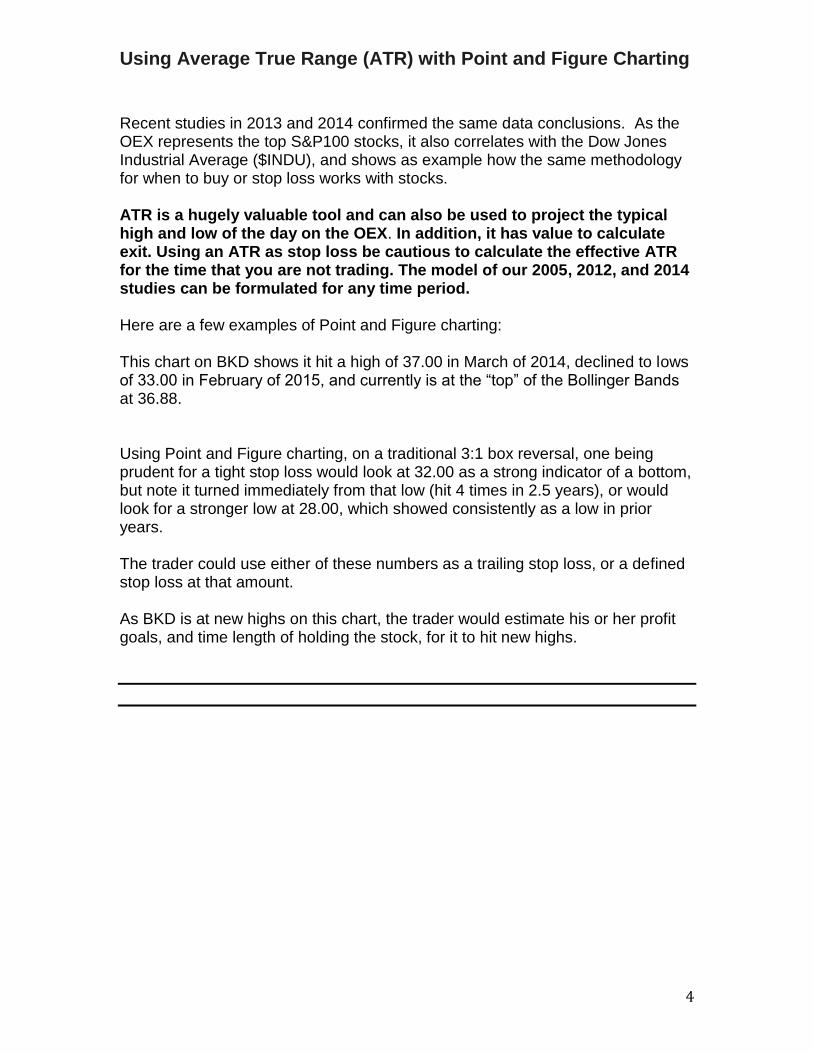
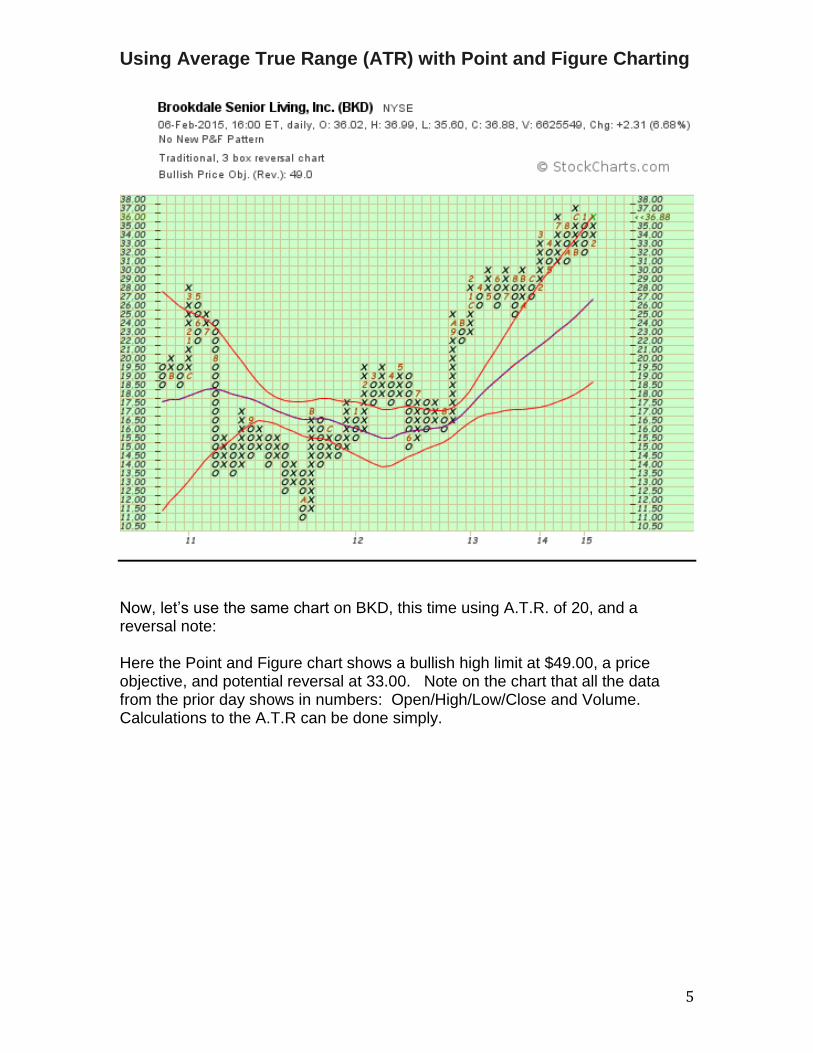
Recent studies in 2013 and 2014 confirmed the same data conclusions. As the OEX represents the top S&P100 stocks, it also correlates with the Dow Jones Industrial Average ($INDU), and shows as example how the same methodology for when to buy or stop loss works with stocks. ATR is a hugely valuable tool and can also be used to project the typical high and low of the day on the OEX. In addition, it has value to calculate exit. Using an ATR as stop loss be cautious to calculate the effective ATR for the time that you are not trading. The model of our 2005, 2012, and 2014 studies can be formulated for any time period. Here are a few examples of Point and Figure charting: This chart on BKD shows it hit a high of 37.00 in March of 2014, declined to lows of 33.00 in February of 2015, and currently is at the “top” of the Bollinger Bands at 36.88. Using Point and Figure charting, on a traditional 3:1 box reversal, one being prudent for a tight stop loss would look at 32.00 as a strong indicator of a bottom, but note it turned immediately from that low (hit 4 times in 2.5 years), or would look for a stronger low at 28.00, which showed consistently as a low in prior years. The trader could use either of these numbers as a trailing stop loss, or a defined stop loss at that amount. As BKD is at new highs on this chart, the trader would estimate his or her profit goals, and time length of holding the stock, for it to hit new highs.
Using Average True Range (ATR) with Point and Figure Charting
5
Now, let’s use the same chart on BKD, this time using A.T.R. of 20, and a reversal note: Here the Point and Figure chart shows a bullish high limit at $49.00, a price objective, and potential reversal at 33.00. Note on the chart that all the data from the prior day shows in numbers: Open/High/Low/Close and Volume. Calculations to the A.T.R can be done simply.
Using Average True Range (ATR) with Point and Figure Charting
6
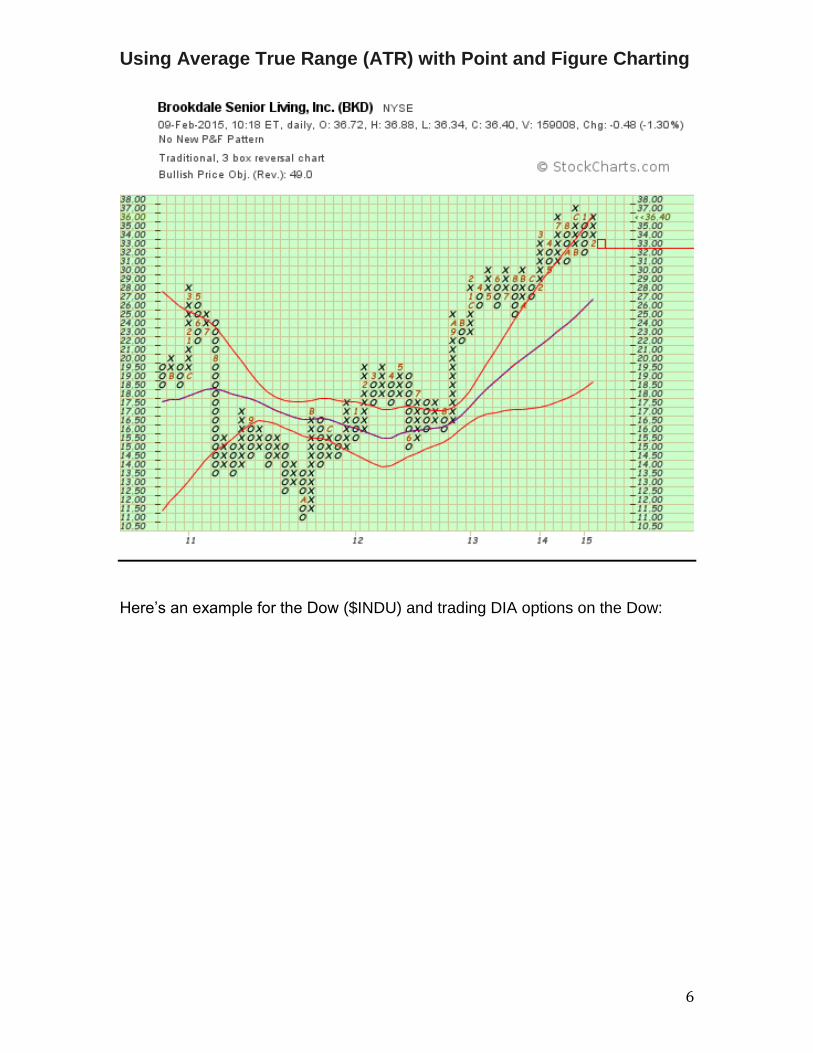
Here’s an example for the Dow ($INDU) and trading DIA options on the Dow:
Using Average True Range (ATR) with Point and Figure Charting
7
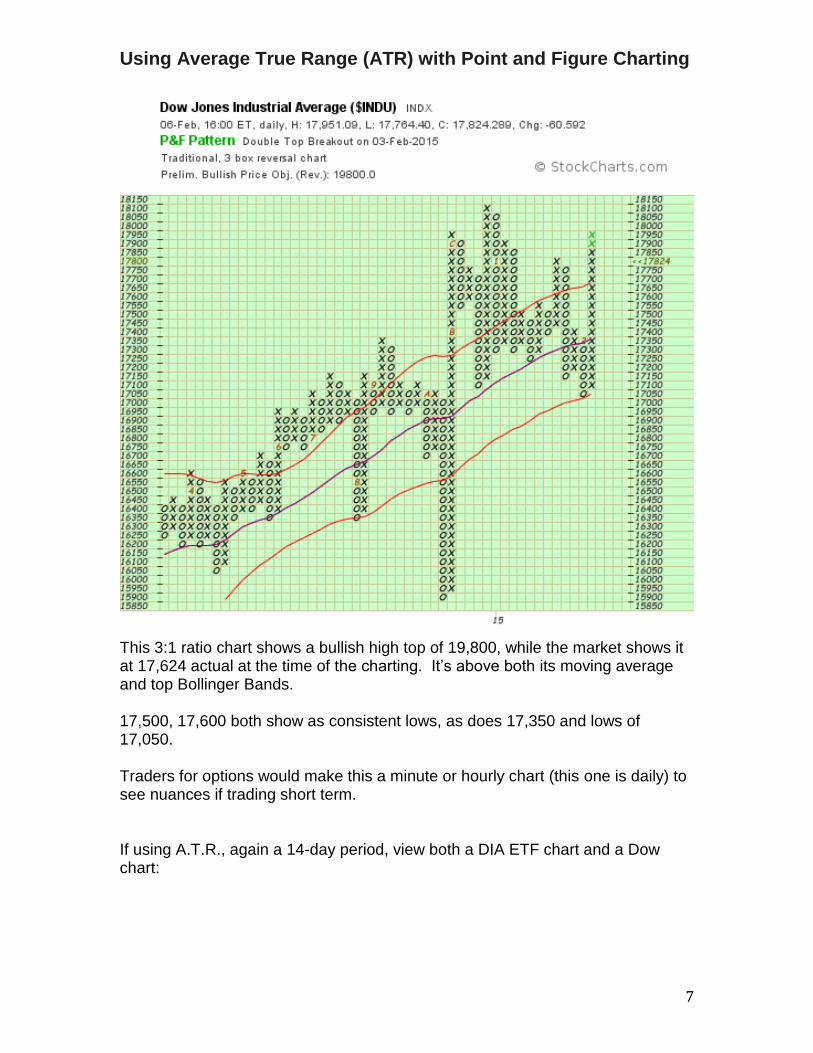
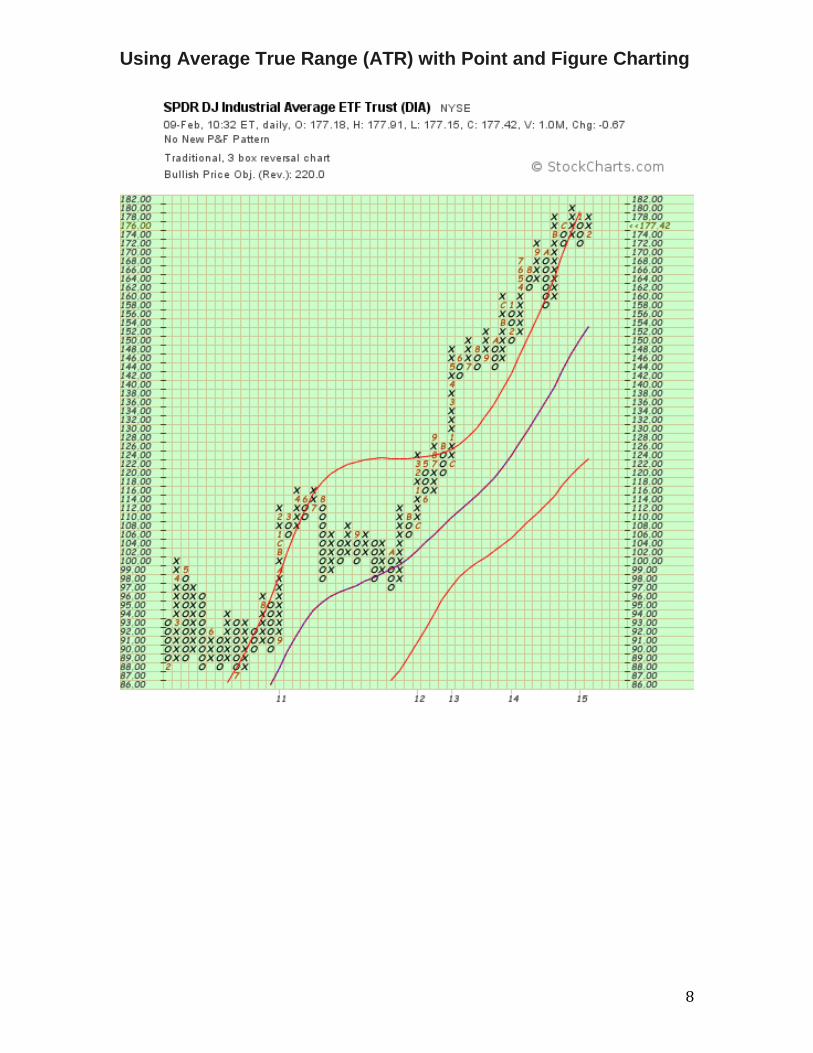
This 3:1 ratio chart shows a bullish high top of 19,800, while the market shows it at 17,624 actual at the time of the charting. It’s above both its moving average and top Bollinger Bands. 17,500, 17,600 both show as consistent lows, as does 17,350 and lows of 17,050. Traders for options would make this a minute or hourly chart (this one is daily) to see nuances if trading short term. If using A.T.R., again a 14-day period, view both a DIA ETF chart and a Dow chart:
Using Average True Range (ATR) with Point and Figure Charting
8

Using Average True Range (ATR) with Point and Figure Charting
9
In the February 2015 issue of Stocks and Commodities Magazine author Mr. Chris Lindgren writes an interesting and new point of view in an article titled: Kiss and Touch with the Modified True Range Note again that Wilder’s A.T.R. is defined as: A- the current high less then the current low. B-the absolute value of the current high less the previous close. C-the absolute value of the current low less the previous close. (The modified true range, per Mr. Lindgren’s article, does not use C in calculations.
Using Average True Range (ATR) with Point and Figure Charting
10
Chris Lindgren creates a theory called the modified true range, a “simple way to estimate touching a given price”. He attempts to not “overestimate”, which he believes occurs by keeping the high vs. low of the true range, and tries to develop probabilities of a certain price change over defined time periods. His calculation models are meant for option trading and those probabilities. He attempts to eliminate “gaps” by trading time frames, and makes the assumption if the high vs. the low were “the largest measurement”, and that thusly the “price change would appear greater than reality”. Mr. Lindgren uses the greatest of A and B of Wilder’s method and discards the use of C, or the absolute value of the current low less the previous close. Mr. Lindgren’s study on Modified True Range is unique and based on using chart settings to determine shorter time frames, and period lengths. To measure historical volatility of a stock or option Wilder teaches to use 20 days, or one month. This he then provides calculation models to use on charts for shorter time frames, to determine tighter measurements. He discards the methodology of current high less than the current low. In our work at www.bluechipoptions.com, on stock options, cash derivative options (SPX, OEX, DIA) and on stocks we vary the # of days in our charting for shorter term moves. Wilder suggests using five (5) to twenty (20) days, depending upon the stock, option, and type of trade. We use this approach very successfully with stocks and all types of options.
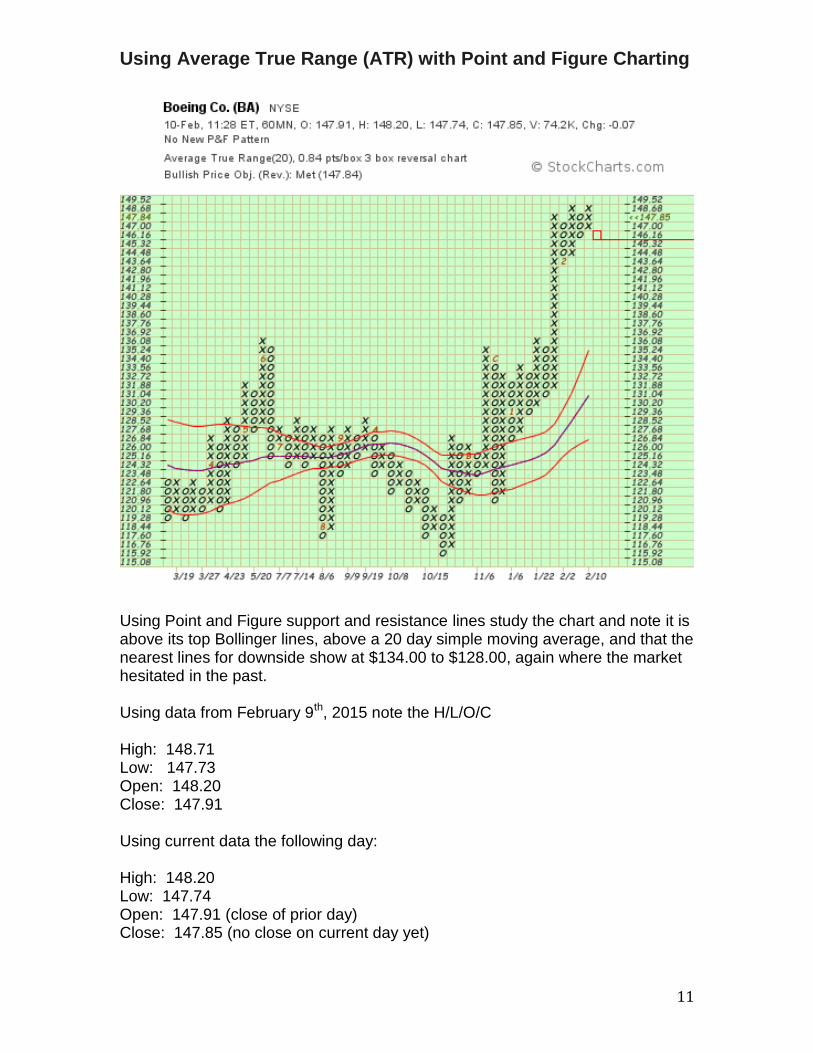
Boeing Corporation (BA) is an excellent study using Point and Figure Charting, and ATR. The following chart shows that BA hit a “double top breakout” on January 22nd, 2015, and show a reversal at 142.00. It is a 60-minute chart, 3:1 ratio, showing trading on February 10th, 2015
Using Average True Range (ATR) with Point and Figure Charting
11
Using Point and Figure support and resistance lines study the chart and note it is above its top Bollinger lines, above a 20 day simple moving average, and that the nearest lines for downside show at $134.00 to $128.00, again where the market hesitated in the past. Using data from February 9th, 2015 note the H/L/O/C High: 148.71 Low: 147.73 Open: 148.20 Close: 147.91 Using current data the following day: High: 148.20 Low: 147.74 Open: 147.91 (close of prior day) Close: 147.85 (no close on current day yet)
Using Average True Range (ATR) with Point and Figure Charting
12
Using core ATR calculations: - the current high less then the current low: 148.20-147.73 (this # low came at 11.24 a.m. February 10, 2015= .47 -the absolute value of the current high less the previous close: The current high on February 10, 2015 is 148.20 minus the prior close of 147.91= .29 -the absolute value of the current low less the previous close. The current low February 10th, 2015 is 147.74 minus the prior day close of 147.91= .17 Again, at www.bluechipoptions.com we use a 20-day period and a multiplier of 5.53. With this historical use of ATR, the next high is $153.73, and the next low is 142.21. We now, if trading options on BA, use multipliers listed above to define stop loss and market tops. The Point and Figure chart shown above shows a bullish percentage high of 147.84, showing the stock may be “topping”. 1
Average True Range is a leading, not lagging indicator, to www.bluechipoptions.com as although it combines current and prior data, it’s used to project option and stock price points for buys/sells and stop loss. Chip Evans, PH.D. is classically trained in the stock market by his father, www.bluechipoptions.com is an educational weekly option and stock signal service. We've proudly won seven years in a row (2008-2014) as one the top TEN Option Advisory Services in the U.S. by Stocks and Commodities Magazine.
1 Kiss and Touch with the Modified True Range by Chris Lindgren. Article published February 2015 in Stocks and Commodities Magazine. Calculation models to use this on thinkorswim.com (division of T.D. Ameritrade) are also included in this article.
Related Documents