Using ArcView 3.1 with AWIPS Ken Waters Scientific Services Division (SSD) Southern Region, National Weather Service (817) 978-2671 Iris A. Shockley AWIPS Program Office, Deployment Division Contributions by Dr. Scott Shipley Table of Contents 1. GIS Meteorology 2. ArcView Shapefiles 2.1 File Formats 2.2 Object Types 2.3 Available Shapefiles 3. Getting Started 3.1 Making a New Project 3.2 Adding Themes 3.3 Moving Around the View 3.4 Printing the View 3.4.1 Printing 3.4.2 Exporting 3.5 Saving Your Work 4. Modifying Shapefiles 4.1 Changing Theme Properties

Welcome message from author
This document is posted to help you gain knowledge. Please leave a comment to let me know what you think about it! Share it to your friends and learn new things together.
Transcript
Using ArcView 3.1with AWIPS
Ken WatersScientific Services Division (SSD)
Southern Region, National Weather Service(817) 978-2671Iris A. Shockley
AWIPS Program Office, Deployment DivisionContributions by Dr. Scott Shipley
Table of Contents1.GIS Meteorology 2.ArcView Shapefiles
2.1 File Formats2.2 Object Types2.3 Available Shapefiles
3.Getting Started
3.1 Making a New Project3.2 Adding Themes3.3 Moving Around the View3.4 Printing the View
3.4.1 Printing3.4.2 Exporting
3.5 Saving Your Work
4.Modifying Shapefiles
4.1 Changing Theme Properties
4.1.1 The Legend Editor4.1.2 Pallette Functions Overview
4.2 Changing the Map Projection4.3 Examining Table Attributes
4.3.1 Access theme attributes for a specific record of the active theme4.3.2 Access theme attributes for the attributes table of the active theme4.3.3 Querying Database Records
4.4 Creating a New Theme (Watch-Warning Box)4.4.1 To add Data to the new Theme
4.5 Editing a Theme's Features4.5.1 Line Editing4.5.2 Point Editing
4.6 Copying a Theme's Features4.7 Combining a Theme's Features4.8 Intersecting Polygons4.9 Merging Themes4.10 Splitting Line or Polygon Themes
4.10.1 Lines4.10.2 Polygons
4.11 Cropping Shapefiles4.11.1 Select by Theme4.11.2 Select Features Using Graphic
5.Handling Images 6.Moving Shapefiles to AWIPS 7.More Information 8.Acknowledgements
GIS MeteorologyWeather folks have a tradition of using any technology available to track, understand and forecast the weather. New software and hardware are exploited to the limits of performance, and
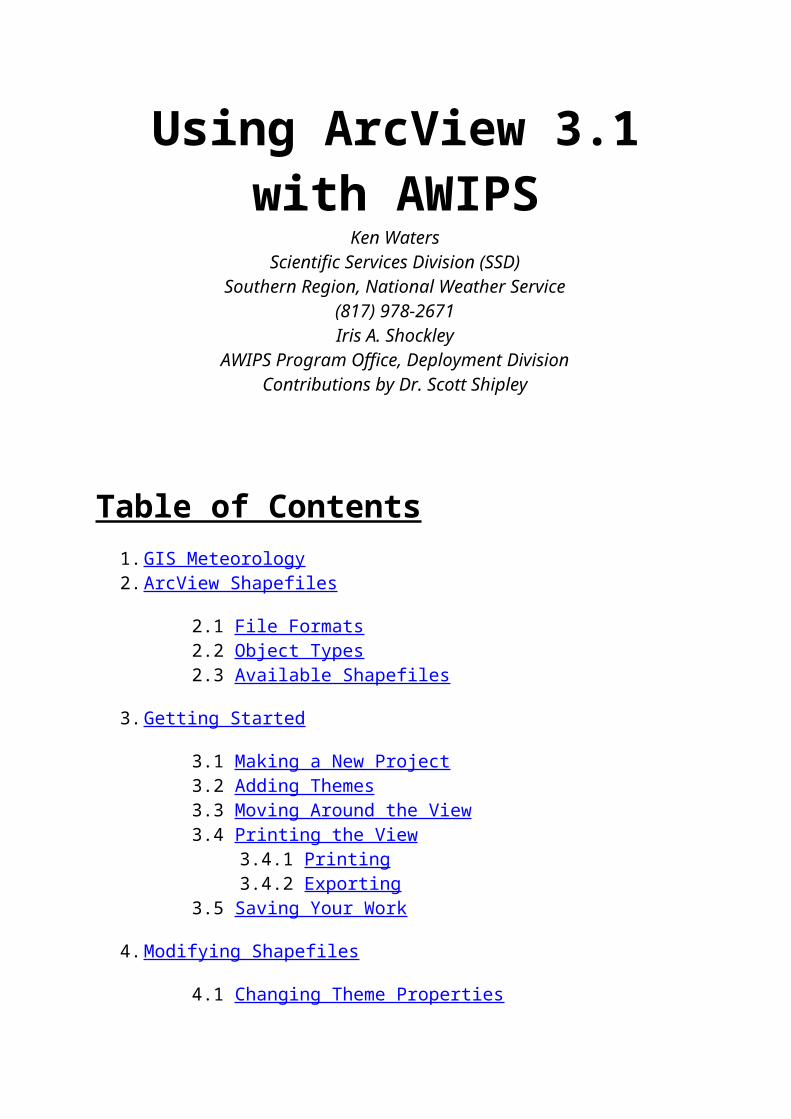
ETAModelgrid
converted topointshapefile,with
surface
temperatureattribute
contours.
Projectionis
Orthographictrue
at 0N,60W.
<="" td="">
the weather technologist can never be satisfied with the limitations which are inevitably encountered. Developers of weather technology have therefore found themselves on the "bleeding edge", and are accustomed with the need to invent tools which cannot be affordably purchased as Commercial-Off-The-Shelf (COTS)products. This situation has lead to a robust and self-reliant weather industry with active participation by industry, government, military, academia and the public(volunteers and hobbyists), resulting in a wide and varied array of meteorological software and hardware products, including shareware and freeware.
The "self reliance" of the weather community, however, has also lead to isolation from other disciplines. Thisisolation has fostered an environment in which decisions are made for the benefit of weather experts, generally without regard for other users of weather data who are not current participants or cognoscent. Thus, the World Meteorological Organization (WMO) has established "international standards" such as GRIB (Gridded Binary) for the compression and exchange of weather model gridfields, leading to specialized software and procedures which are well-known to weatherinsiders, but making access to these data more difficult for "weather outsiders". I would also like topoint out that WMO GRIB formats are not followed universally, and that more efficient methods for array compression are available (and more affordable from a Life Cycle point of view). Looking from the outside in,the weather business appears to be dominated by specialized codes and decoders (METAR, SHEF, SYNOP, et al.), discipline-centric jargon (Rossby waves, baroclinic instability, positive vorticity advection, et al.), and "Black Magic" (objective [sic.] analysis, areal forecast probability, sub-grid scale parameterization, et al.). Understanding all this requires a "Black Belt" in meteorology.
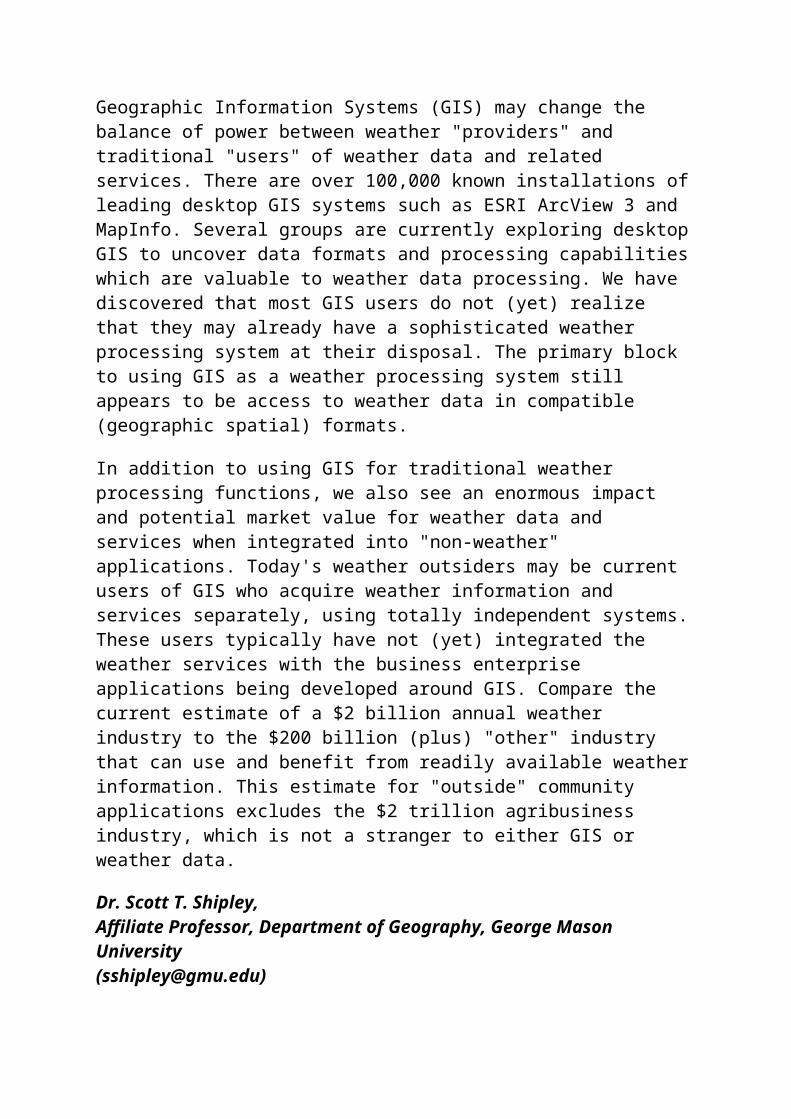
Geographic Information Systems (GIS) may change the balance of power between weather "providers" and traditional "users" of weather data and related services. There are over 100,000 known installations ofleading desktop GIS systems such as ESRI ArcView 3 and MapInfo. Several groups are currently exploring desktopGIS to uncover data formats and processing capabilitieswhich are valuable to weather data processing. We have discovered that most GIS users do not (yet) realize that they may already have a sophisticated weather processing system at their disposal. The primary block to using GIS as a weather processing system still appears to be access to weather data in compatible (geographic spatial) formats.
In addition to using GIS for traditional weather processing functions, we also see an enormous impact and potential market value for weather data and services when integrated into "non-weather" applications. Today's weather outsiders may be current users of GIS who acquire weather information and services separately, using totally independent systems.These users typically have not (yet) integrated the weather services with the business enterprise applications being developed around GIS. Compare the current estimate of a $2 billion annual weather industry to the $200 billion (plus) "other" industry that can use and benefit from readily available weatherinformation. This estimate for "outside" community applications excludes the $2 trillion agribusiness industry, which is not a stranger to either GIS or weather data.
Dr. Scott T. Shipley,Affiliate Professor, Department of Geography, George Mason University([email protected])
Return to the Table of Contents
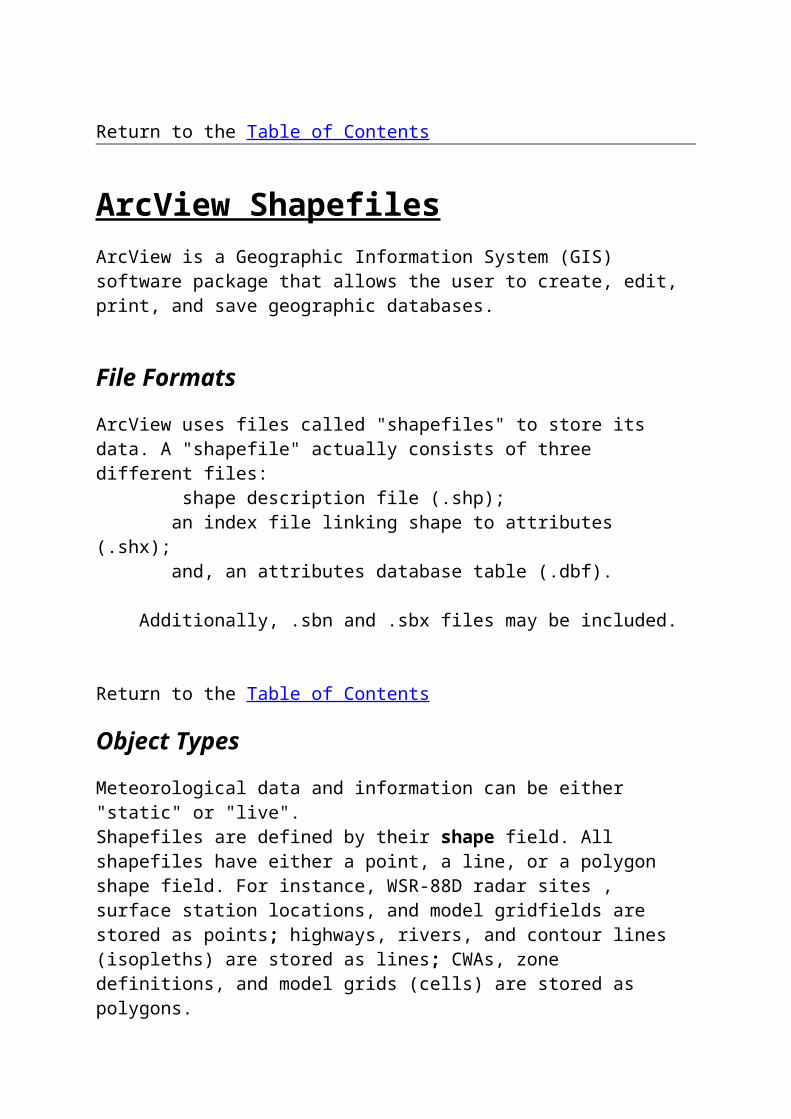
ArcView ShapefilesArcView is a Geographic Information System (GIS) software package that allows the user to create, edit, print, and save geographic databases.
File Formats
ArcView uses files called "shapefiles" to store its data. A "shapefile" actually consists of three different files: shape description file (.shp); an index file linking shape to attributes (.shx); and, an attributes database table (.dbf).
Additionally, .sbn and .sbx files may be included.
Return to the Table of Contents
Object Types
Meteorological data and information can be either "static" or "live".Shapefiles are defined by their shape field. All shapefiles have either a point, a line, or a polygon shape field. For instance, WSR-88D radar sites , surface station locations, and model gridfields are stored as points; highways, rivers, and contour lines (isopleths) are stored as lines; CWAs, zone definitions, and model grids (cells) are stored as polygons.
Return to the Table of Contents
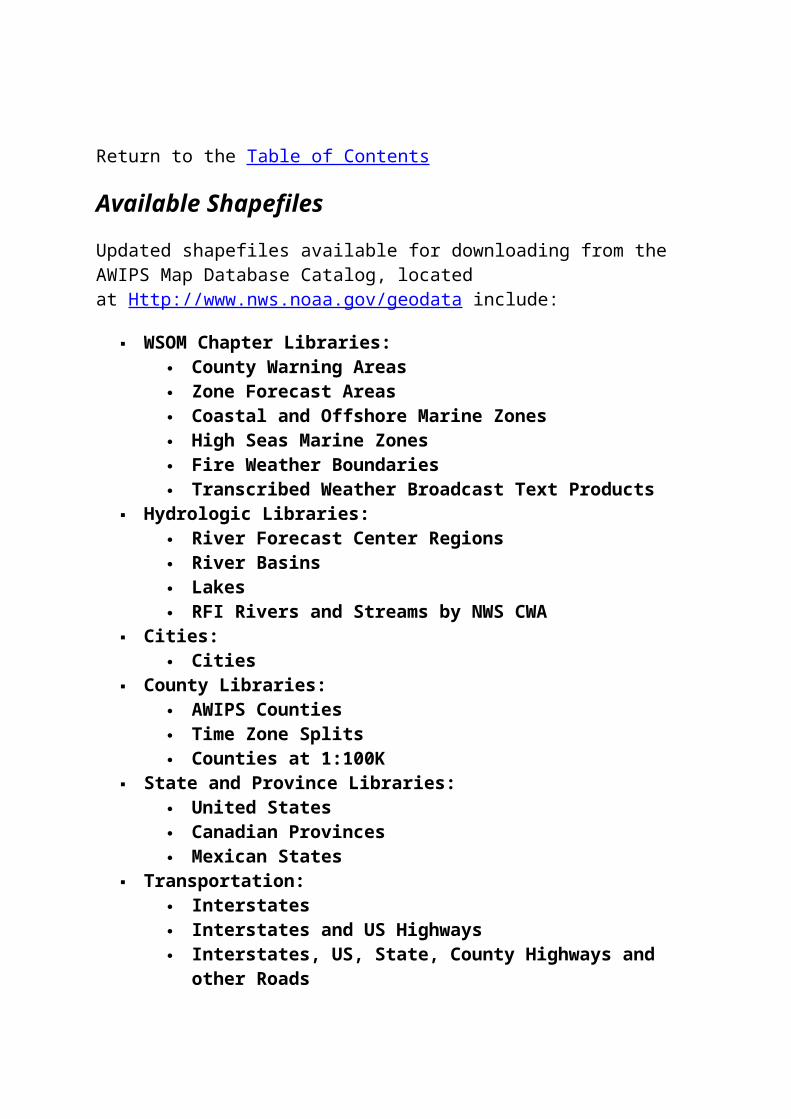
Available Shapefiles
Updated shapefiles available for downloading from the AWIPS Map Database Catalog, located at Http://www.nws.noaa.gov/geodata include:
WSOM Chapter Libraries: County Warning Areas Zone Forecast Areas Coastal and Offshore Marine Zones High Seas Marine Zones Fire Weather Boundaries Transcribed Weather Broadcast Text Products
Hydrologic Libraries: River Forecast Center Regions River Basins Lakes RFI Rivers and Streams by NWS CWA
Cities: Cities
County Libraries: AWIPS Counties Time Zone Splits Counties at 1:100K
State and Province Libraries: United States Canadian Provinces Mexican States
Transportation: Interstates Interstates and US Highways Interstates, US, State, County Highways and
other Roads
Interstates, US, State, County Highways and other Roads subsetted by NWS CWA
Terrain: CONUS Digital Terrain
Note: Shapefiles are now available from within the AWIPS firewall.Contact your Region's AWIPS Focal Point for the specific instructions.
Return to Adding Themes Return to the Table of Contents
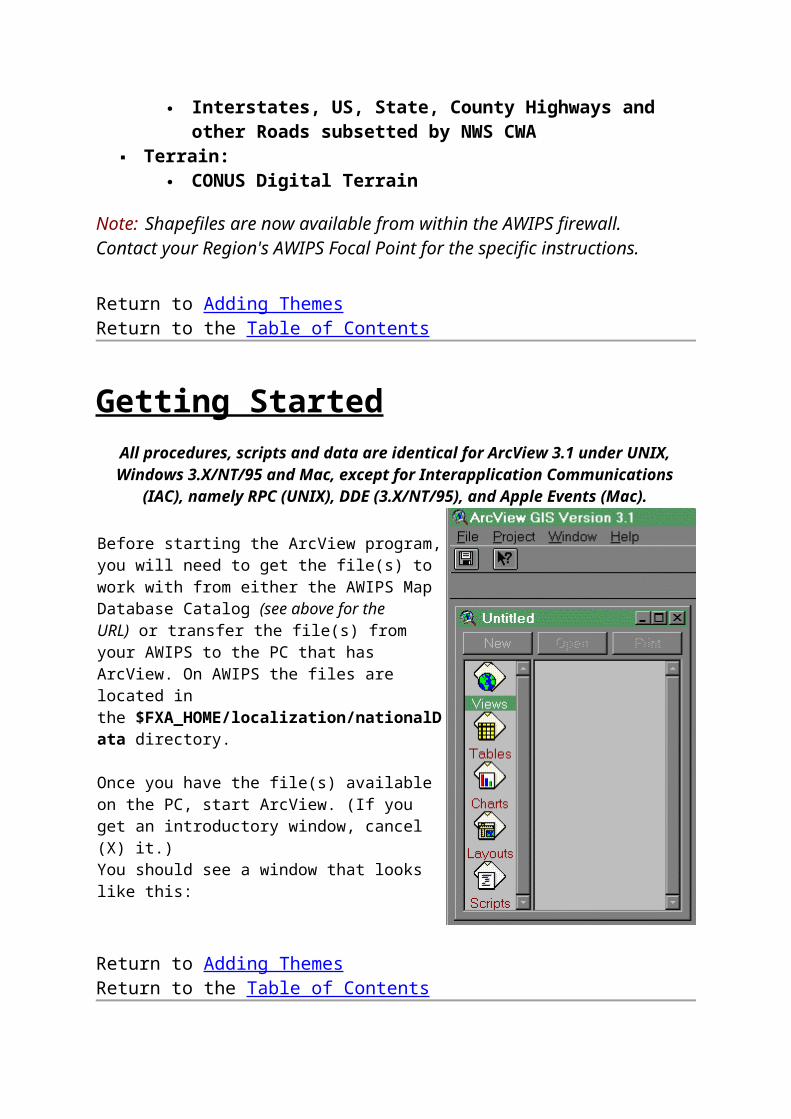
Getting StartedAll procedures, scripts and data are identical for ArcView 3.1 under UNIX,Windows 3.X/NT/95 and Mac, except for Interapplication Communications
(IAC), namely RPC (UNIX), DDE (3.X/NT/95), and Apple Events (Mac).
Before starting the ArcView program,you will need to get the file(s) to work with from either the AWIPS Map Database Catalog (see above for the URL) or transfer the file(s) from your AWIPS to the PC that has ArcView. On AWIPS the files are located in the $FXA_HOME/localization/nationalData directory.
Once you have the file(s) available on the PC, start ArcView. (If you get an introductory window, cancel (X) it.)You should see a window that looks like this:
Return to Adding Themes Return to the Table of Contents
Making a New Project
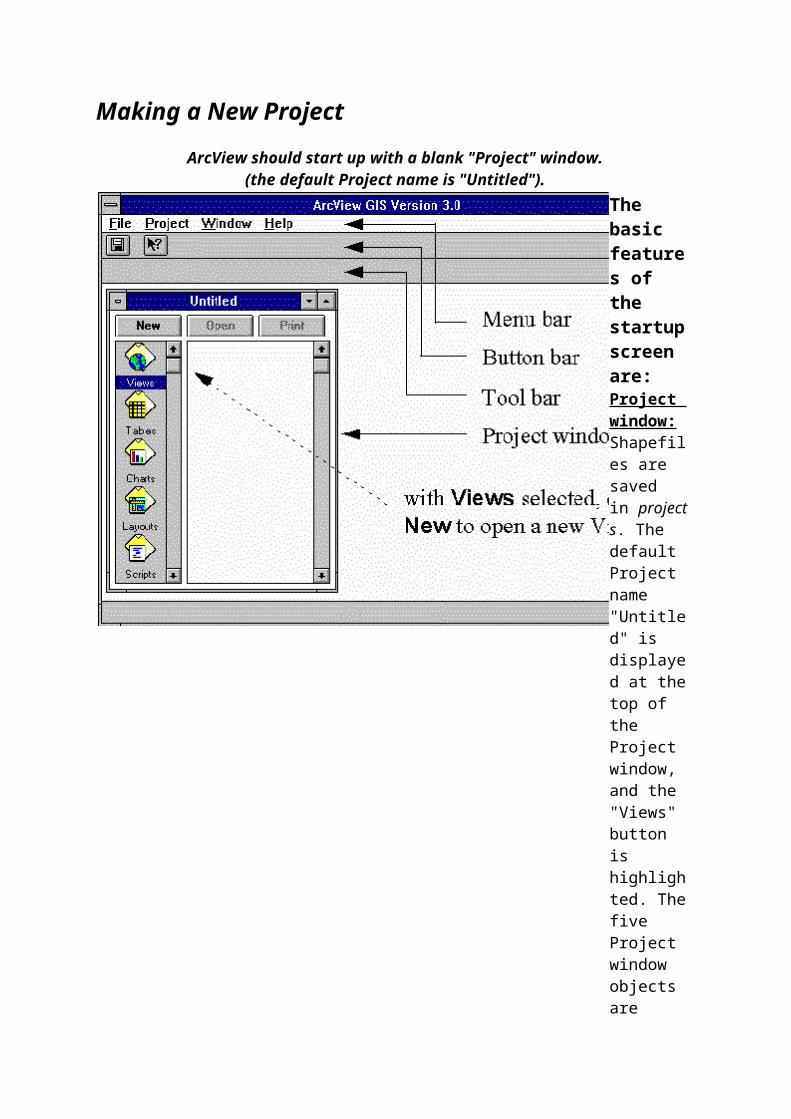
ArcView should start up with a blank "Project" window.(the default Project name is "Untitled").
The basic features of the startupscreen are:Project window:Shapefiles are saved in projects. The default Project name "Untitled" is displayed at thetop of the Project window, and the "Views" button is highlighted. Thefive Project window objects are
Views, Tables, Charts, Layouts,and Scripts.Menu bar:User-programmable pull-down menus, uniquelydefined for eachProject window object.Button bar:User-defined actions(scripts)which are implemented immediately on clicking.Tool bar:User-defined actions(scripts)which apply
while the toolis activated (clickon, click off).
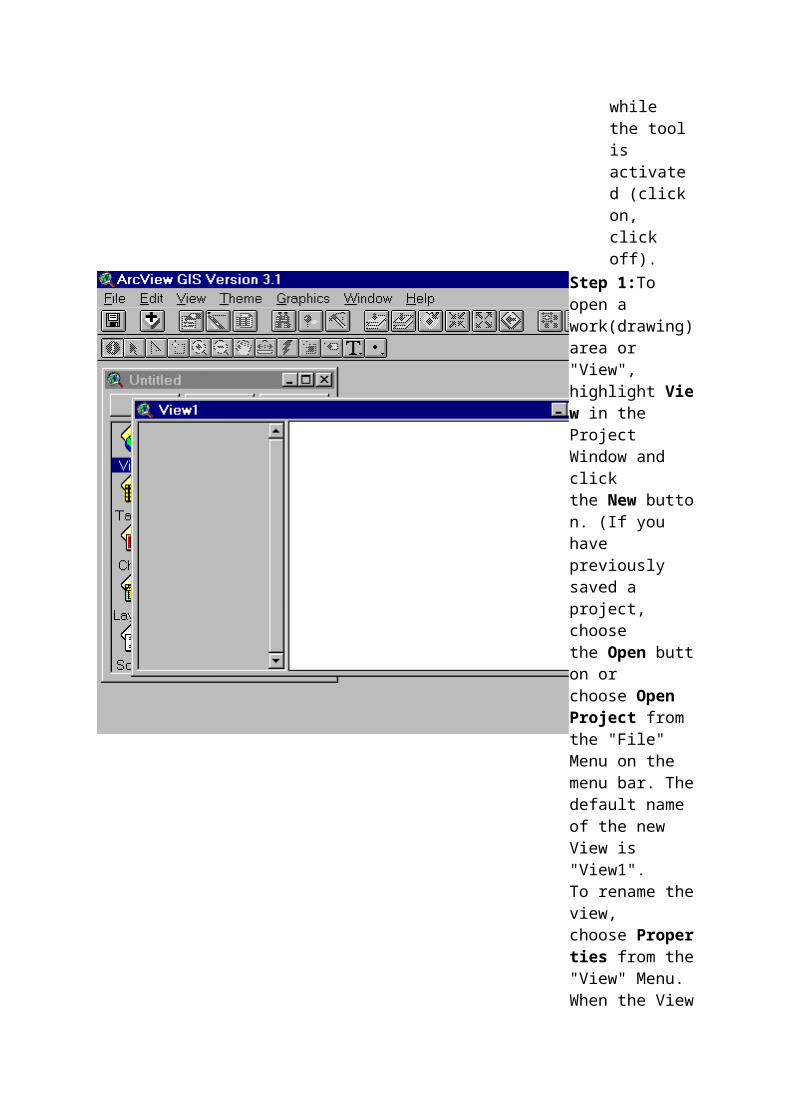
Step 1:To open a work(drawing)area or "View", highlight View in the Project Window and click the New button. (If you have previously saved a project, choose the Open button or choose Open Project from the "File" Menu on the menu bar. Thedefault name of the new View is "View1".To rename theview, choose Properties from the"View" Menu.When the View
window is opened it becomes active and a new menu bar and several toolbar buttons appear.
Return to the Table of Contents
Adding Themes
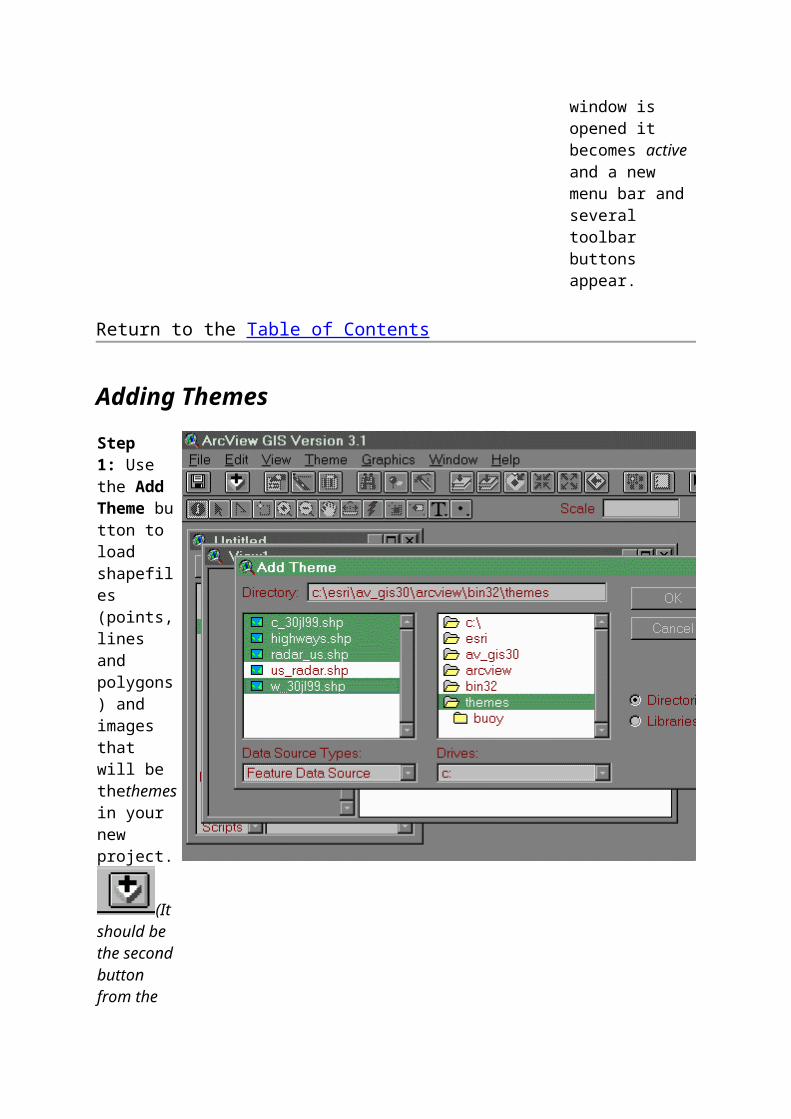
Step 1: Use the Add Theme button to load shapefiles (points,lines and polygons) and images that will be thethemes in your new project.
(It should be the second button from the
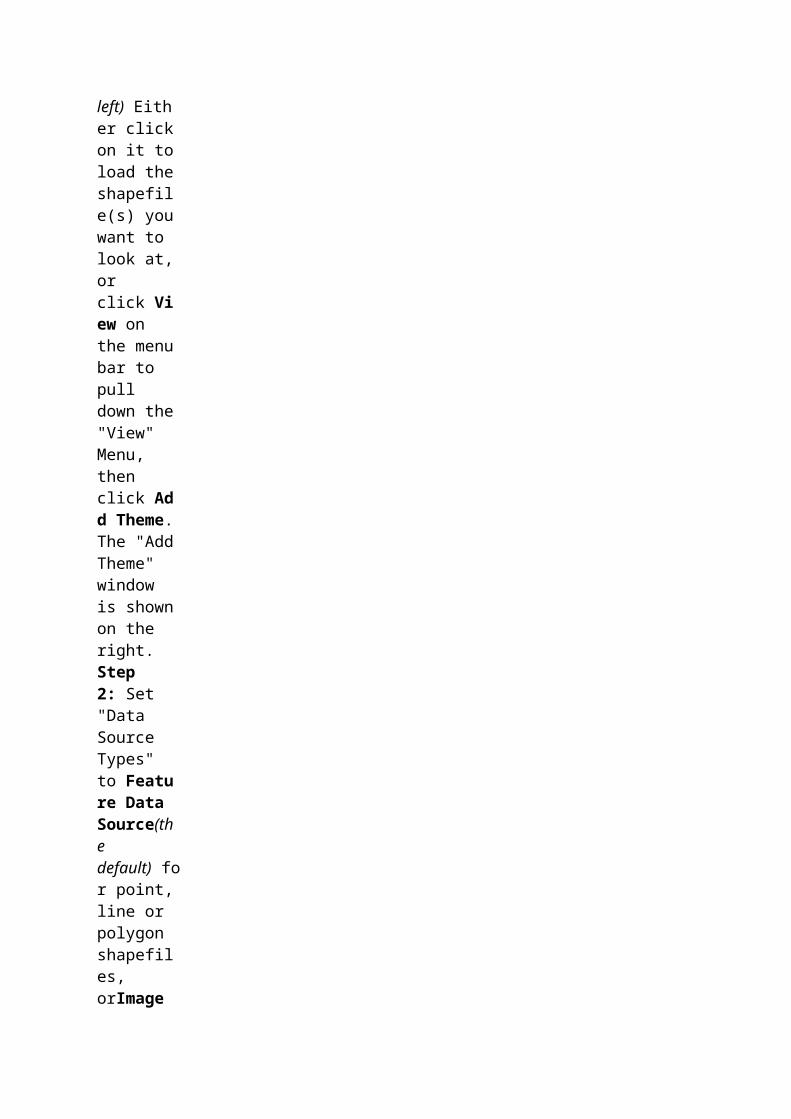
left) Either clickon it toload theshapefile(s) youwant to look at,or click View on the menubar to pull down the"View" Menu, then click Add Theme.The "AddTheme" window is shownon the right.Step 2: Set "Data Source Types" to Feature Data Source(the default) for point,line or polygon shapefiles, orImage
Data Source for imagefiles.Step 3: Change the directory to your file location.Step 4: Clickthe filenameto highlight the selectedshapefile (to select multiple shapefiles, press the shift key while highlighting).
(We will select "w_30jl99.shp"(i.e. polygon shapefile), "highways.shp"(i.e. lineshapefile), "c_30jl99.shp"(i.e. polygon shapefile), and "radar_us.shp"(i.e. point
shapefile).
If you have not downloaded the necessary shapefiles to thecomputer you are using, return to either the Available
Shapefiles section or the Getting Started section. Store theneeded files (.shp, .dbf, .shx extensions) on your PC.
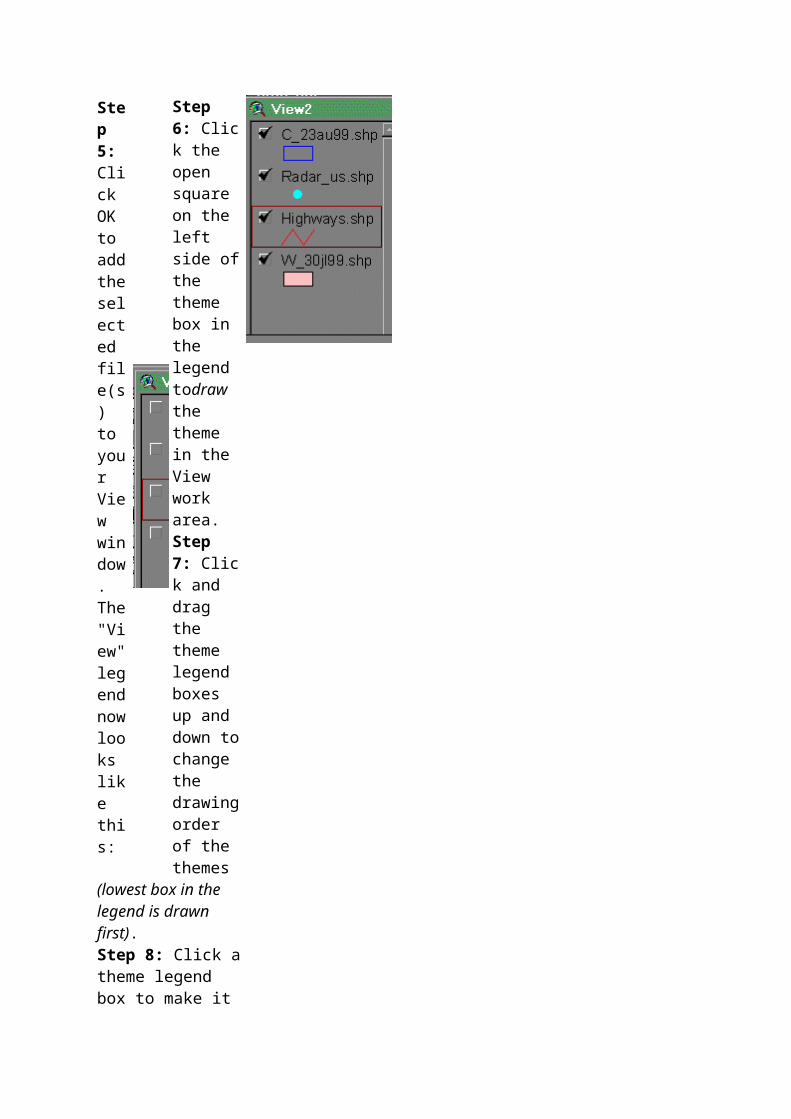
Step 6: Click the open square on the left side ofthe theme box in the legend todraw the theme in the View work area.Step 7: Click and drag the theme legend boxes up and down tochange the drawingorder of the themes
(lowest box in the legend is drawn first).Step 8: Click atheme legend box to make it
Step 5: Click OK to addtheselected file(s) to your View window.The"View"legendnowlooks like this:
"active"(theme is surrounded by a box and appears raised). Hold down the SHIFT key while clicking to make more than one theme active. Atheme can only be edited when it is "active".
Return to the Table of Contents
Moving Around the View
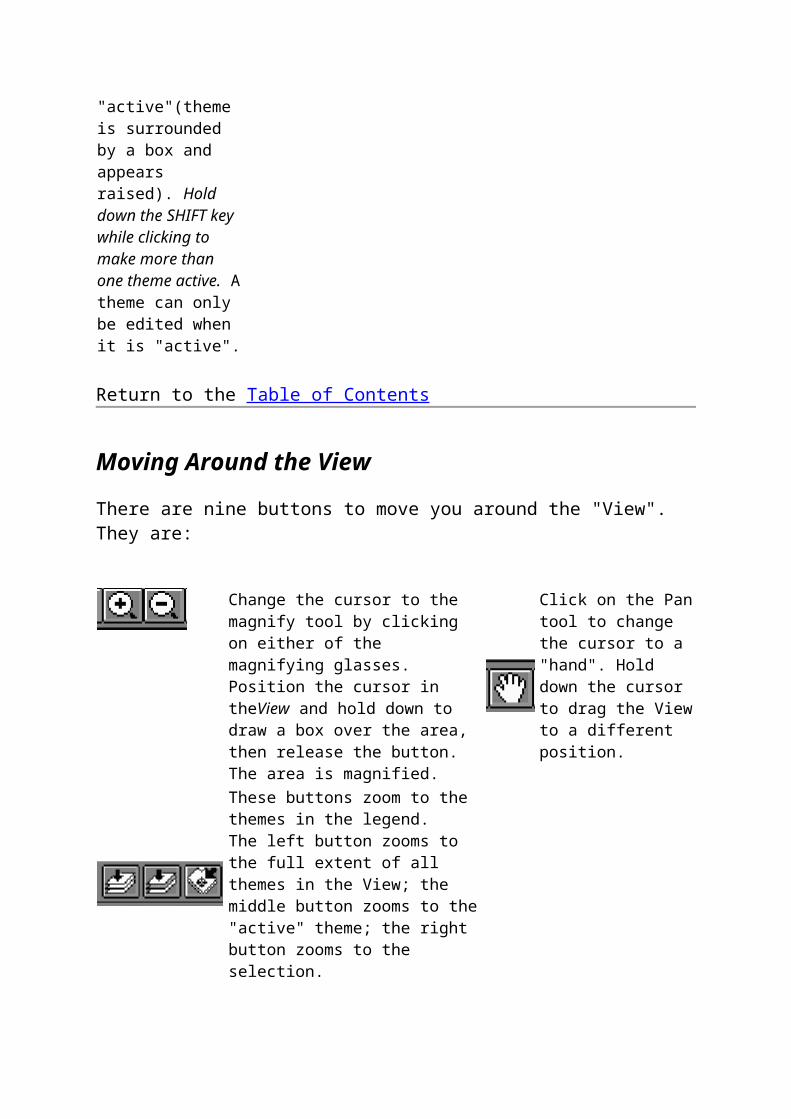
There are nine buttons to move you around the "View". They are:
Change the cursor to the magnify tool by clicking on either of the magnifying glasses. Position the cursor in theView and hold down to draw a box over the area, then release the button. The area is magnified.
Click on the Pantool to change the cursor to a "hand". Hold down the cursor to drag the Viewto a different position.
These buttons zoom to the themes in the legend.The left button zooms to the full extent of all themes in the View; the middle button zooms to the"active" theme; the right button zooms to the selection.
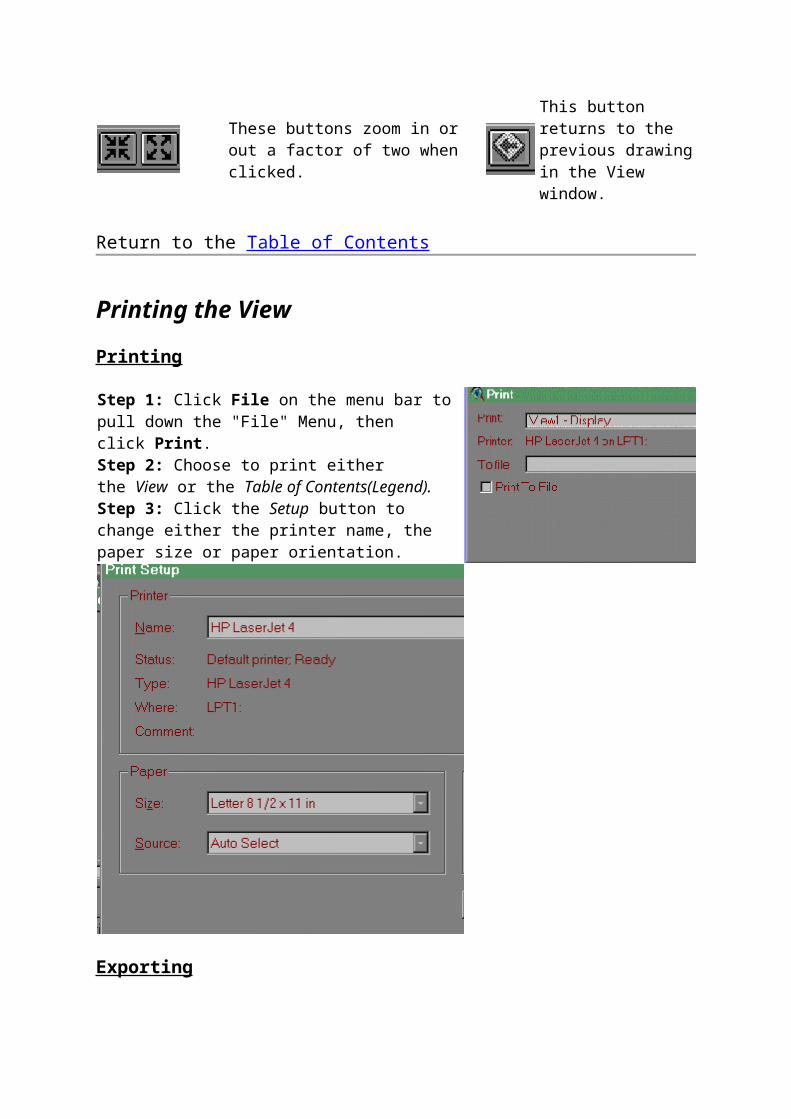
These buttons zoom in or out a factor of two when clicked.
This button returns to the previous drawingin the View window.
Return to the Table of Contents
Printing the View
Printing
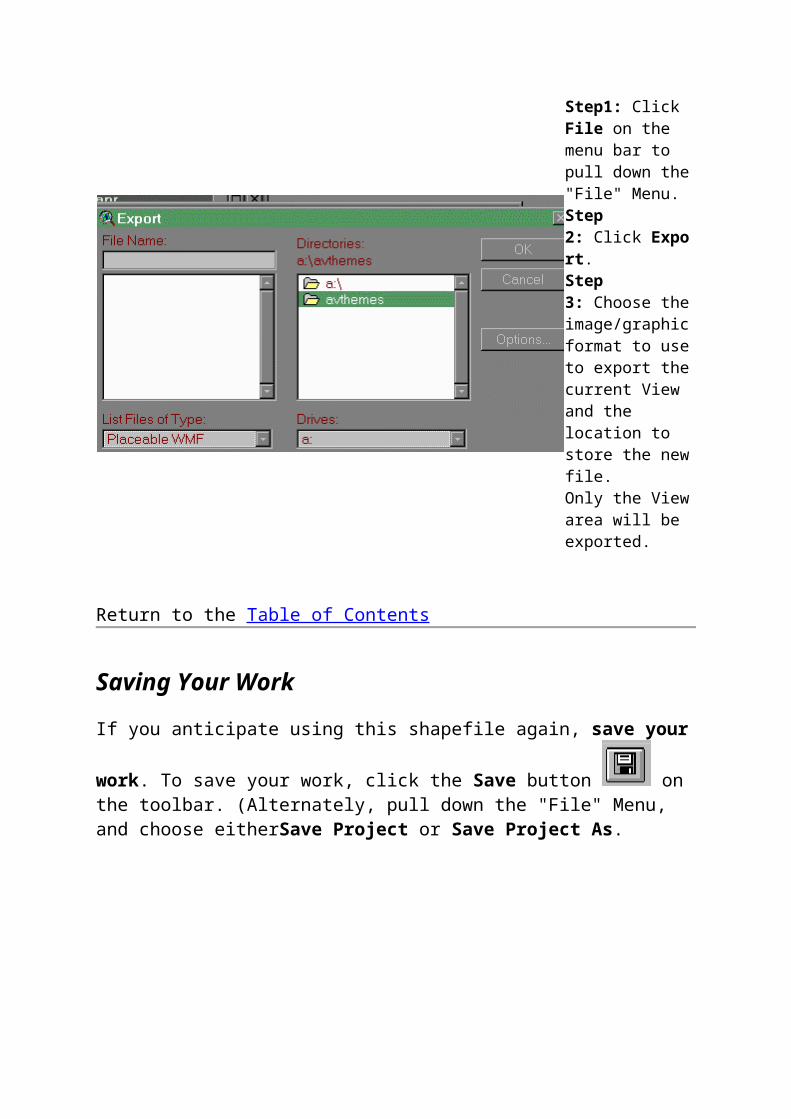
Step 1: Click File on the menu bar to pull down the "File" Menu, then click Print.Step 2: Choose to print either the View or the Table of Contents(Legend).Step 3: Click the Setup button to change either the printer name, the paper size or paper orientation.
Exporting
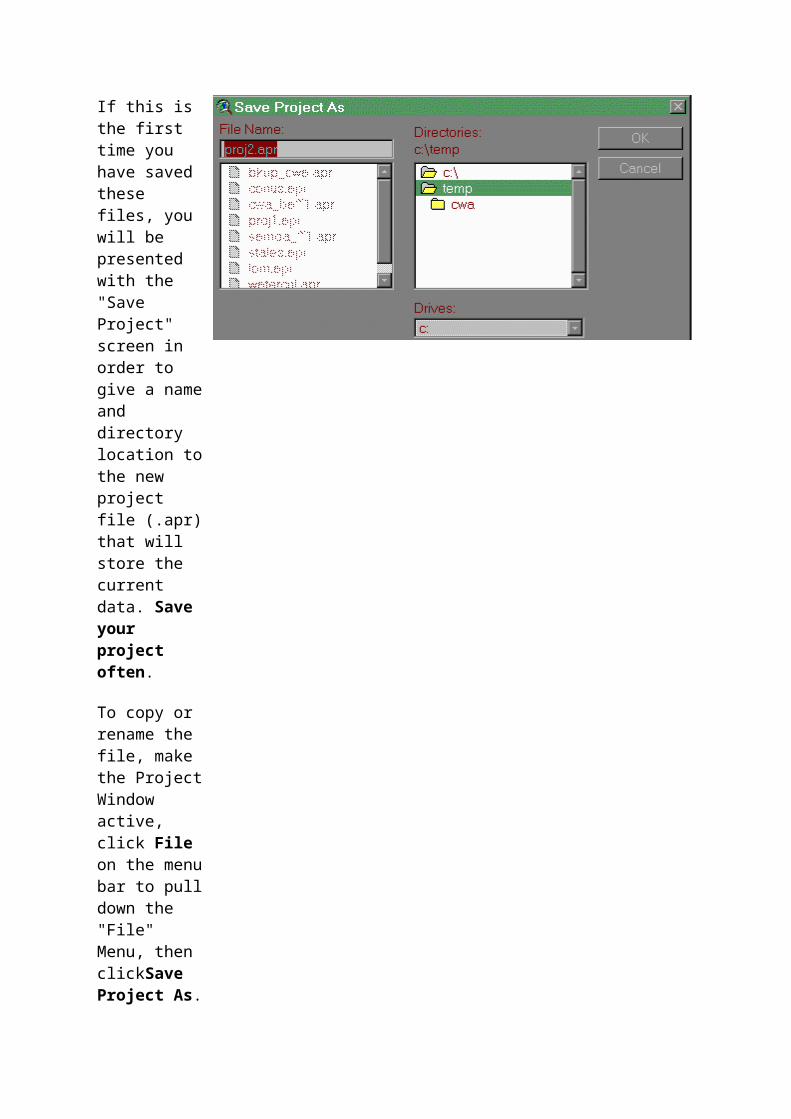
Step1: Click File on the menu bar to pull down the"File" Menu.Step 2: Click Export.Step 3: Choose theimage/graphicformat to useto export thecurrent View and the location to store the newfile.Only the Viewarea will be exported.
Return to the Table of Contents
Saving Your Work
If you anticipate using this shapefile again, save your
work. To save your work, click the Save button on the toolbar. (Alternately, pull down the "File" Menu, and choose eitherSave Project or Save Project As.
If this is the first time you have saved these files, you will be presented with the "Save Project" screen in order to give a nameand directory location tothe new project file (.apr)that will store the current data. Save your project often.
To copy or rename the file, make the ProjectWindow active, click File on the menubar to pulldown the "File" Menu, then clickSave Project As.
ArcView will promptyou for another project filename (and directory).
Return to the Table of Contents
Modifying ShapefilesChanging Theme Properties
The Legend Editor
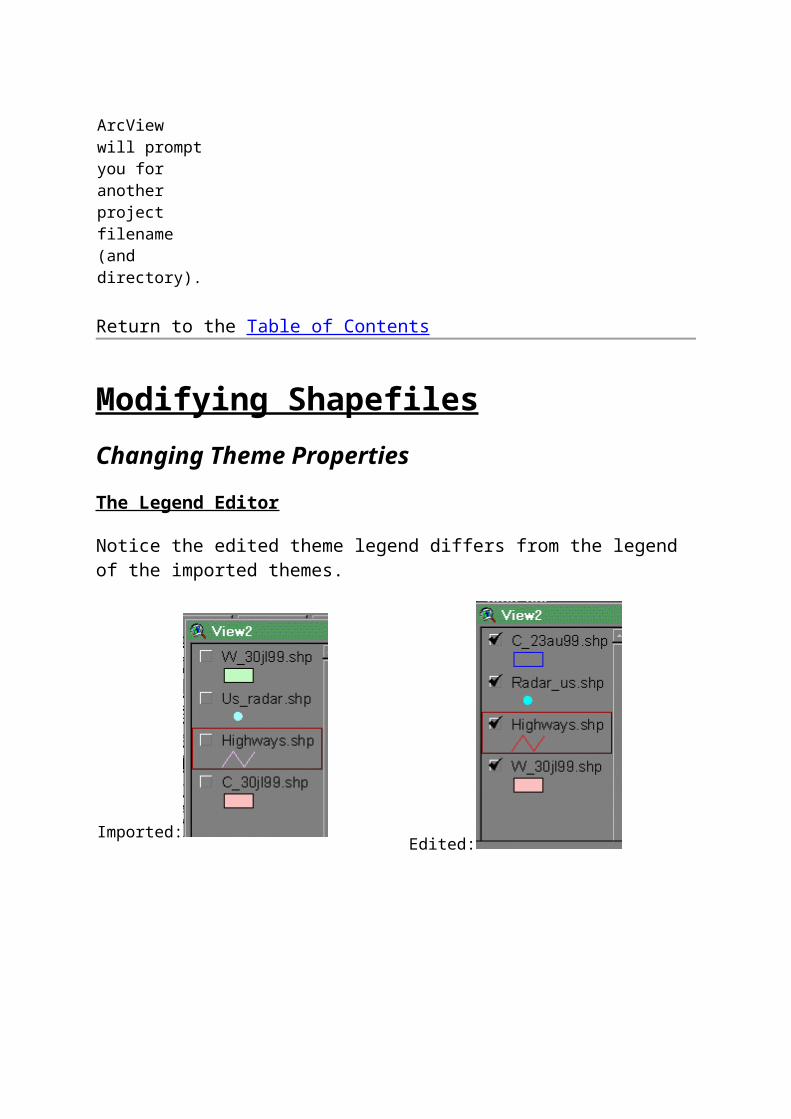
Notice the edited theme legend differs from the legend of the imported themes.
Imported: Edited:
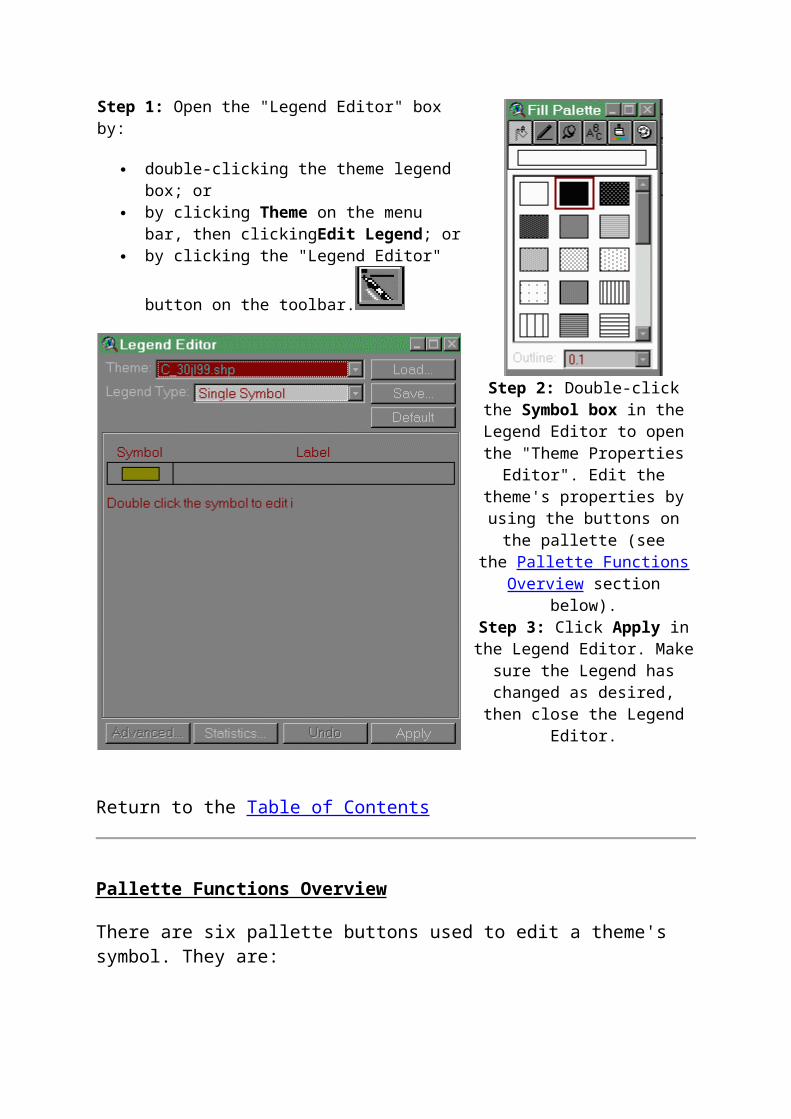
Step 1: Open the "Legend Editor" box by:
double-clicking the theme legend box; or
by clicking Theme on the menu bar, then clickingEdit Legend; or
by clicking the "Legend Editor"
button on the toolbar.
Step 2: Double-clickthe Symbol box in theLegend Editor to openthe "Theme Properties
Editor". Edit thetheme's properties byusing the buttons onthe pallette (see
the Pallette FunctionsOverview section
below).Step 3: Click Apply inthe Legend Editor. Makesure the Legend haschanged as desired,
then close the LegendEditor.
Return to the Table of Contents
Pallette Functions Overview
There are six pallette buttons used to edit a theme's symbol. They are:
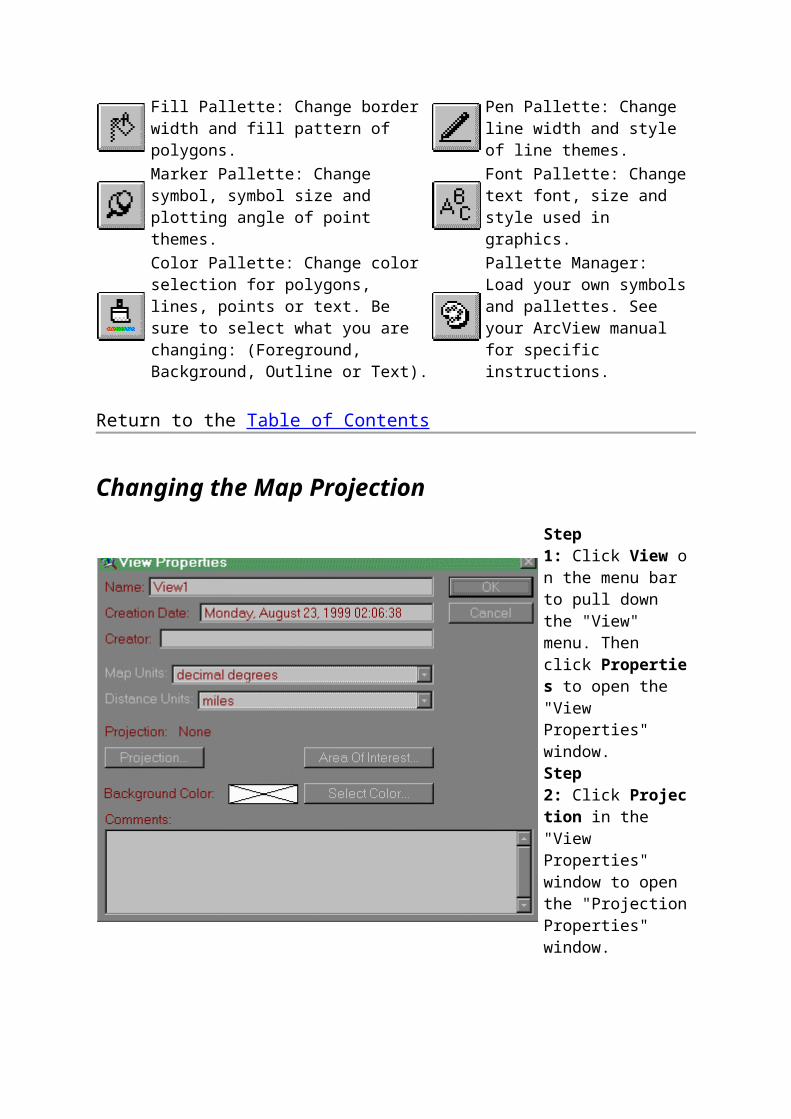
Fill Pallette: Change border width and fill pattern of polygons.
Pen Pallette: Change line width and style of line themes.
Marker Pallette: Change symbol, symbol size and plotting angle of point themes.
Font Pallette: Changetext font, size and style used in graphics.
Color Pallette: Change color selection for polygons, lines, points or text. Be sure to select what you are changing: (Foreground, Background, Outline or Text).
Pallette Manager: Load your own symbolsand pallettes. See your ArcView manual for specific instructions.
Return to the Table of Contents
Changing the Map Projection
Step 1: Click View on the menu bar to pull down the "View" menu. Then click Properties to open the "View Properties" window.Step 2: Click Projection in the "View Properties" window to open the "ProjectionProperties" window.
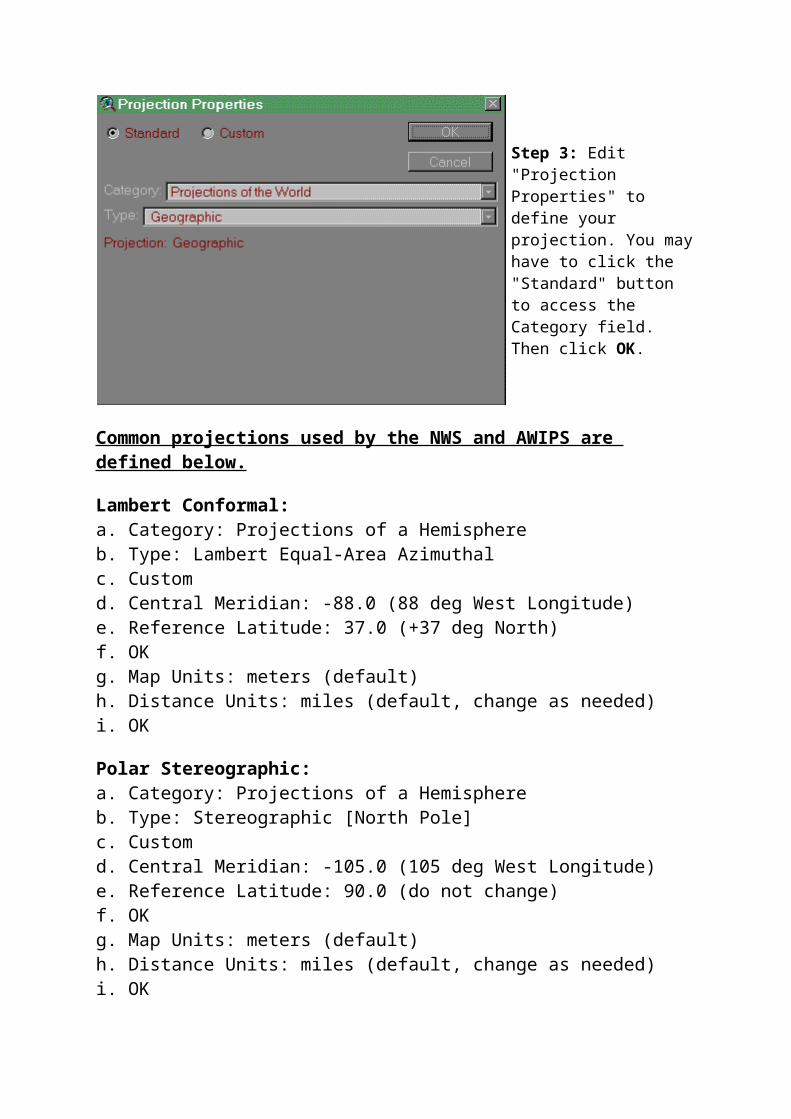
Step 3: Edit "Projection Properties" to define your projection. You mayhave to click the "Standard" button to access the Category field. Then click OK.
Common projections used by the NWS and AWIPS are defined below.
Lambert Conformal:a. Category: Projections of a Hemisphereb. Type: Lambert Equal-Area Azimuthalc. Customd. Central Meridian: -88.0 (88 deg West Longitude)e. Reference Latitude: 37.0 (+37 deg North)f. OK g. Map Units: meters (default)h. Distance Units: miles (default, change as needed)i. OK
Polar Stereographic:a. Category: Projections of a Hemisphereb. Type: Stereographic [North Pole]c. Customd. Central Meridian: -105.0 (105 deg West Longitude)e. Reference Latitude: 90.0 (do not change)f. OK g. Map Units: meters (default)h. Distance Units: miles (default, change as needed)i. OK
View from Geostationary Spacecraft:a. Category: Projections of the Worldb. Type: The World from Space (Orthographic)c. Customd. Central Meridian: -90.0 (90 deg West Longitude)e. Reference Latitude: 0.0 (Equator)f. OKg. Map Units: meters (default)h. Distance Units: miles (default, change as needed)i. OK
Return to the Table of Contents
Examining Table Attributes
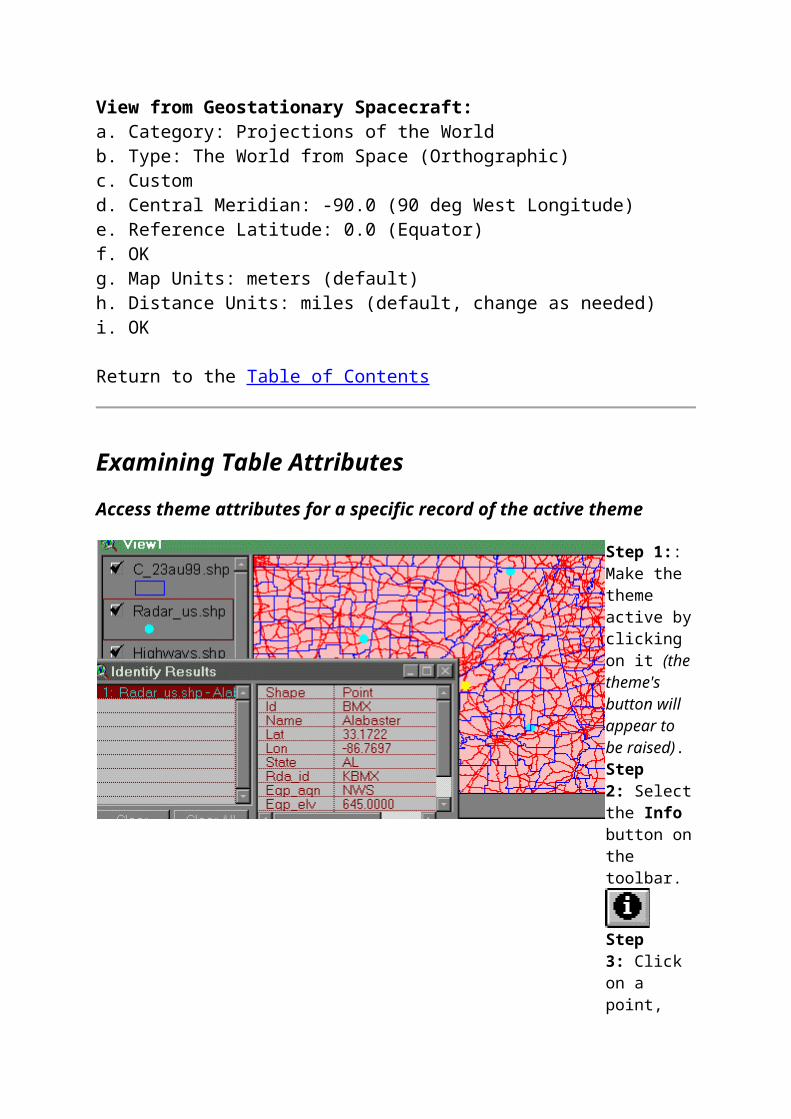
Access theme attributes for a specific record of the active theme
Step 1:: Make the theme active byclicking on it (thetheme's button will appear to be raised).Step 2: Selectthe Info button onthe toolbar.
Step 3: Click on a point,
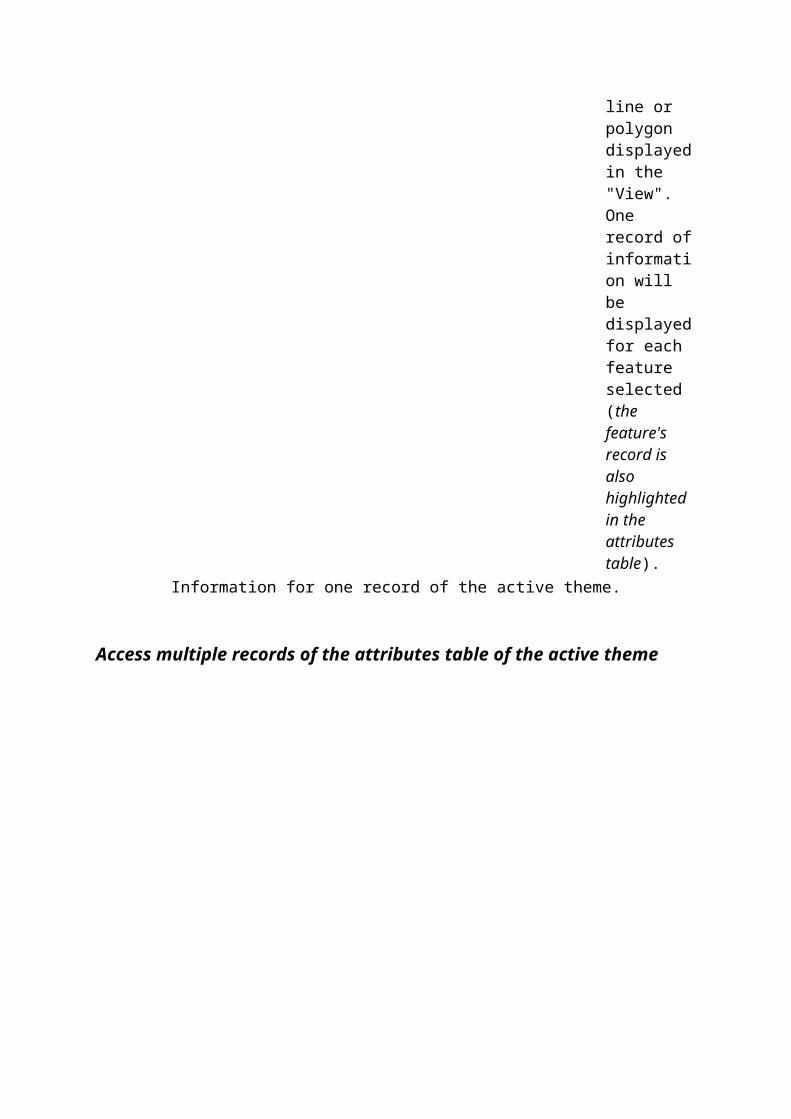
line or polygon displayedin the "View".One record ofinformation will be displayedfor each feature selected (the feature's record is also highlighted in the attributes table).
Information for one record of the active theme.
Access multiple records of the attributes table of the active theme
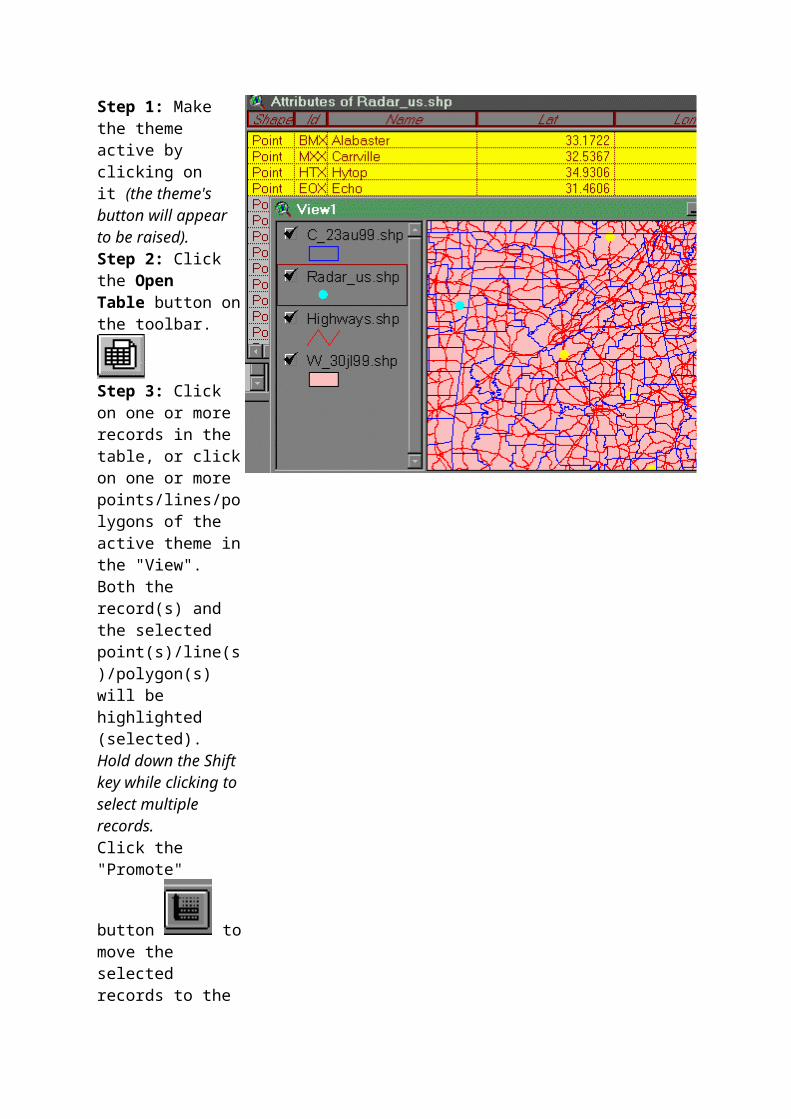
Step 1: Make the theme active by clicking on it (the theme's button will appear to be raised).Step 2: Click the Open Table button onthe toolbar.
Step 3: Click on one or more records in the table, or clickon one or more points/lines/polygons of the active theme inthe "View".Both the record(s) and the selected point(s)/line(s)/polygon(s) will be highlighted (selected).Hold down the Shift key while clicking toselect multiple records.Click the "Promote"
button tomove the selected records to the
top of the table.
Querying Database Records
Records meeting specific conditions in a theme's database may be located by performing a querying operation on the theme.
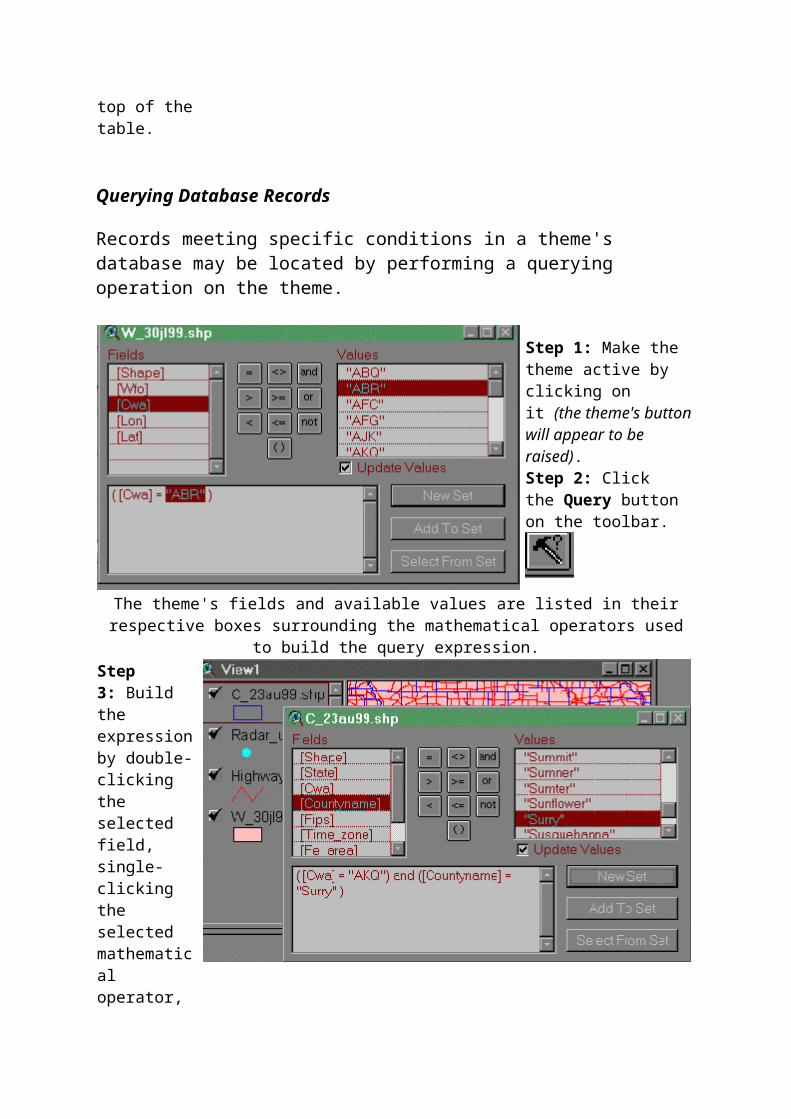
Step 1: Make the theme active by clicking on it (the theme's buttonwill appear to be raised).Step 2: Click the Query button on the toolbar.
The theme's fields and available values are listed in theirrespective boxes surrounding the mathematical operators used
to build the query expression.Step 3: Build the expressionby double-clicking the selected field, single-clicking the selected mathematical operator,

and double-clicking the selected value (in this example, make the "c_30jl99.shp"theme active and query on CWA = "AKQ" and countyname ="Surry").Step 4: Choose to either create a "New Set","Add to Set", or "Select from Set" from the buttons located tothe right of the expressionwindow.To create a dataset containing only these values, select "New Set"; to add these values to previously selected values, select
"Add to Set"; or, to refine a previously defined set by eliminating a value(s) meeting the conditions of the query expression, choose "Selectfrom Set".
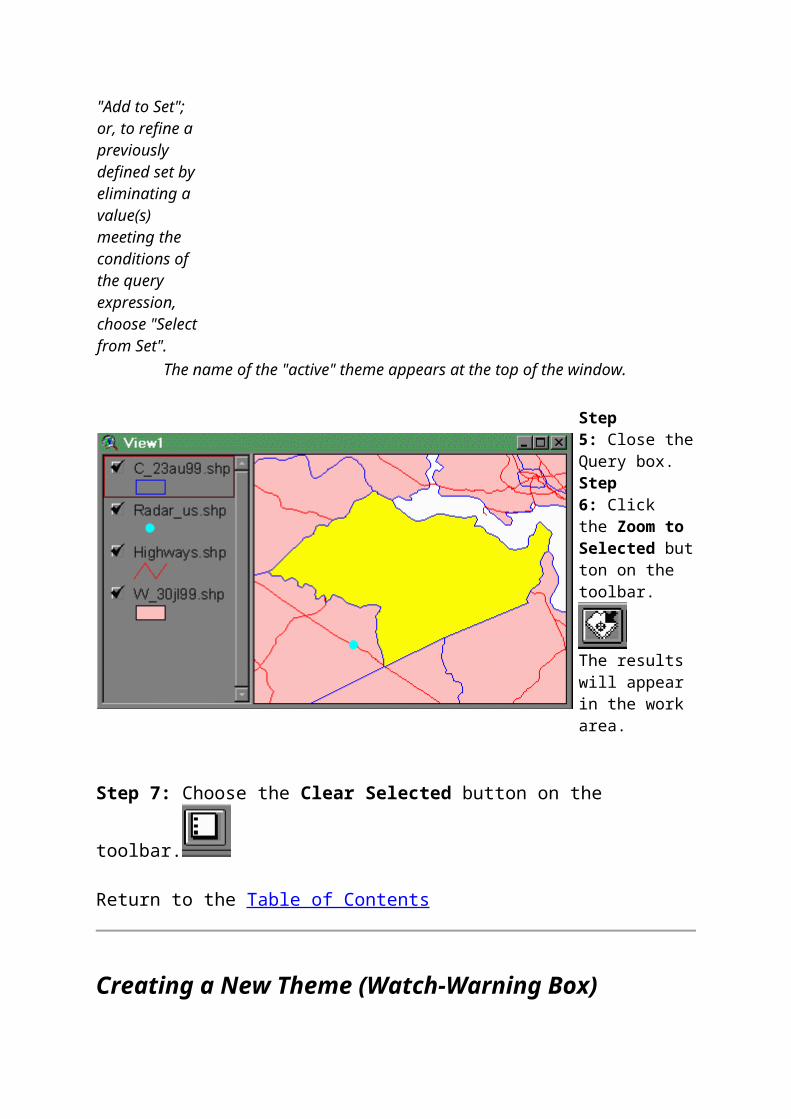
The name of the "active" theme appears at the top of the window.
Step 5: Close theQuery box.Step 6: Click the Zoom to Selected button on the toolbar.
The results will appear in the work area.
Step 7: Choose the Clear Selected button on the
toolbar.
Return to the Table of Contents
Creating a New Theme (Watch-Warning Box)
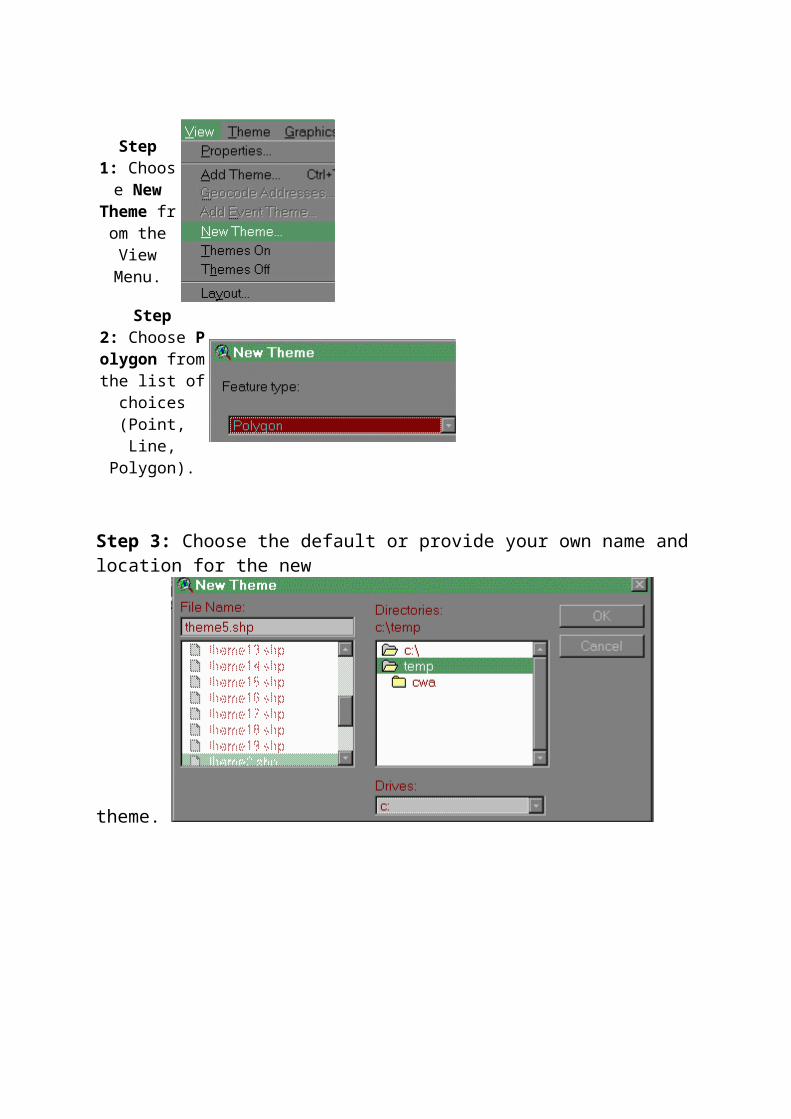
Step2: Choose Polygon fromthe list of
choices(Point,Line,
Polygon).
Step 3: Choose the default or provide your own name andlocation for the new
theme.
Step1: Choose New
Theme from theViewMenu.
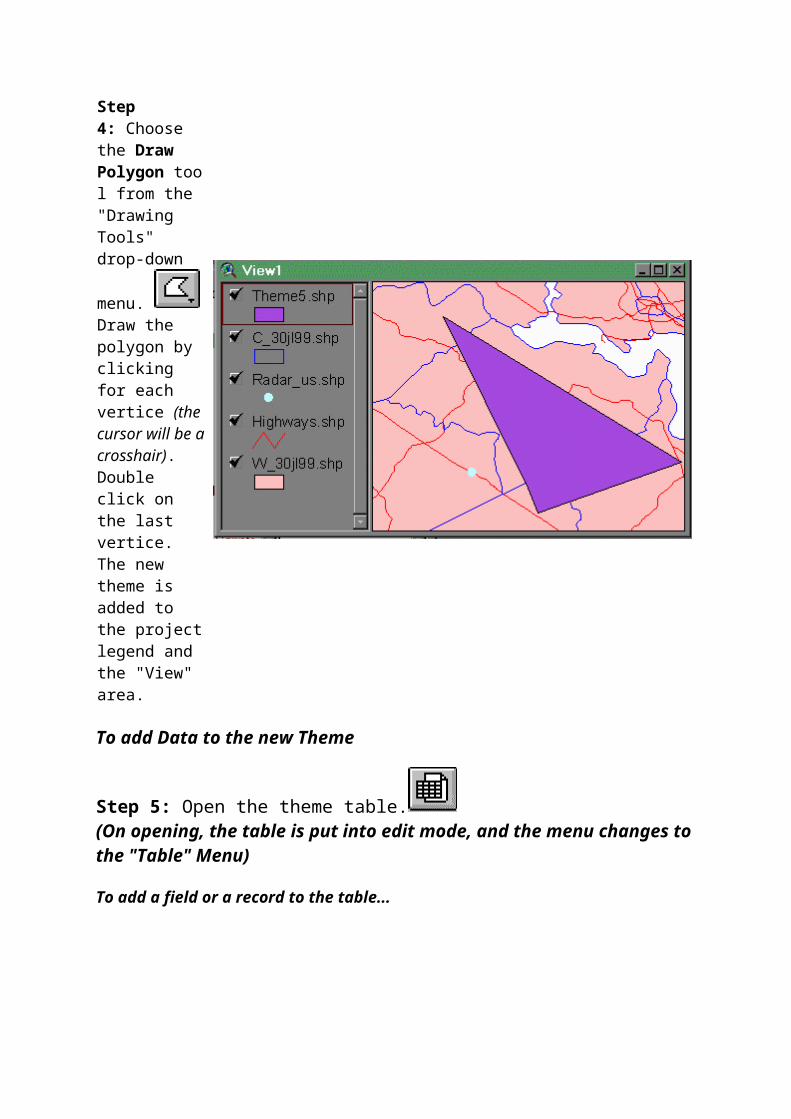
Step 4: Choose the Draw Polygon tool from the "Drawing Tools" drop-down
menu. Draw the polygon by clicking for each vertice (the cursor will be a crosshair).Double click on the last vertice.The new theme is added to the projectlegend and the "View" area.
To add Data to the new Theme
Step 5: Open the theme table.(On opening, the table is put into edit mode, and the menu changes tothe "Table" Menu)
To add a field or a record to the table...
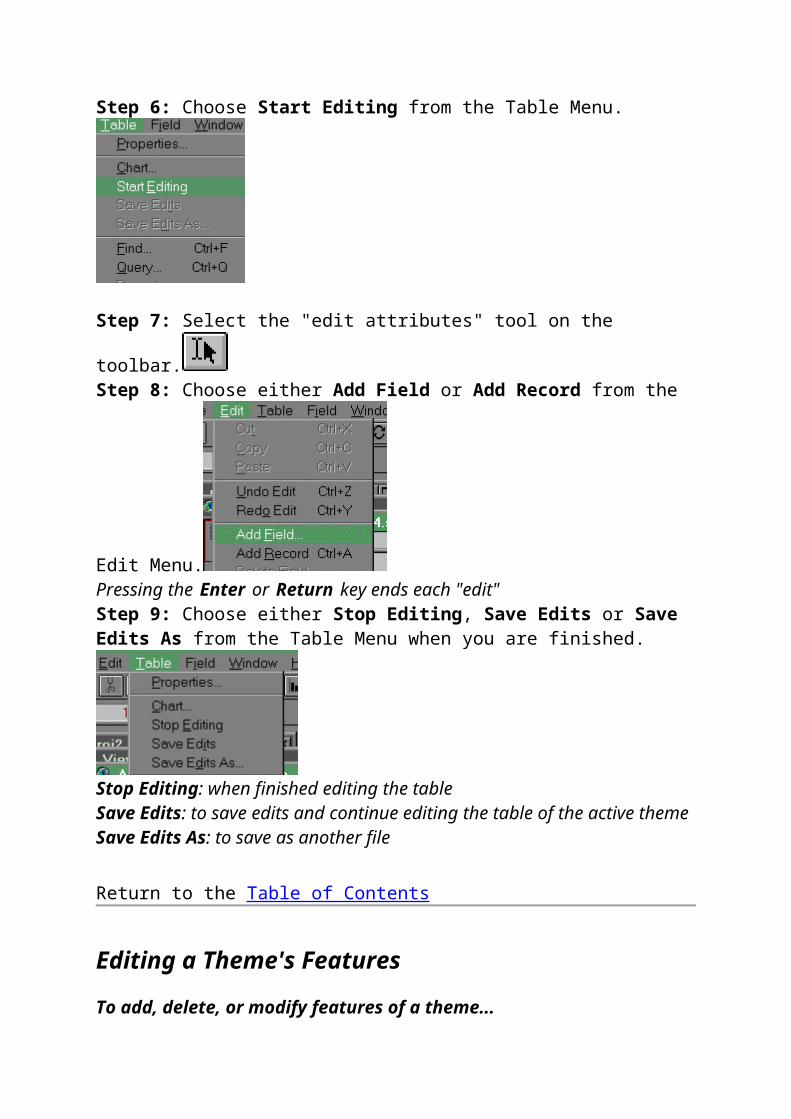
Step 6: Choose Start Editing from the Table Menu.
Step 7: Select the "edit attributes" tool on the
toolbar.Step 8: Choose either Add Field or Add Record from the
Edit Menu.Pressing the Enter or Return key ends each "edit"Step 9: Choose either Stop Editing, Save Edits or Save Edits As from the Table Menu when you are finished.
Stop Editing: when finished editing the tableSave Edits: to save edits and continue editing the table of the active themeSave Edits As: to save as another file
Return to the Table of Contents
Editing a Theme's Features
To add, delete, or modify features of a theme...
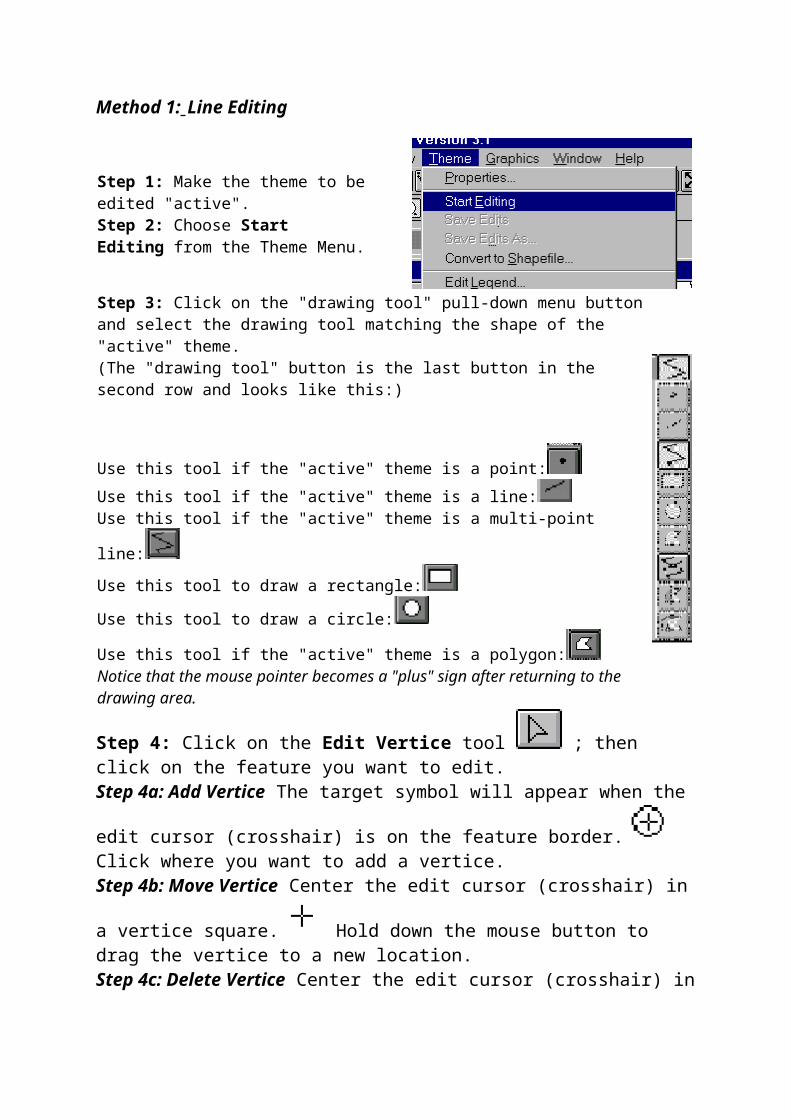
Method 1: Line Editing
Step 1: Make the theme to be edited "active".Step 2: Choose Start Editing from the Theme Menu.
Step 3: Click on the "drawing tool" pull-down menu buttonand select the drawing tool matching the shape of the "active" theme.(The "drawing tool" button is the last button in the second row and looks like this:)
Use this tool if the "active" theme is a point:Use this tool if the "active" theme is a line:Use this tool if the "active" theme is a multi-point
line:Use this tool to draw a rectangle:
Use this tool to draw a circle:
Use this tool if the "active" theme is a polygon:Notice that the mouse pointer becomes a "plus" sign after returning to the drawing area.
Step 4: Click on the Edit Vertice tool ; then click on the feature you want to edit.Step 4a: Add Vertice The target symbol will appear when the
edit cursor (crosshair) is on the feature border. Click where you want to add a vertice.Step 4b: Move Vertice Center the edit cursor (crosshair) in
a vertice square. Hold down the mouse button to drag the vertice to a new location. Step 4c: Delete Vertice Center the edit cursor (crosshair) in
a vertice square. Use the keyboard Delete key to remove the vertice.
To add a new highway...
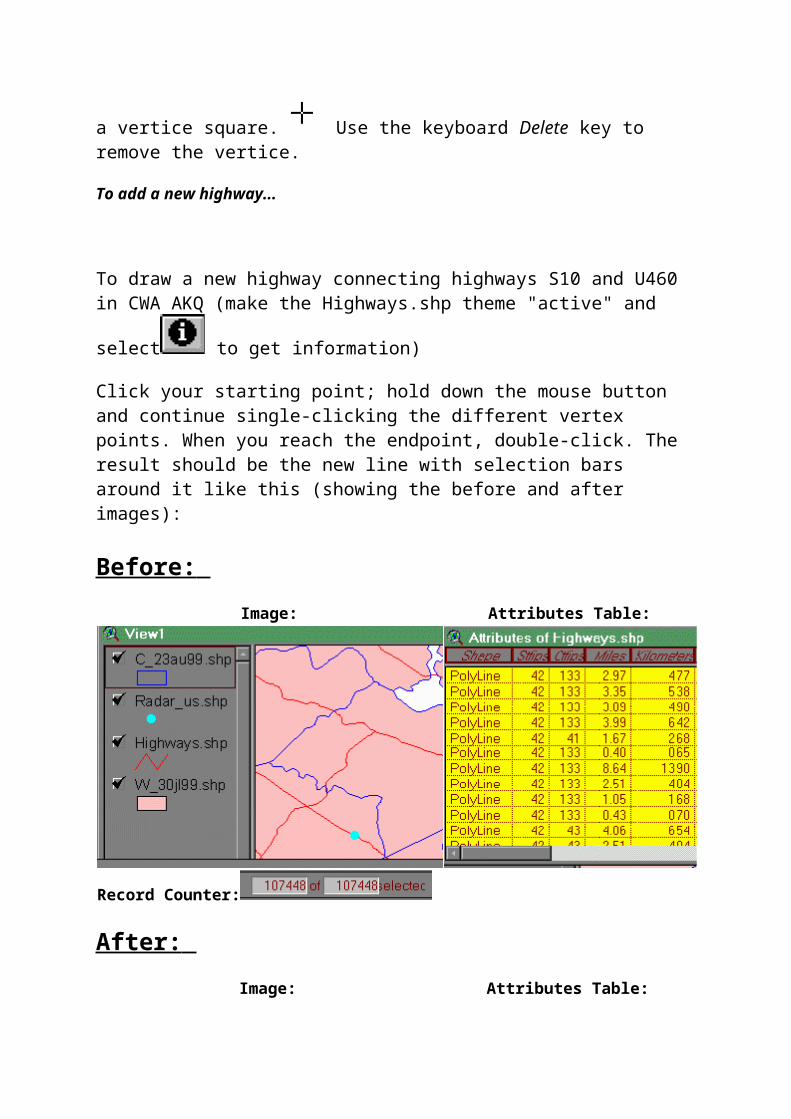
To draw a new highway connecting highways S10 and U460 in CWA AKQ (make the Highways.shp theme "active" and
select to get information)
Click your starting point; hold down the mouse button and continue single-clicking the different vertex points. When you reach the endpoint, double-click. The result should be the new line with selection bars around it like this (showing the before and after images):
Before: Image: Attributes Table:
Record Counter:
After: Image: Attributes Table:
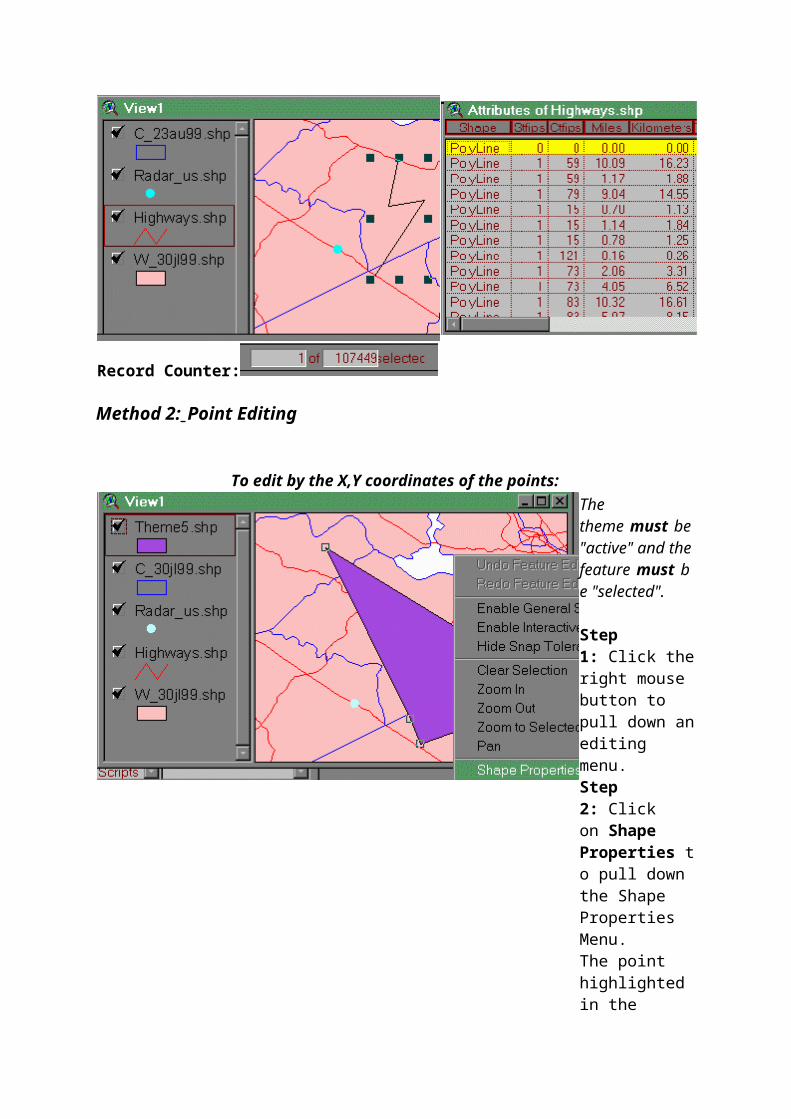
Record Counter:
Method 2: Point Editing
To edit by the X,Y coordinates of the points:The theme must be"active" and thefeature must be "selected".
Step 1: Click theright mouse button to pull down anediting menu.Step 2: Click on Shape Properties to pull down the Shape Properties Menu.The point highlighted in the
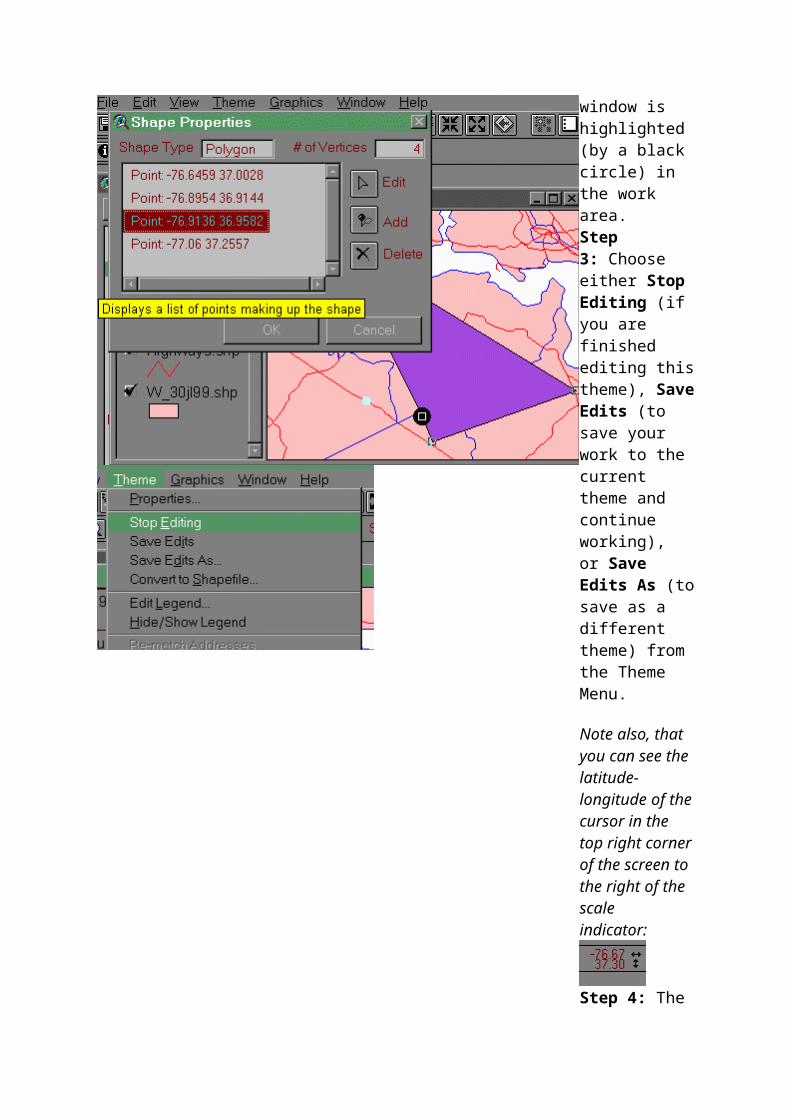
window is highlighted (by a black circle) in the work area.Step 3: Choose either Stop Editing (if you are finished editing thistheme), SaveEdits (to save your work to the current theme and continue working), or Save Edits As (tosave as a different theme) from the Theme Menu.
Note also, that you can see the latitude-longitude of thecursor in the top right cornerof the screen to the right of the scale indicator:
Step 4: The
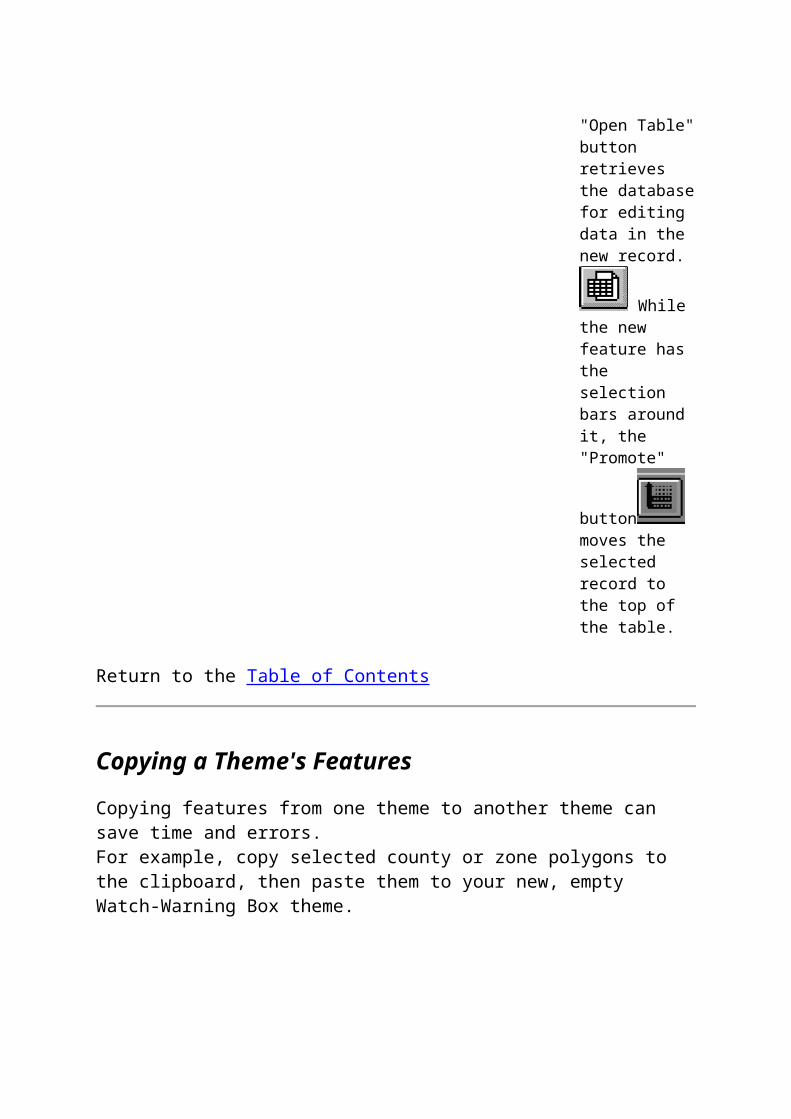
"Open Table"button retrieves the databasefor editing data in the new record.
Whilethe new feature has the selection bars around it, the "Promote"
button moves the selected record to the top of the table.
Return to the Table of Contents
Copying a Theme's Features
Copying features from one theme to another theme can save time and errors.For example, copy selected county or zone polygons to the clipboard, then paste them to your new, empty Watch-Warning Box theme.
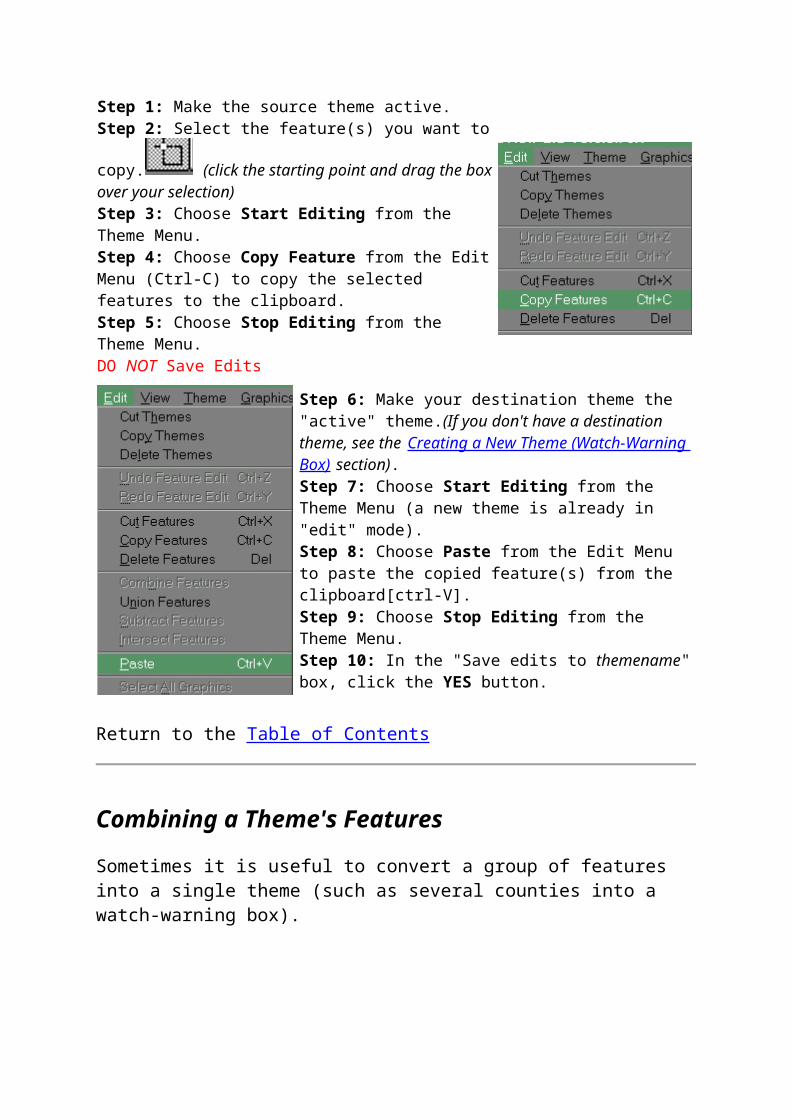
Step 1: Make the source theme active.Step 2: Select the feature(s) you want to
copy. (click the starting point and drag the boxover your selection)Step 3: Choose Start Editing from the Theme Menu.Step 4: Choose Copy Feature from the EditMenu (Ctrl-C) to copy the selected features to the clipboard.Step 5: Choose Stop Editing from the Theme Menu.DO NOT Save Edits
Step 6: Make your destination theme the "active" theme.(If you don't have a destination theme, see the Creating a New Theme (Watch-Warning Box) section).Step 7: Choose Start Editing from the Theme Menu (a new theme is already in "edit" mode).Step 8: Choose Paste from the Edit Menu to paste the copied feature(s) from the clipboard[ctrl-V].Step 9: Choose Stop Editing from the Theme Menu.Step 10: In the "Save edits to themename"box, click the YES button.
Return to the Table of Contents
Combining a Theme's Features
Sometimes it is useful to convert a group of features into a single theme (such as several counties into a watch-warning box).
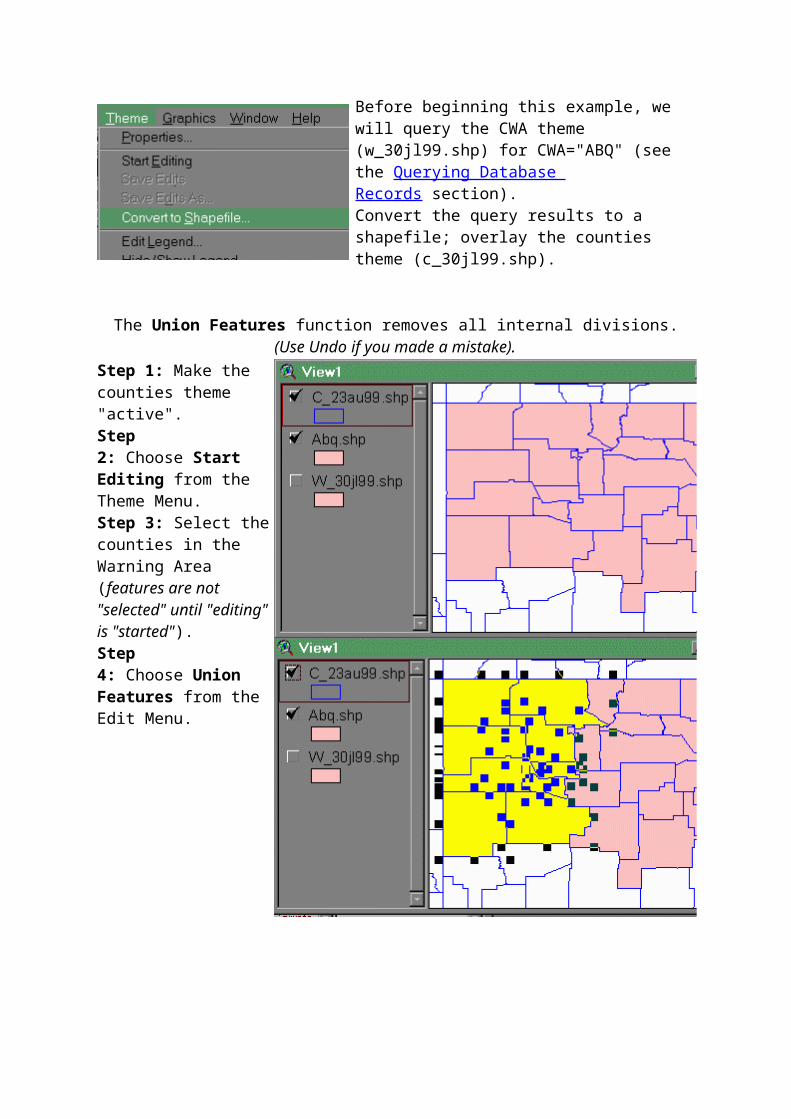
Before beginning this example, we will query the CWA theme (w_30jl99.shp) for CWA="ABQ" (see the Querying Database Records section).Convert the query results to a shapefile; overlay the counties theme (c_30jl99.shp).
The Union Features function removes all internal divisions.(Use Undo if you made a mistake).
Step 1: Make the counties theme "active".Step 2: Choose Start Editing from the Theme Menu.Step 3: Select thecounties in the Warning Area (features are not "selected" until "editing"is "started").Step 4: Choose Union Features from the Edit Menu.
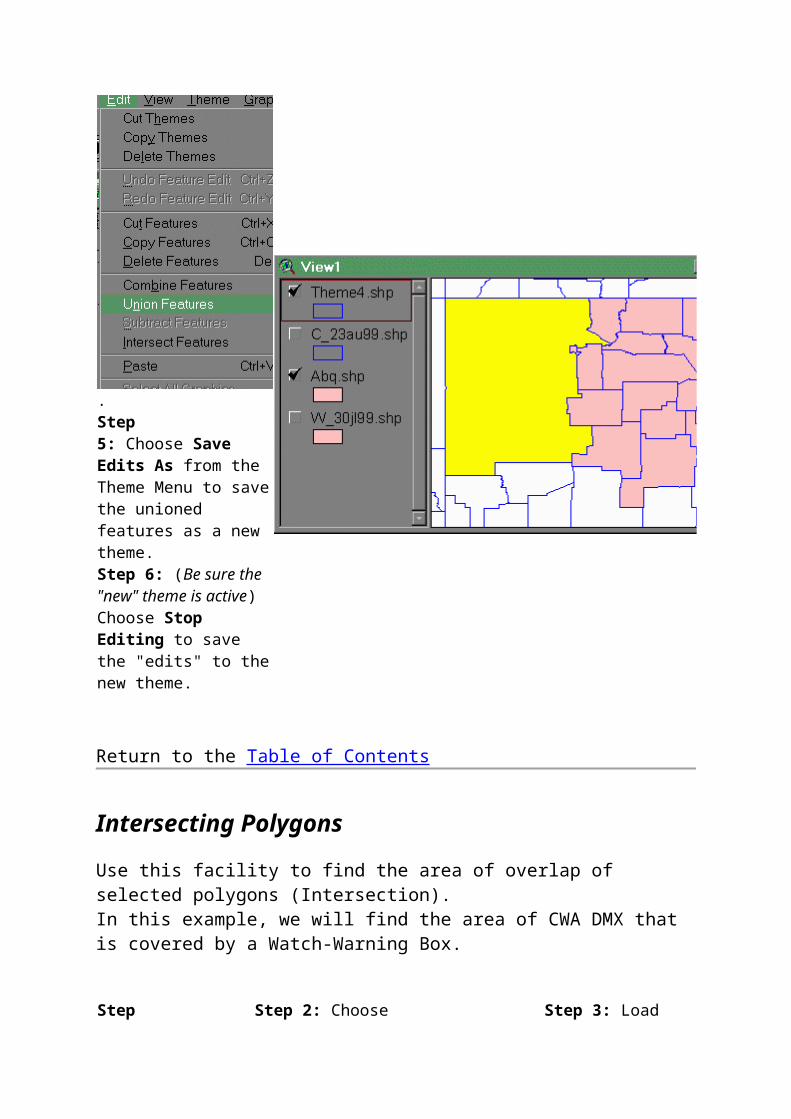
.Step 5: Choose Save Edits As from the Theme Menu to savethe unioned features as a new theme.Step 6: (Be sure the "new" theme is active) Choose Stop Editing to save the "edits" to thenew theme.
Return to the Table of Contents
Intersecting Polygons
Use this facility to find the area of overlap of selected polygons (Intersection).In this example, we will find the area of CWA DMX that is covered by a Watch-Warning Box.
Step Step 2: Choose Step 3: Load
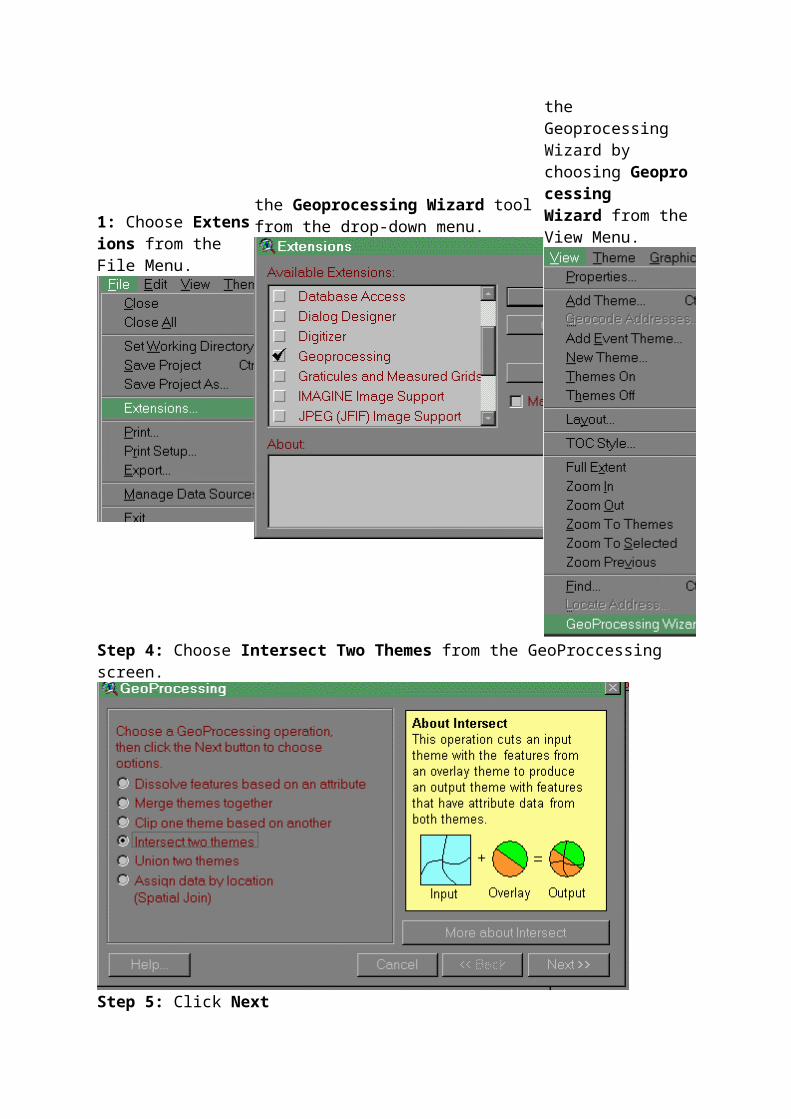
1: Choose Extensions from the File Menu.
the Geoprocessing Wizard tool from the drop-down menu.
the Geoprocessing Wizard by choosing Geoprocessing Wizard from theView Menu.
Step 4: Choose Intersect Two Themes from the GeoProccessing screen.
Step 5: Click Next
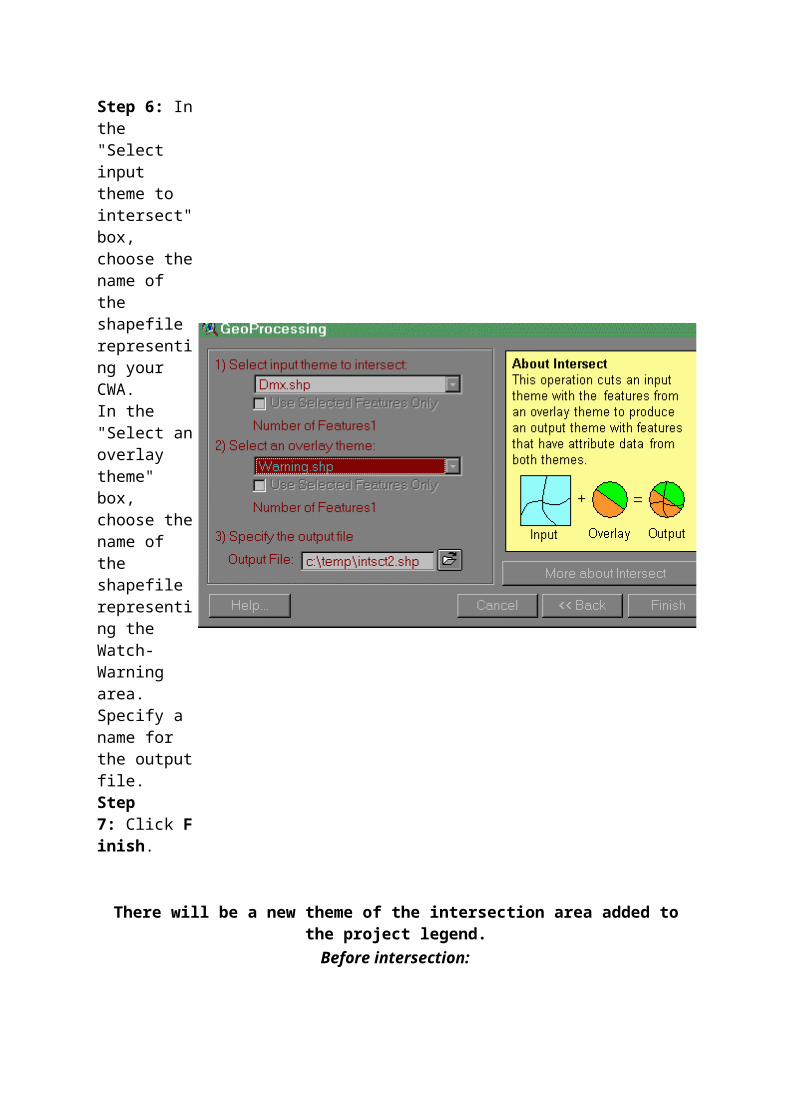
Step 6: Inthe "Select input theme to intersect"box, choose thename of the shapefile representing your CWA.In the "Select anoverlay theme" box, choose thename of the shapefile representing the Watch-Warning area.Specify a name for the outputfile.Step 7: Click Finish.
There will be a new theme of the intersection area added tothe project legend.
Before intersection:
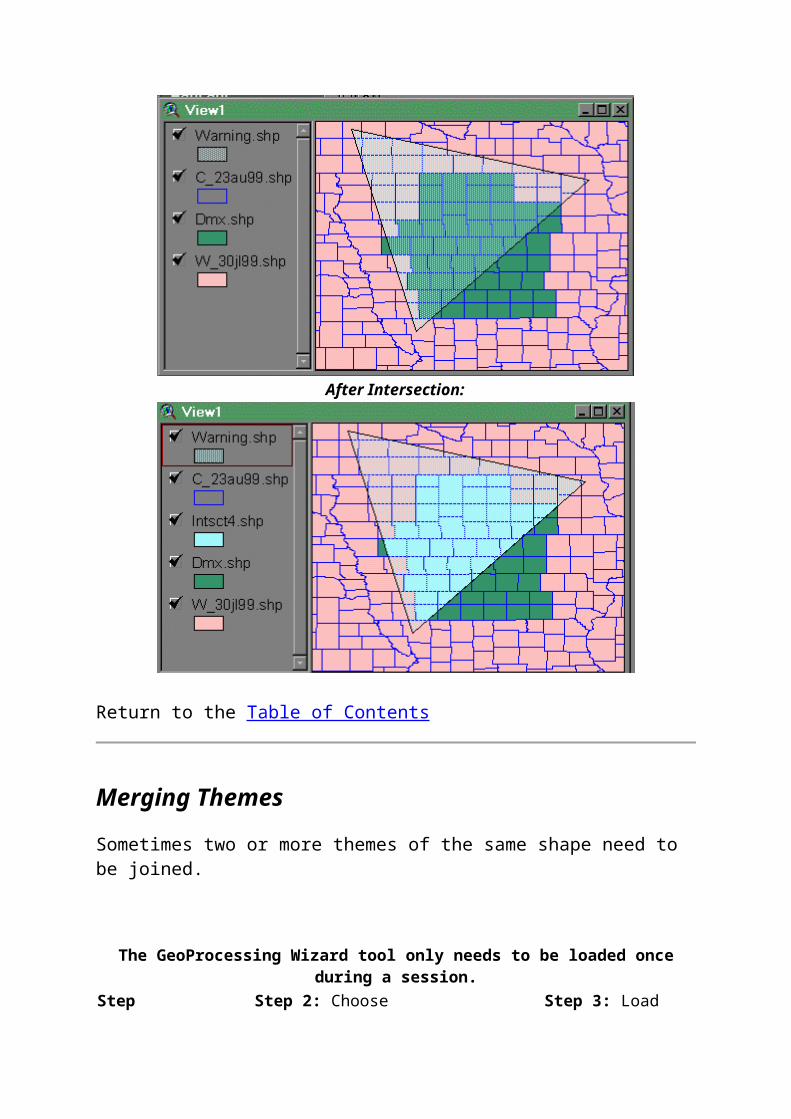
After Intersection:
Return to the Table of Contents
Merging Themes
Sometimes two or more themes of the same shape need to be joined.
The GeoProcessing Wizard tool only needs to be loaded onceduring a session.
Step Step 2: Choose Step 3: Load
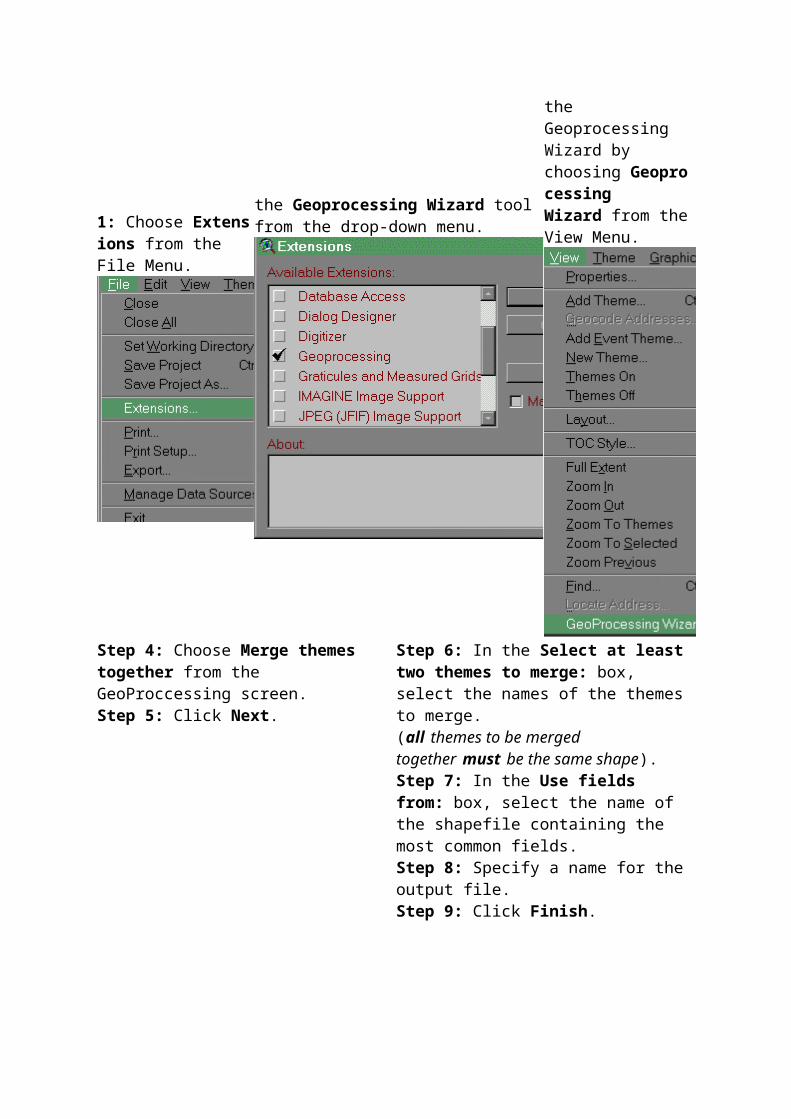
1: Choose Extensions from the File Menu.
the Geoprocessing Wizard tool from the drop-down menu.
the Geoprocessing Wizard by choosing Geoprocessing Wizard from theView Menu.
Step 4: Choose Merge themes together from the GeoProccessing screen.Step 5: Click Next.
Step 6: In the Select at least two themes to merge: box, select the names of the themes to merge.(all themes to be merged together must be the same shape).Step 7: In the Use fields from: box, select the name of the shapefile containing the most common fields.Step 8: Specify a name for the output file.Step 9: Click Finish.
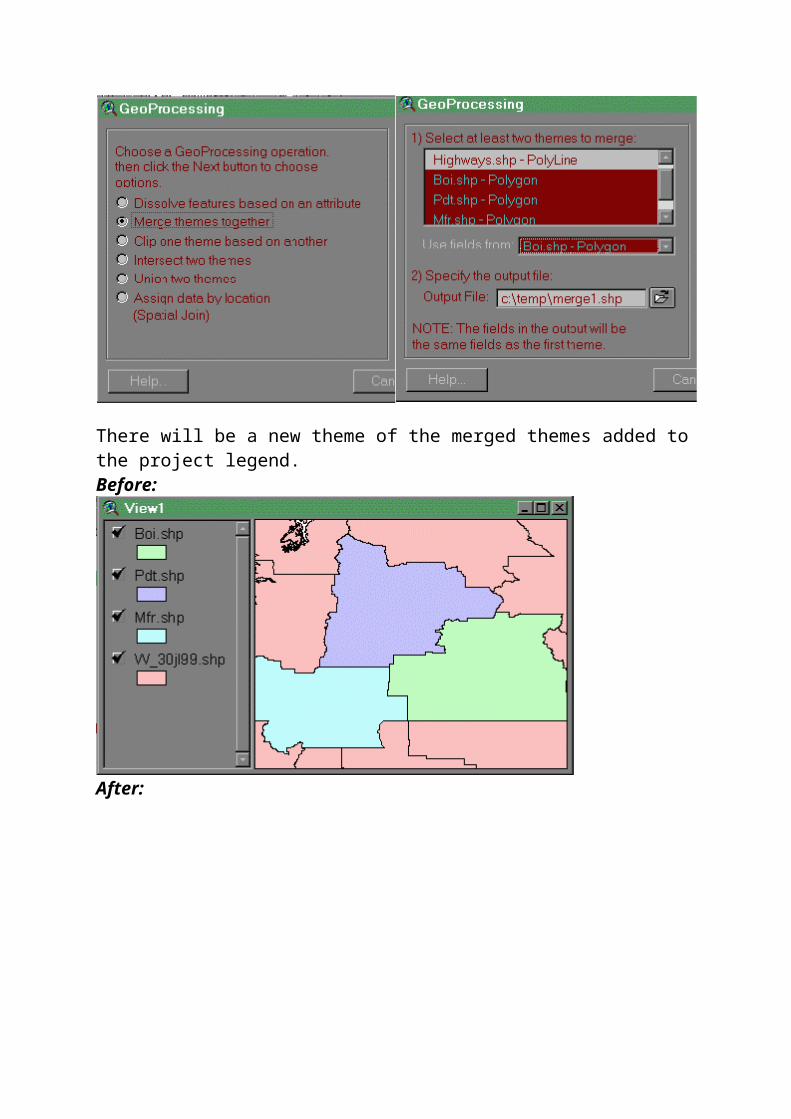
There will be a new theme of the merged themes added tothe project legend.Before:
After:
Return to the Table of Contents
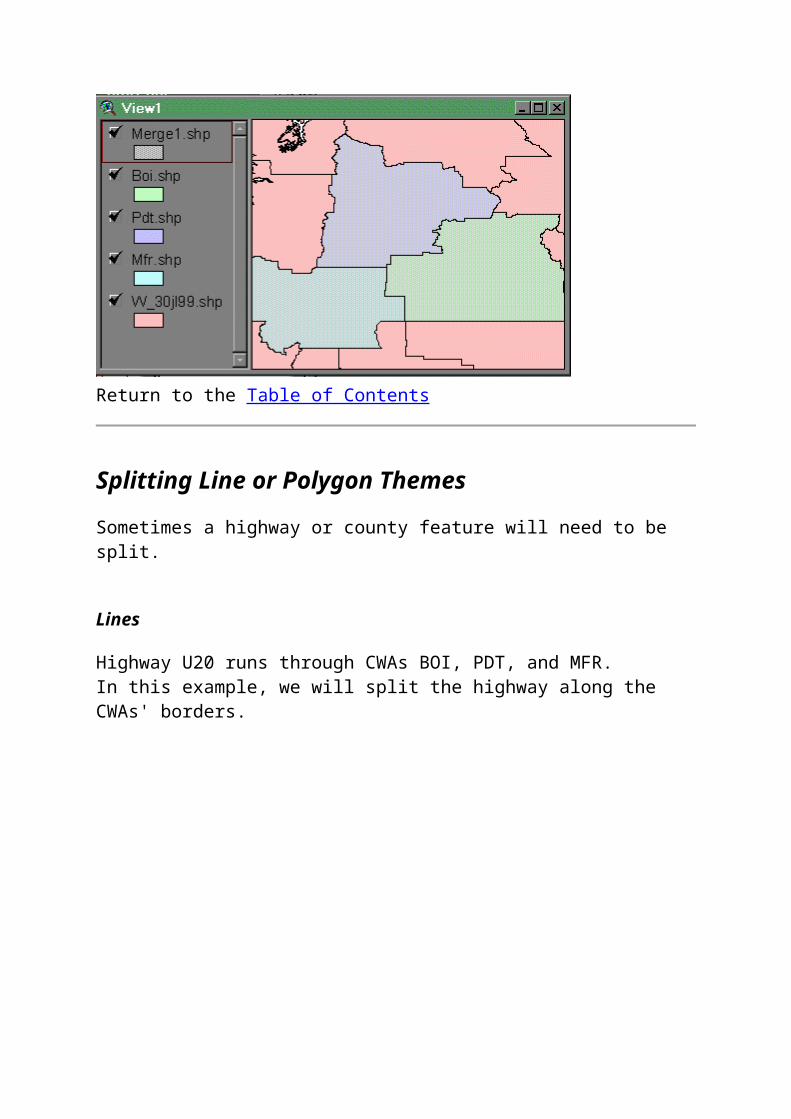
Splitting Line or Polygon Themes
Sometimes a highway or county feature will need to be split.
Lines
Highway U20 runs through CWAs BOI, PDT, and MFR.In this example, we will split the highway along the CWAs' borders.
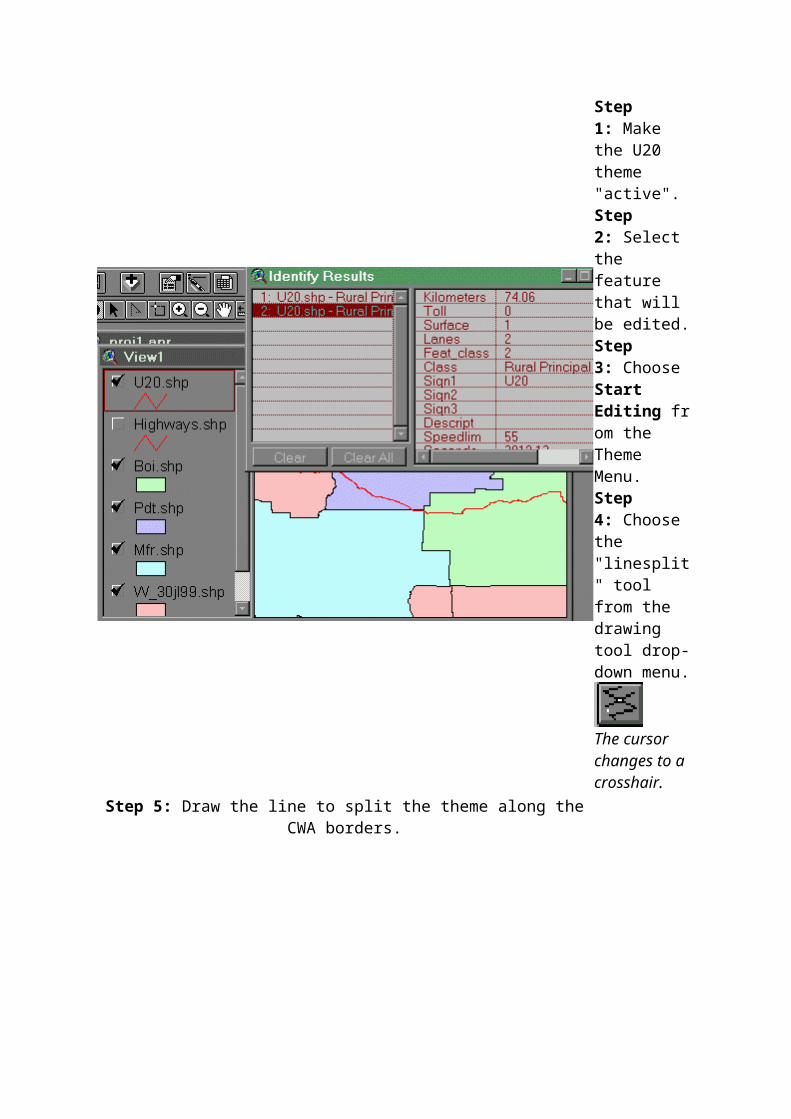
Step 1: Make the U20 theme "active".Step 2: Select the feature that will be edited.Step 3: Choose Start Editing from the Theme Menu.Step 4: Choose the "linesplit" tool from the drawing tool drop-down menu.
The cursor changes to a crosshair.
Step 5: Draw the line to split the theme along theCWA borders.
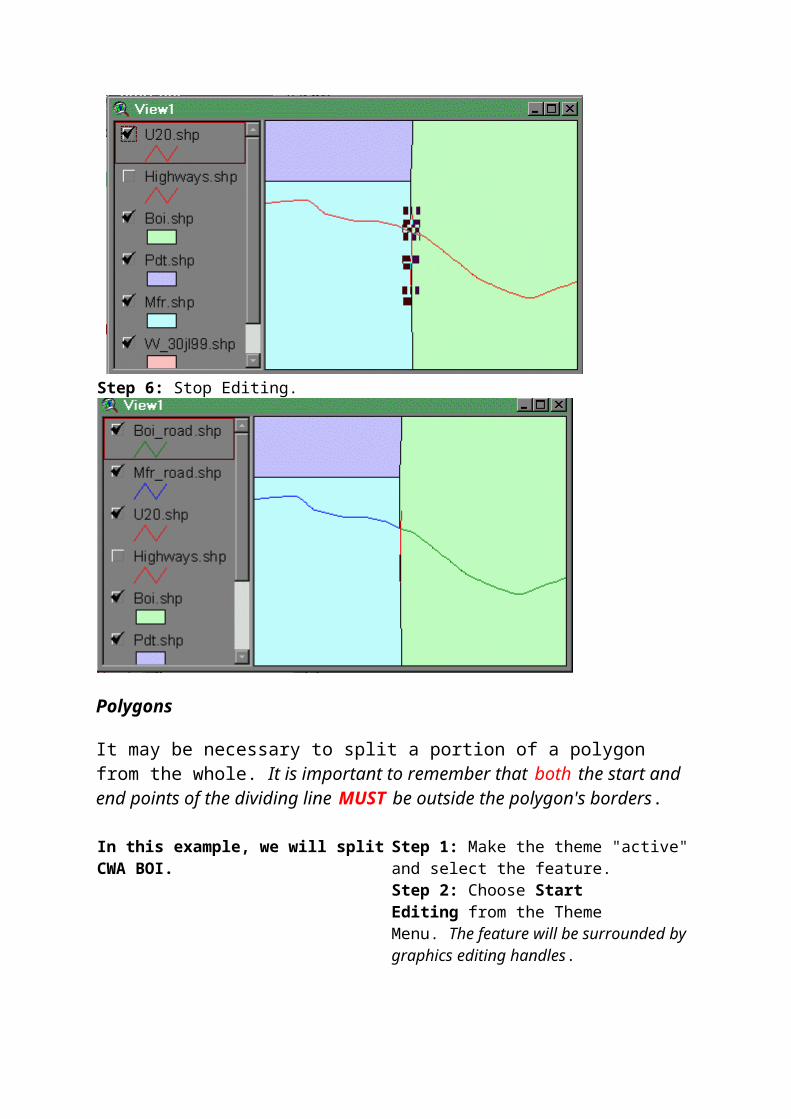
Step 6: Stop Editing.
Polygons
It may be necessary to split a portion of a polygon from the whole. It is important to remember that both the start and end points of the dividing line MUST be outside the polygon's borders.
In this example, we will splitCWA BOI.
Step 1: Make the theme "active"and select the feature.Step 2: Choose Start Editing from the Theme Menu. The feature will be surrounded by graphics editing handles.
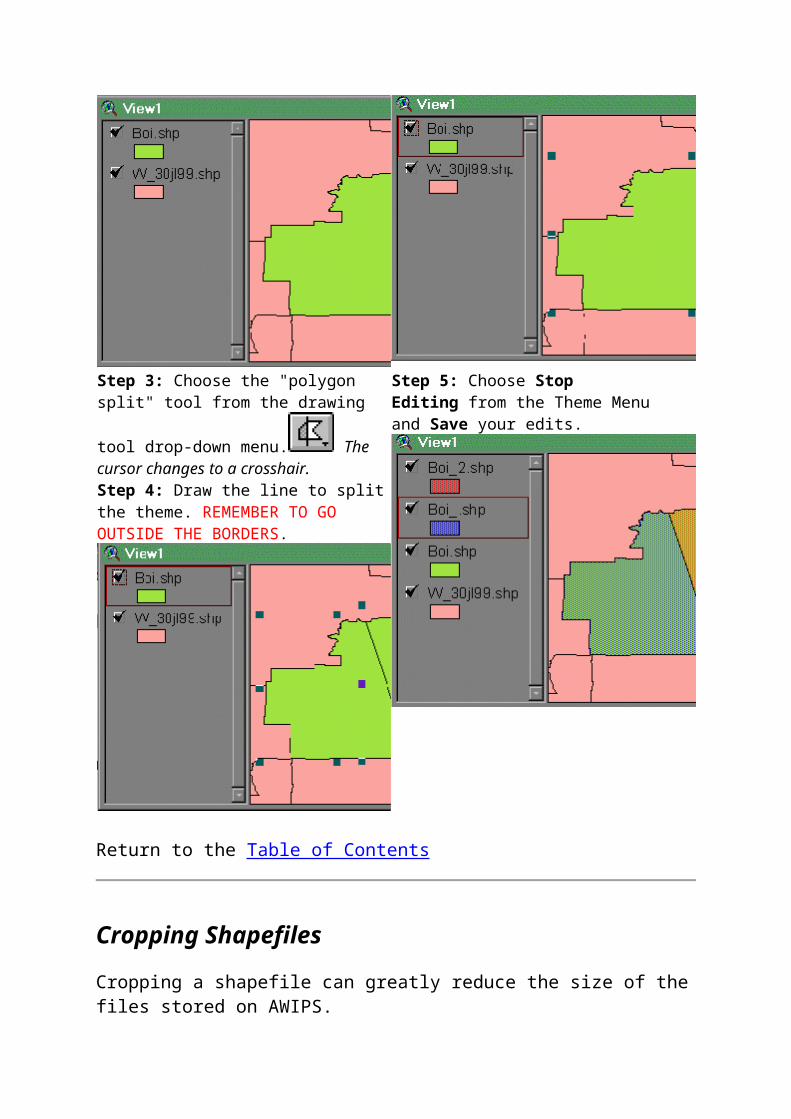
Step 3: Choose the "polygon split" tool from the drawing
tool drop-down menu. The cursor changes to a crosshair.Step 4: Draw the line to splitthe theme. REMEMBER TO GO OUTSIDE THE BORDERS.
Step 5: Choose Stop Editing from the Theme Menu and Save your edits.
Return to the Table of Contents
Cropping Shapefiles
Cropping a shapefile can greatly reduce the size of thefiles stored on AWIPS.
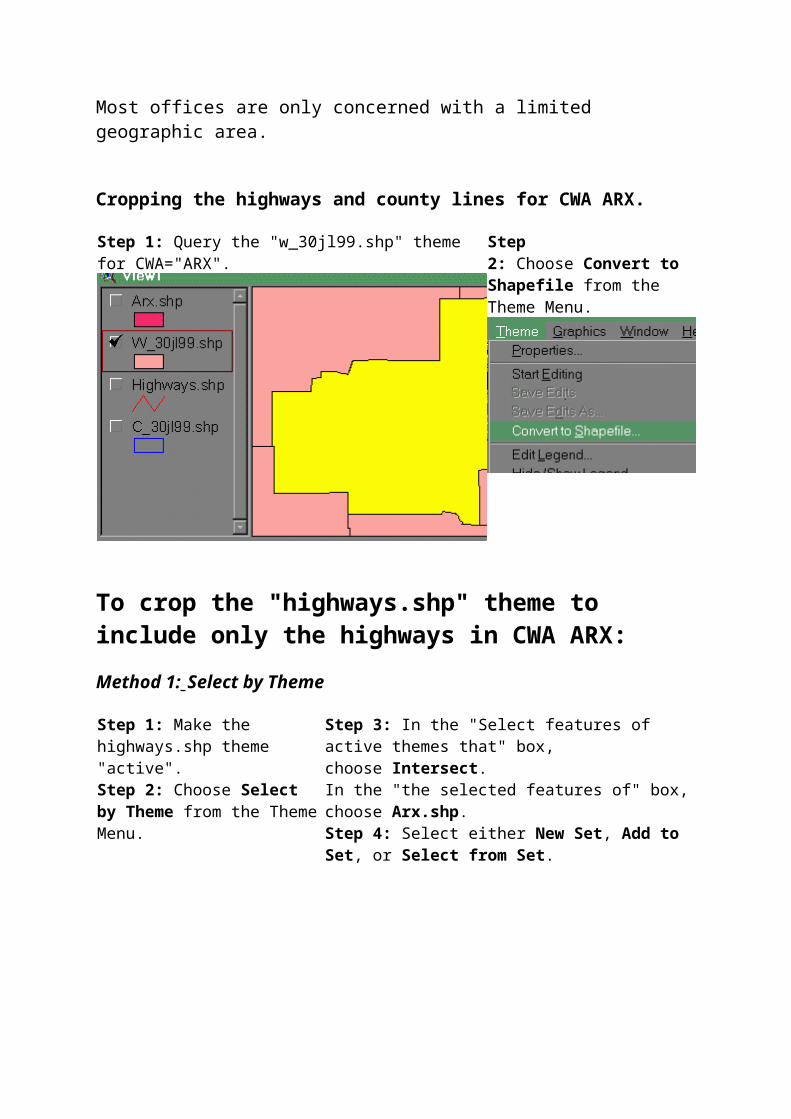
Most offices are only concerned with a limited geographic area.
Cropping the highways and county lines for CWA ARX.
Step 1: Query the "w_30jl99.shp" theme for CWA="ARX".
Step 2: Choose Convert to Shapefile from the Theme Menu.
To crop the "highways.shp" theme to include only the highways in CWA ARX:Method 1: Select by Theme
Step 1: Make the highways.shp theme "active".Step 2: Choose Select by Theme from the ThemeMenu.
Step 3: In the "Select features of active themes that" box, choose Intersect.In the "the selected features of" box,choose Arx.shp.Step 4: Select either New Set, Add to Set, or Select from Set.
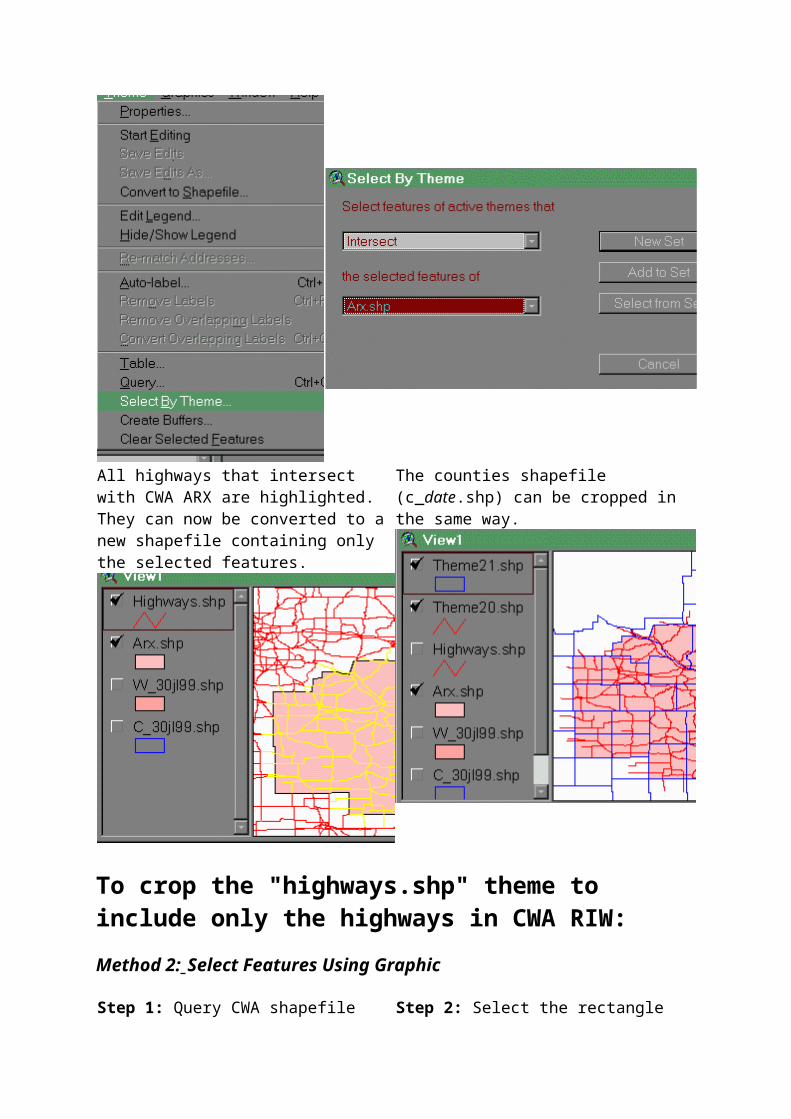
All highways that intersect with CWA ARX are highlighted.They can now be converted to anew shapefile containing only the selected features.
The counties shapefile (c_date.shp) can be cropped in the same way.
To crop the "highways.shp" theme to include only the highways in CWA RIW:Method 2: Select Features Using Graphic
Step 1: Query CWA shapefile Step 2: Select the rectangle
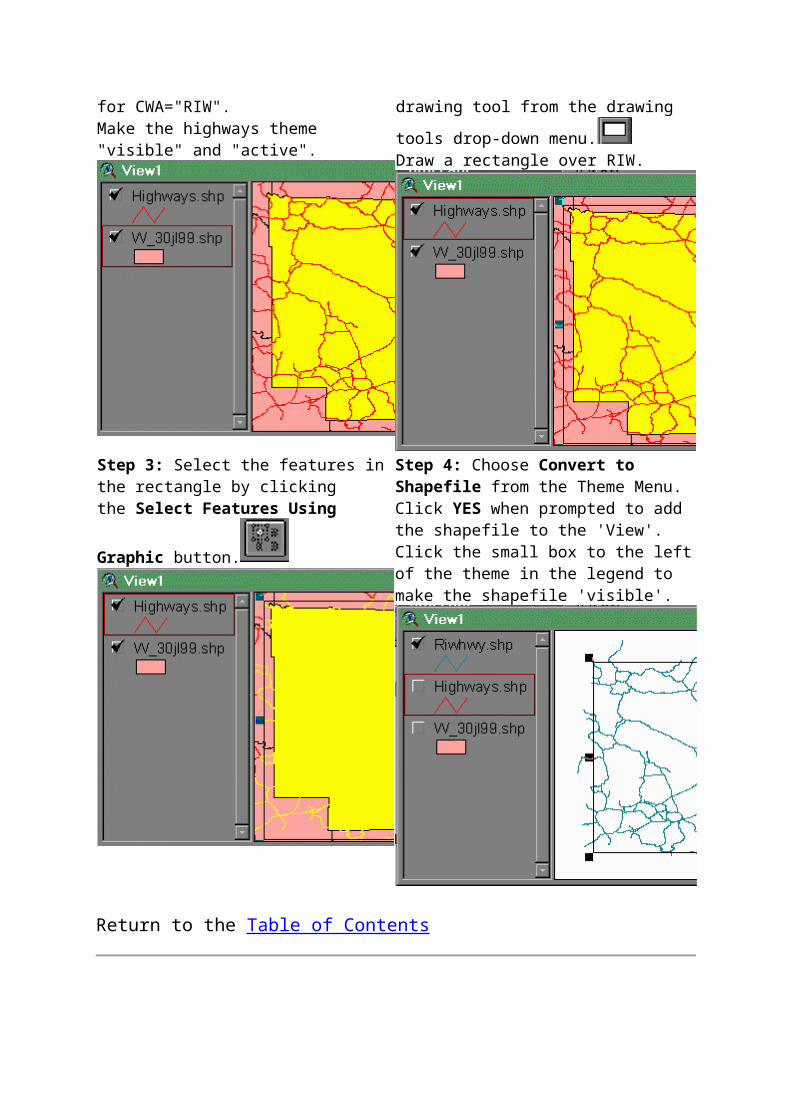
for CWA="RIW".Make the highways theme "visible" and "active".
drawing tool from the drawing tools drop-down menu.Draw a rectangle over RIW.
Step 3: Select the features inthe rectangle by clicking the Select Features Using
Graphic button.
Step 4: Choose Convert to Shapefile from the Theme Menu.Click YES when prompted to add the shapefile to the 'View'.Click the small box to the leftof the theme in the legend to make the shapefile 'visible'.
Return to the Table of Contents
Handling Images
Digital Elevation Models
This section shows how to load and register the National Geophysical Data Center (NGDC) 30 arcsec Digital Terrain Model (DTM) into ArcView.
DTMs are known as Digital Terrain Maps or Digital Elevation Models(DEM). Four files will be needed to load and register this DTM, as described below. (The AMDC mirrors the NGDC 30 arcsec CONUS DTM as file "ustopo.bil", and provides working samples for the Header, World and Color files). The four files are:
Image File (*.bil):DTMs are usually organized as "Band Interleaved by Line" (BIL). The data values are usually bytes (8 bits)or integers (16 bits) starting with the upper left "pixel", ordered from left to right, and then line by line from top to bottom. (North is up.) Other image formats recognized by ArcView 3.1 include "Band Interleaved by Pixel" (BIP) and "Band Sequential" (BSQ). The *.bil image format is defined in ArcView 3.1Help Topic "BSQ, BIL, BIP", and is a binary file.
Header File (*.hdr):The header (text) file describes the image using the keyword value format. The entries can be in any order; and, default values are provided for most keywords if they are omitted. The contents for AMDC file "ustopo.hdr" are as follows:nrows 3240ncols 4080nbands 1
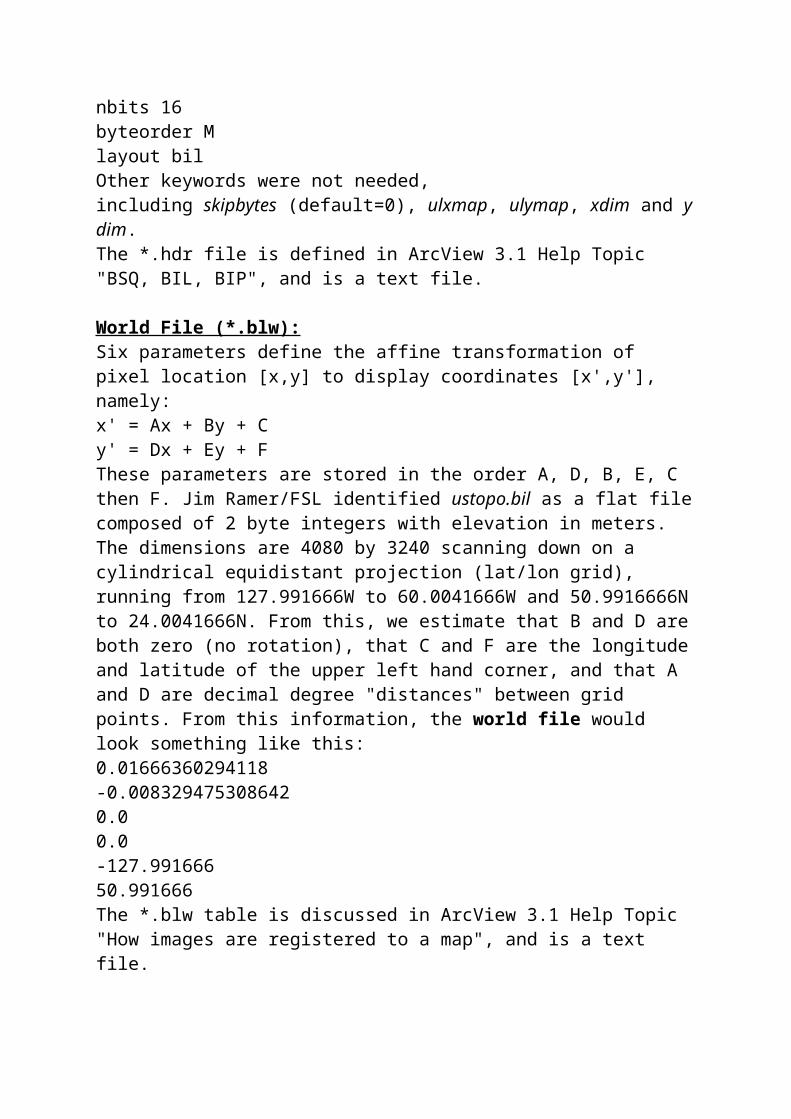
nbits 16byteorder Mlayout bilOther keywords were not needed, including skipbytes (default=0), ulxmap, ulymap, xdim and ydim.The *.hdr file is defined in ArcView 3.1 Help Topic "BSQ, BIL, BIP", and is a text file.
World File (*.blw):Six parameters define the affine transformation of pixel location [x,y] to display coordinates [x',y'], namely:x' = Ax + By + Cy' = Dx + Ey + F These parameters are stored in the order A, D, B, E, C then F. Jim Ramer/FSL identified ustopo.bil as a flat filecomposed of 2 byte integers with elevation in meters. The dimensions are 4080 by 3240 scanning down on a cylindrical equidistant projection (lat/lon grid), running from 127.991666W to 60.0041666W and 50.9916666Nto 24.0041666N. From this, we estimate that B and D areboth zero (no rotation), that C and F are the longitudeand latitude of the upper left hand corner, and that A and D are decimal degree "distances" between grid points. From this information, the world file would look something like this:0.01666360294118-0.0083294753086420.00.0-127.99166650.991666The *.blw table is discussed in ArcView 3.1 Help Topic "How images are registered to a map", and is a text file.
Color Look Up Table (*.clr): (This is optional). The *.clr file is defined in ArcView 3.1 Help Topic "BSQ, BIL, BIP", and is a text file.Loading to ArcView 3.1 GIS:Once all four files have been defined and properly named, simply Add Image Theme and select the *.bil image file. For the NGDC 30 arcsec CONUS DTM, be sure that theView/Properties/Projection is set to Projections of the World, Geographic (lat/lon). Available AMDC images of ustopo.bil include a CONUS view and a view of CO, UTand WY with Zones and Rivers.
Return to the Table of Contents
Moving Shapefiles to AWIPSSee Question 5, How do I add maps to AWIPS?, on the AWIPS Shapefile FAQs webpage.
To see your changes adopted by the national dataset, send your changed shapefile to the NWS HQ AWIPS Map Database Catalog, c/o David Vercelli/NWS MSIG.
Return to the Table of Contents
More InformationArcView is a sophisticated GIS software package with many features not discussed in this tutorial.This tutorial's purpose is to enable the user to be immediately productive with the software.
For more detailed information, consult the "Using ArcView GIS" manual included with the ArcView software or visit ESRI's online help at http://www.esri.com.For specific questions related to NWS shapefiles, contact Ira Graffmanat 301-713-0763 ext. 104
To subscribe to the ESRI and ArcView mail lists, go to http://www.esri.com/usersupport/support/selfhelp/lists-sub.html
Information and spatial databases for NWS AWIPS are maintained by the NWS AWIPS Program Office, Deployment Division.The data and documents contained herein are freely available for public reuse and disribution at http://isl715.nws.noaa.gov/mapdata/.
Return to the Table of Contents
AcknowledgementsThanks to the following individuals for their efforts in production and review of this tutorial:Kevin Schrab (Western Region SSD), Ira Graffman OST/SEC, Dave Vercelli (NESDIS), Matt Foster (Shreveport WFO), Dan Koch (Midland WFO), Andy Patrick (Corpus Christi WFO), Marcus Cole (NOAA),Susan Beckwithand Bernard Meisner (Southern Region SSD), and Laurie Hermes (Eastern Region SSD). Partial support for the development of "GIS Meteorology" has been provided by NWS Contract 52-DGNW-2-00054, Systems Engineering and Technical Support Services (SETSS), under the directionof David Vercelli. Additional support has been providedby George Mason University, by permission of Dr. Rich Diecchio, Chairman, Department of Geography. The following individuals have contributed significantly to

the concept of "GIS Meteorology": NWS: David Vercelli, Naba Barkakati, Bill Carrigg and Mike Heathfield; SAO: Roger Shriver; ESRI: David Beddoe, Bill Ehrhardt and Mark Smith; USDA: Ray Motha and Al Peterlin.
Return to the Table of Contents
Last Updated: May 2000
Related Documents