USING A THEORY OF PLANNED BEHAVIOR APPROACH TO ASSESS PRINCIPALS’ PROFESSIONAL INTENTIONS TO PROMOTE DIVERSITY AWARENESS BEYOND THE LEVEL RECOMMENDED BY THEIR DISTRICT A Dissertation by EDITH SUZANNE LANDECK Submitted to the Office of Graduate Studies of Texas A&M University in partial fulfillment of the requirements for the degree of DOCTOR OF PHILOSOPHY December 2006 Major Subject: Curriculum and Instruction brought to you by CORE View metadata, citation and similar papers at core.ac.uk provided by Texas A&M University

Welcome message from author
This document is posted to help you gain knowledge. Please leave a comment to let me know what you think about it! Share it to your friends and learn new things together.
Transcript

USING A THEORY OF PLANNED BEHAVIOR APPROACH TO ASSESS
PRINCIPALS’ PROFESSIONAL INTENTIONS TO PROMOTE DIVERSITY
AWARENESS BEYOND THE LEVEL RECOMMENDED BY THEIR DISTRICT
A Dissertation
by
EDITH SUZANNE LANDECK
Submitted to the Office of Graduate Studies of Texas A&M University
in partial fulfillment of the requirements for the degree of
DOCTOR OF PHILOSOPHY
December 2006
Major Subject: Curriculum and Instruction
brought to you by COREView metadata, citation and similar papers at core.ac.uk
provided by Texas A&M University
USING A THEORY OF PLANNED BEHAVIOR APPROACH TO ASSESS
PRINCIPALS’ PROFESSIONAL INTENTIONS TO PROMOTE DIVERSITY
AWARENESS BEYOND THE LEVEL RECOMMENDED BY THEIR DISTRICT
A Dissertation
by
EDITH SUZANNE LANDECK
Submitted to the Office of Graduate Studies of Texas A&M University
in partial fulfillment of the requirements for the degree of
DOCTOR OF PHILOSOPHY
Approved by: Chair of Committee, Patricia J. Larke Committee Members, Linda Skrla G. Patrick Slattery, Jr. Juan Lira Head of Department, Dennie L. Smith
December 2006
Major Subject: Curriculum and Instruction
iii
ABSTRACT
Using a Theory of Planned Behavior Approach to Assess
Principals’ Professional Intentions to Promote Diversity Awareness
Beyond the Level Recommended by Their District. (December 2006)
Edith Suzanne Landeck, B.B.A., St. Mary’s University of San Antonio, Texas;
M.B.A.-I.T., Laredo State University;
M.S.E., Texas A&M International University
Chair of Advisory Committee: Dr. Patricia J. Larke
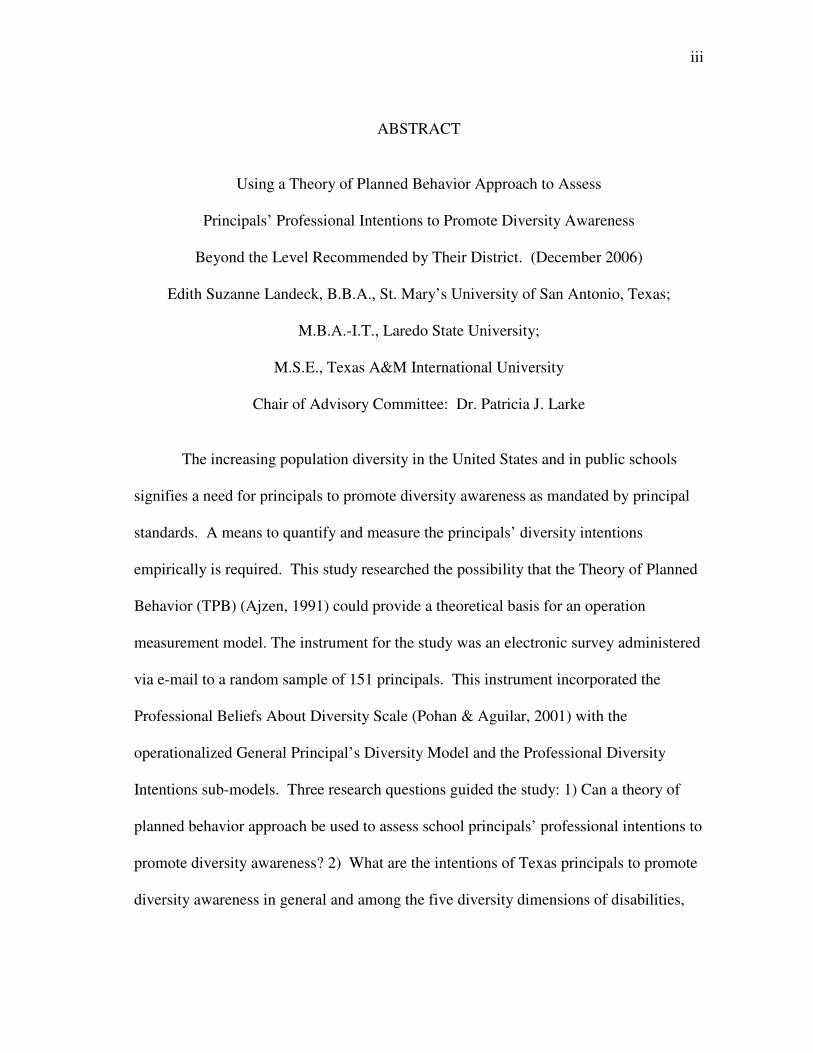
The increasing population diversity in the United States and in public schools
signifies a need for principals to promote diversity awareness as mandated by principal
standards. A means to quantify and measure the principals’ diversity intentions
empirically is required. This study researched the possibility that the Theory of Planned
Behavior (TPB) (Ajzen, 1991) could provide a theoretical basis for an operation
measurement model. The instrument for the study was an electronic survey administered
via e-mail to a random sample of 151 principals. This instrument incorporated the
Professional Beliefs About Diversity Scale (Pohan & Aguilar, 2001) with the
operationalized General Principal’s Diversity Model and the Professional Diversity
Intentions sub-models. Three research questions guided the study: 1) Can a theory of
planned behavior approach be used to assess school principals’ professional intentions to
promote diversity awareness? 2) What are the intentions of Texas principals to promote
diversity awareness in general and among the five diversity dimensions of disabilities,
iv
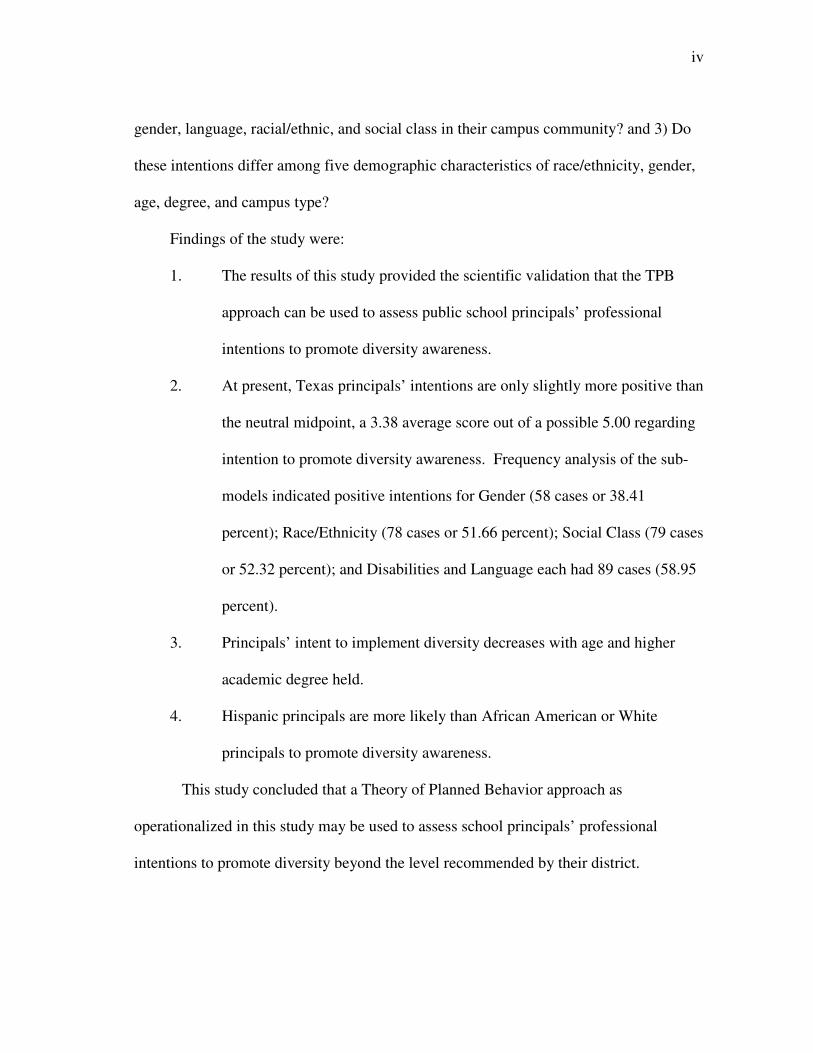
gender, language, racial/ethnic, and social class in their campus community? and 3) Do
these intentions differ among five demographic characteristics of race/ethnicity, gender,
age, degree, and campus type?
Findings of the study were:
1. The results of this study provided the scientific validation that the TPB
approach can be used to assess public school principals’ professional
intentions to promote diversity awareness.
2. At present, Texas principals’ intentions are only slightly more positive than
the neutral midpoint, a 3.38 average score out of a possible 5.00 regarding
intention to promote diversity awareness. Frequency analysis of the sub-
models indicated positive intentions for Gender (58 cases or 38.41
percent); Race/Ethnicity (78 cases or 51.66 percent); Social Class (79 cases
or 52.32 percent); and Disabilities and Language each had 89 cases (58.95
percent).
3. Principals’ intent to implement diversity decreases with age and higher
academic degree held.
4. Hispanic principals are more likely than African American or White
principals to promote diversity awareness.
This study concluded that a Theory of Planned Behavior approach as
operationalized in this study may be used to assess school principals’ professional
intentions to promote diversity beyond the level recommended by their district.

v
DEDICATION
This study is dedicated to my parents, Marie Carrola and Dr. Michael Landeck,
for instilling a desire for knowledge and helping to forward my academic career. My
parents had to work many years before they were able to pursue their education, and did
so against great odds; both were the first generation of their families that went to college.
Their example makes me very grateful for the opportunities and blessings that I have
received. Thank you both for everything! Also, I dedicate this study to my beloved son,
Heinz Joseph, for enriching my life. He is living evidence of the often unseen hand of
the Divine.
vi
ACKNOWLEDGEMENTS
I would like to thank and acknowledge Dr. Patricia J. Larke, my committee
chair, for her leadership and guidance throughout my classes and dissertation. I would
also like to acknowledge Drs. Juan Lira, Linda Skrla, and Patrick Slattery, members of
my committee who were very instrumental in shaping the dissertation process. I would
also like to thank Dr. Rosa Maria Vida for her instrumental role in establishing the
doctoral program in Laredo, which made my studies (and those of my colleagues) at this
level possible. I would also like to thank all the professors in my Alternative
Certification Program for their innovation and belief in their students. A final
acknowledgement is to GeorgeAnne Reuthinger, Esther Buckley, and our fellow
students who comprised the initial cohorts of PhD students from Laredo to undertake
doctoral studies at Texas A&M. This involved a plethora of twelve hour round-trip
commutes to the campus, summers away from home and loved ones, and many job
changes; yet, these educators not only persevered, they provided support every step of
the way.

vii
TABLE OF CONTENTS Page
ABSTRACT…………………………………………………..................... iii
DEDICATION………………………………………………...................... v
ACKNOWLEDGEMENTS………………………………….........……..... vi
LIST OF FIGURES……………………………………………..……….... ix
LIST OF TABLES…………………………...………………..…….......... x
CHAPTER
I INTRODUCTION……………………………………………… 1
Statement of the Problem……………………………………… 3 Purpose of the Study…………………………………………… 3
Research Questions…………………………………………….. 3 Significance of the Study………………………………………. 4 Theoretical Base for the Study…………………………………. 5 Definitions……………………………………………………… 6 Assumptions……………………………………………………. 8 Delimitations…………………………………………………… 8 Organization of Study………………………………………….. 8
II REVIEW OF LITERATURE…………………………………… 9 Principals…………………………………………………… …. 9 Role of Principals………………………………………………. 11 Principal Leadership…………………………………………… 12 Diversity……………………………………………………. …. 22
Principal’s Professional Beliefs About Diversity……………… 24 Human Behavior Theories……………………………………... 30 III METHODOLOGY………………………………………………. 42 Research Design……………………………………………. …. 42 Instrumentation………………………………………………… 48 Population and Sampling Design……………………………… 51 Response Rate…………………….……...……………………. 53 Data Collection……………………………....………………… 57 Entry of Data…………………………………………………… 57
viii
CHAPTER Page IV FINDINGS OF THE STUDY…………………………………… 61 Test of the Theoretical Structure……………………………….. 62 Implementation/Measurement of Texas Principals’ Intentions Using the Confirmed Operationalized Theoretical Structure….. 76
V DISCUSSION, CONCLUSIONS, AND RECOMMENDATIONS… 93 Discussion.………………………………………………….…… 94 Conclusions………………………………………………….…… 104 Recommendations……………………………………………….. 111 REFERENCES …………..…………………………………………………... 113 APPENDIX A INSTRUMENT…...…………….……………………….….... 124
APPENDIX B IRB…………………………………………………………... 130
VITA………………………………………………………….....……………. 132
ix
LIST OF FIGURES
FIGURE Page
1.1 The General Principal’s Diversity Intentions (GPDI) Model……………. 6
2.1 Rosenberg’s Basic Attitude Model… ……………………………..…….. 31
2.2 Fishbein’s Attitude Model……………………….………………….…… 32
2.3 Fishbein and Ajzen’s Theory of Reasoned Action Attitude Model…..… 34
2.4 The Theory of Reasoned Action Research Model...…………………… 35
2.5 Ajzen’s Theory of Planned Behavior Model…………………………… 38
2.6 The Theory of Planned Behavior Research Model……………………. 39
2.7 The General Principal’s Diversity Intentions Model…………………… 40
3.1 The Operationalized General Principal’s Diversity Intentions Model… 43
3.2 Operationalized Principal’s Diversity Intentions (PDI) Model for Disabilities Diversity………………………………………………. 45
3.3 Operationalized PDI Model for Gender Diversity……………………… 45
3.4 Operationalized PDI Model for Language Diversity…………………… 46
3.5 Operationalized PDI Model for Racial/Ethnic Diversity……………….. 46
3.6 Operationalized PDI Model for Social Class Diversity………………… 47
x
LIST OF TABLES
TABLE Page
3.1 Acronyms for Five Diversity Sub-Models…………………………… 47
3.2 Comparison of Principal Ethnicity by Total Population, Sample, and Usable Responses Received………………………………………….. 54
3.3 Comparison of Principal Gender by Total Population, Sample, and
Usable Responses Received………………………………………….. 55
3.4 Comparison of Principal by Education Service Center Region by Total Population, Sample, and Usable Responses Received…………. 56
4.1 Kolmogorov-Smirnov Tests for Normality of the Data Distribution… 63
4.2 Regression Data Tolerance and Variance Inflation Factor Scores…… 65
4.3 Item Total Correlations and Cronbach Alpha If-Item-Deleted Scores
for the Professional Beliefs About Diversity Scale…………………... 68
4.4 Assessment of the Regression Models Fit……………………………. 69
4.5 B, Beta, and t-Test Scores for the General Principal’s Diversity Intentions and the Principal’s Diversity Intentions Sub-Models ……. 73
4.6 Results for the General Principal’s Diversity Intentions and the
Principal’s Diversity Intentions Sub-Models…………..........……… 75
4.7 Principal’s Ethnicity by Campus Group Grade Name……………….. 77
4.8 Principal’s Level of Education by Degree……………………………. 78
4.9 Principal’s Work Location by Type of Area…………………………. 78
4.10 Principals by Campus Grade Group Name………………………….. 79
4.11 Principal’s Gender by Campus Grade Group Name…………………. 80

xi
TABLE Page
4.12 Respondent’s Ethnicity by Campus Group Grade Name……………. 81
4.13 Respondent's Level of Education by Degree………………………… 81
4.14 Respondent’s Work Location by Type of Area…….………………. 82
4.15 Respondents by Campus Grade Group Name……………………….. 83
4.16 Respondent’s Gender by Campus Grade Group Name……………… 83
4.17 Means and Standard Deviations for the General Principal’s Diversity Intentions Model and the Principal’s Diversity Intentions Sub-Models………………………………………………………………… 85
4.18 Measures of Centrality for Intentions on the GPDI and PDI Models… 86
4.19 Frequency Table for Average Intentions Diversity on GPDI & PDI
Models………………………………………………………………… 88
4.20 Analysis of Variance for Race/Ethnicity Covariate…………………… 90
4.21 Analysis of Variance for Degree Covariate …………………………. 90
4.22 Analysis of Variance for Gender Covariate………………………….. 91
4.23 Analysis of Variance for Age Covariate…………………................... 91
4.24 Analysis of Variance for Campus Type Covariate................................ 92
1
CHAPTER I
INTRODUCTION
As diversity increases in Texas public schools, research is needed to assess the
principals’ intentions to promote diversity awareness. American principals constitute a
primary group in the process of school reform, as agents of change, as school managers,
and as leaders, especially as accountability for school outcomes increases (Smith &
Andrews, 1989; Fiore, Curtin, & Hammer, 1997). As early as 1972, the U.S. Congress
recognized the growing significance of school principalship in a published report stating
that in many ways school principals are the most important and influential individuals in
the schools (U. S. Congress, 1972). Their leadership sets the tone of the school, the
climate for learning, and the
level of professionalism the faculty. Principals must be visionary leaders and expert
managers in a changing societal context (Richard, 2000; Holland, 2004) that dictates the
need for diversity awareness.
Through the last quarter of the twentieth century, demands on both schools and
principals have increased dramatically. Society is becoming more diverse than ever
before in its history, and many of our school systems reflect this diversity in their student
populations. Today, one-third of the entire student population in America consists of
students of color, and by the year 2020 it is predicted that this segment will increase to
one-half of the school age population (McCray, Wright, & Beachum, 2004).
_______________ This dissertation proposal follows the style and format of the American Educational Research Journal.
2
School principals must take the lead by incorporating multicultural concepts and
ideas into the school’s culture in order to address the increasing diversity of students and
staff, since the principals set the climate for cultural acceptance for the school (McCray,
et al., 2004). The promotion of an awareness of diversity is an element of the Texas
standards for principal preparation, assessment, and certification (Texas Administrative
Code, 2005, Title 19, part 7, chapter 241, section 241.1.a). Leadership in addressing
diversity occurs in a context with the principal’s other duties, that includes acting as the
executive officer, coordinator, motivator, expert, advisor, mediator, interpreter,
supervisor, evaluator, democratic example, and advocate (Combs, 1994). Principals are
also expected to serve as building managers, personnel administrators, change agents,
boundary spanners, disciplinarians, cheerleaders, and instructional leaders (Smith &
Andrews, 1989; Fiore, Curtin, & Hammer, 1997).
These and other varied principal role descriptions were consolidated into five
broad areas by the National Center for School Leadership. These five areas are: (a)
defining and communicating the school's educational mission; (b) coordinating
curriculum; (c) supervising and supporting teachers; (d) monitoring student progress;
and (e) nurturing a positive learning climate (Blase, 1987). The last element of the
principal’s role description includes the principal’s interaction with diversity, as the
principal should create diversity awareness within the school that allows the school to
become all encompassing and democratic (McCray, et al., 2004; Capper, 1993;
Stainback & Stainback, 1990).
3
Statement of the Problem
“How well our younger generation adapts to an increasingly diverse world may
well depend on their experiences at school” (Blair, 2000, p. 1). As diversity becomes
more prevalent throughout our nation and in our schools, the question has arisen as to
whether principals are incorporating this societal shift toward increasing levels of
diversity in their formulations of campus goals and in developing strategies that can lead
toward attainment of these goals. Because principals set the tone for the school’s culture
and provide the proper vision for the direction of the institution, it is imperative that their
attitudes and intentions in promoting an awareness of diversity in their campus
communities be identified and examined (McCray et al., 2004).
Purpose of the Study
The purpose of the study is to provide an empirical theoretical base that could
measure and explain principals’ diversity awareness related behavioral intentions. The
study is designed to operationalize and utilize empirical theoretical concepts related to
the principal’s diversity awareness intention model. This study sought to quantitatively
evaluate Texas principals’ intentions in promoting an awareness of diversity within
campus communities.
Research Questions
The research questions in this study are:
1. Can a theory of planned behavior approach be used to assess school principals’
professional intentions to promote diversity awareness?
4
2. What are the intentions of Texas principals to promote diversity awareness in
general and among the five diversity dimensions of disabilities, gender, language,
racial/ethnic, and social class in their campus community? and
3. Do these intentions differ among five demographic characteristics of
race/ethnicity, gender, age, degree, and campus type?
Further, in accordance with the theory of planned behavior (Ajzen, 1991), research was
performed to measure the following three concepts for diversity in general and for each
of the previously mentioned types of diversity by: (a) the attitudes of principals towards
promoting diversity awareness; (b) the perceptions that principals have regarding
subjective norms (the level of approval that they expect from peers whose professional
opinion they value), if they were to promote diversity awareness; and (c) the perceived
behavioral control (degree of difficulty) that the principal expects in promoting
awareness of diversity (Ajzen, 1991; Zint, 2002; Pohan & Aguilar, 2001).
Significance of the Study
Population in U. S. public schools predicts the dramatic transformation of
American society occurring in the next generation. This society’s school-age population
is much more diverse than the older population (Blair, 2000). In the year 2020, half of
all students in American school systems will be students of color, as compared to one
third of the student population today (Patrick & Reinhartz, 1999; McCray, Beachum, &
Wright, 2004). Increasing diversity in our nation and schools dictates the need for the
school principals to play a central role in initiating and implementing multicultural
concepts and ideas into school cultures. This is primarily due to the fact that the
5
principal’s leadership is responsible for setting the cultural climate for the school
(Decker, 1997). An examination is needed to determine principals’ intentions to
promote diversity awareness on campus because “school leaders must create
environments that promote cultural pluralism and provide every student with an
opportunity to succeed” (McCray, et.al., 2004, p. 112). This study utilizes the Theory of
Planned Behavior (Ajzen, 1991) as the foundation for an empirical model to measure
principals’ intentions to promote diversity awareness on campus. The yield of this
instrument revealed the principals’ attitudes, subjective norms, and perceived behavioral
control to promote diversity awareness on campus. As a result, it is expected that
academicians, practitioners, policy makers, and the public at large will be provided with
an empirically sound tool for measuring, better understanding, and planning possible
contributions that principals could make toward the common societal goal of increasing
diversity awareness in general, and in Texas public school campuses, in particular.
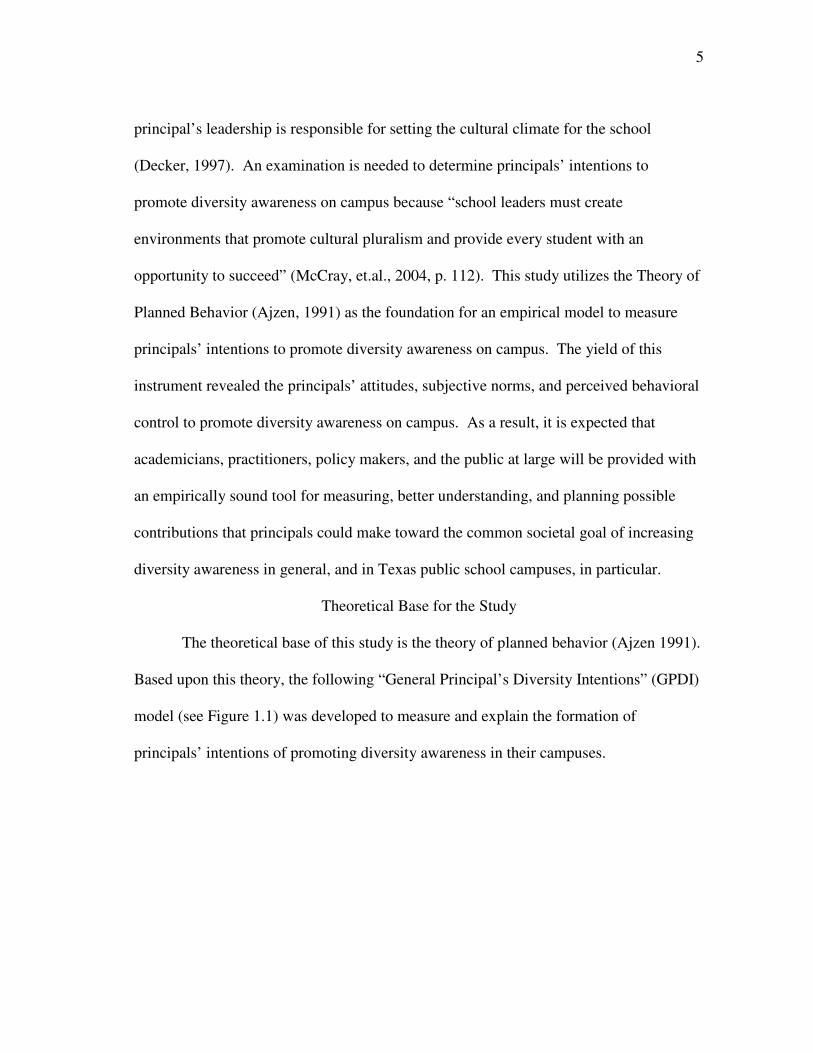
Theoretical Base for the Study
The theoretical base of this study is the theory of planned behavior (Ajzen 1991).
Based upon this theory, the following “General Principal’s Diversity Intentions” (GPDI)
model (see Figure 1.1) was developed to measure and explain the formation of
principals’ intentions of promoting diversity awareness in their campuses.
6
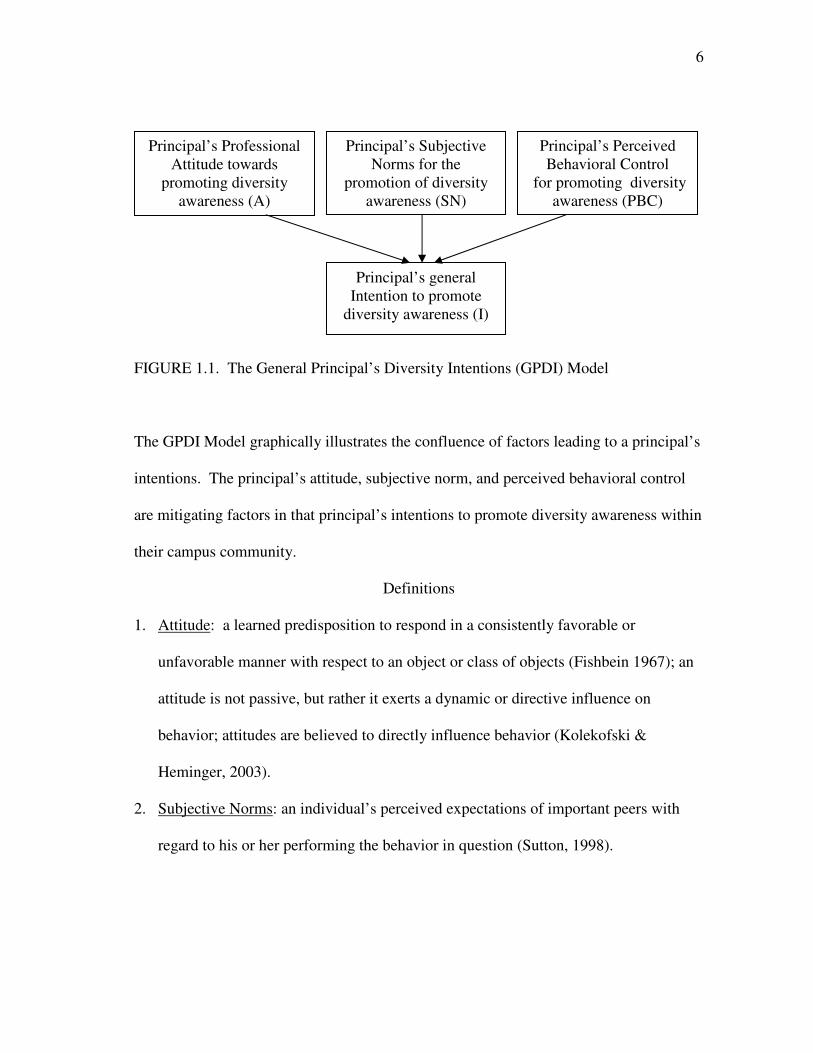
FIGURE 1.1. The General Principal’s Diversity Intentions (GPDI) Model
The GPDI Model graphically illustrates the confluence of factors leading to a principal’s
intentions. The principal’s attitude, subjective norm, and perceived behavioral control
are mitigating factors in that principal’s intentions to promote diversity awareness within
their campus community.
Definitions
1. Attitude: a learned predisposition to respond in a consistently favorable or
unfavorable manner with respect to an object or class of objects (Fishbein 1967); an
attitude is not passive, but rather it exerts a dynamic or directive influence on
behavior; attitudes are believed to directly influence behavior (Kolekofski &
Heminger, 2003).
2. Subjective Norms: an individual’s perceived expectations of important peers with
regard to his or her performing the behavior in question (Sutton, 1998).
Principal’s Professional Attitude towards
promoting diversity awareness (A)
Principal’s Subjective Norms for the
promotion of diversity awareness (SN)
Principal’s Perceived Behavioral Control
for promoting diversity awareness (PBC)
Principal’s general Intention to promote
diversity awareness (I)

7
3. Perceived Behavioral Control: the extent to which the individual feels he or she has
control over performing the behavior, or the perceived ease of performing the
behavior (Sutton, 1998).
4. Intention: an individual’s plan to perform a given behavior (Fishbein, 1967).
5. Diversity: various population characteristics of race and/or ethnicity, social class,
gender, religion, languages, and sexual orientation, inclusive of historically
marginalized socio-cultural groups present in society (Pohan & Aguilar, 2001).
Diversity references the differences among people that may be categorized in terms
of economic groups, languages, ability, age, and sexual orientation (Grant & Ladson-
Billings, 1997). Noack (2004) defines diversity as a commitment to establishing a
safe and nurturing inclusive community that values and celebrates the human
characteristics that make an individual unique, inclusive of age, disability, ethnicity,
gender, national origin, race, religion, sexual orientation, and socioeconomic
background. Also, disabilities diversity references visible and non-visible
disabilities. Language diversity may refer to different languages as well as dialects
spoken. Gender diversity references the female, intersexed, male, and transgendered
categories (Noack, 2004). However, only the traditional female and male categories
of gender were used for reporting purposes to the Texas Education Agency and are
referenced as such in this study.
6. Dimensions of Diversity: the specific sub-types of diversity as defined by Pohan and
Aguilar (2001) including disabilities diversity, gender diversity, language diversity,
8
racial/ethnic diversity, religious diversity, sexual orientation, and social class
diversity.
Assumptions
1. It is assumed that the random sample of full-time, public school principals serving on
regular instructional campuses in Texas during the 2004-2005 school year are
representative of the total principal population in Texas.
2. It is assumed that the subjects of this study will respond to the survey questionnaire
in a manner that most closely reflects their true professional perceptions and
opinions.
Delimitations
This study included only those full-time, public school principals serving on
regular instructional campuses in Texas during the 2004-2005 school year. Also, the
relationships between the covert behavior (intentions) and overt behavior (the
implementation of the intentions) are not a part of this study. That type of relationship
must be measured through a longitudinal study that would allow for time to pass so that
principals could have the opportunity to implement that which they intended.
Organization of Study
The organization of this study will follow the following format. Chapter I will
present an introduction to the subject of this study. Chapter II will provide a literature
review of the relevant research on the topics addressed in the study. Chapter III will
cover the methodology for the study. Chapter IV will present the findings of the study;
and Chapter V will address the study’s discussions, conclusions, and recommendations.

9
CHAPTER II
REVIEW OF LITERATURE
This review of literature is divided into the following sections: principals,
diversity, principal’s professional beliefs regarding diversity, human behavior theories,
and a summary of the chapter. The section on principals is organized into the areas of the
role of the principal, principal leadership, principal demographics, principal standards,
and Texas standards. The diversity section is followed by the section on principal’s
beliefs regarding diversity and addressed changing U. S. demographics and changing
Texas demographics. The section on human behavior theories examined the basic
attitude model, Fishbein’s attitude model, the theory of reasoned action, and the theory
of planned behavior.
Principals
Risius (2002) provided an excellent overview of the historical evolution of the
principalship as supported in research literature, citing sources from 1935 through 1996.
These sources reference dates as far back as 1838, and detail the emergence of the
principalship from the stages of head teacher or headmaster, to the principal as a
manager, to instructional leader, to transformational leader, and to educational leader
(Risius, 2002). Risius’ work was the primary foundation for the overview provided
below.
“No historical records exist that state the exact date of the creation of principal in
American education” as per Pierce, 1935 (Risius, 2002, p. 82). According to the
National Education Association, the head teacher or headmaster was created during the
10
colonial period and held sway until approximately 1840 (National Education
Association, 1948). “The official role of the principal is thought to have taken place in
Cincinnati in 1838” (Risius, 2002, p. 82). Cuban (1988) stated that “principals were
relieved of their teaching duties in most schools by the 1920’s, and were looked upon as
managers and supervisors” (Risius, 2002, p. 82). This was in accordance with the 1921
statement of the National Association for Elementary School Principals that a principal
should be a leader to the members of their staff. In 1948, the National Education
Association stated that teacher supervision is the duty of the school leader. This evolved
into that which Hallinger (1992) described as the principal as program manager in the
1960’s, and the principal as instructional leader in the 1970’s (Risius, 2002). In 1982,
Sweeney declared that student achievement must be the highest priority for an effective
instructional leader, and in 1992, Leithwood described the principal as transformational
leader. Wallace (1996) stated that the principal was an educational leader who
understands that learning is a lifelong process (Risius, 2002).
Combs (1994) holds that the position of principal contains the most potential for
influence on the lives of students, and that principal leadership can provide key leverage
to meet major challenges in the nation’s schools. Donaldson (2001) stated that the
principal must be able to shape the school to meet emerging needs in its environment
and among its students, especially since principals have become the primary players in
school instructional improvement programs. DiPaola and Tschannen-Moran (2003)
state “as the nation seeks significant reforms in education through standards and
accountability, it increasingly looks to principals” as there is a general belief that good

11
school principals are the cornerstones of good schools and that without a strong
principal’s leadership, efforts to raise students' achievement cannot succeed (DiPaola &
Tschannen-Moran, 2003, p. 43). There is a growing concern that the principalship may
be expanded beyond what is reasonable in a single job description. Through the last
quarter of the 20th-century, the demands on both schools and principals have
dramatically increased (Decker, 1997). Although the principalship has always been a
demanding, full-time-plus job, committees and task forces established to study
educational reform seemed to conclude that principals must simply do more.
Role of Principals
The National Policy Board for Educational Administration delineated twenty-
one performance domains in four domain groups that include the elements of a
knowledge and skill base within each domain that contribute to the foundation for
exemplary principal performance. The four domain groups are the functional,
programmatic, interpersonal, and contextual domains. The functional domains include
leadership, information, problem analysis, judgment, organizational oversight,
implementation, and delegation. The programmatic domains encompass instruction and
the learning environment, curriculum design, student guidance and development, staff
development, measurement and evaluation, and resource allocation. The interpersonal
domains comprise motivating others, interpersonal sensitivity, oral and nonverbal
expression, and written expression. The contextual domains consist of philosophical and
cultural values, legal and regulatory applications, policy and political influences, and
public relations (Thomson, 1993; Skrla, Erlandson, Reed, & Wilson, 2001).
12
Critics of this model of exemplary principal performance indicate that it is too
complex for a single person to master, while others believe that it does not go far
enough. According to Skrla, et al. (2001), mastery of the knowledge and skills within
the domains will not automatically result in an excellent or even good principal; persons
seeking the principalship must couple mastery of these elements with an additional
quality for the school to be successful. These authors define this additional quality as
purpose; other authors refer to this extra element as: “care (Beck, 1994), love
(Scheurich, 1998), respect (Ellis, 1997), morality (Bogotch, Miron, & Murray 1998;
Maxcy & Caldas, 1991), ethics (Beck & Murphy, 1997), and community (Sergiovanni,
1994), among other things” (Skrla, et al., 2001, p. 171).
Principal Leadership
Research has shown that the principalship has been expanded to include
significant responsibilities for the instructional leadership of schools, ensuring that all
children achieve to meet high standards and to assure that the needs of children with
disabilities are met (Combs, 1994; Risius, 2002). The managerial tasks of the principals
have also been expanding as regulations, reporting requirements, and e-mail access to
the principal has increased. Additional research identified the school principal as the
key figure in setting the tone for the school and assuming responsibility for instruction
(Brookover, Beamer, Efthim, Miller, & Hathaway, 1982; Edmonds, 1979). Principals
are expected to respond to accountability measures imposed by external constituents by
acting as agents of change; principals are charged with maintaining safe school
13
environments and are spending more time coping with student behavior problems
(Brookover, et al., 1982).
Research on effective schools was instrumental in the movement for principals to
be actively involved in becoming instructional leaders (Hallinger, 1992 p. 36).
Instructional leadership has emerged as a term to describe a broad set of principal roles
and responsibilities designed to address the workplace needs of successful teachers and
to foster improved achievement among students over time. The importance of effective
instructional leadership in the development of academically challenging programs has
been well documented in the literature. Principals as instructional leaders support
teachers, maintain focus on the task of the school, are good communicators, and
coordinate instructional programs (Brieve, 1972). Effective principals provide
leadership in instruction, coordinate instructional programs, and emphasize high
academic standards and expectations (Marcus, 1976; MacQueen, Wellisch, Carriere, &
Duck, 1978; Holland, 2004).
The school’s culture and principal’s leadership are powerful tools that can
encourage school community dialogue (Deal & Peterson, 1991). The protection of every
individual’s civil and human right is key to ethical leader behavior (American
Association of School Administrators Code of Ethics, 1981; Hoyle, English, & Steffy,
1998), and a school’s culture should facilitate educational empowerment and progress
for all ethnic groups (Banks, 1999). Leadership and diversity are elements that must be
at the forefront of principal’s thoughts. Principals need to be aware of the cultures and
diversity in their schools (Garrett, 2002). Principals must be well prepared to work with
14
an array of people from a variety of cultural backgrounds (Morgan, 2002). Treating all
members of the school community equally with the same dignity and fair play is pivotal
in creating an environment grounded in justice and integrity (Sergiovanni, 1992).
Principal Demographics
Literature was searched to yield possible documentation regarding profiles of
principals at the national and state levels. It is necessary to use data collected by the
National Center for Education Statistics and analyzed by Fiore, Curtin, and Hammer
(1997), the Texas Education Agency, and the work of Nelson (1983) and Combs (1994)
in order to present and describe the characteristics of principals in the State of Texas. A
1997 study conducted by Fiore, Curtin, and Hammer drew on secondary data from the
National Center for Education Statistics’ (NCES) national Schools and Staffing Survey
(SASS) that profiled American public and private school principals from 1987 through
1994. During this time period, approximately 80,000 principals served in U.S. public
schools. The majority of these principals were men, although the percentage of female
principals grew during the same time period from 25 to 34 percent. The percentage of
public school principals of color increased from 13 to 16 percent. Most principals held
more than one college degree, often in different fields of study, with over one-third
degreed in elementary education and over two-thirds of the principals degreed in
educational administration. Almost forty percent of males were likely to have been an
athletic coach prior to the principalship, whereas almost thirty percent of women had
been curriculum specialists or coordinators (Fiore, et al., 1997).
15
Data from the NCES’s 2003-2004 Schools and Staffing Survey (revised in 2006)
showed that among all public school principals, 10.6 percent were African American,
5.3 percent were Hispanic (single or multiple races), 0.6 percent were Asian/Pacific
Islander, 0.7 percent were Native American, 0.4 percent were of multiple races (non-
Hispanic), and 82.4 percent were White; there was a total of approximately 17.6 percent
principals of color. Regarding highest level of principal’s education, 0.1 percent held
less than a bachelor’s degree, 30.3 held an education specialist or professional diploma,
and 8.6 held a doctorate/first professional degree. Over two-thirds of principals had been
an assistant principal or program director. In this survey, data for principal’s gender was
not presented (Strizek, Pittsonberger, Riordan, Lyter, & Orlofsky, 2006).
The purpose of the study in Nelson’s (1983) dissertation was to present a detailed
and comprehensive description of the personal and professional characteristics of
selected elementary school principals in Texas. Nelson’s study randomly surveyed 335
Texas elementary public school principals in April 1982. The findings revealed that the
typical elementary school principal in Texas was a White male, married, and
approximately 46 years of age, whose first entry into administration occurred at 32 years
of age, with the majority having served as an elementary schoolteacher. Most Texas
elementary school principals had served only in Texas, with the majority having been
employed in only one school district. The majority of the respondents indicated they
spent one half of their day on administrative duties. Additional data produced by the
study supported the following conclusions: (a) people of color and female aspirants
would experience difficulty in securing positions as elementary school principals; (b)
16
more elementary school principals were moving to the elementary principal position
from the elementary classroom; (c) elementary school principals would have difficulty in
achieving a more ideal use of their professional time because of increasing demands
from other forces; and (d) women and principals of color were more likely to be found
serving in the larger communities of the state (Nelson, 1983).
A replication of the Nelson study was conducted by Combs (1994) to describe
the current status of the elementary principal in Texas. A factor under consideration was
the rapidly changing roles of the elementary principal in response to growing diversity
and increasing demands. Data were collected for this study using a mail-out
questionnaire sent to a random sample of 345 subjects with a return rate of 45.23
percent. Through the use of percentages, comparisons were made with the findings of
the Nelson study. The data in Combs’ study indicated that the Texas elementary
principal at that time was a White female between the ages of 45 and 54. The principal
spent at least one half of the day addressing issues involving instructional supervision.
Data also revealed that excess paperwork and the lack of assistant principals kept the
principal from devoting more time to instruction. Of the seven areas of responsibility
surveyed, principals identified increased expectations in each area that had the most
impact, including site based decision making, personnel evaluation, and staff
development training. Combs’ conclusions were that the expectations inherent in the
position of elementary principal had continued to increase both in depth and in breadth
(Combs, 1994).

17
Bandeira de Mello and Broughman (1996) conducted a state-by-state analysis of
the SASS, and presented data for Texas public school principals. This analysis showed
that in the school year 1993-1994, 23.6 percent of Texas public school principals were
people of color (15.2 percent Hispanic; 7.2 percent African American; 0.6 percent were
Asian American, and 0.6 percent were Native American). Also, 76 percent of these
principals served in campuses with enrollment for students of color at 50 percent or
more. During this same period, 41.3 percent of the principals in the state were female
and 59.7 percent were male. Elementary public school principals constituted 50.8
percent of the principals in the state and 12.8 percent served in secondary schools.
Moreover, 17.5 percent of Texas public school principals served in schools that were
classified as both elementary and secondary levels.
In Texas the State Board of Educator Certification conducted a longitudinal study
of principals in the state between 1995 and 2002. In that time frame, the number of
principals employed in Texas public schools rose from 5,664 to 6,594, representing an
overall increase of 16.4 percent. In the same period, the African American principal
population increased from 8.3 percent to 9.9 percent, the Hispanic principal population
increased from 15.6 to 17.7 percent, the Asian American principal population decreased
from 0.5 percent to 0.3 percent, the Native American principal population increased
from 0.3 percent to 0.5 percent (the inverse of the Asian American population), and the
White principal population decreased from 75.1 percent to 71.5 percent (State Board of
Educator Certification, 2002). Also during that period, the number of female principals
increased from 2,625 to 3,572, while the number of male principals decreased from
18
3,039 to 3,022. The percent of female principals changed from 46.3 percent in 1995 to
54.2 percent in 2002, while the corresponding percentage of male principals decreased
from 53.7 to 45.8 percent. It is noteworthy that in 1997 the percentages of female to
male principals were the closest (49.4 percent female to 50.6 percent male principals),
and 1998 was the year when the percentage of female principals was greater than the
percentage of male principals for the first time (State Board of Educator Certification,
2002).
Analyses of the national and state studies on principal demographics show a
variety of factors, mainly relating to a sea change in the gender and diversity
composition of principals. As the student body is rapidly becoming more ethnically
diverse, the principalship is also becoming more ethnically diverse, with more principals
of color joining the ranks through time. More women are becoming principals; however,
most secondary school principals are males. The numbers of principals having less than
a bachelor’s degree are decreasing with time, whereas the numbers of principals holding
masters degrees, doctorates, and professional diplomas or certifications are increasing.
Principal Standards
“American policy makers have come to view principals as linchpins in plans for
educational change and as a favored target for school reforms” (Hallinger, 1992. p. 35).
Principals find themselves in focus between the press for change and the maintenance of
traditional values (Hallinger, 1992). Recent educational reforms demand a different set
of management and leadership attributes (Hoyle, Bjork, Collier, & Glass 2005),
especially since “the principal who hopes to be an effective instructional leader must
19
become familiar with the theory of change that underlies the movement to standards-
based programs” (Cross & Rice, 2000, p. 62).
The focus on student learning has indicated changes in schooling which in turn
has suggested the need for more inclusive discourse and more democratic decision-
making processes to be in place in schools (Hoyle, et al., 2005). The need for such
inclusive discourse and democratic practices indicate an acknowledgement of the
diversity present in campus communities. A school’s culture should facilitate
educational empowerment and progress for all ethnic groups (Banks, 1999). Protecting
every individual’s rights, both civil and human, is key to ethical leader behavior
(American Association of School Administrators Code of Ethics, 1981; Hoyle, et al.,
1998). Treating all members of the school community with the same equality, dignity,
and fair play is instrumental in creating an environment grounded in justice and integrity
(Sergiovanni, 1992). A strong principal leader is a critical element that can influence the
school culture and therefore nurture tolerance and celebrate diversity (Deal & Peterson,
1991; Reitzug & Reeves, 1992). Principals must focus on promoting norms of
collegiality that respect individuality and collaboration among each member of the
school community (Fullan & Hargreaves, 1991). For these and other reasons, the
principalship has come under consideration as an element of educational reform for
schools and school systems, especially since “scant attention has been paid to the
preparation and qualifications of those who lead them” (Hoyle, Bjork, et al., 2005, p. 3).
For the past twenty-plus years, “professional associations have taken the lead in a
movement to develop professional standards for school executives and apply them to
20
improving the profession” (Hoyle, Bjork, Collier, & Glass, 2005, p. 9). Standards serve
many functions at different levels. For example, within the profession, standards help
guide the reform of preparation programs and assess student progress. At the state level,
standards provide a template for reviewing credentials for licensure, while at the district
level standards provide an evaluation framework for principal performance. Standards
engender professionalism among those with whom district and school administrators
work, including parents and other community members, and support the notion that
administrators are worthy of public trust (Hoyle, Bjork, et al., 2005).
Several organizations have developed standards and recommendations for
principals. The first widely distributed set of principal standards was the American
Association of School Administrators’(AASA) Guidelines for the Preparation of School
Administrators published in 1982 (Hoyle, Bjork et al., 2005). These guidelines were the
foundation for the 1985 Skills for Successful School Leaders, which was updated again
in 1990. The National Council for Accreditation of Teacher Education also set forth
standards for educators. The NCATE leadership standard 7.4 states that school leaders
must promote multicultural awareness, gender sensitivity, and racial and ethnic
appreciation (National Council for Accreditation of Teacher Education, 1995).
In 1994, the Interstate School Leadership Licensure Consortium (ISLLC), under
the auspices of the Council of Chief State School Officers (CCSSO), was formed. The
ISLLC consisted of a group of 24 states including Texas, professional educational
organizations, and universities that set out to develop a “powerful framework for
redefining school leadership and to connect that framework to strategies for improving

21
educational leadership throughout the nation” (Murphy & Shipman, 2002, p. 4). The
ISLLC standards were developed to acknowledge that formal leadership in school
districts is a complex, multifaceted task (Council of Chief State School Officers, 1996).
Indicators for each standard were detailed in the areas of knowledge, dispositions, and
performances (Murphy & Shipman, 2002). The ISLLC standards address diversity
within standard four, which states that “A school administrator is an educational leader
who promotes the success of all students by collaborating with families and community
members, responding to diverse community interests and needs, and mobilizing
community resources” (Council of Chief State School Officers, 1996, p. 16).
In 2002, the National Policy Board for Education Administration (NPBEA)
released its standards for administrator preparation, namely the Standards for Advanced
Programs in Educational Leadership. These standards were created as a synthesis of the
latest versions of National Council for Accreditation of Teacher Education (NCATE),
AASA, and ISLLC standards, and are divided into sections for school building
leadership and school district leadership. Candidates can, in part, meet the standards for
school building leadership by demonstrating the ability to analyze and “describe the
cultural diversity in a school community” and to “describe community norms and values
and how they relate to the role of the school in promoting social justice” (National
Policy Board for Educational Administration, 2002, p. 14).
Texas Standards
The Texas standards for principal certification serve as the “foundation for the
individual assessment, professional growth plan, and continuing professional education
22
activities required by §241.30” of Texas public school principals (Texas Administrative
Code, 2005, Title 19, part 7, chapter 241, section 241.1.a; Flores, 2002, p. 154). An
understanding of the need for diversity awareness as referenced in the Texas standards
will be used in this study. This quality is expressed under the Learner-Centered Values
and Ethics of Leadership standard as “a principal is an educational leader who promotes
the success of all students by acting with integrity and fairness, and in an ethical manner.
At the campus level, a principal understands, values, and is able to...promote awareness
of learning differences, multicultural sensitivity, and ethnic appreciation in the campus
community” (Texas Administrative Code, 2005, Title 19, part 7, chapter 241, section
241.15.b.4). The Texas standards incorporate the understanding that it is important that a
school’s culture nurture tolerance for a diverse working system (Banks, 1999). In
addition, to be an effective leader and influence school culture, a principal must first
understand that culture (Deal & Peterson, 1991).
Diversity
Diversity is a dominant characteristic of American cultural that distinguishes the
U.S. from other nations, (Li, 2002). The topic of diversity has garnered significant
attention over the past decades and changes in the demographic composition of the U.S.
have created the need to understand ethnically and culturally diverse people (Azevedo,
Von Glinow, & Paul, 2001). This understanding needs to extend through the schools.
“With the continuing rise of minority students [students of color], the educational system
must be prepared to meet the learning needs of a culturally diverse population” (Growe,
Schmersahl, Perry, & Henry, 2002, p. 205). According to Patrick & Reinhartz (1999),

23
society is becoming more diverse than ever before in its history, and the populations of
many school systems reflect this diversity. “American school populations are becoming
increasingly diverse...there is an array of racial, ethnic, cultural, and socio-economically
diverse students, families, and communities” (Garrett & Morgan, 2002, p. 268). “Schools
must prepare for a large but uneven influx of children…one of the rules of demographics
is: the younger the population, the greater the diversity…it is a demographic pattern of
diversity that has implications for principals” (Hodgkinson, 2002, p. 14).
Walker and Quong (1998) state that in order “to advance learning and school
improvement, leaders need to recognize and challenge the confines of sameness and
move toward valuing and learning from difference” (Walker & Quong, 1998, p. 81).
Madsen and Mabokela (2002) assert that “leadership and diversity are invariably
connected as schools move from monocultural, nondiverse contexts to those that contain
ethnically diverse, multilingual, and economically disadvantaged children” (Madsen &
Mabokela, 2002, p. 1). “Whose role is it to ensure that these students are given an equal
opportunity to learn? Along with the many other responsibilities, it is the role of school
administrators” (Growe, et.al., 2002, p. 205). Principals are expected to promote
diversity awareness, and help to form “an empowering school culture…creating a
learning environment in which students from diverse racial, ethnic, and social groups
believe that they are heard and are valued and experience respect, belonging, and
encouragement” (Parks, 1999, p. 4; Banks, 1993; Growe, et.al., 2002).
Ethnicity and race are frequently associated with the concept of diversity.
However, such a narrow approach to the concept “excludes the socio-cultural
24
educational discrepancies associated with social class, gender, religion, languages (other
than English), and sexual orientations” (Pohan & Aguilar 2001, p. 161). A
comprehensive definition of diversity would include members of marginalized socio-
cultural groups, thereby providing more richness and depth to the concept. Diversity is a
salient topic of study due to the “increasing amount of diversity taking place in our
nation, as well as our schools” (McCray, et al., 2004, p. 111). Educating for diversity
encompasses multicultural education, which assumes that the primary goal of public
education is to foster the intellectual, social, and personal development of virtually all
students to their highest potential. It includes the movement toward equity, curriculum
reform, the process of becoming interculturally competent, and the commitment to
combat prejudice and discrimination, especially racism (Bennet, 1999; Carignan,
Pourdavood, King, and Feza, 2005). Educators need to put emphasis on issues
concerning diversity (McCray, et al., 2004).
Principal’s Professional Beliefs About Diversity
Multicultural theorists have indicated that school principals have an obligation to
create an environment that promotes cultural diversity regardless of the amount of
recognizable diversity in the school (Gay, 1995, p. 55). Diversity and multicultural
education has become increasingly important over the past decade as this nation’s school
population becomes more diverse (Rodriguez, 2000). The increasing levels of diversity
in society indicate that schools must play a central role in the initiation and infusing of
multicultural concepts and ideas into the school cultures; and the key element for schools
is the principal who sets the cultural climate for the campus (Decker, 1997).
25
Principals must play an active role and must be a model for students when
dealing with racial or diversity issues (O’Neil, 1993). For the purposes of this study,
Pohan and Aguilar’s instrument, the Professional Beliefs About Diversity Scale, was
used to assess principals’ professional beliefs; these beliefs were incorporated into the
model, in addition to measures of both norms and perceived behavioral control. Pohan
and Aguilar identified seven types of diversity. They are disabilities; gender; language;
racial/ethnic; religious; sexual orientation; and social class diversity. Principals must
work for the schools to “find ways to respect the diversity of their students and to help
create a unified nation to which all citizens have allegiance…diversity within unity is the
delicate goal toward which our nation and its schools should strive” (Banks, Cookson,
Gay, Hawley, Irvine, Nieto, Schofield, & Stephan, 2001, p. 203). “For principals, the
challenges that accompany diversity issues are offset by an abundance of opportunities
to create a culture of tolerance and understanding. Principals can and should capitalize
on these opportunities and experience the richness that diversity can bring to their
schools (Urquhart, 2002, p. 26).
Changing U.S. Demographics
The 2000 Census showed that the U.S. is the most ethnically and racially varied
nation in modern times (Rosenblatt, 2001) where “nearly three in ten Americans are
members of a minority (people of color) group” (Davis-Wiley, 2002, p. 53) and as of
2002, nearly one-fifth of the U.S. population lived in a household where a second
language other than English is spoken. For the first time in American census history,
people were allowed to identify themselves as belonging to more than one ethnic group
26
(Davis-Wiley, 2002). The number of school-age children aged 5-18 who are second
language learners has been conservatively estimated, without counting the children of
undocumented workers from other countries, to have reached 3.5 million by the year
2000, and to approach 6 million by 2020. “In 2004, the percentage of racial/ethnic
minority students [students of color] enrolled in the nations public schools increased
between 1972 and 2004, primarily due to growth in Hispanic enrollments” (Livingston,
2006, p. 5). In 1972, 22 percent of public school students were considered to be students
of color, 78 percent of White students; by 2004, 43 percent of public school students
were students of color, and the white students had decreased to 57 percent; as of 2003,
the enrollment of students of color exceeded White enrollment in the West (Livingston,
2006). In fact, groups of students of color were projected to soon become majorities in
the rest of the country, especially in densely populated urban areas (Faltis, 2001). It is
projected that “non-Hispanic Whites will make up barely one-half of the population by
2050 and will lose their majority status by 2060” (Riche, 2002, p. 4).
Garrett and Morgan’s contention is that as the population of the U.S. is becoming
increasingly diverse there are a growing number of linguistically and culturally diverse
students confronting school personnel who remain frustrated with limited resources and
strategies: “there is an array of racial, ethnic, cultural, and socio-economically diverse
students, families, and communities…that continue to emerge” (Garrett & Morgan,
2002, p. 268). Therefore, as stated by LeFlore (2005), it is more appropriate to
emphasize the phenomenon of increasing diversity in America since it is a society of
multiple cultures and cross-cultural influences. “The United States is a society diverse

27
in culture, race, ethnicity, religion, and income; one struggling with a past involving
oppression, inequality, and buried knowledge. In order to heal and strengthen, we must
educate ourselves about the many strands of our history; grow to appreciate and enjoy
the multiple cultures, races, and realities; and recognize the consequences of current and
historical oppression” (Schmitz, Stakeman, & Sisneros, 2001, p. 612).
Changing Texas Demographics
According to the County Information Project published by the Texas Association
of Counties, the State of Texas is growing, with more people, more urbanicity, and more
ethnic diversity. The state’s population grew 16 percent between 1990 (16.98 million
people) and 2000 (20.85 million); this growth was the result of 23 percent international
migration, 19 percent domestic migration, and 58 percent natural increase (Reid, 2001).
More recent population projections indicate a wide spectrum of possible growth. Under
three scenarios (natural increase only without in or out migration, future net migration at
half the level of the years 1990 to 2000, and future net migration remaining at the same
level as in the years 1990 to 2000) the statewide population of the year 2040 may range
from 25.56 million, to 35.01 million, to 50.58 million persons. The corresponding
projected population changes indicate extensive percentage rates of growth people of
color. The projected rates of growth are, for African Americans (between 35.6 to 65.0
percent increase), Hispanics (175.7 to 348.7 percent increase), Asian/Pacific Islanders
and Native Americans (185.0 to 546.8 percent increase), as compared to Whites (2.8 to
10.4 percent increase) (Murdock, White, Hoque, Pecotte, You, & Balkan, 2002).
28
The high population growth rate is expected to impact the public schools. Under
the different growth scenarios (natural increase only without in or out migration, future
net migration at half the level of the years 1990 to 2000, and future net migration
remaining at the same level as in the years 1990 to 2000), more recent projections for
growth in public elementary and secondary schools for the period 2000 to 2040 indicate
an increase of between approximately the current 4.00 million, to 5.09 million, to a
projected maximum of 7.05 million. The percent change by ethnicity of Texas public
elementary and secondary school enrollment in 2040 is projected to be 8.3 percent for
African American students, 66.3 percent Hispanic students, 5.5 percent Asian/Pacific
Islander and Native American students, and 19.9 percent White students (Murdock, et
al., 2002).
A projected change in public school programs participation for the period 1990
to 2030 indicated that there would be an over proportional student growth in
Economically Disadvantaged, At-Risk, Limited English Proficient, and Bilingual
programs. Simultaneously, an almost proportional rate of dropouts, and a less than
proportional decrease in the number of Gifted and Talented, Special Education, and
Career and Technology Education program participation was projected to take place
(Murdock, Hoque, Michael, White, & Pecotte, 1997). Recent projections for the percent
change in enrollment in selected elementary and secondary school programs by the year
2040 are all indicating growth, with 119.9 percent in students classified as Economically
Disadvantaged, 101.9 percent in students classified as At-Risk, 188.1 percent in students
classified as Limited English Proficient program participants, 186.8 percent students
29
classified as Bilingual program participants, 48.5 classified as Gifted and Talented
program participants, 64.7 percent classified as Special Education program participants,
and 69.9 classified as Career and Technology Education program participants (Murdock,
et al., 2002).
Data from the Academic Excellence Indicator System (AEIS) of the Texas
Education Agency indicate that some of the projected changes in public school programs
are already evident. The AEIS details various school related data for the State of Texas
at the grade, campus, district, county, and state levels. According to the AEIS report for
the 2004-2005 school year there were 4,383,871 students enrolled in Texas public
schools. This population was reported to be 14.2 percent African American, 44.7 percent
Hispanic, 3.0 percent Asian/Pacific Islander, 0.3 percent Native American, and 37.7
percent White. It is of interest to note that the total graduates for the class of 2004 were
quite different in terms of ethnic breakdown, with 13.6 percent African American, 35.0
percent Hispanic, 0.3 percent Native American, 3.4 percent Asian/Pacific Islander, and
47.7 percent White. The 2004-2005 statewide student population included 54.6 percent
classified as Economically Disadvantaged, 45.8 percent classified as At-Risk, 15.6
percent classified as Limited English Proficient, 14.4 percent classified as Bilingual
program participants, 7.7 percent classified as Gifted and Talented program participants,
11.6 classified as Special Education program participants, and 20.3 percent classified as
Career and Technology Education program participants (Texas Education Agency,
2006).

30
Human Behavior Theories
Human behavior is a complex field of study that can be used to explain and
predict individual behavior. Isaacson and Hunt (1971) state that the simplest explanation
for behavior is the concept that humankind seeks to maximize its pleasure and minimize
its pain. This concept of pleasure maximization and pain minimization can be traced
back to the Hedonistic philosophy of the Greeks (Isaacson & Hunt, 1971; Ryan &
Bonfield, 1975), and that behavior can be predicted from behavioral intentions (Becker
& Gibson, 1998). Modern attempts to explain human behavior have given rise to the
understanding that much human behavior, especially that involving interactions with
others, is subject to human reasoning. Certain elements of human behavior can be
explained through use of social psychology’s attitude-behavior theories. These theories
include the basic attitude model (Rosenberg, 1960a; 1960b), Fishbein’s original model
of attitude (Fishbein, 1967), the theory of reasoned action (Fishbein & Ajzen, 1973), and
the theory of planned behavior (Ajzen, 1985, 1991).
The Basic Attitude Model
Rosenberg’s work was based on a functional approach to attitudes. Rosenberg
(1960a) hypothesized that attitudes consist of beliefs about the potentialities of an object
that include the cognitive component, value-attaining positive states or value-blocking
negative states, and the affective component, that a value is given to the subject in terms
of source of satisfaction. Additionally, Rosenberg mentioned the possibility of the
existence of intervening variables, but did not incorporate such variables into his
theoretical structure. In a further study, Rosenberg (1960b) confirmed the cognitive and
31
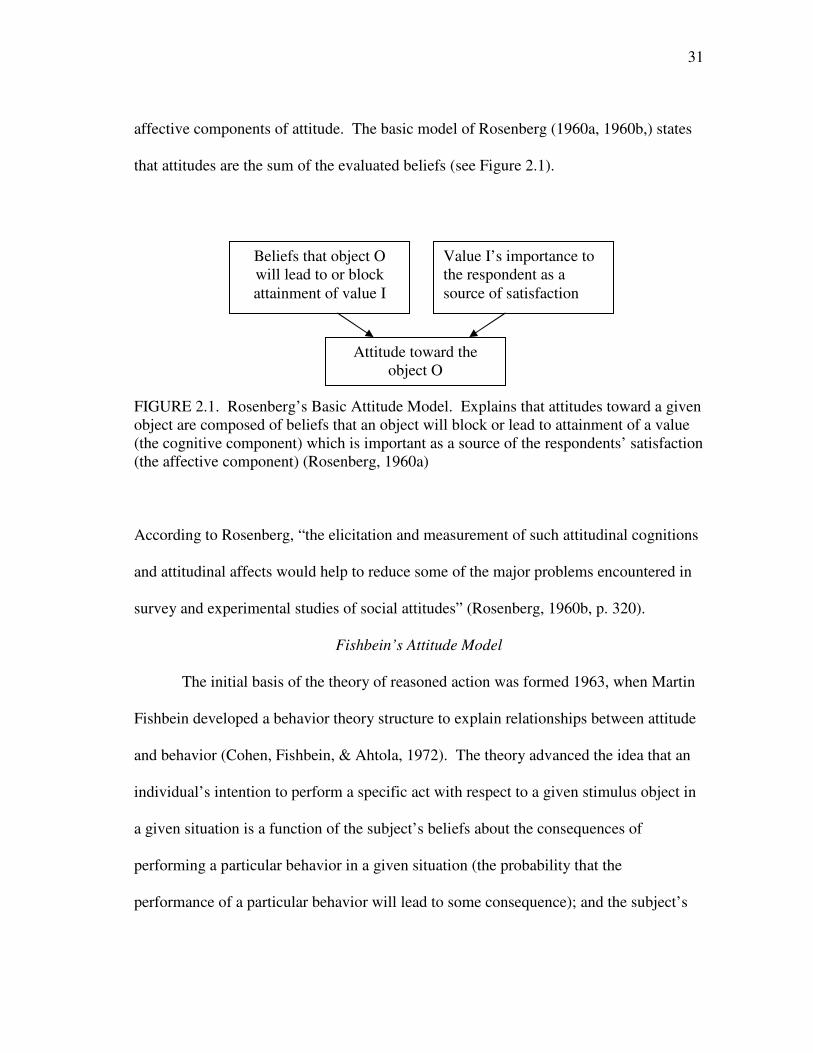
affective components of attitude. The basic model of Rosenberg (1960a, 1960b,) states
that attitudes are the sum of the evaluated beliefs (see Figure 2.1).
FIGURE 2.1. Rosenberg’s Basic Attitude Model. Explains that attitudes toward a given object are composed of beliefs that an object will block or lead to attainment of a value (the cognitive component) which is important as a source of the respondents’ satisfaction (the affective component) (Rosenberg, 1960a)
According to Rosenberg, “the elicitation and measurement of such attitudinal cognitions
and attitudinal affects would help to reduce some of the major problems encountered in
survey and experimental studies of social attitudes” (Rosenberg, 1960b, p. 320).
Fishbein’s Attitude Model
The initial basis of the theory of reasoned action was formed 1963, when Martin
Fishbein developed a behavior theory structure to explain relationships between attitude
and behavior (Cohen, Fishbein, & Ahtola, 1972). The theory advanced the idea that an
individual’s intention to perform a specific act with respect to a given stimulus object in
a given situation is a function of the subject’s beliefs about the consequences of
performing a particular behavior in a given situation (the probability that the
performance of a particular behavior will lead to some consequence); and the subject’s
Beliefs that object O will lead to or block attainment of value I
Value I’s importance to the respondent as a source of satisfaction
Attitude toward the object O
32
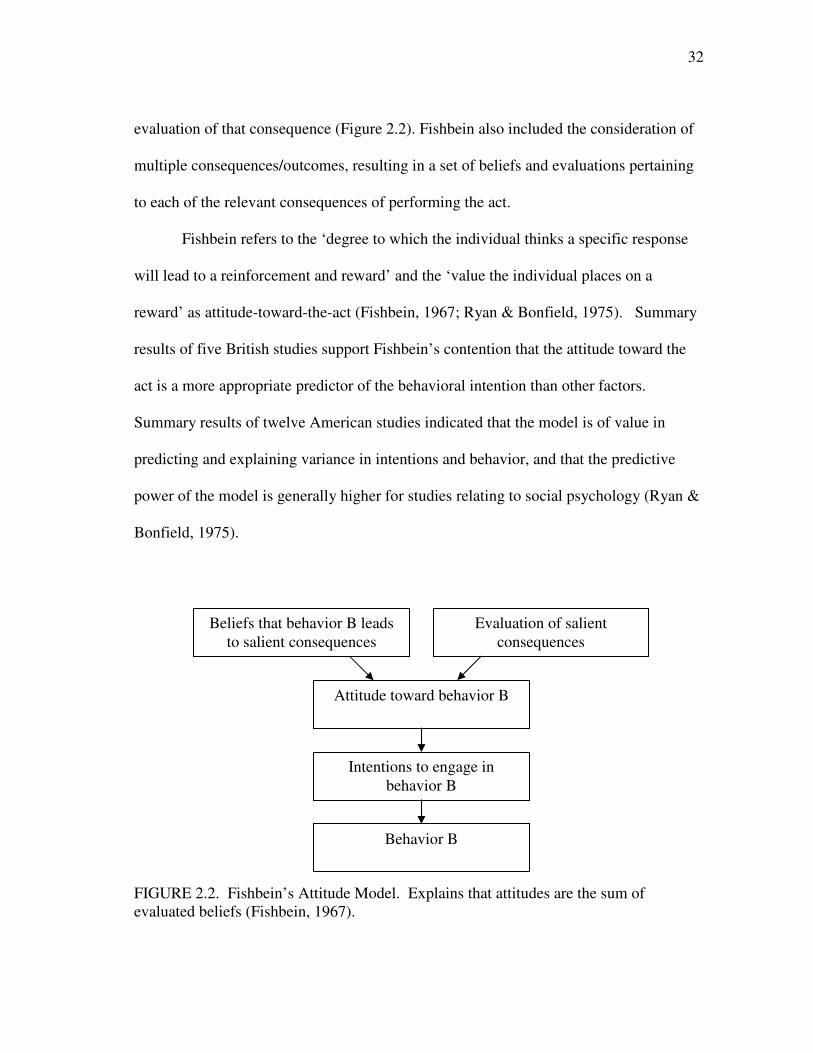
evaluation of that consequence (Figure 2.2). Fishbein also included the consideration of
multiple consequences/outcomes, resulting in a set of beliefs and evaluations pertaining
to each of the relevant consequences of performing the act.
Fishbein refers to the ‘degree to which the individual thinks a specific response
will lead to a reinforcement and reward’ and the ‘value the individual places on a
reward’ as attitude-toward-the-act (Fishbein, 1967; Ryan & Bonfield, 1975). Summary
results of five British studies support Fishbein’s contention that the attitude toward the
act is a more appropriate predictor of the behavioral intention than other factors.
Summary results of twelve American studies indicated that the model is of value in
predicting and explaining variance in intentions and behavior, and that the predictive
power of the model is generally higher for studies relating to social psychology (Ryan &
Bonfield, 1975).
FIGURE 2.2. Fishbein’s Attitude Model. Explains that attitudes are the sum of evaluated beliefs (Fishbein, 1967).
Beliefs that behavior B leads to salient consequences
Evaluation of salient consequences
Attitude toward behavior B
Intentions to engage in behavior B
Behavior B
33
The Theory of Reasoned Action
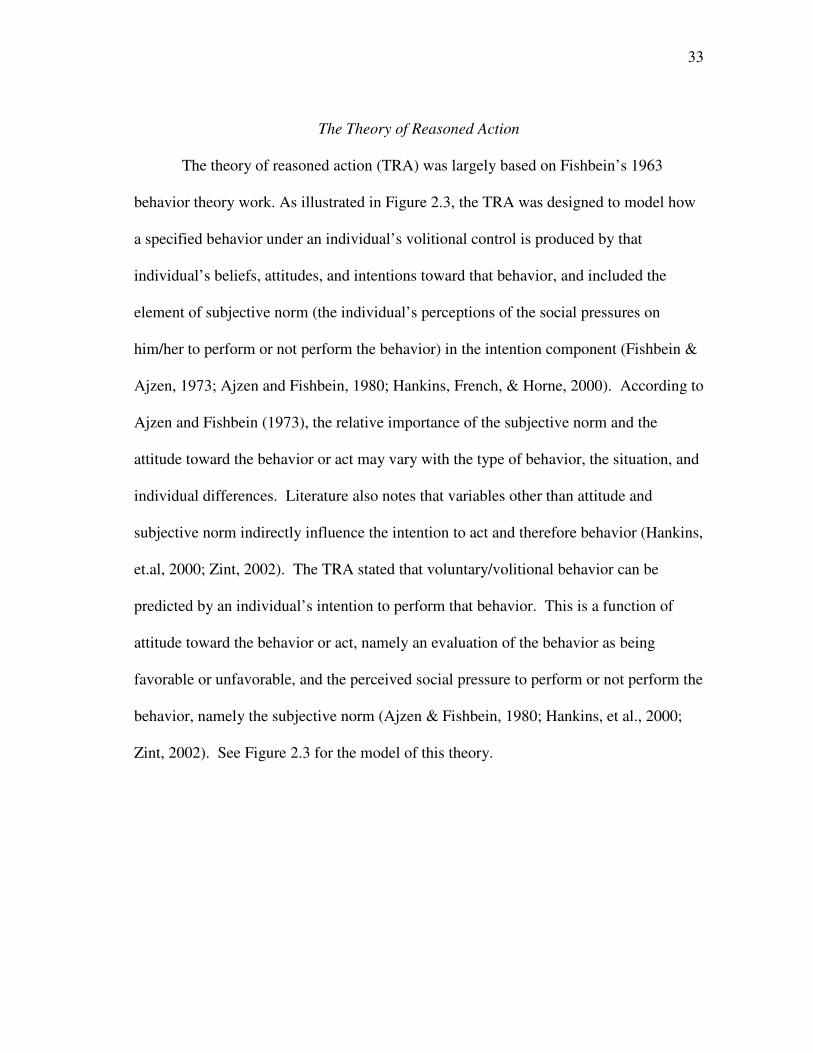
The theory of reasoned action (TRA) was largely based on Fishbein’s 1963
behavior theory work. As illustrated in Figure 2.3, the TRA was designed to model how
a specified behavior under an individual’s volitional control is produced by that
individual’s beliefs, attitudes, and intentions toward that behavior, and included the
element of subjective norm (the individual’s perceptions of the social pressures on
him/her to perform or not perform the behavior) in the intention component (Fishbein &
Ajzen, 1973; Ajzen and Fishbein, 1980; Hankins, French, & Horne, 2000). According to
Ajzen and Fishbein (1973), the relative importance of the subjective norm and the
attitude toward the behavior or act may vary with the type of behavior, the situation, and
individual differences. Literature also notes that variables other than attitude and
subjective norm indirectly influence the intention to act and therefore behavior (Hankins,
et.al, 2000; Zint, 2002). The TRA stated that voluntary/volitional behavior can be
predicted by an individual’s intention to perform that behavior. This is a function of
attitude toward the behavior or act, namely an evaluation of the behavior as being
favorable or unfavorable, and the perceived social pressure to perform or not perform the
behavior, namely the subjective norm (Ajzen & Fishbein, 1980; Hankins, et al., 2000;
Zint, 2002). See Figure 2.3 for the model of this theory.
34
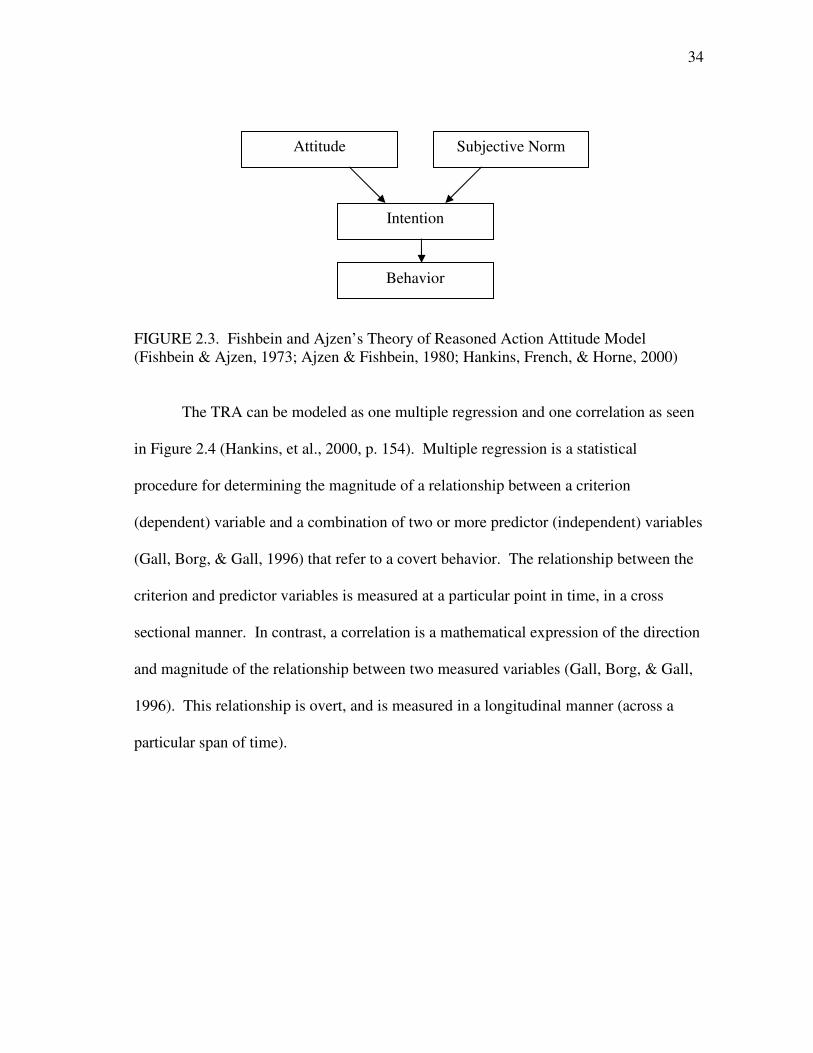
FIGURE 2.3. Fishbein and Ajzen’s Theory of Reasoned Action Attitude Model (Fishbein & Ajzen, 1973; Ajzen & Fishbein, 1980; Hankins, French, & Horne, 2000) The TRA can be modeled as one multiple regression and one correlation as seen
in Figure 2.4 (Hankins, et al., 2000, p. 154). Multiple regression is a statistical
procedure for determining the magnitude of a relationship between a criterion
(dependent) variable and a combination of two or more predictor (independent) variables
(Gall, Borg, & Gall, 1996) that refer to a covert behavior. The relationship between the
criterion and predictor variables is measured at a particular point in time, in a cross
sectional manner. In contrast, a correlation is a mathematical expression of the direction
and magnitude of the relationship between two measured variables (Gall, Borg, & Gall,
1996). This relationship is overt, and is measured in a longitudinal manner (across a
particular span of time).
Subjective Norm
Behavior
Intention
Attitude
35
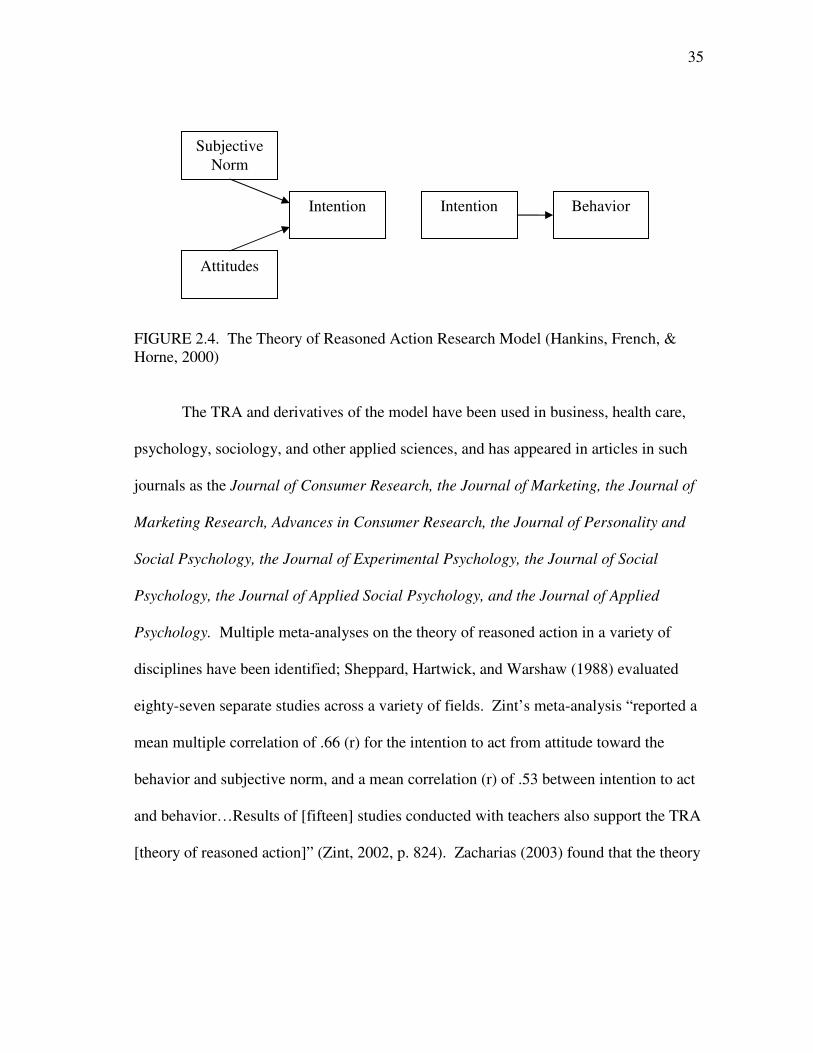
FIGURE 2.4. The Theory of Reasoned Action Research Model (Hankins, French, & Horne, 2000) The TRA and derivatives of the model have been used in business, health care,
psychology, sociology, and other applied sciences, and has appeared in articles in such
journals as the Journal of Consumer Research, the Journal of Marketing, the Journal of
Marketing Research, Advances in Consumer Research, the Journal of Personality and
Social Psychology, the Journal of Experimental Psychology, the Journal of Social
Psychology, the Journal of Applied Social Psychology, and the Journal of Applied
Psychology. Multiple meta-analyses on the theory of reasoned action in a variety of
disciplines have been identified; Sheppard, Hartwick, and Warshaw (1988) evaluated
eighty-seven separate studies across a variety of fields. Zint’s meta-analysis “reported a
mean multiple correlation of .66 (r) for the intention to act from attitude toward the
behavior and subjective norm, and a mean correlation (r) of .53 between intention to act
and behavior…Results of [fifteen] studies conducted with teachers also support the TRA
[theory of reasoned action]” (Zint, 2002, p. 824). Zacharias (2003) found that the theory
Subjective Norm
Attitudes
Intention Intention Behavior
36
of reasoned action model confirmed that beliefs affect attitudes, which then in turn affect
intentions.
The Theory of Planned Behavior
The theory of planned behavior “is an extension of the widely applied theory of
reasoned action” (Conner, Povey, Sparks, James, & Shepherd, 2003, p. 76). Though the
theory of planned behavior is over thirty years old, yet still has applications today and
into the twenty-first century (Zint, 2002). The theory of planned behavior, based on the
theory of reasoned action, holds that intention is a determinant of behavior. Attitudes
(determined by beliefs and evaluations), perceived behavioral control, and subjective
norms are functions of intentions (Zint, 2002; Conner et. al., 2003).
The theory of reasoned action deals with only those behaviors over which the
individual has volitional control (Ajzen & Fishbein, 1980). However, Ajzen (1988)
noted that the ability to carry out intention often depended on the level of volitional
control that individuals have over their behavior. Volitional control refers to “behaviors
that do not require special skills, resources, or support and hence can be performed at
will” (Zint, 2002, p. 827). Where little volitional control exists, the intention to act, and
thus behavior, will be affected. It was predicted that when an individual had volitional
control, attitude would play a significant part in predicting intentions and thus behavior.
If an individual had little volitional control, the effect of attitude on intention was much
less significant in predicting behavior (Ajzen, 1985, 1988, 1991; Zint, 2002). Therefore,
the Theory of Planned Behavior (TPB) was developed to model “how all behaviors are
produced, not just those under volitional control. To achieve this wider applicability, a
37
further concept was introduced: the perceived ease or difficulty of performing a
behavior, or ‘perceived behavioral control’ in contrast to the TRA” (Hankins, et al.,
2000). This perceived behavioral control echoes Bandura’s work on self-efficacy, “the
conviction that one can successfully execute behavior” (Bandura, 1977, p. 3; Zint, 2002,
p. 827).
The TPB has become the dominant social-psychological model for relating
attitudes to behavior (Conner, et al., 2003). Incorporated into the TPB was the
recognition that behavior was not only determined by intentions, but also by an
individual’s actual degree of control over the behavior, which was operationalized as a
measure of perceived behavioral control (Hankins, et al., 2000; Ajzen, 1988), namely the
“belief as to how easy or difficult performance of the behavior is likely to be” as a
predictive indicator of intention to act and behavior. Thus, the path between perceived
behavioral control and intention to act reflects an individual’s perceived control of the
behavior, whereas the path between perceived behavioral control and behavior reflects
actual control over the behavior (Ajzen, 1985; Zint, 2002, p. 827). See Figure 2.5 for a
presentation of the TPB model.
38
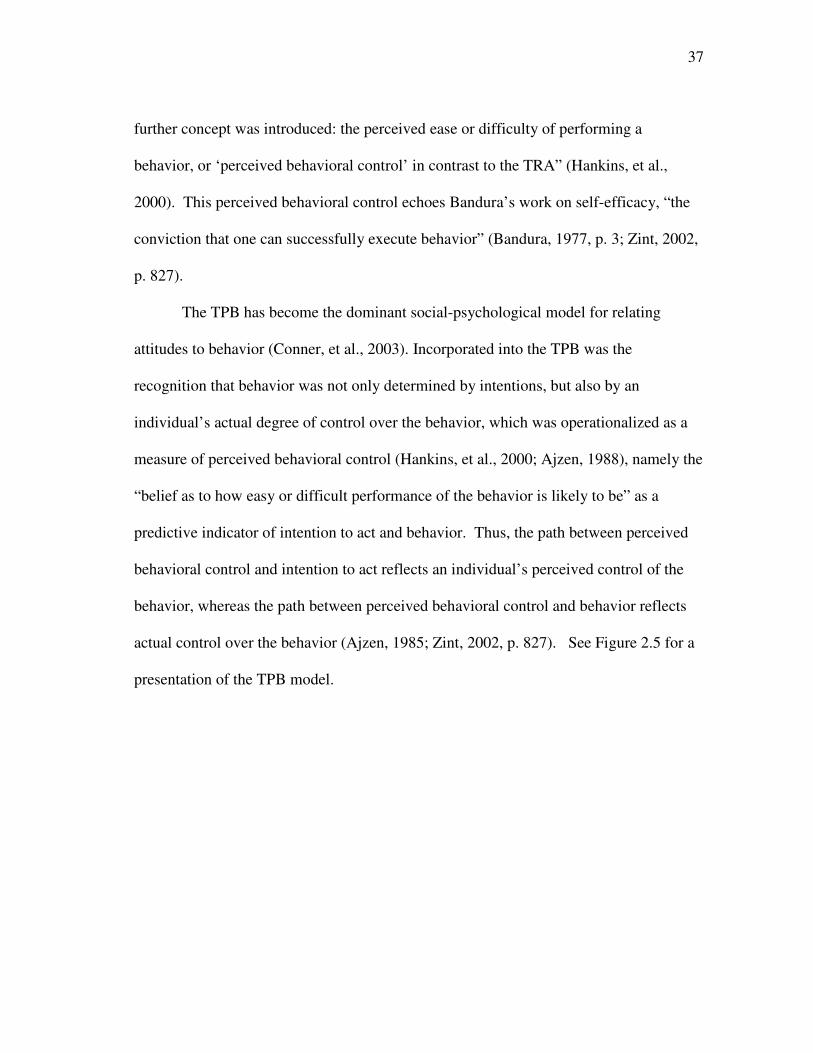
FIGURE 2.5. Ajzen’s Theory of Planned Behavior Model (TPB) (Ajzen, 1988; Zint, 2002) The relative weights of the three predictive elements of intention vary with individual
differences as well as the type of behavior and situation under consideration (Ajzen,
1985, 1988, 1991; Zint, 2002). As seen in Figure 2.6, the TPB can be modeled as two
multiple regressions.
Attitude (A) Subjective Norm (SN)
Perceived Behavioral Control (PBC)
Intention (I)
Behavior (B)
39
Model Regression One Model Regression Two
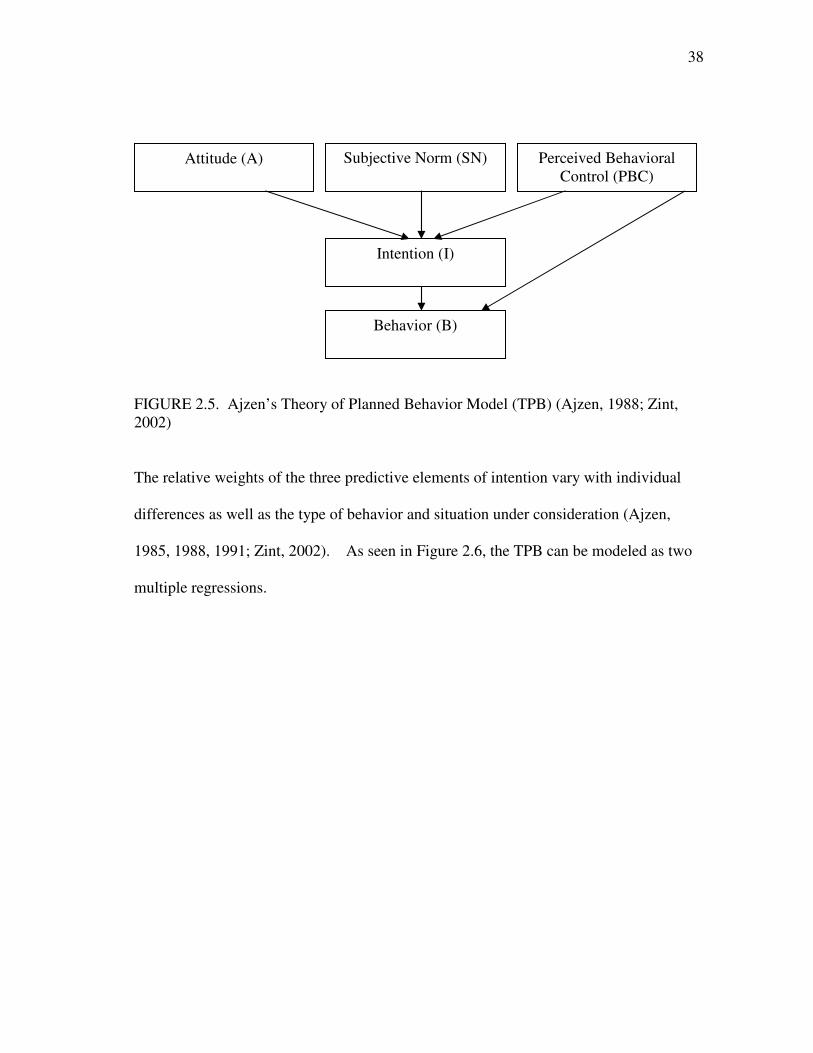
FIGURE 2.6. The Theory of Planned Behavior Research Model (Hankins, French, & Horne, 2000)
According to Hankins, et al., (2000), the theory of planned behavior necessarily
incorporates two multiple regressions. In the first multiple regression attitudes, norms,
and perceived behavioral control act as independent variables while intention serves as
the dependent variable. In the second multiple regression, intentions and perceived
behavioral control are independent variables and the overt behavior functions as the
dependent variable. In both cases, the dependent variable is derived from multiple
independent variables. Hankin’s Regression One TPB model as presented in Figure 2.6
will provide the theoretical basis for this study and will require a cross sectional research
design of covert intentions. Hankin’s Regression Two TPB model was excluded
because it would require a prohibitively time consuming longitudinal research design,
and would face significant legal confidentiality and reliability problems related to studies
Attitude (A)
Subjective Norm (SN)
Perceived Behavioral
Control (PBC)
Intention (I)
Behavior (B)
Perceived Behavioral
Control (PBC)
Intention (I)
40
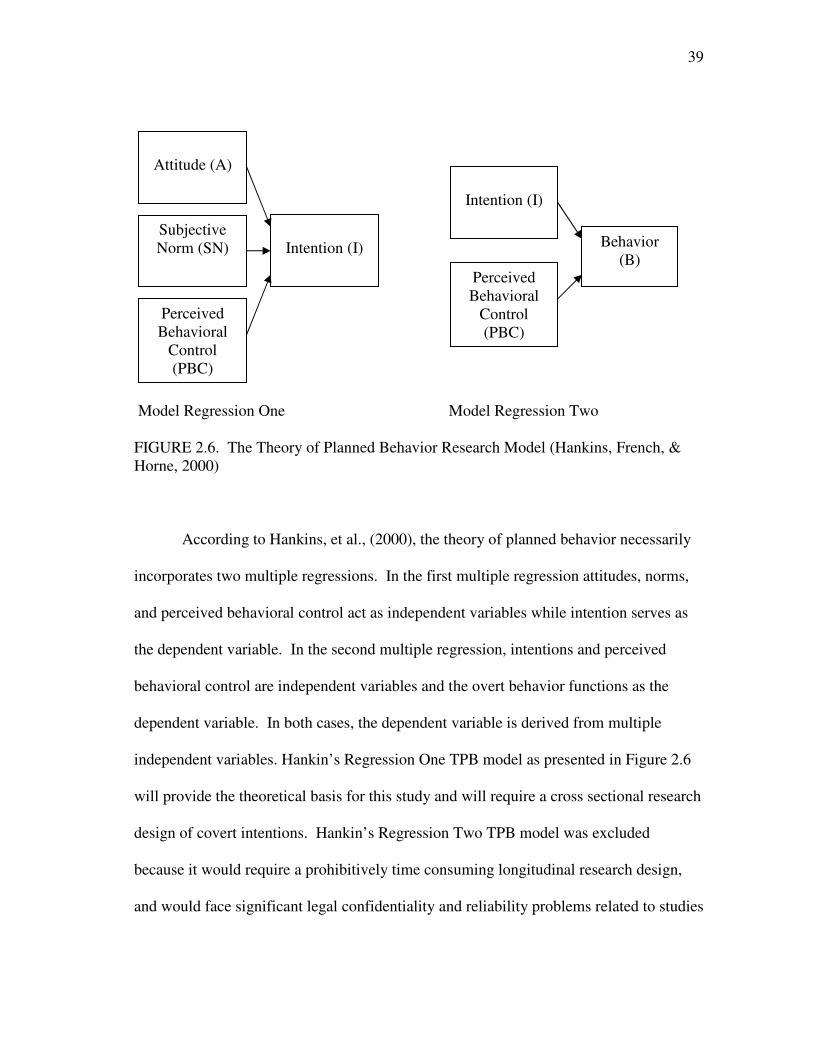
requiring objective observation and/or self reporting procedures regarding individual’s
overt behaviors. In order to achieve the research objectives set for this study, a General
Principal’s Diversity Intention (GPDI) model was developed and is presented in the
following Figure 2.7.
FIGURE 2.7. The General Principal’s Diversity Intentions (GPDI) Model
This review of literature presented an overview of principals, principal’s roles,
and principal leadership (including standards). Following this was a discussion of
diversity and a presentation of the principal’s professional beliefs regarding diversity and
reflecting on the expected demographic changes within the nation and the state over the
next thirty years which will impact schools was presented. An overview of human
behavior theories was then presented with the basic attitude model, the Fishbein attitude
model, the theory of reasoned action, and the theory of planned behavior. Finally, the
GPDI model was offered. The GPDI model represents the operational conversion of the
theoretical constructs incorporated in the Hankin’s TPB Regression One Model. This
Principal’s Professional Attitude towards
promoting diversity awareness (A)
Principal’s Subjective Norms for the
promotion of diversity awareness (SN)
Principal’s Perceived Behavioral Control
for promoting diversity awareness (PBC)
Principal’s general Intention to promote
diversity awareness (I)
41
study used an innovative approach in combining the Theory of Planned Behavior (Ajzen,
1988) with the Professional Educator’s Belief Scale (Pohan & Aguilar, 1999) in order to
model principals’ general intentions to promote an awareness of diversity, congruent
with the Texas standards for principal certification and evaluation/assessment. The
methodology for this study is described in Chapter III.
42
CHAPTER III
METHODOLOGY
This chapter discussed the research methodology. There were three research
questions that guided this study. These questions were:
1. Can a theory of planned behavior approach be used to assess school principals’
professional intentions to promote diversity awareness?
2. What are the intentions of Texas principals to promote diversity awareness in
general and among the five diversity dimensions of disabilities, gender, language,
racial/ethnic, and social class in their campus community? and
3. Do these intentions differ among five demographic characteristics of
race/ethnicity, gender, age, degree, and campus type?
To address these research questions, a primary research methodology was
necessary as presented in the following detailed research design, population and
sampling method, instrumentation (including pilot test of the instrument, data collection,
data entry), and statistical methodology for analysis of the primary response data. Also,
in order to address the third research question, a secondary data analysis of selected
demographic characteristics as provided by the Texas Education Agency’s 2004-2005
Role Master File was incorporated via cross-referencing into the primary respondent
data.
Research Design
The research design of this study could be defined as an “ex post facto” research,
which is according to Kerlinger “a systematic empirical enquiry in which the scientist
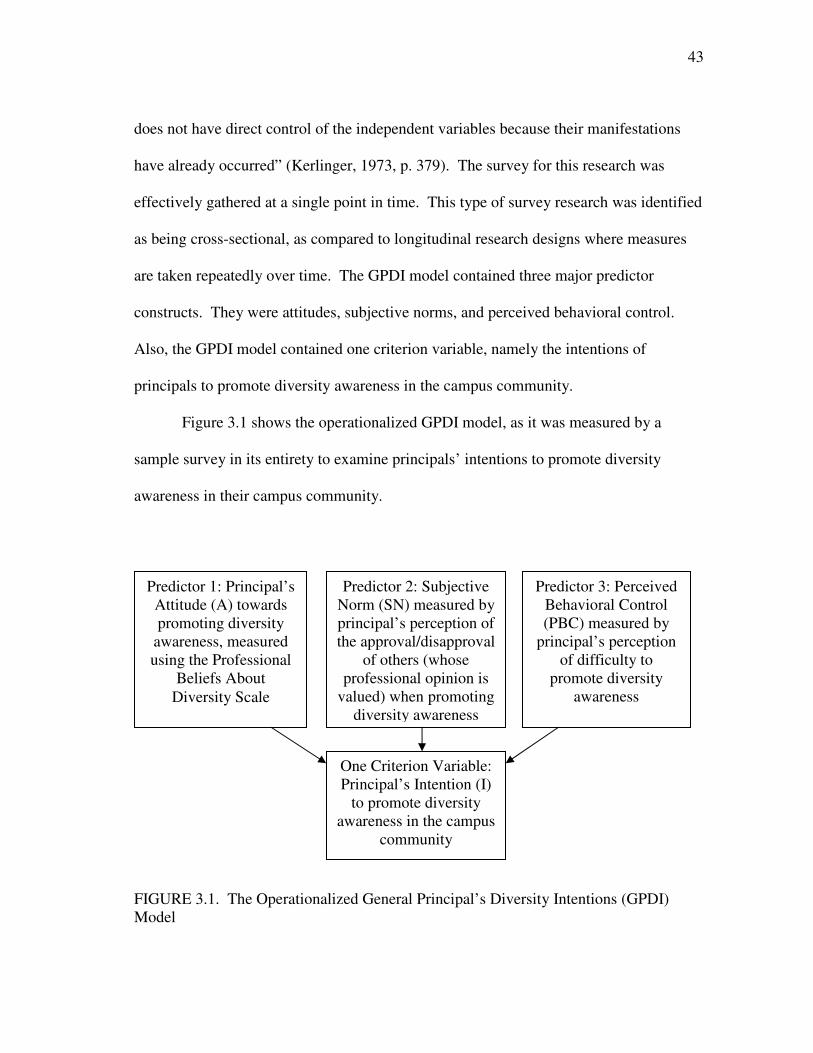
43
does not have direct control of the independent variables because their manifestations
have already occurred” (Kerlinger, 1973, p. 379). The survey for this research was
effectively gathered at a single point in time. This type of survey research was identified
as being cross-sectional, as compared to longitudinal research designs where measures
are taken repeatedly over time. The GPDI model contained three major predictor
constructs. They were attitudes, subjective norms, and perceived behavioral control.
Also, the GPDI model contained one criterion variable, namely the intentions of
principals to promote diversity awareness in the campus community.
Figure 3.1 shows the operationalized GPDI model, as it was measured by a
sample survey in its entirety to examine principals’ intentions to promote diversity
awareness in their campus community.
FIGURE 3.1. The Operationalized General Principal’s Diversity Intentions (GPDI) Model
Predictor 1: Principal’s Attitude (A) towards promoting diversity
awareness, measured using the Professional
Beliefs About Diversity Scale
Predictor 2: Subjective Norm (SN) measured by principal’s perception of the approval/disapproval
of others (whose professional opinion is
valued) when promoting diversity awareness
Predictor 3: Perceived Behavioral Control (PBC) measured by
principal’s perception of difficulty to
promote diversity awareness
One Criterion Variable: Principal’s Intention (I)
to promote diversity awareness in the campus
community
44
Pohan and Aguilar identified seven types of diversity, namely disabilities,
gender, language, racial/ethnic, religious, sexual orientation, and social class diversity.
Sub-models of the GPDI were used to measure principals’ intentions to implement
awareness of these various dimensions of diversity. A decision was made that only
those types of diversity that were measured by three or more questions on the instrument
would be included. Therefore, since sexual orientation diversity and religious diversity
were addressed by less than three questions, these two types of diversity would not be
measured separately. Each of the remaining five types of diversity awareness
(disabilities; gender; language; racial/ethnic; and social class) was measured. The
principals’ intention to emphasize diversity awareness in the campus community was
also measured. The operationalized models for each of these types of diversity measured
are presented in Figure 3.2 through Figure 3.6. Each figure represents the PDI for a
particular dimension of diversity. The subset of questions regarding attitude for the
various dimensions of diversity are taken from the complete scale.
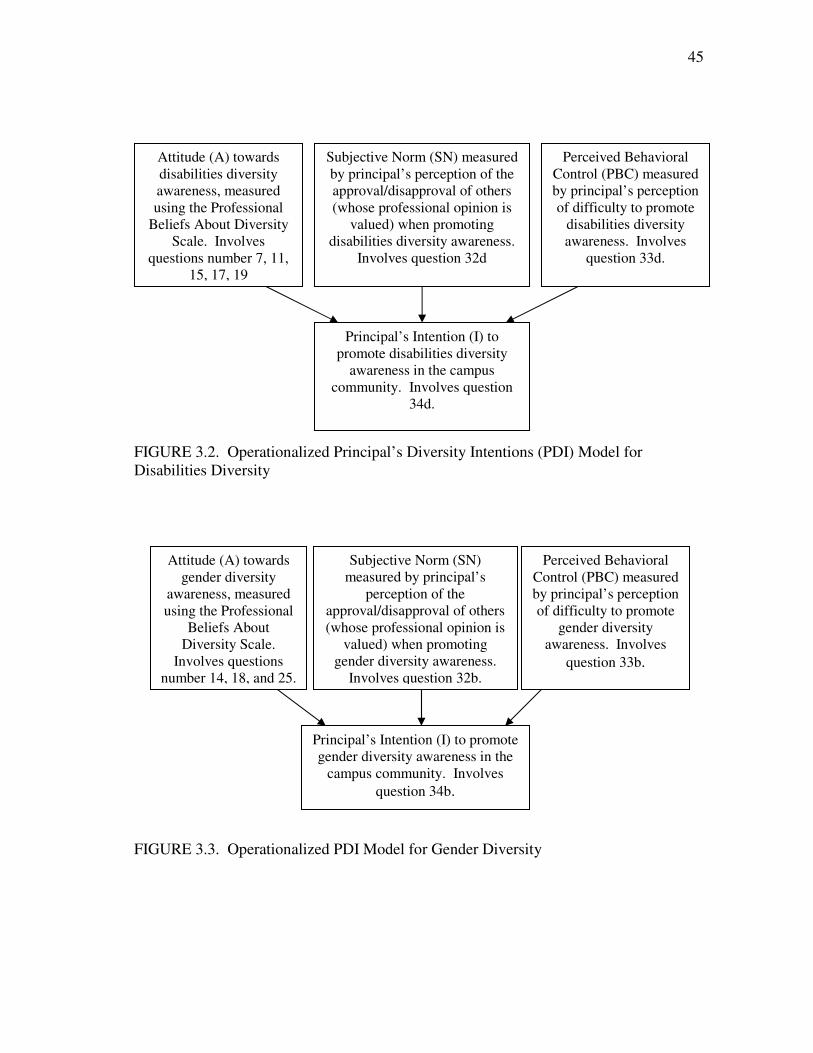
45
FIGURE 3.2. Operationalized Principal’s Diversity Intentions (PDI) Model for Disabilities Diversity
FIGURE 3.3. Operationalized PDI Model for Gender Diversity
Attitude (A) towards gender diversity
awareness, measured using the Professional
Beliefs About Diversity Scale.
Involves questions number 14, 18, and 25.
Subjective Norm (SN) measured by principal’s
perception of the approval/disapproval of others (whose professional opinion is
valued) when promoting gender diversity awareness.
Involves question 32b.
Perceived Behavioral Control (PBC) measured by principal’s perception of difficulty to promote
gender diversity awareness. Involves
question 33b.
Principal’s Intention (I) to promote gender diversity awareness in the
campus community. Involves question 34b.
Attitude (A) towards disabilities diversity awareness, measured using the Professional
Beliefs About Diversity Scale. Involves
questions number 7, 11, 15, 17, 19
Subjective Norm (SN) measured by principal’s perception of the approval/disapproval of others (whose professional opinion is
valued) when promoting disabilities diversity awareness.
Involves question 32d
Perceived Behavioral Control (PBC) measured by principal’s perception of difficulty to promote
disabilities diversity awareness. Involves
question 33d.
Principal’s Intention (I) to promote disabilities diversity
awareness in the campus community. Involves question
34d.
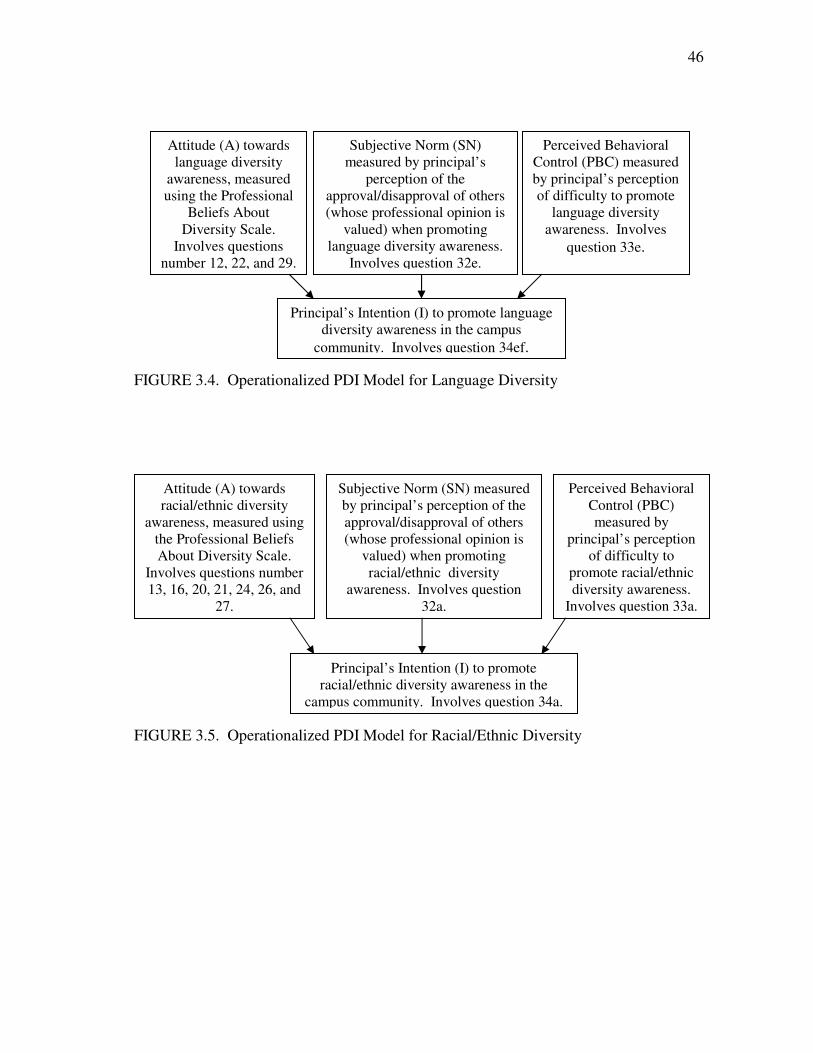
46
FIGURE 3.4. Operationalized PDI Model for Language Diversity
FIGURE 3.5. Operationalized PDI Model for Racial/Ethnic Diversity
Attitude (A) towards racial/ethnic diversity
awareness, measured using the Professional Beliefs About Diversity Scale.
Involves questions number 13, 16, 20, 21, 24, 26, and
27.
Subjective Norm (SN) measured by principal’s perception of the approval/disapproval of others (whose professional opinion is
valued) when promoting racial/ethnic diversity
awareness. Involves question 32a.
Perceived Behavioral Control (PBC) measured by
principal’s perception of difficulty to
promote racial/ethnic diversity awareness.
Involves question 33a.
Principal’s Intention (I) to promote racial/ethnic diversity awareness in the
campus community. Involves question 34a.
Attitude (A) towards language diversity
awareness, measured using the Professional
Beliefs About Diversity Scale.
Involves questions number 12, 22, and 29.
Subjective Norm (SN) measured by principal’s
perception of the approval/disapproval of others (whose professional opinion is
valued) when promoting language diversity awareness.
Involves question 32e.
Perceived Behavioral Control (PBC) measured by principal’s perception of difficulty to promote
language diversity awareness. Involves
question 33e.
Principal’s Intention (I) to promote language diversity awareness in the campus
community. Involves question 34ef.
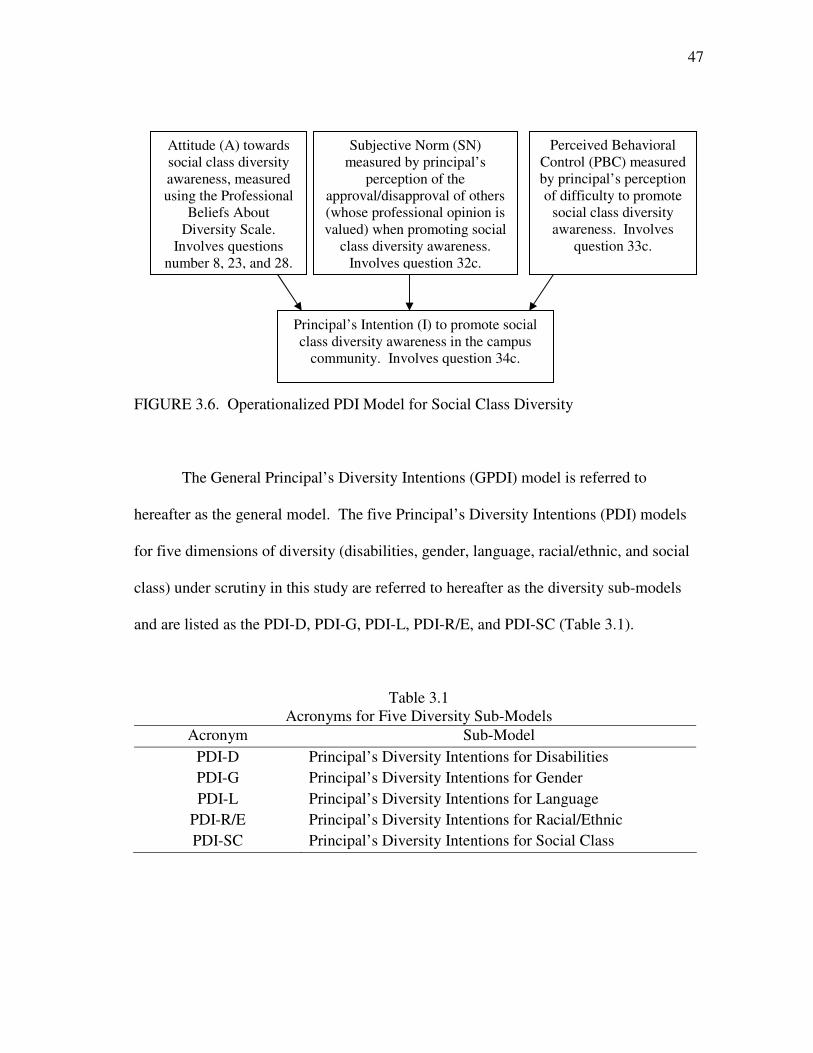
47
FIGURE 3.6. Operationalized PDI Model for Social Class Diversity
The General Principal’s Diversity Intentions (GPDI) model is referred to
hereafter as the general model. The five Principal’s Diversity Intentions (PDI) models
for five dimensions of diversity (disabilities, gender, language, racial/ethnic, and social
class) under scrutiny in this study are referred to hereafter as the diversity sub-models
and are listed as the PDI-D, PDI-G, PDI-L, PDI-R/E, and PDI-SC (Table 3.1).
Table 3.1 Acronyms for Five Diversity Sub-Models
Acronym Sub-Model PDI-D Principal’s Diversity Intentions for Disabilities PDI-G Principal’s Diversity Intentions for Gender PDI-L Principal’s Diversity Intentions for Language
PDI-R/E Principal’s Diversity Intentions for Racial/Ethnic PDI-SC Principal’s Diversity Intentions for Social Class
Attitude (A) towards social class diversity awareness, measured using the Professional
Beliefs About Diversity Scale.
Involves questions number 8, 23, and 28.
Subjective Norm (SN) measured by principal’s
perception of the approval/disapproval of others (whose professional opinion is valued) when promoting social
class diversity awareness. Involves question 32c.
Perceived Behavioral Control (PBC) measured by principal’s perception of difficulty to promote
social class diversity awareness. Involves
question 33c.
Principal’s Intention (I) to promote social class diversity awareness in the campus
community. Involves question 34c.
48
The model and sub-models contain the attitude, subjective norm, perceived behavioral
control and intention constructs in order to predict the principals’ intentions to promote
diversity awareness. Several covariates were measured to determine whether there are
significant differences in responses to each of the research questions. These covariates
were all based on five of the respondent’s demographic characteristics. These
characteristics are race/ethnicity, gender, age, degree, and campus type.
Instrumentation
The instrument for the data collection was a questionnaire that incorporated the
following: (a) Professional Beliefs About Diversity Scale (PBADS) (Pohan & Aguilar,
1999) in its entirety, with a consent form and five demographic questions preceding the
scale; and (b) question matrices measuring the subjective norm, perceived behavioral
control, and intentions after the scale. All the questions that were used in measuring the
attitudinal construct were copied verbatim from the existing PBADS (Pohan & Aguilar,
2001), which was extensively tested by the authors along a variety of reliability and
validity tests. Written permission to use the PBADS was received from Pohan. This
scale has been subject to several stages of scale development including a pilot version in
1992, a preliminary version in 1993, a field test version in 1994, the revised version in
1995 and again in 1998, and the final scale in 1998. The authors have conducted 12
separate field tests with over 2,000 subjects, across five states and the data reported
support the conclusion that this scale is both reliable and valid measures of one’s
professional beliefs about diversity. The high internal consistency of the PBADS was
seen with Cronbach alpha scores of .817 for the pre-test, and .855 for the post-test
49
(Pohan & Aguilar, 1999; Pohan & Aguilar, 2001). Tests for construct validity were
conducted at the preliminary and field testing stages of instrument development, using
correlational analysis with the variables of age, gender, cross-cultural experience,
multicultural coursework, and perceived knowledge levels regarding diversity topics.
Age, cross-cultural experience, multicultural coursework, and perceived knowledge
levels were not found to be significantly related to belief scores. However, “results
indicated that women were more accepting of diversity than were men.” One
interpretation of these results is “that women are more accepting of diversity than are
men…women held more positive attitudes than did men, which included issues of
culture, ethnocentrism, and racism” (Pohan & Aguilar, 2001, p. 174).
This instrument was administered to the total random sample via the internet, as
solicited by an e-mail containing a link to the survey. The instrument is attached in
Appendix A. The questionnaire’s consent form contained within question 1 gave the
participants a chance to opt out of completing the survey by simply not clicking on the
survey link. If the participants indicated their consent by clicking on the “I consent”
button, they presented with the questionnaire on-screen. Questions 2 through 6 referred
to the demographics of the respondents, which provided a means for verification when
cross-referencing the secondary data from the Role Master File (Texas Education
Agency, 2005b). Questions 7 through 31 were statements measuring the professional
attitude of principals toward diversity on their campus (Pohan & Aguilar, 2001). The
responses to these statements were based on a five-point Likert scale ranging from
strongly agree to strongly disagree. The Likert scale is a measure on which individuals

50
check their level of agreement with various statements about an attitude object. A five-
point Likert scale consisting of strongly agree, agree, undecided, disagree, or strongly
disagree is often used in attitude research instruments (Gall, Borg, & Gall, 1996).
Question 32 had five sub-elements which were intended to measure the subjective
normative effects (opinions of others) upon the principal on a five-point Likert scale
ranging from strongly approve to strongly disapprove. Question 33 measured the level
of perceived behavioral control (difficulty) of the principal regarding the implementation
of diversity along a five point Likert scale ranging from very difficult to very easy.
Finally, question 34 which also had five sub-elements measured the principals’
intentions to implement an awareness of diversity in the campus community beyond the
level recommended by the principal’s district. Responses were measured on a five point
Likert scale from very likely to very unlikely (Ajzen, 1991; Pohan & Aguilar, 2001).
Pilot Test of the Instrument
A focus group of six principals was selected via convenience sampling to pilot
test the instrument. These subjects responded to the instrument and provided feedback
on response time. Also, this group was asked to evaluate the questionnaire in terms of
face validity, i.e., mainly on the issue of clarity of instructions and questions (SPSS, Inc.,
2002). The test of the instrument was limited to the face validity issue only, due to the
fact that the structure itself (the necessity to measure intentions, norms, attitudes, and
control) as well as the language that was to be used in order to measure these constructs
was repeatedly tested by a significant number of researchers who have utilized the TPB
format for a variety of studies as mentioned in the literature review.

51
The pilot test subject group consisted of two principals each from elementary,
middle, and high schools. There were four women and two men, ranging in ages from
39 to 56 years in this group. These principals were presented with the actual electronic
version of the instrument, and their time to respond to the instrument ranged from eleven
minutes to thirteen minutes. No verbal assistance was requested or provided in the pilot
test. All participants in the pilot test answered all questions on the instrument. The
comments from these principals were related to the instructions and the formulation of
the question as they appear in the survey. In general, the principals participating in this
pilot study reported that the instrument was clear in both its instructions and the
questions it contained.
Population and Sampling Design
Population
The subjects that made up the population for this study were all the full-time,
public school principals serving in regular instructional campuses in Texas during the
2004-2005 school year as reported on the Texas Education Agency’s Role Master File
(Texas Education Agency, 2005b). This statewide census contained in the Role Master
File for the school year 2004-2005 of the Texas Education Agency identified 8,281
school principals employed in Texas, of which 7,944 were principals in non-chartered,
public schools; and this population yielded 6,965 principals at regular instructional-only
campuses; of these Texas principals in public, regular instructional-only campuses,
6,161 were full-time principals.
52
Sampling
The following procedure was followed. A random sample of 476 subjects was
selected from the population of 6,161 full-time, public school principals serving on
regular instructional campuses in Texas during the 2004-2005 school year that was
based on school names contained in the Role Master File.
1. Once identified, the school names were cross-referenced with principal names
and e-mail addresses in the AskTED Texas Education Directory that was
maintained by the Texas Education Agency (Texas Education Agency, 2005a).
2. The names and e-mail addresses of those principals at schools included in the
sample but not available in the AskTED directory were then identified by
conducting an Internet search based on school name; in the event that one of the
randomly selected principals did not have an identifiable e-mail account, that
principal was dropped from the sample.
3. A list of principal names and e-mail addresses was then compiled (from data in
the AskTed directory and the internet search), constructed in a spreadsheet, and
electronically cut-and-pasted into software at the SurveyMonkey.com website.
4. The SurveyMonkey software was utilized to generate an e-mail invitation to
these principals to participate in the study. The e-mails included an electronic
link to the online survey. Sixteen of the e-mail invitations were returned as the
school district server or filtering software would not allow for e-mails from
SurveyMonkey.com as it was an unauthorized site, or the intended recipient of
the e-mail was no longer listed at the district.
53
5. The principals indicated their initial willingness to participate in the study by
following the electronic link.
6. Principals wishing to participate in the study had to select the “I consent” button
at the bottom of the consent form contained in the survey itself.
7. Eight e-mails were returned due to the fact that the principal had selected the “I
do not consent” button on the instrument’s consent form.
8. Those principals who consented to continue the survey were presented with the
complete electronic instrument.
Response Rate
The overall response rate was 151 respondents out of a sample of 476 principals,
representing a response rate of 31.72 percent of the total number of questionnaires that
were sent out to potential respondents. This response rate was well within the average
response rates for questionnaires and surveys as determined by Phillips and Phillips
(2004) “based on input from hundreds of participants in our workshops, as well as the
experience of our consulting clients” (Phillips & Phillips, 2004, p. 40). According to
these authors, a thirty percent response rate is appropriate. The 151 respondents exceeds
the minimum sample size of 147 that is needed under the requirements of a 95 percent
confidence level, an eight percent margin of error, and a population of 6,161 full-time
public school principals serving on regular instructional campuses in Texas during the
2004-2005 school year. This result is achieved by using both the sample size calculator
of Creative Research Systems (2005) and the sample size calculator by RaoSoft,
Incorporated (2005), an innovator in online survey data collection efforts on behalf of
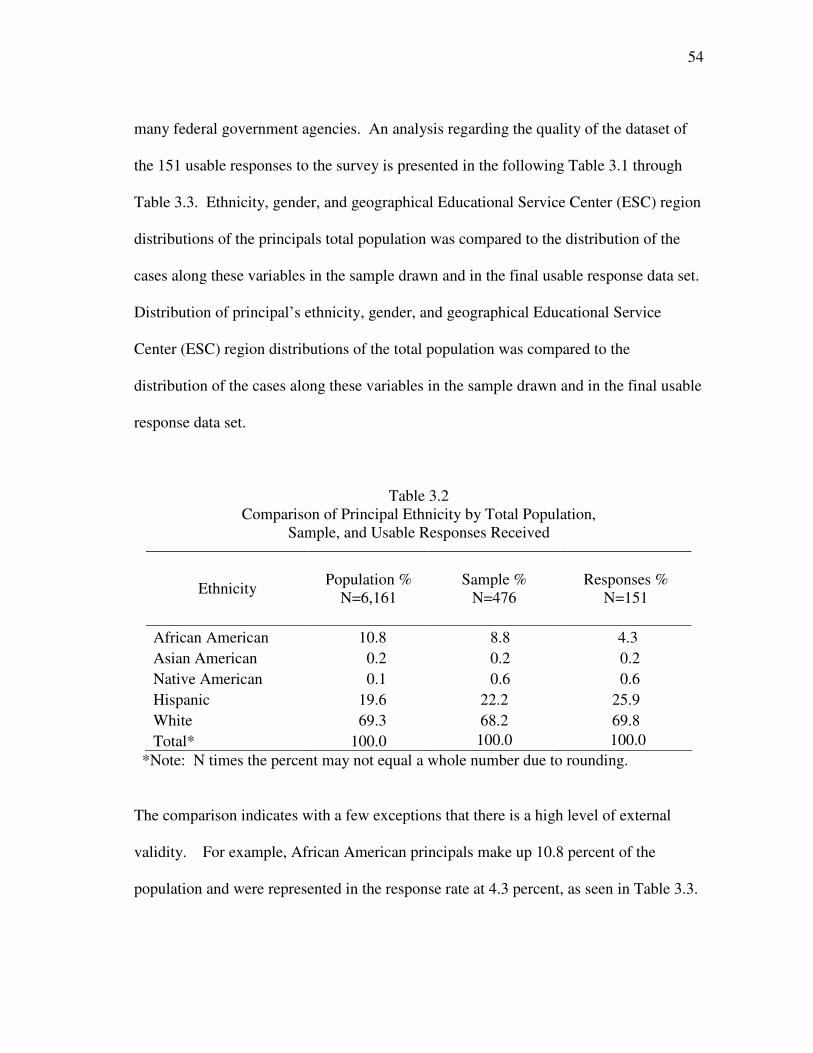
54
many federal government agencies. An analysis regarding the quality of the dataset of
the 151 usable responses to the survey is presented in the following Table 3.1 through
Table 3.3. Ethnicity, gender, and geographical Educational Service Center (ESC) region
distributions of the principals total population was compared to the distribution of the
cases along these variables in the sample drawn and in the final usable response data set.
Distribution of principal’s ethnicity, gender, and geographical Educational Service
Center (ESC) region distributions of the total population was compared to the
distribution of the cases along these variables in the sample drawn and in the final usable
response data set.
Table 3.2 Comparison of Principal Ethnicity by Total Population,
Sample, and Usable Responses Received
*Note: N times the percent may not equal a whole number due to rounding. The comparison indicates with a few exceptions that there is a high level of external
validity. For example, African American principals make up 10.8 percent of the
population and were represented in the response rate at 4.3 percent, as seen in Table 3.3.
Ethnicity Population % N=6,161
Sample % N=476
Responses %
N=151
African American 10.8 8.8 4.3 Asian American 0.2 0.2 0.2 Native American 0.1 0.6 0.6 Hispanic 19.6 22.2 25.9 White 69.3 68.2 69.8 Total* 100.0 100.0 100.0
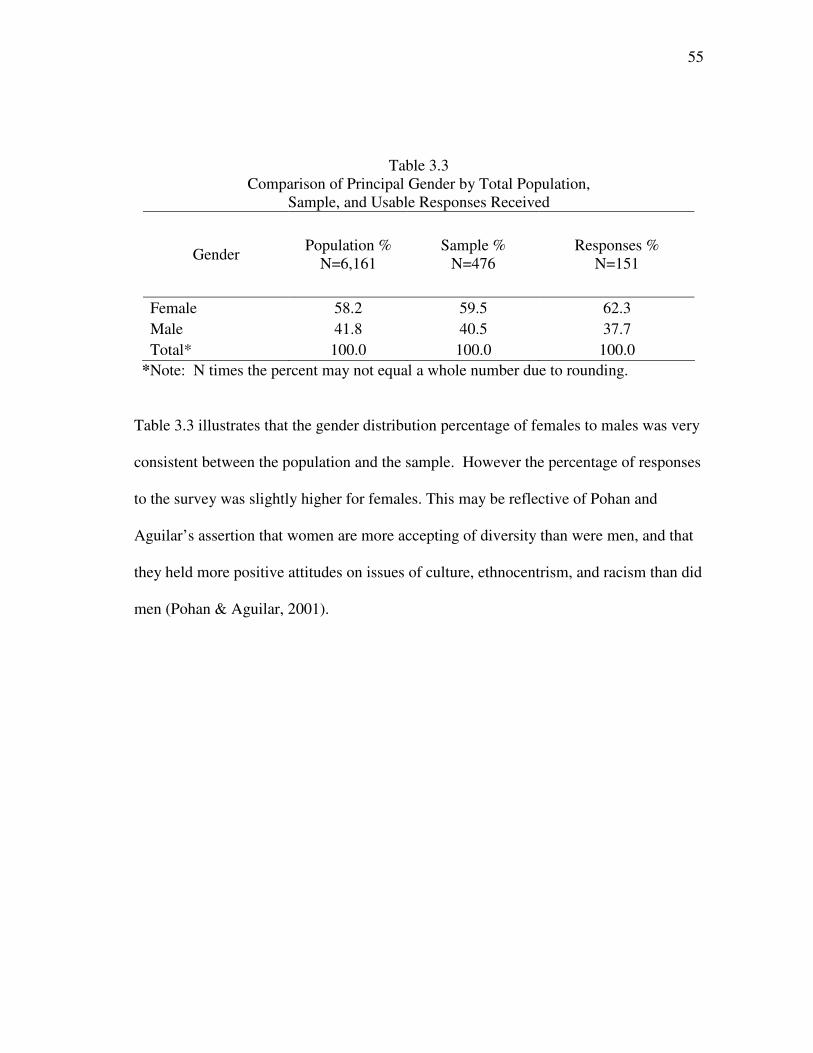
55
Table 3.3 Comparison of Principal Gender by Total Population,
Sample, and Usable Responses Received
Gender Population % N=6,161
Sample % N=476
Responses % N=151
Female 58.2 59.5 62.3 Male 41.8 40.5 37.7 Total* 100.0 100.0 100.0
*Note: N times the percent may not equal a whole number due to rounding. Table 3.3 illustrates that the gender distribution percentage of females to males was very
consistent between the population and the sample. However the percentage of responses
to the survey was slightly higher for females. This may be reflective of Pohan and
Aguilar’s assertion that women are more accepting of diversity than were men, and that
they held more positive attitudes on issues of culture, ethnocentrism, and racism than did
men (Pohan & Aguilar, 2001).
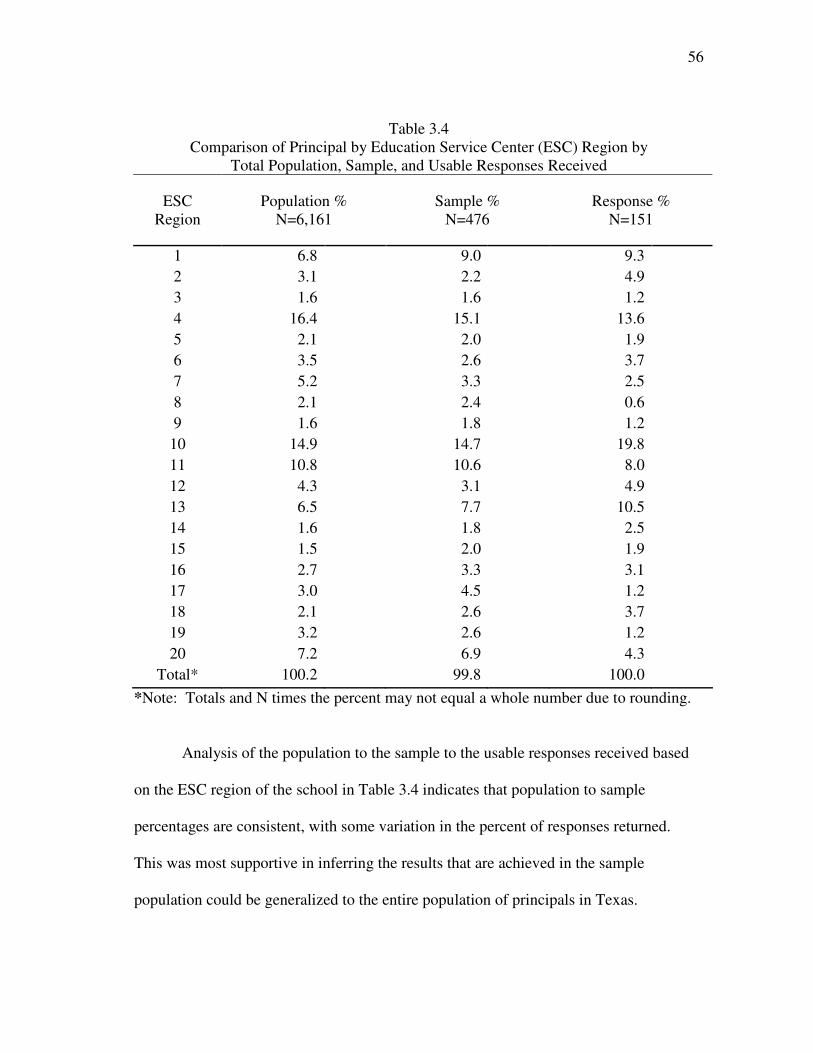
56
Table 3.4 Comparison of Principal by Education Service Center (ESC) Region by
Total Population, Sample, and Usable Responses Received
ESC Region
Population % N=6,161
Sample % N=476
Response % N=151
1 6.8 9.0 9.3 2 3.1 2.2 4.9 3 1.6 1.6 1.2 4 16.4 15.1 13.6 5 2.1 2.0 1.9 6 3.5 2.6 3.7 7 5.2 3.3 2.5 8 2.1 2.4 0.6 9 1.6 1.8 1.2
10 14.9 14.7 19.8 11 10.8 10.6 8.0 12 4.3 3.1 4.9 13 6.5 7.7 10.5 14 1.6 1.8 2.5 15 1.5 2.0 1.9 16 2.7 3.3 3.1 17 3.0 4.5 1.2 18 2.1 2.6 3.7 19 3.2 2.6 1.2 20 7.2 6.9 4.3
Total* 100.2 99.8 100.0 *Note: Totals and N times the percent may not equal a whole number due to rounding. Analysis of the population to the sample to the usable responses received based
on the ESC region of the school in Table 3.4 indicates that population to sample
percentages are consistent, with some variation in the percent of responses returned.
This was most supportive in inferring the results that are achieved in the sample
population could be generalized to the entire population of principals in Texas.
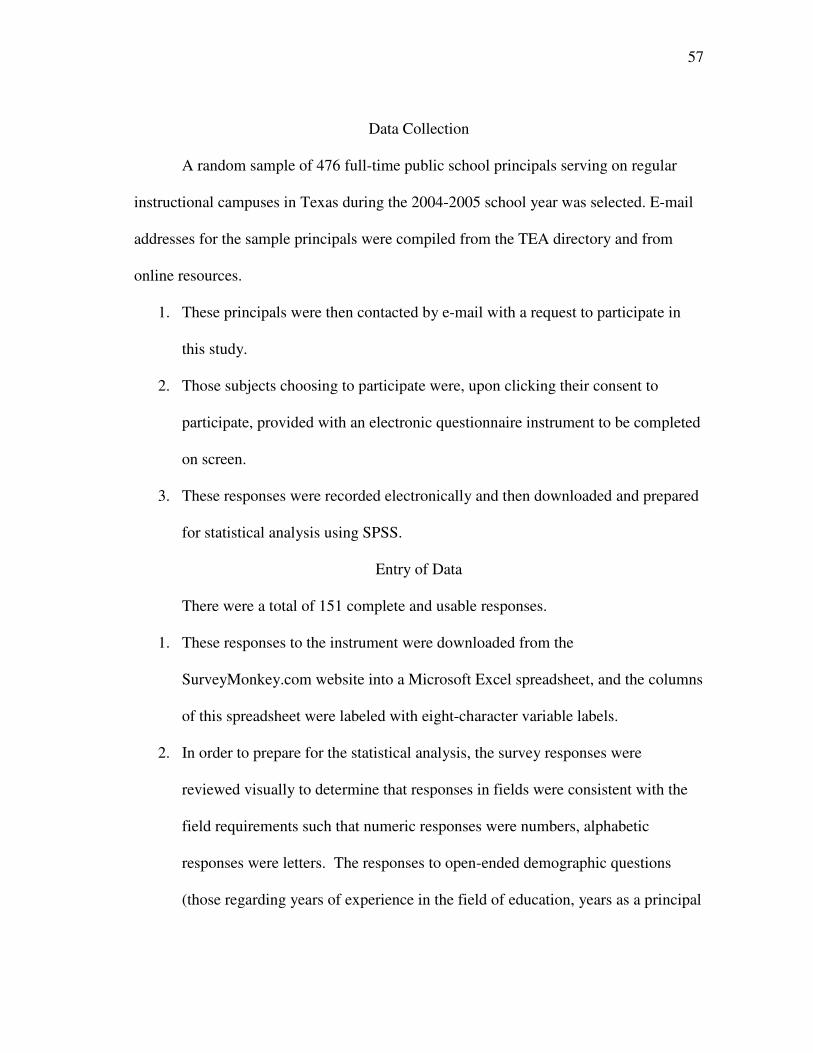
57
Data Collection
A random sample of 476 full-time public school principals serving on regular
instructional campuses in Texas during the 2004-2005 school year was selected. E-mail
addresses for the sample principals were compiled from the TEA directory and from
online resources.
1. These principals were then contacted by e-mail with a request to participate in
this study.
2. Those subjects choosing to participate were, upon clicking their consent to
participate, provided with an electronic questionnaire instrument to be completed
on screen.
3. These responses were recorded electronically and then downloaded and prepared
for statistical analysis using SPSS.
Entry of Data
There were a total of 151 complete and usable responses.
1. These responses to the instrument were downloaded from the
SurveyMonkey.com website into a Microsoft Excel spreadsheet, and the columns
of this spreadsheet were labeled with eight-character variable labels.
2. In order to prepare for the statistical analysis, the survey responses were
reviewed visually to determine that responses in fields were consistent with the
field requirements such that numeric responses were numbers, alphabetic
responses were letters. The responses to open-ended demographic questions
(those regarding years of experience in the field of education, years as a principal
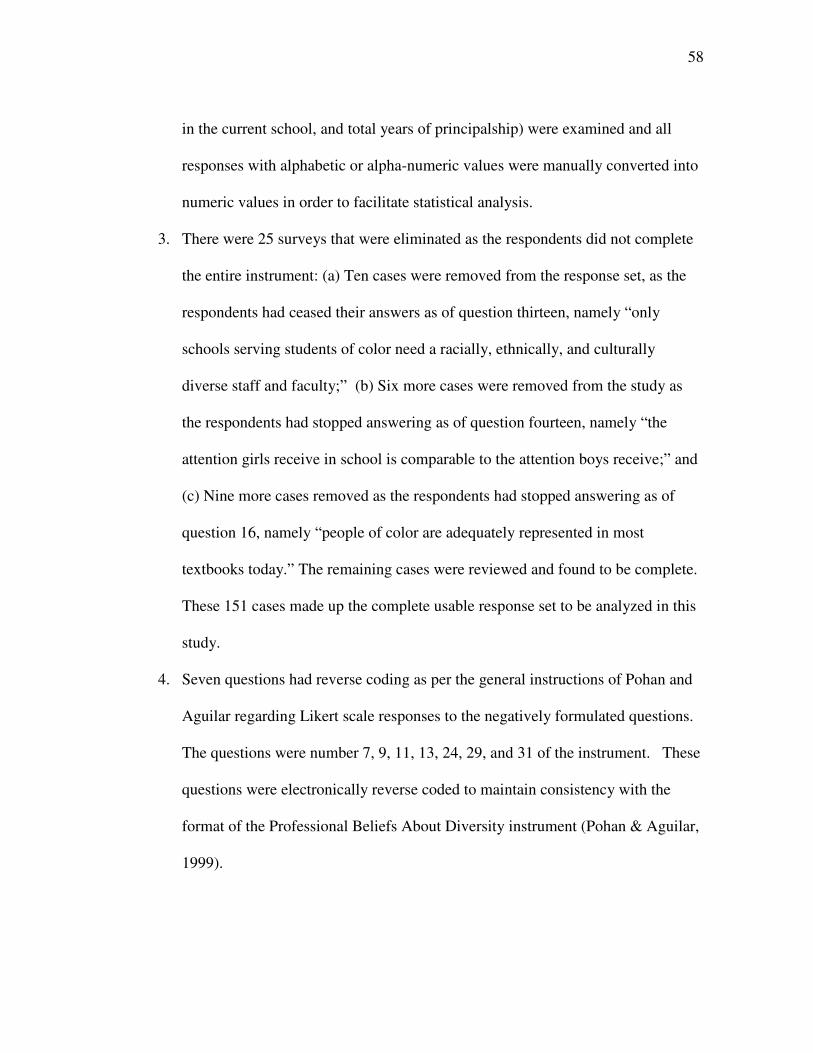
58
in the current school, and total years of principalship) were examined and all
responses with alphabetic or alpha-numeric values were manually converted into
numeric values in order to facilitate statistical analysis.
3. There were 25 surveys that were eliminated as the respondents did not complete
the entire instrument: (a) Ten cases were removed from the response set, as the
respondents had ceased their answers as of question thirteen, namely “only
schools serving students of color need a racially, ethnically, and culturally
diverse staff and faculty;” (b) Six more cases were removed from the study as
the respondents had stopped answering as of question fourteen, namely “the
attention girls receive in school is comparable to the attention boys receive;” and
(c) Nine more cases removed as the respondents had stopped answering as of
question 16, namely “people of color are adequately represented in most
textbooks today.” The remaining cases were reviewed and found to be complete.
These 151 cases made up the complete usable response set to be analyzed in this
study.
4. Seven questions had reverse coding as per the general instructions of Pohan and
Aguilar regarding Likert scale responses to the negatively formulated questions.
The questions were number 7, 9, 11, 13, 24, 29, and 31 of the instrument. These
questions were electronically reverse coded to maintain consistency with the
format of the Professional Beliefs About Diversity instrument (Pohan & Aguilar,
1999).

59
5. The 151 cases were then merged with their corresponding data from the Texas
Education Agency’s 2004-2005 Role Master File data.
6. The complete merged data contained in this sample set was then loaded into
SPSS 11.5 for statistical analysis.
Analysis of Data
The responses of the questionnaire administration entered into the SPSS database
were analyzed at the univariate level by using quantitative statistical methods included in
appropriate SPSS modules, utilizing descriptive methods such as frequencies, measures
of centrality (means) and measures of dispersion (standard deviations). These methods
were followed by analysis of variance to evaluate intentions in relation to five
demographic variables, race/ethnicity, gender, principal’s age, degree, and campus type.
The findings were presented in a correlational matrix, an arrangement of correlation
coefficients in rows and columns that facilitate viewing how each member of a set of
measured variables correlates with all the other variables (Gall, et al., 1996).
The multivariate regression analysis was performed for purposes of testing the
theoretical structure of the construct and finding relationships between a criterion
variable and a combination of two or more predictor variables. Multiple regression “is
one of the most widely used statistical techniques in educational research” because of its
capability of handling interval, ordinal, or categorical predictor variables and requires an
interval level criterion or dependent variable (Gall, et al., 1996, p. 433). Multiple
regression “provides estimates both of the magnitude and statistical significance of
relationships between variables” (Gall, et al. 1996, p. 434). In this study, the interval
60
level dependent variable intentions was regressed against the interval level independent
variables of subjective norms, attitudes, and perceived behavioral control. Also,
demographic variables of principals such as race/ethnicity, gender, campus type, and
age, as control nominal level co-variates were utilized. Findings from the analyses are
presented in Chapter IV.
61
CHAPTER IV
FINDINGS OF THE STUDY
In Chapter III, the data analysis related tasks were outlined. In this chapter, the
description regarding the implementation of the tasks will be presented, including the
analytical findings of the study. The research questions in this study were:
1. Can a theory of planned behavior approach be used to assess school principals’
professional intentions to promote diversity awareness?
2. What are the intentions of Texas principals to promote diversity awareness in
general and among the five diversity dimensions of disabilities, gender, language,
racial/ethnic, and social class in their campus community? and
3. Do these intentions differ among five demographic characteristics of
race/ethnicity, gender, age, degree, and campus type?
The research questions could be classified into two parts: First, the test of the theoretical
structure, via the of the General Principal’s Diversity Intentions (GPDI) model and the
Principal’s Diversity Intentions (PDI) sub-models for the diversity dimensions of
disabilities, gender, language, racial/ethnic, and social class (research question number
one); and second, the implementation/measurement of Texas principals’ intentions using
the confirmed operationalized theoretical structure, as presented by the GPDI and PDI
models, as well as examining their possible related demographic covariate effects
(research questions two and three).
62
Test of the Theoretical Structure
As indicated in Chapter III, a multivariate regression analysis was performed for
purposes of testing the theoretical structure of the GPDI model and the PDI sub-models
covering the five types of diversity examined in this study (disability, gender, language,
racial/ethnic, and social class diversity) to examine the relationships between the
theoretical variables as formulated in research question one:
Can a theory of planned behavior approach be used to assess school
principals’ professional intentions to promote diversity awareness?
To respond to this question, the following was done. The interval level
dependent variable intentions was regressed against the interval level attitudes,
subjective norms, and perceived behavioral control independent variables. The analysis
of the results are presented for the General Principal’s Diversity Intentions Model,
followed by the analysis of the Principal’s Diversity Intentions sub-models for each of
the types of diversity under examination.
Tests of Data Normality, Attitude Scale Reliability, and Additivity
Tests of data normality, attitude scale reliability, and additivity were made to
confirm that the basic conditions necessary for a valid regression analysis were present.
This confirmation was necessary since multivariate analysis techniques share a
foundation of assumptions that represent the requirements of the underlying statistical
theory. The “most fundamental assumption is normality, referring to the shape of the
data distribution for an individual metric variable and its correspondence to the normal
distribution, the benchmark for statistical methods” (Hair, Black, Babin, Anderson, &
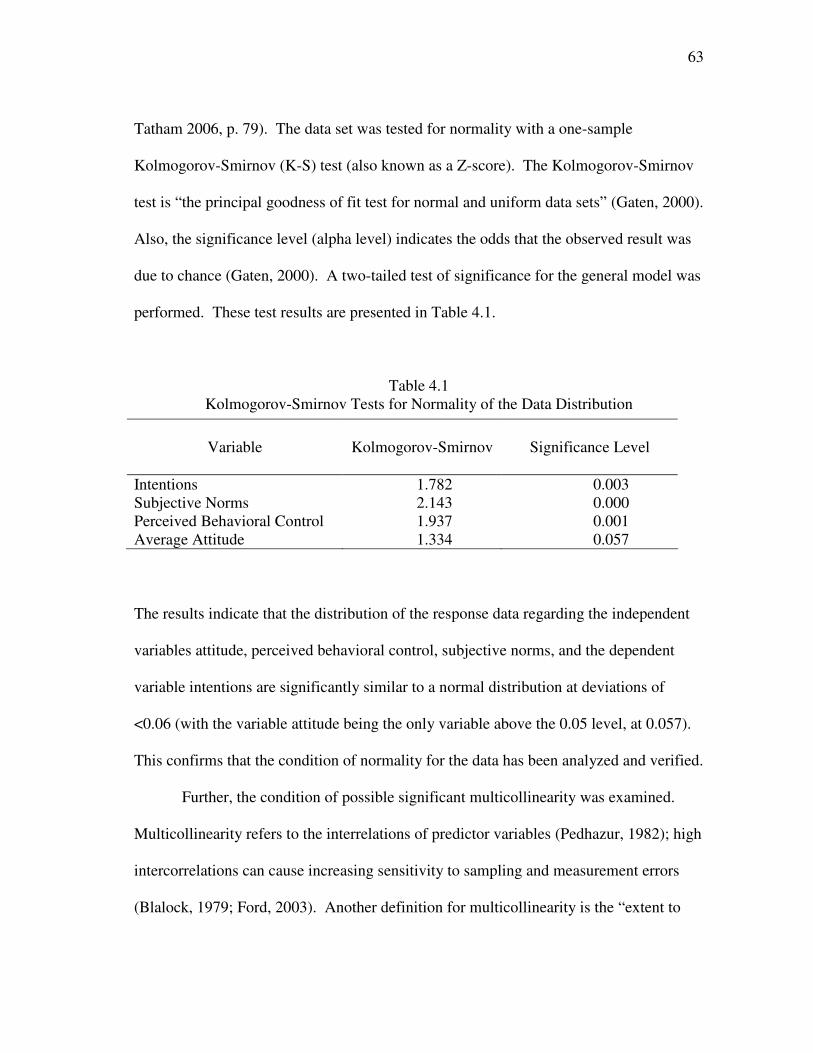
63
Tatham 2006, p. 79). The data set was tested for normality with a one-sample
Kolmogorov-Smirnov (K-S) test (also known as a Z-score). The Kolmogorov-Smirnov
test is “the principal goodness of fit test for normal and uniform data sets” (Gaten, 2000).
Also, the significance level (alpha level) indicates the odds that the observed result was
due to chance (Gaten, 2000). A two-tailed test of significance for the general model was
performed. These test results are presented in Table 4.1.
Table 4.1 Kolmogorov-Smirnov Tests for Normality of the Data Distribution
The results indicate that the distribution of the response data regarding the independent
variables attitude, perceived behavioral control, subjective norms, and the dependent
variable intentions are significantly similar to a normal distribution at deviations of
<0.06 (with the variable attitude being the only variable above the 0.05 level, at 0.057).
This confirms that the condition of normality for the data has been analyzed and verified.
Further, the condition of possible significant multicollinearity was examined.
Multicollinearity refers to the interrelations of predictor variables (Pedhazur, 1982); high
intercorrelations can cause increasing sensitivity to sampling and measurement errors
(Blalock, 1979; Ford, 2003). Another definition for multicollinearity is the “extent to
Variable
Kolmogorov-Smirnov
Significance Level
Intentions 1.782 0.003 Subjective Norms 2.143 0.000 Perceived Behavioral Control 1.937 0.001 Average Attitude 1.334 0.057
64
which a variable can be explained by other variables in the analysis. As multicollinearity
increases, it complicates the interpretation…because it is more difficult to ascertain the
effects of any single variable, owing to the variables’ interrelationships” (Hair, et al., p.
557). Multicollinearity is a problem in that it if the variables under examination are not
discriminant (i.e., there is a high degree of multicollinearity) then the predictive
capability of those variables will also not be discriminant. This in turn can cause
problems in the multiple regression analysis. “A direct measure of multicollinearity is
tolerance, which is defined as the amount of variability of the selected independent
variable not explained by the other independent variables…the tolerance value should be
high, which means a small degree of multicollinearity (i.e., the other independent
variables do not collectively have any substantial amount of shared variance)” (Hair, et
al., 2006, p. 227).
The variance inflation factor (VIF) was also examined, the VIF is the inverse of
the tolerance value; instances of higher degrees of multicollinearity are reflected in
lower tolerance values and consequently higher VIF values. The VIF translates the
tolerance value, which directly expresses the degree of multicollinearity, into an impact
on the estimation process; as the standard error is increased, it makes the confidence
intervals around the estimated coefficients larger, thus making it harder to demonstrate
that the coefficient is significantly different from zero (Hair, et al., 2006, p. 227).
Tolerance scores vary between 0 (perfect collinearity) and 1 (no collinearity) (Baten,
2006). The tolerance and VIF scores for the general model and the five sub-models are
presented in Table 4.2. Again, the general model is referred to as the GPDI. The five

65
Principal’s Diversity Intention (PDI) models for the various dimensions of diversity
(disabilities, gender, language, racial/ethnic, and social class) are listed as the PDI-D,
PDI-G, PDI-L, PDI-R/E, and PDI-SC.
Table 4.2 Regression Data Tolerance and Variance Inflation Factor Scores
Model
Model Element Score
Tolerance
VIF
Average Score Attitude 0.939 1.065
Average Perceived Behavioral Control Diversity 0.894 1.118
GPDI
Average Subjective Norm Diversity 0.878 1.139
Average Perceived Behavioral Control Disability Diversity 0.862 1.16
Average Subjective Norm Disability Diversity 0.858 1.166
PDI - D
Average Attitude Score Disability Diversity 0.886 1.128
Average Perceived Behavioral Control Gender Diversity 0.879 1.138
Average Subjective Norm Gender Diversity 0.875 1.142
PDI - G
Average Attitude Score Gender Diversity 0.988 1.013
Average Perceived Behavioral Control Language Diversity 0.977 1.024
Average Subjective Norm Language Diversity 0.870 1.15
PDI - L
Average Attitude Score Language Diversity 0.855 1.17
Average Perceived Behavioral Control Racial/Ethnic Diversity
0.978 1.023
Average Subjective Norm Racial/Ethnic Diversity 0.873 1.146
PDI - R/E
Average Attitude Score Racial/Ethnic Diversity 0.891 1.122
Average Perceived Behavioral Control Social Class Diversity 0.872 1.147
Average Subjective Norm Social Class Diversity 0.884 1.131
PDI - SC
Average Attitude Score Social Class Diversity 0.977 1.023

66
Tolerance levels from zero to 0.25 indicate a high degree of multicollinearity, and VIF
values equal to or greater than 4.0 indicate multicollinearity as well (Ford, 2003;
Norusis, 2002). Some of the highest tolerance scores are for “Average Attitude Social
Class Diversity” and “Average Perceived Behavioral Control Language Diversity” both
at .0977, and “Average Attitude Score Gender Diversity” at 0.998; this indicates low
levels for multicollinearity, which is one of the significant conditions for the quality of a
regression analysis. The corresponding VIF scores range from 1.013 to 1.17, indicative
as well of low degrees of multicollinearity.
In order to test the reliability of the twenty-five items that were used as the
measure of attitude toward diversity (Pohan & Aguilar, 2001), an item reliability test and
a scale reliability test were performed. Cronbach alpha was used for both reliability
tests. A Cronbach alpha score is a measure of reliability for a test instrument.
“Reliability comes to the forefront when variables developed from summated scales are
used as predictor components in objective models. Variables derived from test
instruments are declared to be reliable only when they provide stable and reliable
responses over a repeated administration of the test” (Santos, 1999). Cronbach alpha
scores verify reliability by testing the degree to which scaled items truly represent the
phenomena they are intended to measure (Cronbach, 1951; El Jaam, 2005). In general it
should be noted that Cronbach alpha scores above 0.7 are considered to be reliable:
Santos (1999) confirms that 0.7 is an acceptable reliability coefficient but lower
thresholds are sometimes used in the literature. Nonetheless, researchers have noted that

67
“attitude scales often yield lower alpha coefficients than tests of intelligence or other
non-attitudinal constructs” (Pohan & Aguilar 2001, p. 173).
A comparison was made between the findings of this study and the comparable
items as reported by Pohan and Aguilar (2001) in their Professional Beliefs about
Diversity Scale. Pohan and Aguilar did not report on the item-by-item Cronbach alpha
scores for the final 1998 scale; therefore, corresponding item-by-item alpha scores from
the 1995 version of the Professional Beliefs about Diversity Scale are presented.
Comparisons of these results are presented in Table 4.3. Pohan and Aguilar (2001)
reported the overall Cronbach alpha score for this 1995 scale as .7500, and the Cronbach
alpha score for their 1998 final version of the Professional Beliefs about Diversity Scale
as .8170. The authors state that this score supports acceptable reliability for the
professional beliefs scale (Pohan & Aguilar, 2001). The Cronbach alpha score for the
Professional Beliefs about Diversity Scale as incorporated in the GPDI was .7861, which
should be considered acceptable for terms of judging reliability. In order to test for
additivity of the scale, an ANOVA analysis was performed to test the hypothesis that the
items within the scale are non-additive. The hypothesis that the scale is non-additive is
strongly rejected at less than 0.000 level, and an f-score of 54.26, which indicates that
the items of the scale are indeed differentiated.
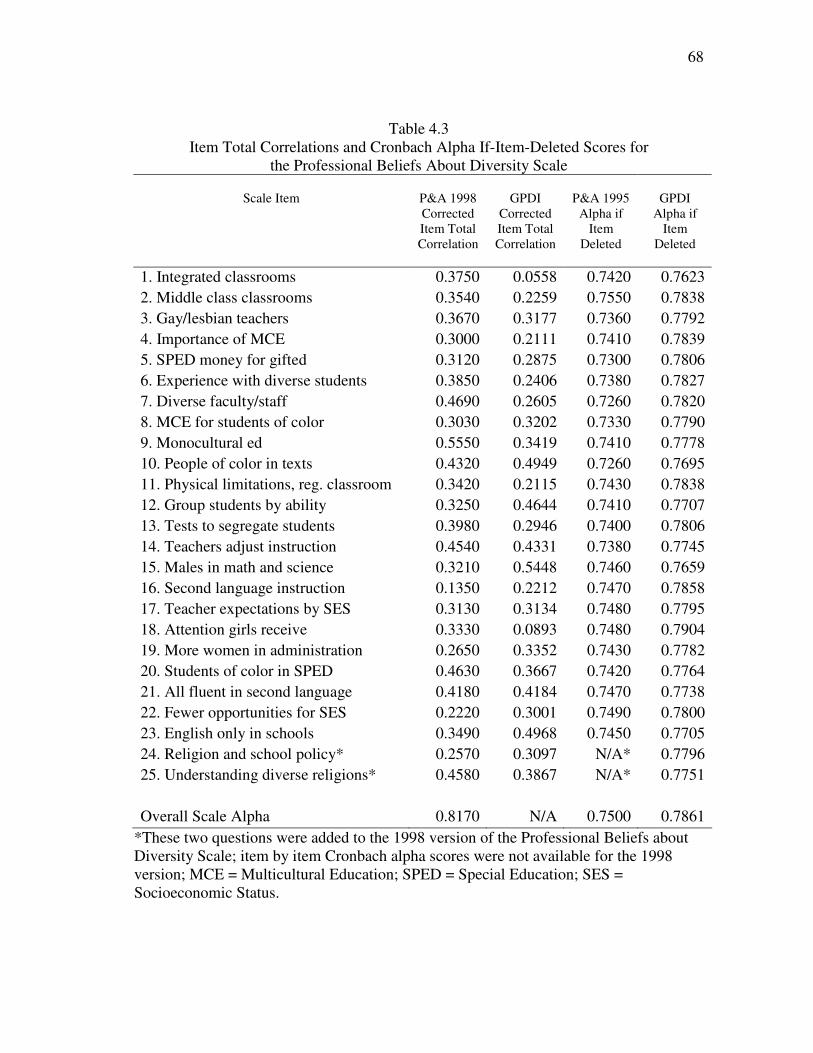
68
Table 4.3 Item Total Correlations and Cronbach Alpha If-Item-Deleted Scores for
the Professional Beliefs About Diversity Scale
Scale Item
P&A 1998 Corrected Item Total Correlation
GPDI
Corrected Item Total Correlation
P&A 1995
Alpha if Item
Deleted
GPDI
Alpha if Item
Deleted
1. Integrated classrooms 0.3750 0.0558 0.7420 0.7623 2. Middle class classrooms 0.3540 0.2259 0.7550 0.7838 3. Gay/lesbian teachers 0.3670 0.3177 0.7360 0.7792 4. Importance of MCE 0.3000 0.2111 0.7410 0.7839 5. SPED money for gifted 0.3120 0.2875 0.7300 0.7806 6. Experience with diverse students 0.3850 0.2406 0.7380 0.7827 7. Diverse faculty/staff 0.4690 0.2605 0.7260 0.7820 8. MCE for students of color 0.3030 0.3202 0.7330 0.7790 9. Monocultural ed 0.5550 0.3419 0.7410 0.7778 10. People of color in texts 0.4320 0.4949 0.7260 0.7695 11. Physical limitations, reg. classroom 0.3420 0.2115 0.7430 0.7838 12. Group students by ability 0.3250 0.4644 0.7410 0.7707 13. Tests to segregate students 0.3980 0.2946 0.7400 0.7806 14. Teachers adjust instruction 0.4540 0.4331 0.7380 0.7745 15. Males in math and science 0.3210 0.5448 0.7460 0.7659 16. Second language instruction 0.1350 0.2212 0.7470 0.7858 17. Teacher expectations by SES 0.3130 0.3134 0.7480 0.7795 18. Attention girls receive 0.3330 0.0893 0.7480 0.7904 19. More women in administration 0.2650 0.3352 0.7430 0.7782 20. Students of color in SPED 0.4630 0.3667 0.7420 0.7764 21. All fluent in second language 0.4180 0.4184 0.7470 0.7738 22. Fewer opportunities for SES 0.2220 0.3001 0.7490 0.7800 23. English only in schools 0.3490 0.4968 0.7450 0.7705 24. Religion and school policy* 0.2570 0.3097 N/A* 0.7796 25. Understanding diverse religions* 0.4580 0.3867 N/A* 0.7751 Overall Scale Alpha 0.8170 N/A 0.7500 0.7861
*These two questions were added to the 1998 version of the Professional Beliefs about Diversity Scale; item by item Cronbach alpha scores were not available for the 1998 version; MCE = Multicultural Education; SPED = Special Education; SES = Socioeconomic Status.
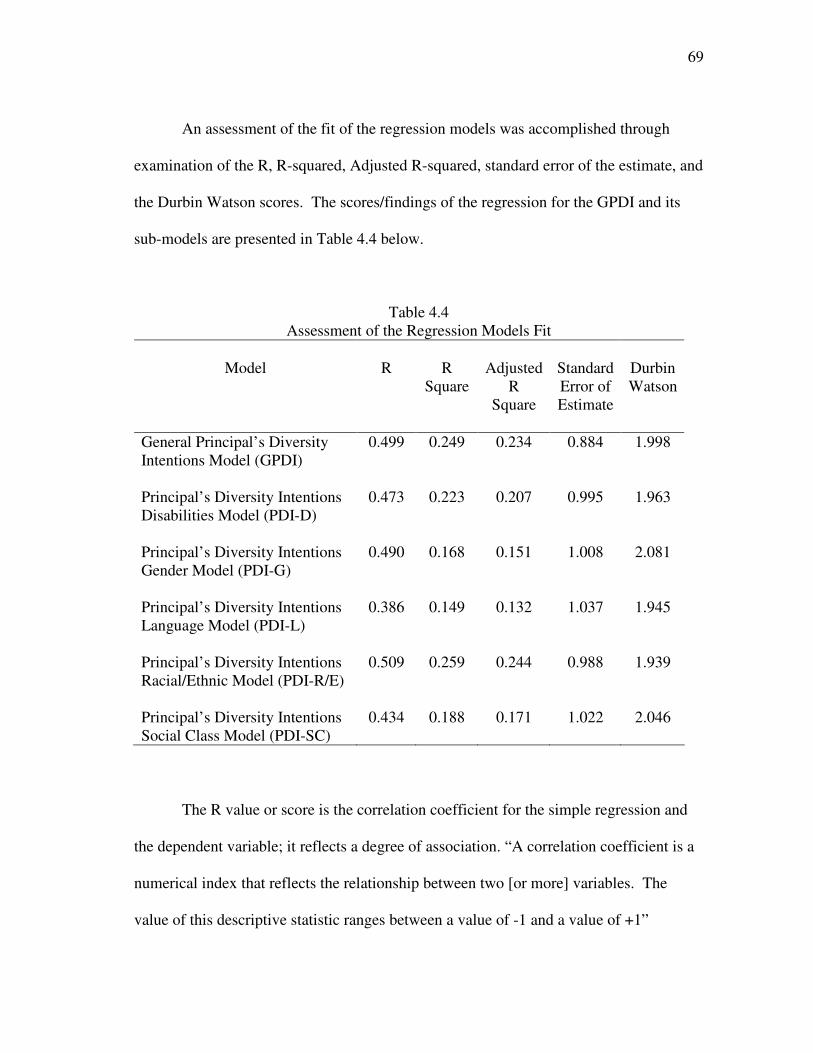
69
An assessment of the fit of the regression models was accomplished through
examination of the R, R-squared, Adjusted R-squared, standard error of the estimate, and
the Durbin Watson scores. The scores/findings of the regression for the GPDI and its
sub-models are presented in Table 4.4 below.
Table 4.4 Assessment of the Regression Models Fit
Model
R
R
Square
Adjusted
R Square
Standard Error of Estimate
Durbin Watson
General Principal’s Diversity Intentions Model (GPDI)
0.499 0.249 0.234 0.884 1.998
Principal’s Diversity Intentions Disabilities Model (PDI-D)
0.473 0.223 0.207 0.995 1.963
Principal’s Diversity Intentions Gender Model (PDI-G)
0.490 0.168 0.151 1.008 2.081
Principal’s Diversity Intentions Language Model (PDI-L)
0.386 0.149 0.132 1.037 1.945
Principal’s Diversity Intentions Racial/Ethnic Model (PDI-R/E)
0.509 0.259 0.244 0.988 1.939
Principal’s Diversity Intentions Social Class Model (PDI-SC)
0.434 0.188 0.171 1.022 2.046
The R value or score is the correlation coefficient for the simple regression and
the dependent variable; it reflects a degree of association. “A correlation coefficient is a
numerical index that reflects the relationship between two [or more] variables. The
value of this descriptive statistic ranges between a value of -1 and a value of +1”
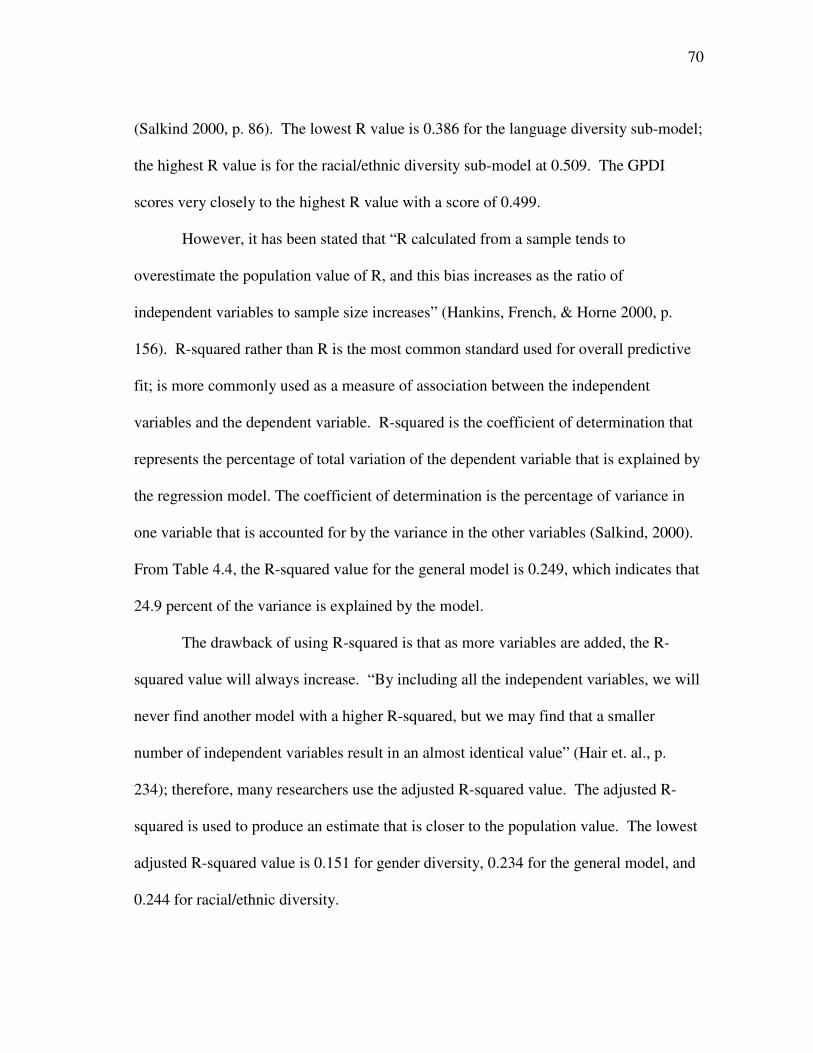
70
(Salkind 2000, p. 86). The lowest R value is 0.386 for the language diversity sub-model;
the highest R value is for the racial/ethnic diversity sub-model at 0.509. The GPDI
scores very closely to the highest R value with a score of 0.499.
However, it has been stated that “R calculated from a sample tends to
overestimate the population value of R, and this bias increases as the ratio of
independent variables to sample size increases” (Hankins, French, & Horne 2000, p.
156). R-squared rather than R is the most common standard used for overall predictive
fit; is more commonly used as a measure of association between the independent
variables and the dependent variable. R-squared is the coefficient of determination that
represents the percentage of total variation of the dependent variable that is explained by
the regression model. The coefficient of determination is the percentage of variance in
one variable that is accounted for by the variance in the other variables (Salkind, 2000).
From Table 4.4, the R-squared value for the general model is 0.249, which indicates that
24.9 percent of the variance is explained by the model.
The drawback of using R-squared is that as more variables are added, the R-
squared value will always increase. “By including all the independent variables, we will
never find another model with a higher R-squared, but we may find that a smaller
number of independent variables result in an almost identical value” (Hair et. al., p.
234); therefore, many researchers use the adjusted R-squared value. The adjusted R-
squared is used to produce an estimate that is closer to the population value. The lowest
adjusted R-squared value is 0.151 for gender diversity, 0.234 for the general model, and
0.244 for racial/ethnic diversity.
71
The standard error of the estimate is another measure of accuracy for a multiple
regression model’s predictions; it represents an estimate of the standard deviation
(variance) of the actual dependent values around the regression line (Hair, et. al., 2006).
The variation around the regression line provides another perspective as a measure to
assess the absolute size of the prediction error; also, is used to estimate the size of the
confidence interval for the predictions (Hair et. al., 2006). The standard error of the
estimate for the general and sub-models ranged from 0.884 for the general model to
1.037 for the language diversity sub-model.
“The Durbin-Watson test is a test for first-order serial correlation in the residuals
of a time series regression. A value of 2.0 for the Durbin-Watson statistic indicates that
there is no serial correlation” (Greene, 1993), which is a significant condition that
indicates the degree to which the independent variables are sufficiently isolated from
each other so that the regression values truly measure the contribution of each and every
variable separately without possible cross-variable contaminations. As seen in Table
4.4, the Durbin Watson score for the general model (GPDI) was 1.998, rounded up to the
next whole number is a value of 2.000, which is the “ideal” Durbin Watson measure of
independence as indicated above, and reaffirms the quality of the GPDI. The sub-
models vary from a low of 1.939 on the racial/ethnic sub-model, to a high of 2.081 on
the gender sub-model; all these values are very close to the ideal 2.000, and could be
interpreted as indicating a high level of isolation among the independent variables of the
models.
72
In testing theoretical models it is significant to examine beta scores in order to
determine the relative importance of each variable toward the changes of the dependent
variable diversity. “The regression coefficient B and the standardized coefficient beta
reflect the change in the dependent measure for each unit change in the independent
variable. Comparison between regression coefficients allows for a relative assessment
of each variables importance in the regression model,” (Hair et. al., 2006, p. 238). Both
B and beta measure similar concepts, where B is the unstandardized coefficient and beta
is the value of the standardized regression coefficient calculated from standardized data.
“The standard error of the regression coefficient is an estimate of how much the
regression coefficient will vary between samples of the same size taken from the same
population. In a simple sense it is the standard deviation of the estimates of B across
multiple samples” (Hair et. al., 2006, p. 238). It is therefore more acceptable in
statistical evaluations to look at the beta values for the estimate of the relative
importance of each of the independent variables rather than B. The values for B and
Beta are presented in the following Table 4.5, along with the standard error, t-test, and
significance results.
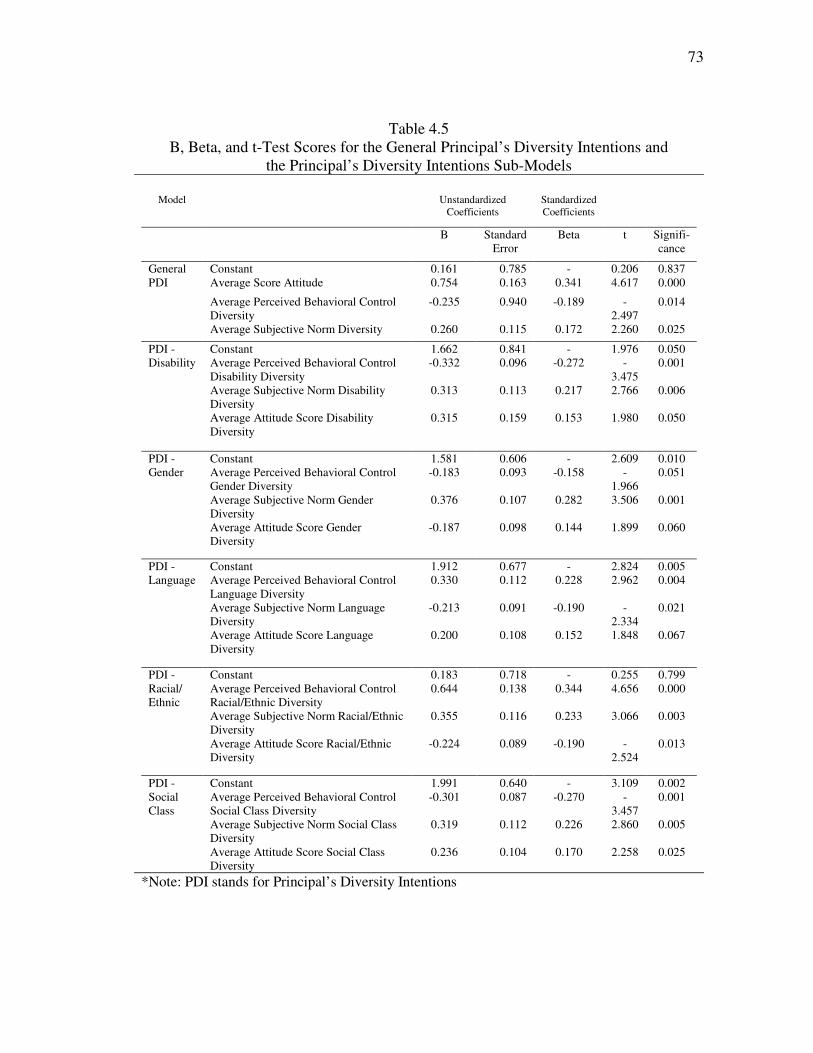
73
Table 4.5 B, Beta, and t-Test Scores for the General Principal’s Diversity Intentions and
the Principal’s Diversity Intentions Sub-Models
Model Unstandardized Coefficients
Standardized Coefficients
B Standard Error
Beta t Signifi-cance
General Constant 0.161 0.785 - 0.206 0.837 PDI Average Score Attitude 0.754 0.163 0.341 4.617 0.000
Average Perceived Behavioral Control Diversity
-0.235 0.940 -0.189 -2.497
0.014
Average Subjective Norm Diversity 0.260 0.115 0.172 2.260 0.025
PDI - Constant 1.662 0.841 - 1.976 0.050 Disability Average Perceived Behavioral Control
Disability Diversity -0.332 0.096 -0.272 -
3.475 0.001
Average Subjective Norm Disability Diversity
0.313 0.113 0.217 2.766 0.006
Average Attitude Score Disability Diversity
0.315 0.159 0.153 1.980 0.050
PDI - Constant 1.581 0.606 - 2.609 0.010 Gender Average Perceived Behavioral Control
Gender Diversity -0.183 0.093 -0.158 -
1.966 0.051
Average Subjective Norm Gender Diversity
0.376 0.107 0.282 3.506 0.001
Average Attitude Score Gender Diversity
-0.187 0.098 0.144 1.899 0.060
PDI - Constant 1.912 0.677 - 2.824 0.005 Language Average Perceived Behavioral Control
Language Diversity 0.330 0.112 0.228 2.962 0.004
Average Subjective Norm Language Diversity
-0.213 0.091 -0.190 -2.334
0.021
Average Attitude Score Language Diversity
0.200 0.108 0.152 1.848 0.067
PDI - Constant 0.183 0.718 - 0.255 0.799 Racial/ Ethnic
Average Perceived Behavioral Control Racial/Ethnic Diversity
0.644 0.138 0.344 4.656 0.000
Average Subjective Norm Racial/Ethnic Diversity
0.355 0.116 0.233 3.066 0.003
Average Attitude Score Racial/Ethnic Diversity
-0.224 0.089 -0.190 -2.524
0.013
PDI - Constant 1.991 0.640 - 3.109 0.002 Social Class
Average Perceived Behavioral Control Social Class Diversity
-0.301 0.087 -0.270 -3.457
0.001
Average Subjective Norm Social Class Diversity
0.319 0.112 0.226 2.860 0.005
Average Attitude Score Social Class Diversity
0.236 0.104 0.170 2.258 0.025 *Note: PDI stands for Principal’s Diversity Intentions

74
Especially in the general model, attitude was the overwhelmingly most important factor
with almost double the effect of either of the remaining two independent variables, with
a beta of 0.341. This is an expected result since early Fishbein models began with
attitude as the best predictor of behavior. Even so, the development of Fishbein’s
theory (i.e., adding in the constructs of perceived behavioral control and societal norms)
increase the adjusted r-squared and add to the explanatory power of the model. In the
diversity sub-models, the importance of attitude varies somewhat.
In the disabilities sub-model, the perceived behavioral control outweighs the
other variables, but the values are quite close to each other, ranging from -0.27 through
0.15. In the gender sub-model, the subjective norm is predominant with a beta of 0.282.
In the language sub-model, we see a repetition of the relative importance as in the
general model, namely that the average attitude score is the highest with a beta of 0.228.
The importance of the attitude ranks first in the race/ethnicity model at 0.334; and
finally, in the social class sub-model, the most dominant variable is the perceived
behavioral control at -0.25, followed closely by the average subjective norm toward
social class diversity at 0.226.
Utilizing Analysis of Variance as a Scientific Confirmation of
the GPDI and PDI Sub-Models
The major test of the theoretical model and sub-models as presented in Chapter
III and described in this chapter was performed through a regression analysis in which
attitude, perceived behavioral control, and subjective norms were regressed against
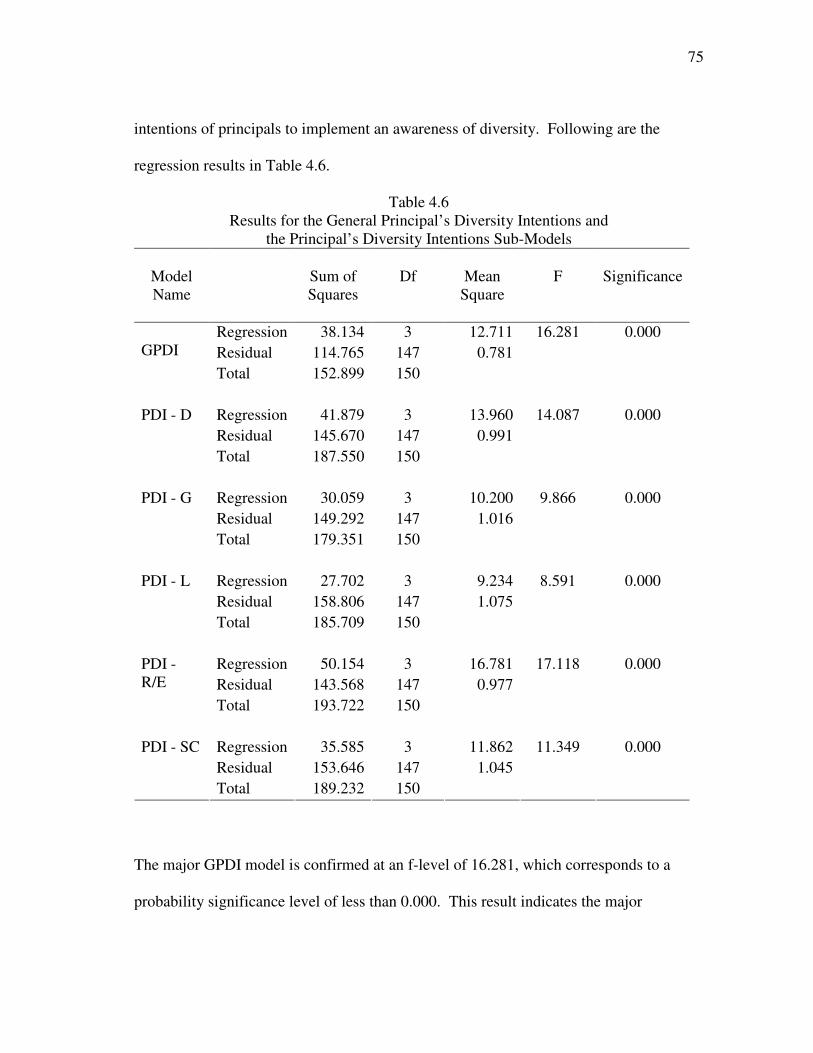
75
intentions of principals to implement an awareness of diversity. Following are the
regression results in Table 4.6.
Table 4.6 Results for the General Principal’s Diversity Intentions and
the Principal’s Diversity Intentions Sub-Models
Model Name
Sum of Squares
Df
Mean
Square
F
Significance
Regression 38.134 3 12.711 16.281 0.000 Residual 114.765 147 0.781
GPDI
Total 152.899 150
Regression 41.879 3 13.960 14.087 0.000 Residual 145.670 147 0.991
PDI - D
Total 187.550 150
Regression 30.059 3 10.200 9.866 0.000 Residual 149.292 147 1.016
PDI - G
Total 179.351 150
Regression 27.702 3 9.234 8.591 0.000 Residual 158.806 147 1.075
PDI - L
Total 185.709 150
Regression 50.154 3 16.781 17.118 0.000 Residual 143.568 147 0.977
PDI - R/E
Total 193.722 150
Regression 35.585 3 11.862 11.349 0.000 Residual 153.646 147 1.045
PDI - SC
Total 189.232 150 The major GPDI model is confirmed at an f-level of 16.281, which corresponds to a
probability significance level of less than 0.000. This result indicates the major
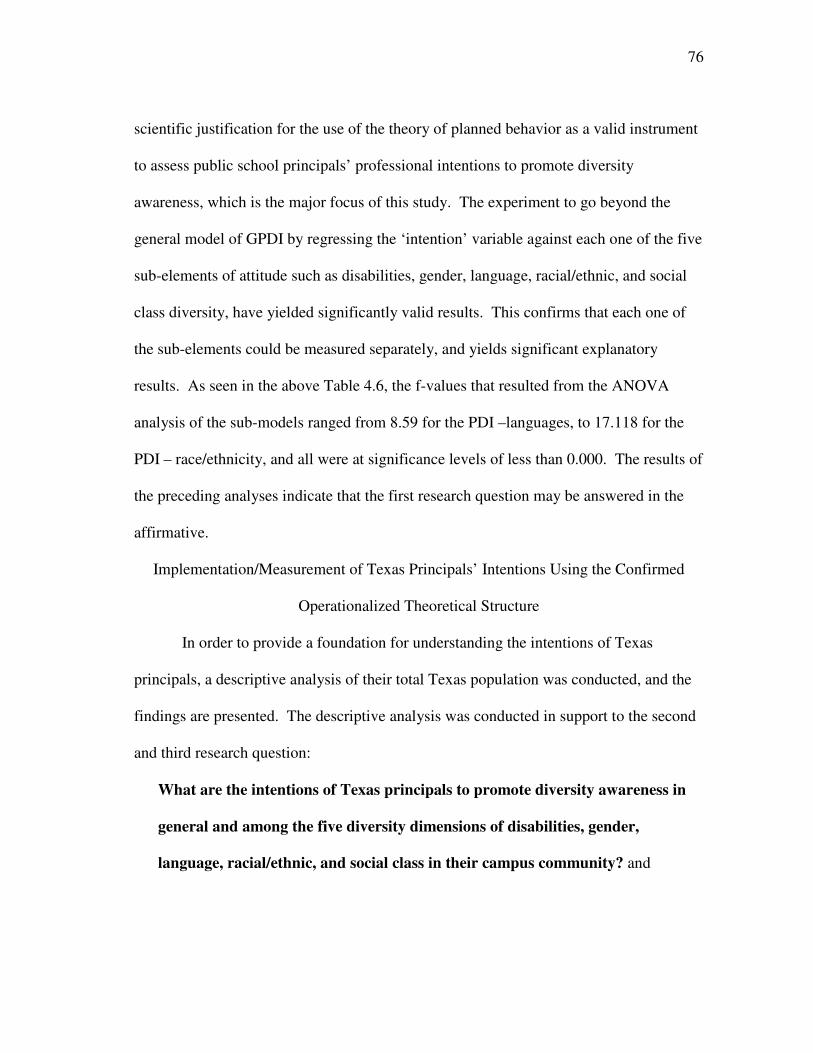
76
scientific justification for the use of the theory of planned behavior as a valid instrument
to assess public school principals’ professional intentions to promote diversity
awareness, which is the major focus of this study. The experiment to go beyond the
general model of GPDI by regressing the ‘intention’ variable against each one of the five
sub-elements of attitude such as disabilities, gender, language, racial/ethnic, and social
class diversity, have yielded significantly valid results. This confirms that each one of
the sub-elements could be measured separately, and yields significant explanatory
results. As seen in the above Table 4.6, the f-values that resulted from the ANOVA
analysis of the sub-models ranged from 8.59 for the PDI –languages, to 17.118 for the
PDI – race/ethnicity, and all were at significance levels of less than 0.000. The results of
the preceding analyses indicate that the first research question may be answered in the
affirmative.
Implementation/Measurement of Texas Principals’ Intentions Using the Confirmed
Operationalized Theoretical Structure
In order to provide a foundation for understanding the intentions of Texas
principals, a descriptive analysis of their total Texas population was conducted, and the
findings are presented. The descriptive analysis was conducted in support to the second
and third research question:
What are the intentions of Texas principals to promote diversity awareness in
general and among the five diversity dimensions of disabilities, gender,
language, racial/ethnic, and social class in their campus community? and
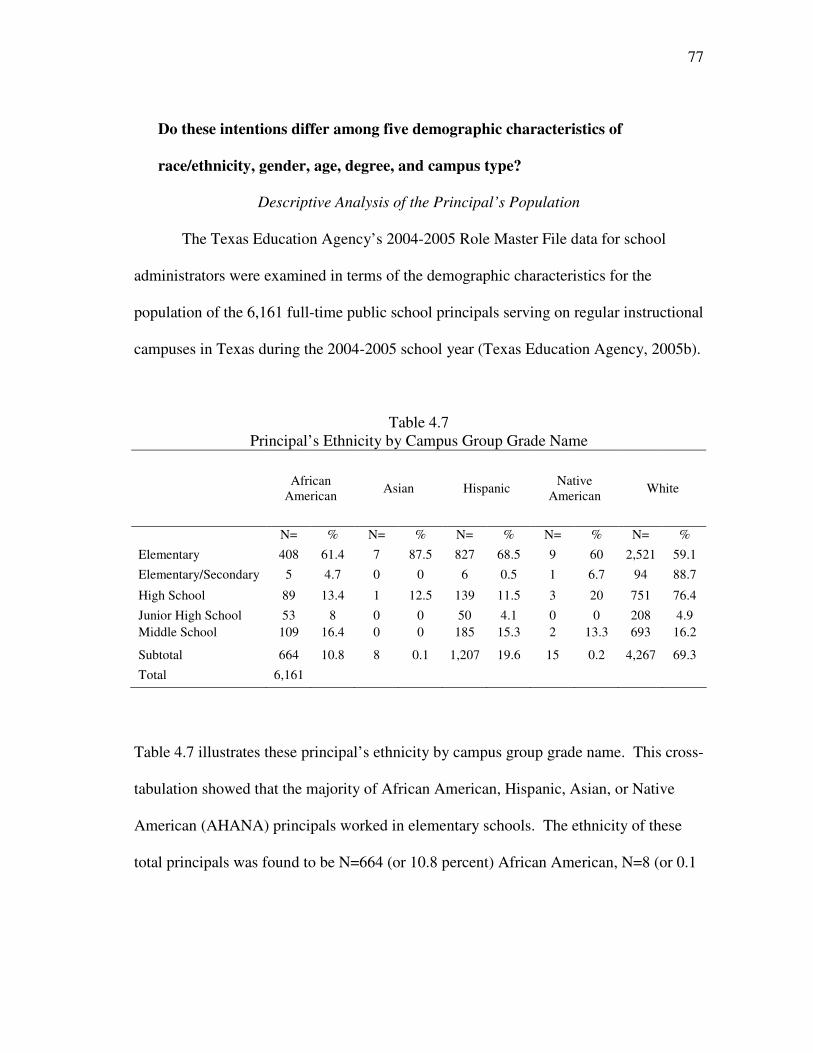
77
Do these intentions differ among five demographic characteristics of
race/ethnicity, gender, age, degree, and campus type?
Descriptive Analysis of the Principal’s Population
The Texas Education Agency’s 2004-2005 Role Master File data for school
administrators were examined in terms of the demographic characteristics for the
population of the 6,161 full-time public school principals serving on regular instructional
campuses in Texas during the 2004-2005 school year (Texas Education Agency, 2005b).
Table 4.7 Principal’s Ethnicity by Campus Group Grade Name
African American Asian Hispanic Native
American White
N= % N= % N= % N= % N= %
Elementary 408 61.4 7 87.5 827 68.5 9 60 2,521 59.1 Elementary/Secondary 5 4.7 0 0 6 0.5 1 6.7 94 88.7
High School 89 13.4 1 12.5 139 11.5 3 20 751 76.4 Junior High School 53 8 0 0 50 4.1 0 0 208 4.9 Middle School 109 16.4 0 0 185 15.3 2 13.3 693 16.2
Subtotal 664 10.8 8 0.1 1,207 19.6 15 0.2 4,267 69.3 Total 6,161
Table 4.7 illustrates these principal’s ethnicity by campus group grade name. This cross-
tabulation showed that the majority of African American, Hispanic, Asian, or Native
American (AHANA) principals worked in elementary schools. The ethnicity of these
total principals was found to be N=664 (or 10.8 percent) African American, N=8 (or 0.1

78
percent) Asian, N=1,207 (or 19.6 percent) Hispanic, N=15 (or 0.2 percent) Native
American, and N=4,267 (or 69.3 percent) White.
Table 4.8 Principal’s Level of Education by Degree
No
degree
Bachelor's degree
Master's degree
Doctorate degree
Count N=14 N=392 N=5,479 N=276 Percent 0.2 6.4 88.9 4.5
As seen in Table 4.8, the population of principals had a varied level of education, with
most (N=5,479 or 88.9 percent) holding a Master’s degree. A few principals (N=14)
held no degree, as seen in Table 4.8. The overwhelming majority of these principals
served at independent school districts (N=6,157 principals) as compared to those at
common school districts (N=4), which are very rural school districts usually without a
high school (Texas Education Agency, 2005b).
As illustrated in Table 4.9, the category of school districts where these principals
worked was also varied.
Table 4.9 Principal’s Work Location by Type of Area
Major
Suburban Area
Major Urban Area
Other Central
City Area
Other Central
City Suburban
Non-Metro Stable Area
Indepen-dent Town
Non-Metro Fast
Growing Area
Rural Area
Count N=1,551 N=1,067 N=916 N=810 N=800 N=471 N=100 N=446
Percent 25.2 17.3 14.9 13.1 13 7.6 1.6 7.3
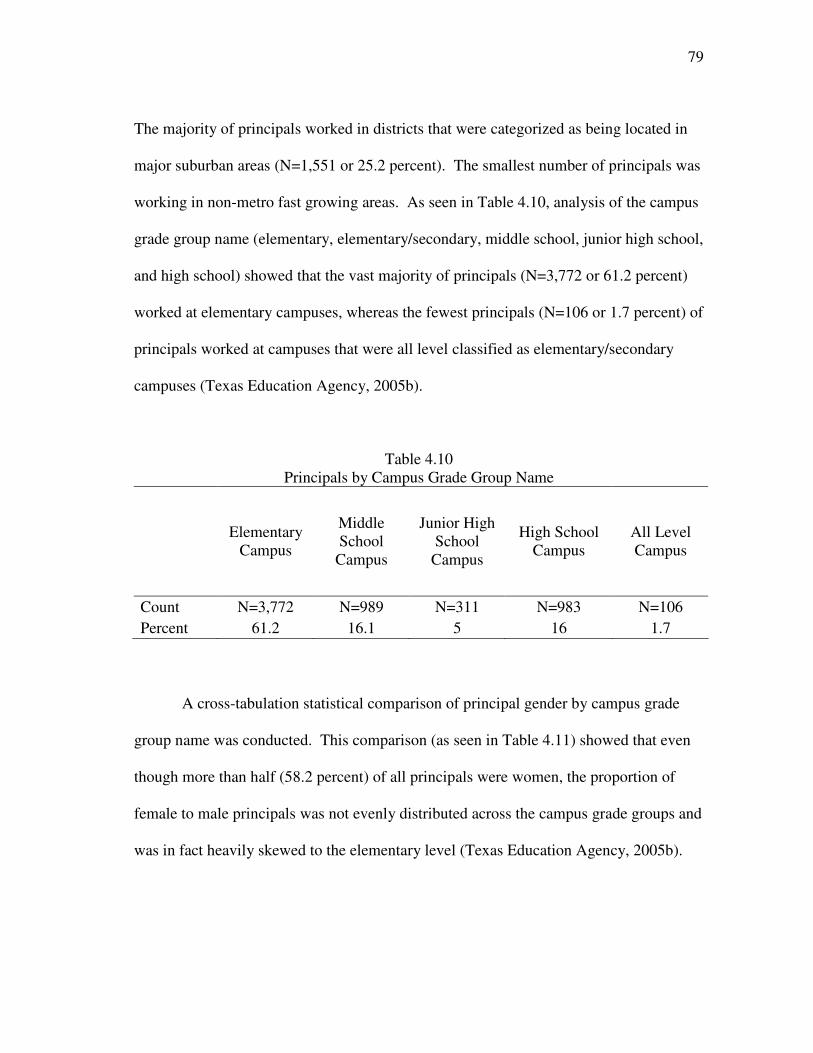
79
The majority of principals worked in districts that were categorized as being located in
major suburban areas (N=1,551 or 25.2 percent). The smallest number of principals was
working in non-metro fast growing areas. As seen in Table 4.10, analysis of the campus
grade group name (elementary, elementary/secondary, middle school, junior high school,
and high school) showed that the vast majority of principals (N=3,772 or 61.2 percent)
worked at elementary campuses, whereas the fewest principals (N=106 or 1.7 percent) of
principals worked at campuses that were all level classified as elementary/secondary
campuses (Texas Education Agency, 2005b).
Table 4.10 Principals by Campus Grade Group Name
Elementary Campus
Middle School
Campus
Junior High School
Campus
High School Campus
All Level Campus
Count N=3,772 N=989 N=311 N=983 N=106 Percent 61.2 16.1 5 16 1.7
A cross-tabulation statistical comparison of principal gender by campus grade
group name was conducted. This comparison (as seen in Table 4.11) showed that even
though more than half (58.2 percent) of all principals were women, the proportion of
female to male principals was not evenly distributed across the campus grade groups and
was in fact heavily skewed to the elementary level (Texas Education Agency, 2005b).

80
Table 4.11 Principal’s Gender by Campus Grade Group Name
Elementary Middle School
Junior High
School
High School All Level Totals
Percent Female 72.2 44.6 37.3 26.9 37.7 58.2
Percent Male 27.8 55.4 62.7 73.1 62.3 41.8
Totals 100.0 100.0 100.0 100.0 100.0 100.0
Descriptive Analysis of the Respondents’ Population
The Texas Education Agency’s 2004-2005 Role Master File data for school
administrators were examined in terms of the demographic characteristics for the 151
principals who responded to the survey. These principals were part of a random sample
of the 6,161 full-time public school principals serving on regular instructional campuses
in Texas during the 2004-2005 school year (Texas Education Agency, 2005b).
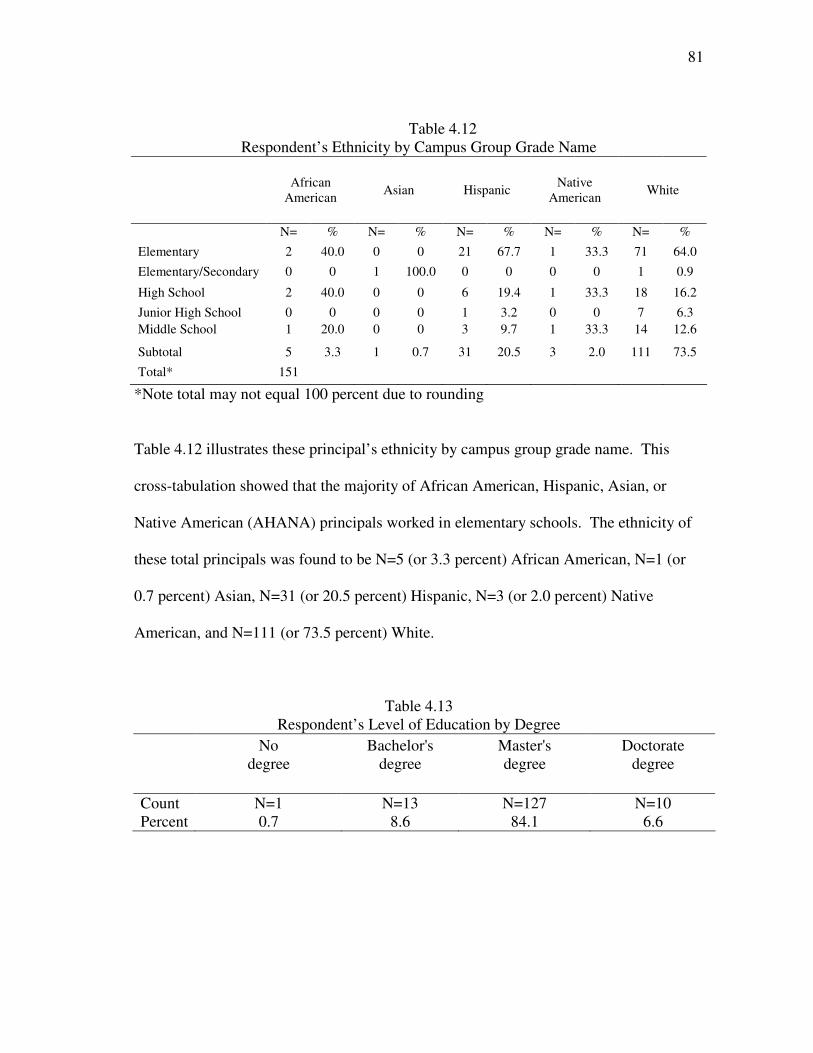
81
Table 4.12 Respondent’s Ethnicity by Campus Group Grade Name
African American Asian Hispanic Native
American White
N= % N= % N= % N= % N= %
Elementary 2 40.0 0 0 21 67.7 1 33.3 71 64.0 Elementary/Secondary 0 0 1 100.0 0 0 0 0 1 0.9
High School 2 40.0 0 0 6 19.4 1 33.3 18 16.2 Junior High School 0 0 0 0 1 3.2 0 0 7 6.3 Middle School 1 20.0 0 0 3 9.7 1 33.3 14 12.6
Subtotal 5 3.3 1 0.7 31 20.5 3 2.0 111 73.5 Total* 151
*Note total may not equal 100 percent due to rounding Table 4.12 illustrates these principal’s ethnicity by campus group grade name. This
cross-tabulation showed that the majority of African American, Hispanic, Asian, or
Native American (AHANA) principals worked in elementary schools. The ethnicity of
these total principals was found to be N=5 (or 3.3 percent) African American, N=1 (or
0.7 percent) Asian, N=31 (or 20.5 percent) Hispanic, N=3 (or 2.0 percent) Native
American, and N=111 (or 73.5 percent) White.
Table 4.13 Respondent’s Level of Education by Degree
No
degree
Bachelor's degree
Master's degree
Doctorate degree
Count N=1 N=13 N=127 N=10 Percent 0.7 8.6 84.1 6.6
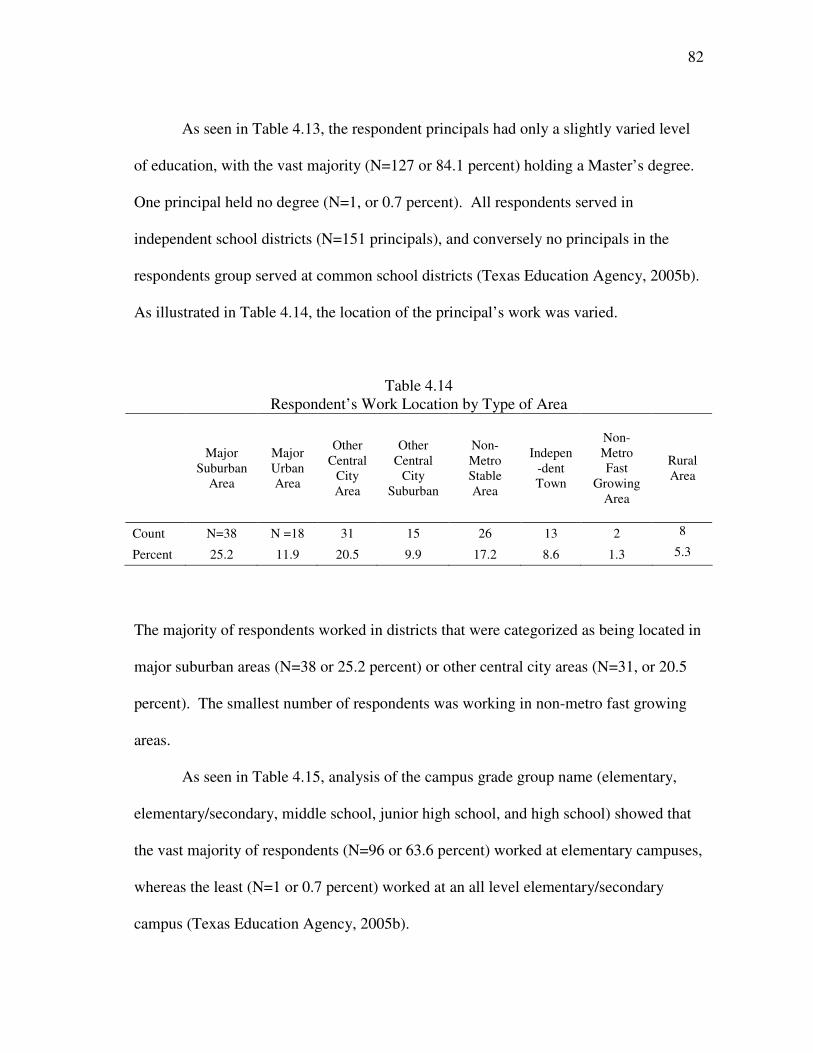
82
As seen in Table 4.13, the respondent principals had only a slightly varied level
of education, with the vast majority (N=127 or 84.1 percent) holding a Master’s degree.
One principal held no degree (N=1, or 0.7 percent). All respondents served in
independent school districts (N=151 principals), and conversely no principals in the
respondents group served at common school districts (Texas Education Agency, 2005b).
As illustrated in Table 4.14, the location of the principal’s work was varied.
Table 4.14 Respondent’s Work Location by Type of Area
Major
Suburban Area
Major Urban Area
Other Central
City Area
Other Central
City Suburban
Non-Metro Stable Area
Indepen-dent Town
Non-Metro Fast
Growing Area
Rural Area
Count N=38 N =18 31 15 26 13 2 8
Percent 25.2 11.9 20.5 9.9 17.2 8.6 1.3 5.3
The majority of respondents worked in districts that were categorized as being located in
major suburban areas (N=38 or 25.2 percent) or other central city areas (N=31, or 20.5
percent). The smallest number of respondents was working in non-metro fast growing
areas.
As seen in Table 4.15, analysis of the campus grade group name (elementary,
elementary/secondary, middle school, junior high school, and high school) showed that
the vast majority of respondents (N=96 or 63.6 percent) worked at elementary campuses,
whereas the least (N=1 or 0.7 percent) worked at an all level elementary/secondary
campus (Texas Education Agency, 2005b).
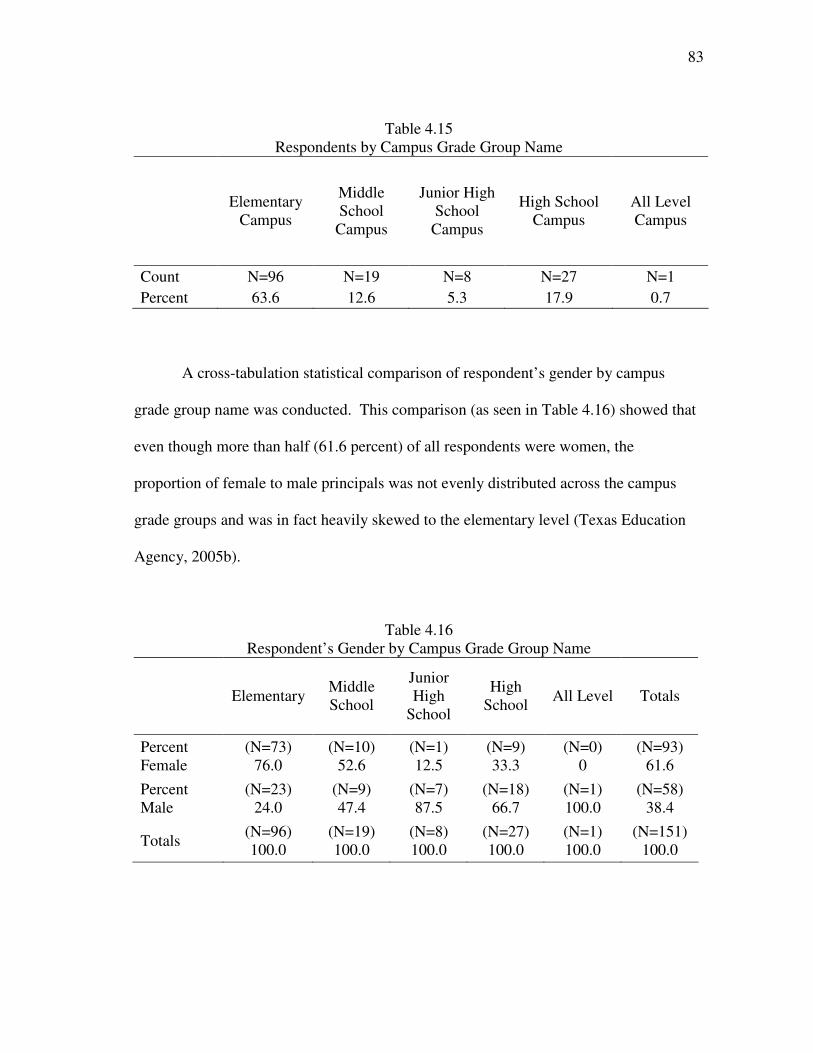
83
Table 4.15 Respondents by Campus Grade Group Name
Elementary Campus
Middle School
Campus
Junior High School
Campus
High School Campus
All Level Campus
Count N=96 N=19 N=8 N=27 N=1 Percent 63.6 12.6 5.3 17.9 0.7
A cross-tabulation statistical comparison of respondent’s gender by campus
grade group name was conducted. This comparison (as seen in Table 4.16) showed that
even though more than half (61.6 percent) of all respondents were women, the
proportion of female to male principals was not evenly distributed across the campus
grade groups and was in fact heavily skewed to the elementary level (Texas Education
Agency, 2005b).
Table 4.16 Respondent’s Gender by Campus Grade Group Name
Elementary Middle School
Junior High
School
High School All Level Totals
Percent Female
(N=73) 76.0
(N=10) 52.6
(N=1) 12.5
(N=9) 33.3
(N=0) 0
(N=93) 61.6
Percent Male
(N=23) 24.0
(N=9) 47.4
(N=7) 87.5
(N=18) 66.7
(N=1) 100.0
(N=58) 38.4
Totals (N=96) 100.0
(N=19) 100.0
(N=8) 100.0
(N=27) 100.0
(N=1) 100.0
(N=151) 100.0
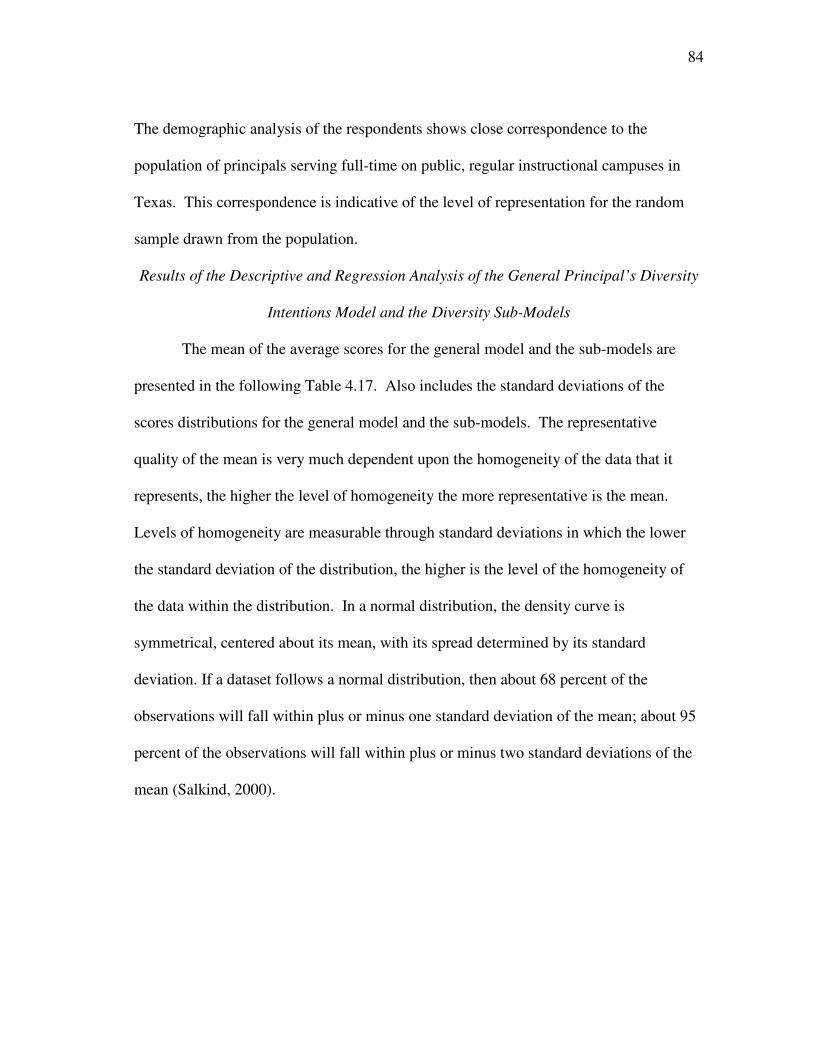
84
The demographic analysis of the respondents shows close correspondence to the
population of principals serving full-time on public, regular instructional campuses in
Texas. This correspondence is indicative of the level of representation for the random
sample drawn from the population.
Results of the Descriptive and Regression Analysis of the General Principal’s Diversity
Intentions Model and the Diversity Sub-Models
The mean of the average scores for the general model and the sub-models are
presented in the following Table 4.17. Also includes the standard deviations of the
scores distributions for the general model and the sub-models. The representative
quality of the mean is very much dependent upon the homogeneity of the data that it
represents, the higher the level of homogeneity the more representative is the mean.
Levels of homogeneity are measurable through standard deviations in which the lower
the standard deviation of the distribution, the higher is the level of the homogeneity of
the data within the distribution. In a normal distribution, the density curve is
symmetrical, centered about its mean, with its spread determined by its standard
deviation. If a dataset follows a normal distribution, then about 68 percent of the
observations will fall within plus or minus one standard deviation of the mean; about 95
percent of the observations will fall within plus or minus two standard deviations of the
mean (Salkind, 2000).
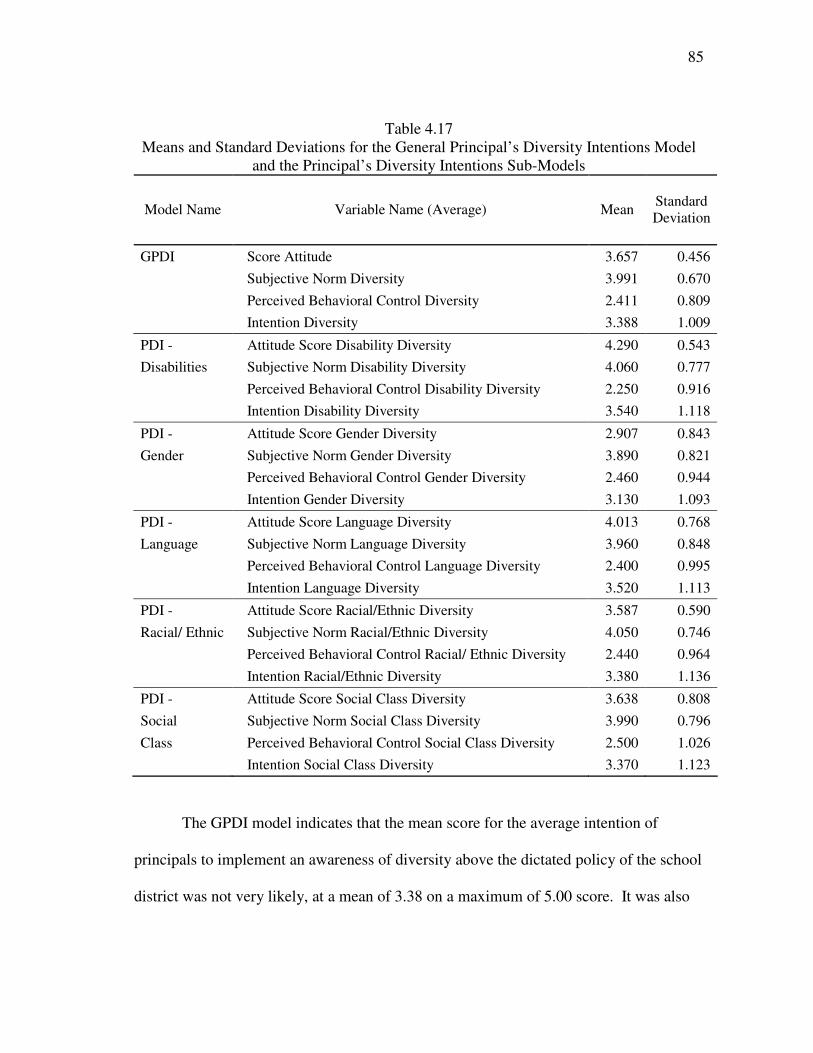
85
Table 4.17 Means and Standard Deviations for the General Principal’s Diversity Intentions Model
and the Principal’s Diversity Intentions Sub-Models
Model Name Variable Name (Average) Mean Standard Deviation
GPDI Score Attitude 3.657 0.456 Subjective Norm Diversity 3.991 0.670 Perceived Behavioral Control Diversity 2.411 0.809 Intention Diversity 3.388 1.009
PDI - Attitude Score Disability Diversity 4.290 0.543 Disabilities Subjective Norm Disability Diversity 4.060 0.777 Perceived Behavioral Control Disability Diversity 2.250 0.916 Intention Disability Diversity 3.540 1.118
PDI - Attitude Score Gender Diversity 2.907 0.843 Gender Subjective Norm Gender Diversity 3.890 0.821 Perceived Behavioral Control Gender Diversity 2.460 0.944 Intention Gender Diversity 3.130 1.093
PDI - Attitude Score Language Diversity 4.013 0.768 Language Subjective Norm Language Diversity 3.960 0.848 Perceived Behavioral Control Language Diversity 2.400 0.995 Intention Language Diversity 3.520 1.113
PDI - Attitude Score Racial/Ethnic Diversity 3.587 0.590 Racial/ Ethnic Subjective Norm Racial/Ethnic Diversity 4.050 0.746 Perceived Behavioral Control Racial/ Ethnic Diversity 2.440 0.964 Intention Racial/Ethnic Diversity 3.380 1.136
PDI - Attitude Score Social Class Diversity 3.638 0.808 Social Subjective Norm Social Class Diversity 3.990 0.796 Class Perceived Behavioral Control Social Class Diversity 2.500 1.026 Intention Social Class Diversity 3.370 1.123
The GPDI model indicates that the mean score for the average intention of
principals to implement an awareness of diversity above the dictated policy of the school
district was not very likely, at a mean of 3.38 on a maximum of 5.00 score. It was also

86
very interesting to note the extremely low level of homogeneity at a standard deviation
of 1.009, which indicates a very wide range of differences in the intention of principals
to implement an awareness of diversity above the mandated levels. Similar results
regarding the intention of principals is documented in their intention towards gender
diversity at a very low 3.13, with a high standard deviation of 1.093; a somewhat better
but still low average intention towards implementation of language diversity at 3.52,
with a standard deviation of 1.113; a similarly unenthusiastic or low intention toward
implementation of racial/ethnic diversity at 3.38 with a standard deviation of 1.136; and
a repeated low intention of implementation of social class diversity awareness above and
beyond the codified requirements at 3.37 with a standard deviation of 1.123.
Analyses of the measures of centrality were made for the average intention of the
GPDI and the intention scores for the PDI’s. These measures are presented in Table
4.18.
Table 4.18 Measures of Centrality for Intentions on the GPDI and PDI Models
Average Intentions
Intentions Disabilities
Intentions Gender
Intentions Language
Intentions Racial/Ethnic
Intentions Social Class
N= 151 151 151 151 151 151 Mean 3.381 3.536 3.132 3.517 3.384 3.371 Median 3.600 4.000 3.000 4.000 4.000 4.000 Mode 3.000 4.000 3.000 4.000 4.000 4.000 Skewness -0.632 -0.600 -0.205 -0.601 -0.358 -0.430 Kurtosis 0.051 -0.322 -0.537 -0.330 -0.695 -0.581
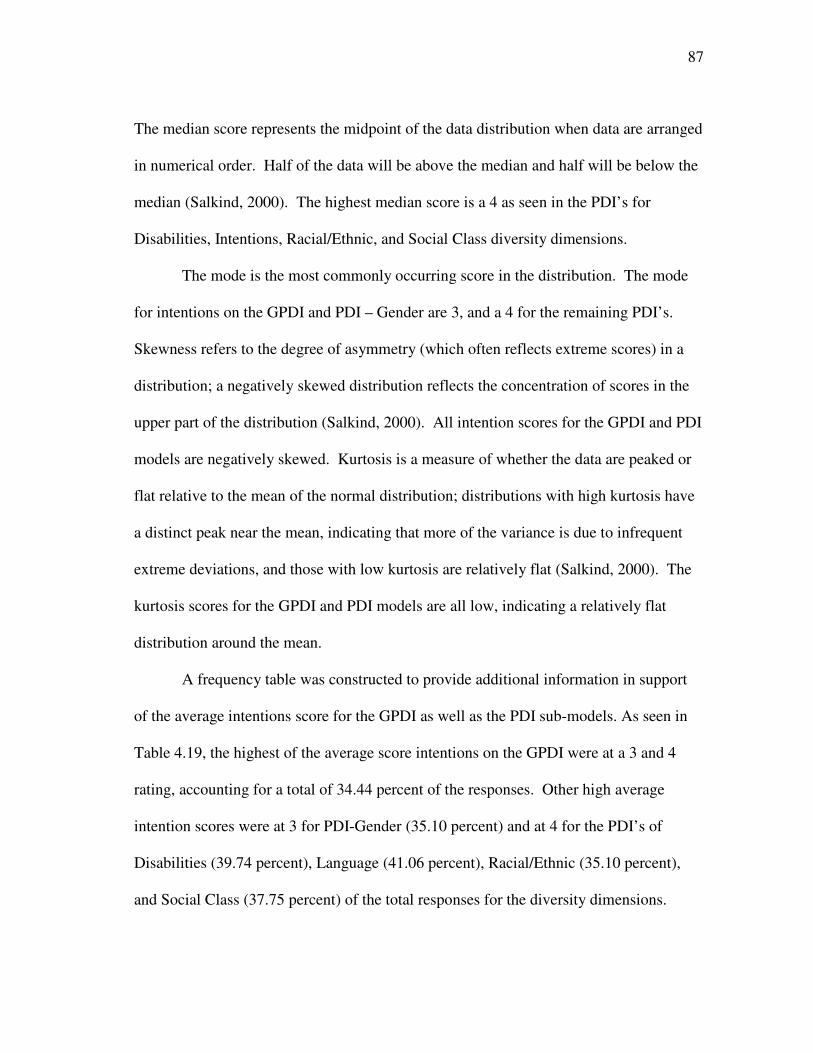
87
The median score represents the midpoint of the data distribution when data are arranged
in numerical order. Half of the data will be above the median and half will be below the
median (Salkind, 2000). The highest median score is a 4 as seen in the PDI’s for
Disabilities, Intentions, Racial/Ethnic, and Social Class diversity dimensions.
The mode is the most commonly occurring score in the distribution. The mode
for intentions on the GPDI and PDI – Gender are 3, and a 4 for the remaining PDI’s.
Skewness refers to the degree of asymmetry (which often reflects extreme scores) in a
distribution; a negatively skewed distribution reflects the concentration of scores in the
upper part of the distribution (Salkind, 2000). All intention scores for the GPDI and PDI
models are negatively skewed. Kurtosis is a measure of whether the data are peaked or
flat relative to the mean of the normal distribution; distributions with high kurtosis have
a distinct peak near the mean, indicating that more of the variance is due to infrequent
extreme deviations, and those with low kurtosis are relatively flat (Salkind, 2000). The
kurtosis scores for the GPDI and PDI models are all low, indicating a relatively flat
distribution around the mean.
A frequency table was constructed to provide additional information in support
of the average intentions score for the GPDI as well as the PDI sub-models. As seen in
Table 4.19, the highest of the average score intentions on the GPDI were at a 3 and 4
rating, accounting for a total of 34.44 percent of the responses. Other high average
intention scores were at 3 for PDI-Gender (35.10 percent) and at 4 for the PDI’s of
Disabilities (39.74 percent), Language (41.06 percent), Racial/Ethnic (35.10 percent),
and Social Class (37.75 percent) of the total responses for the diversity dimensions.
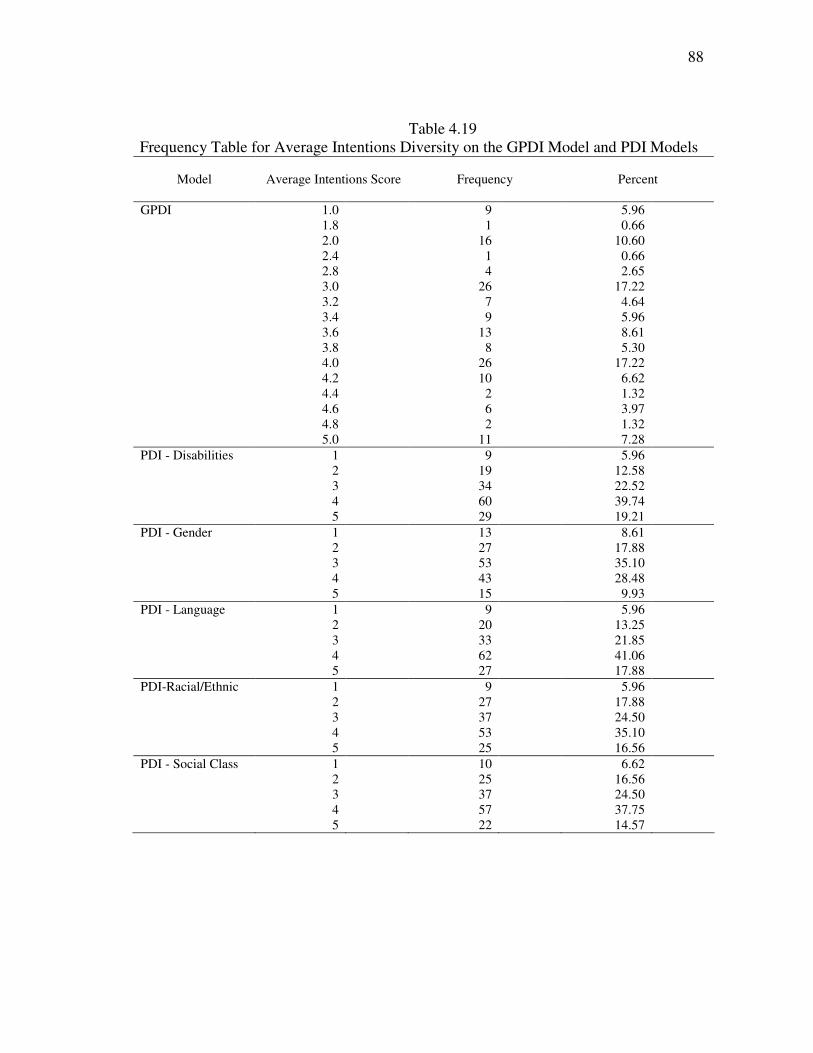
88
Table 4.19 Frequency Table for Average Intentions Diversity on the GPDI Model and PDI Models
Model Average Intentions Score Frequency Percent
GPDI 1.0 9 5.96 1.8 1 0.66 2.0 16 10.60 2.4 1 0.66 2.8 4 2.65 3.0 26 17.22 3.2 7 4.64 3.4 9 5.96 3.6 13 8.61 3.8 8 5.30 4.0 26 17.22 4.2 10 6.62 4.4 2 1.32 4.6 6 3.97 4.8 2 1.32 5.0 11 7.28 PDI - Disabilities 1 9 5.96 2 19 12.58 3 34 22.52 4 60 39.74 5 29 19.21 PDI - Gender 1 13 8.61 2 27 17.88 3 53 35.10 4 43 28.48 5 15 9.93 PDI - Language 1 9 5.96 2 20 13.25 3 33 21.85 4 62 41.06 5 27 17.88 PDI-Racial/Ethnic 1 9 5.96 2 27 17.88 3 37 24.50 4 53 35.10 5 25 16.56 PDI - Social Class 1 10 6.62 2 25 16.56 3 37 24.50 4 57 37.75 5 22 14.57
89
The outlying scores of 5 and 1 on the GPDI model accounted for 18.83 percent (29
respondents) of the responses. The 5 and 1 scores of the PDI models (when combined)
account for 38 responses (25.7 percent) of the Disabilities intentions, 28 responses
(18.54 percent) of the Gender intentions, 36 responses (23.84 percent) of the Language
intentions, 34 responses (22.52 percent) of the Racial/Ethnic intentions, and 32
responses (21.19 percent) of the Social Class intentions. This indicates that less than a
quarter of the responses in the PDI’s were very strongly positive or negative. There
were at least 9 respondents who had very low intentions across all models, and at least
11 respondents who had very high intentions across all models.
Covariates
Analysis of variance was performed based upon the major demographics of the
principals in order to ascertain whether there are significant differences (in the intentions
of principals to implement an awareness of diversity) in subgroups within race/ethnicity,
degree, gender, campus type, and age. As shown in the following tables, demographic
covariates of race/ethnicity, gender, age, degree, and campus type were examined. The
covariates of race/ethnicity, age, and degree have shown statistically significant
differences among the subgroups measured. Table 4.20 below presents the analysis of
variance within race/ethnicity.
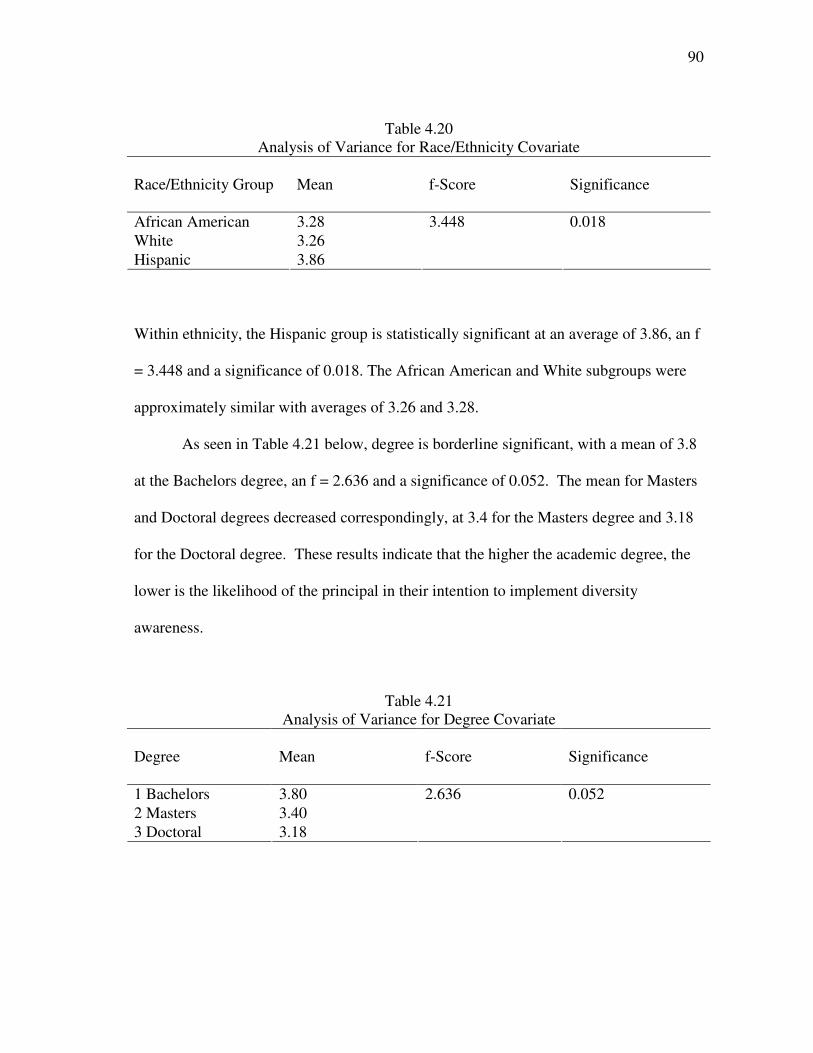
90
Table 4.20 Analysis of Variance for Race/Ethnicity Covariate
Race/Ethnicity Group
Mean
f-Score
Significance
African American 3.28 White 3.26 Hispanic 3.86
3.448 0.018
Within ethnicity, the Hispanic group is statistically significant at an average of 3.86, an f
= 3.448 and a significance of 0.018. The African American and White subgroups were
approximately similar with averages of 3.26 and 3.28.
As seen in Table 4.21 below, degree is borderline significant, with a mean of 3.8
at the Bachelors degree, an f = 2.636 and a significance of 0.052. The mean for Masters
and Doctoral degrees decreased correspondingly, at 3.4 for the Masters degree and 3.18
for the Doctoral degree. These results indicate that the higher the academic degree, the
lower is the likelihood of the principal in their intention to implement diversity
awareness.
Table 4.21 Analysis of Variance for Degree Covariate
Degree
Mean
f-Score
Significance
1 Bachelors 3.80 2 Masters 3.40 3 Doctoral 3.18
2.636 0.052
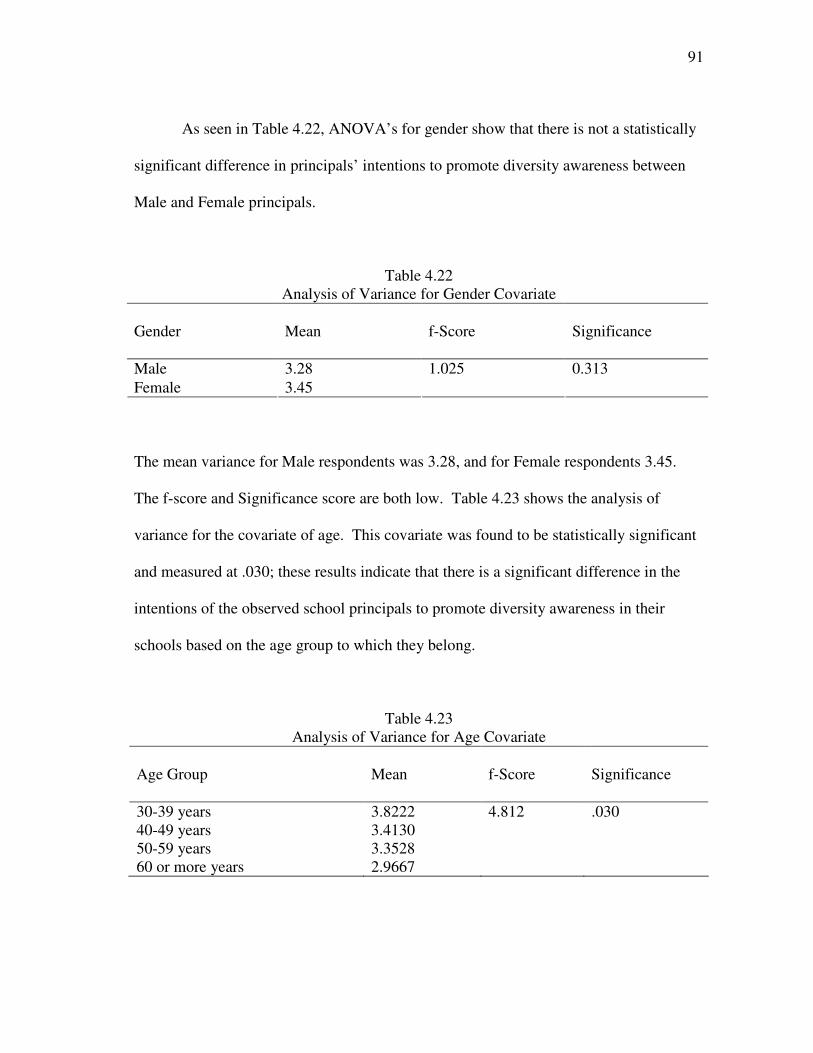
91
As seen in Table 4.22, ANOVA’s for gender show that there is not a statistically
significant difference in principals’ intentions to promote diversity awareness between
Male and Female principals.
Table 4.22 Analysis of Variance for Gender Covariate
Gender
Mean
f-Score
Significance
Male 3.28 Female 3.45
1.025 0.313
The mean variance for Male respondents was 3.28, and for Female respondents 3.45.
The f-score and Significance score are both low. Table 4.23 shows the analysis of
variance for the covariate of age. This covariate was found to be statistically significant
and measured at .030; these results indicate that there is a significant difference in the
intentions of the observed school principals to promote diversity awareness in their
schools based on the age group to which they belong.
Table 4.23 Analysis of Variance for Age Covariate
Age Group
Mean
f-Score
Significance
30-39 years 3.8222 4.812 .030 40-49 years 3.4130 50-59 years 3.3528 60 or more years 2.9667
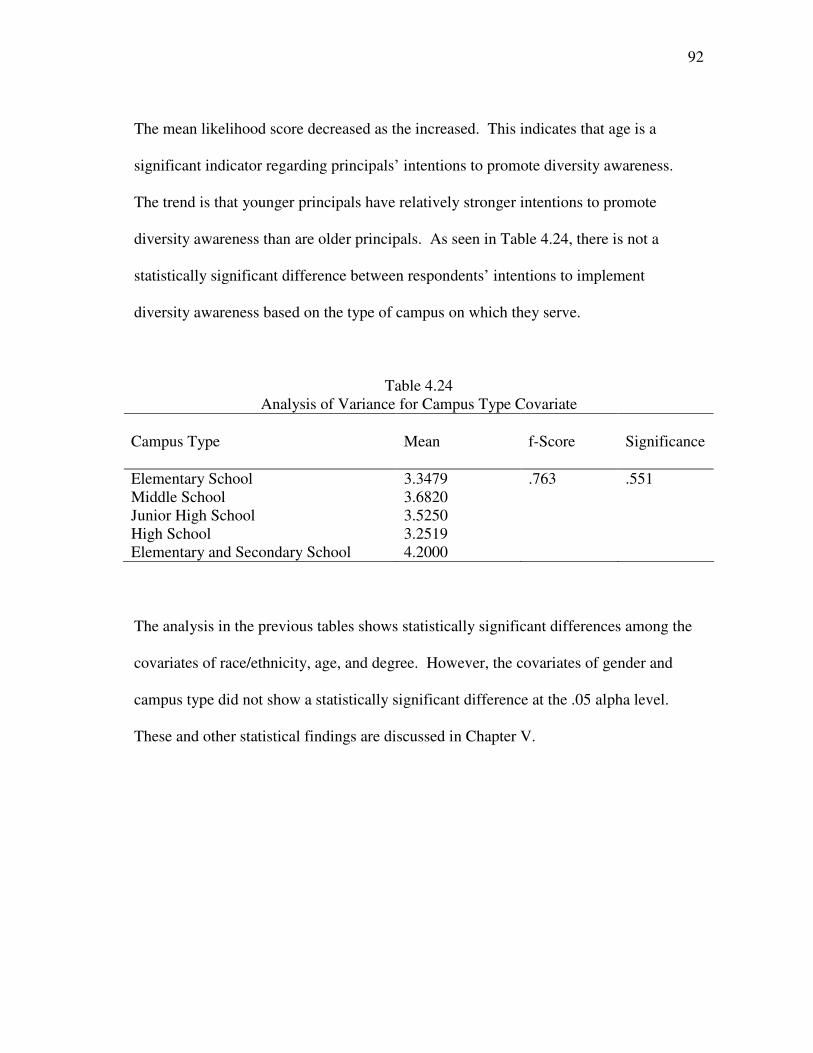
92
The mean likelihood score decreased as the increased. This indicates that age is a
significant indicator regarding principals’ intentions to promote diversity awareness.
The trend is that younger principals have relatively stronger intentions to promote
diversity awareness than are older principals. As seen in Table 4.24, there is not a
statistically significant difference between respondents’ intentions to implement
diversity awareness based on the type of campus on which they serve.
Table 4.24 Analysis of Variance for Campus Type Covariate
Campus Type
Mean
f-Score
Significance
Elementary School 3.3479 .763 .551 Middle School 3.6820 Junior High School 3.5250 High School Elementary and Secondary School
3.2519 4.2000
The analysis in the previous tables shows statistically significant differences among the
covariates of race/ethnicity, age, and degree. However, the covariates of gender and
campus type did not show a statistically significant difference at the .05 alpha level.
These and other statistical findings are discussed in Chapter V.

93
CHAPTER V
DISCUSSION, CONCLUSIONS, AND RECOMMENDATIONS
The purpose of the study is to provide an empirical theoretical base to measure
and explain principals’ professional intentions to promote diversity awareness. The
theory of planned behavior (TPB) has been used widely in the social sciences, and as
such provided a solid foundation for this research project. This study in actuality
developed an innovative assessment tool based on the TPB and on Pohan and Aguilar’s
(1999) Professional Beliefs About Diversity Scale (PBADS) to successfully assess
diversity awareness intentions of principals. This instrument was operationalized in the
General Principal’s Diversity Intentions (GPDI) model and the accompanying
Principal’s Diversity Intentions (PDI) sub-models for the diversity dimensions of
disabilities, gender, language, racial/ethnic, and social class diversity. All models
included the components of attitudes, subjective norms, and perceived behavioral
control.
The research questions for this study covered a test of the theoretical structure,
the implementation and measurement of the principals’ intentions using this structure as
operationalized in the test instrument, and examining possible demographic covariate
effects. A random sample was drawn of 476 Texas public school principals serving full-
time on regular instructional campuses during the 2004-2005 school year. This sample
was derived from the total population of 6,161 such principals during that same time
period. From this sample 151 respondents returned complete, usable responses to the
instrument. The instrument was administered via the Internet, as solicited by an e-mail

94
containing a link to the on-line survey. Results of tests of the theoretical structure
indicated that the GPDI model and the PDI sub-models for the diversity dimensions of
disabilities, gender, language, racial/ethnic, and social class diversity provided a valid
and reliable instrument capable of empirically measuring and explaining public school
principals’ professional intentions to promote diversity awareness.
The research questions were formulated to seek the scientific justification and
confirmation of the TPB as a valid and reliable instrument to quantify principals’
intentions to promote diversity. These questions were:
1. Can a theory of planned behavior approach be used to assess school principals’
professional intentions to promote diversity awareness?
2. What are the intentions of Texas principals to promote diversity awareness in
general and among the five diversity dimensions of disabilities, gender, language,
racial/ethnic, and social class in their campus community? and
3. Do these intentions differ among five demographic characteristics of
race/ethnicity, gender, age, degree, and campus type?
Discussion
Discussion of the Findings
Can a theory of planned behavior approach be used to assess school
principals’ professional intentions to promote diversity awareness?
The theory of planned behavior approach (Ajzen, 1985, 1988, 1991; Zint, 2002)
can be used to assess school principals’ intentions to promote diversity awareness. The
theory of planned behavior was operationalized incorporating the Professional Beliefs
95
About Diversity Scale (Pohan & Aguilar 1999, 2001). This was shown by the
development and testing of the GPDI and PDI models, with multiple regression analysis
indicating goodness of fit within acceptable statistical tolerances (Gall, et al., 1996). The
results indicate that the distribution of the response data regarding the independent
variables attitude, perceived behavioral control, subjective norms, and the dependent
variable intentions are significantly similar to a normal distribution at deviations of less
than 0.06 (with the variable attitude being the only variable above the 0.05 level, at
0.057) (Hair, et al., 2006; Kerlinger, 1973). This confirms that the condition of
normality for the data has been analyzed and verified.
Also, analyses were conducted to determine multicollinearity and VIF scores.
The models indicated low levels for multicollinearity, which is one of the significant
conditions for the quality of a regression analysis. The corresponding VIF scores were
indicative as well of low degrees of multicollinearity (Baten, 2006; Hair, et. al., 2006).
Reliability was measured through the Cronbach alpha score of .7861, which should be
considered acceptable for terms of judging reliability. In order to test for additivity of
the scale, an ANOVA analysis was performed; the f-score of 54.26, indicated that the
items of the scale are indeed differentiated (Santos, 1999; Cronbach, 1951; El Jaam,
2005). An assessment of the fit of the regression models was accomplished through
examination of the R, R-squared, adjusted R-squared, standard error of the estimate, and
the Durbin Watson scores; all scores were at the acceptable level (Salkind, 2000). The
values for B and Beta, along with the standard error, t-test, and significance results show
that especially in the general model, attitude was the overwhelmingly most important

96
factor with almost double the effect of either of the remaining two independent variables
(Hair, et. al., 2006). This is an expected result since early Fishbein models began with
attitude as the constructs of perceived behavioral control and societal norms increase the
adjusted r-squared and add to the explanatory power of the model (Fishbein, 1967; Ryan
& Bonfield, 1975).
In the diversity sub-models, the importance of attitude varies somewhat. The
major GPDI model is confirmed at an f-level of 16.281, which corresponds to a
probability significance level of less than 0.000 (Hair, et. al., 2006; Salkind, 2000). This
result indicates the major scientific justification for the use of the theory of planned
behavior as a valid instrument to assess public school principals’ professional intentions
to promote diversity awareness. The results of these analyses indicate that the first
research question may be answered in the affirmative. The TPB approach can be used to
assess school principals’ professional intentions to promote diversity awareness.
What are the intentions of Texas principals to promote diversity awareness
in general and among the five diversity dimensions of disabilities, gender,
language, racial/ethnic, and social class in their campus community?
The GPDI model indicates that the average intention of principals to implement
an awareness of diversity above and beyond the dictated policy of the school district was
not very likely, at a mean of 3.38 on a maximum of 5.00 score. There was an extremely
low level of homogeneity that indicated a very wide discrepancy in the intention of
principals to implement an awareness of diversity in general above the state standards
mandated levels. These results were similar to those regarding the intention of
97
principals towards promoting an awareness of the diversity dimensions of disabilities,
gender, language, racial/ethnic, and social class. Findings show the principals’ repeated
relatively slightly more positive intention of implementing an awareness of these
diversity dimensions above and beyond the codified requirements. Even though the
median responses were midrange, the frequency counts for each of the diversity sub-
models showed a trend toward positive intentions to implement diversity awareness.
Responses to the Gender sub-model showed that 58 cases (38.41 percent) were scored in
the positive range of level 4 (agree) or 5 (strongly agree). Stronger positive trends were
seen in the remaining sub-models. The Racial/Ethnic sub-model had 78 cases (51.66
percent) in the positive, as was the similarly scored Social Class sub-model with 79
cases (52.32 percent) in the positive. The most positive trends were for the Disabilities
and Language sub-models, which each had 89 cases (58.95 percent) at the level of agree
or strongly agree.
Do these intentions differ among five demographic characteristics of
race/ethnicity, gender, age, degree, and campus type?
The intentions of Texas principals to promote diversity awareness in general and
in its various dimensions were measured by the GPDI and PDI models. The results of
the application of these tools indicate that public school principals in this state are not
very likely to promote diversity awareness beyond the levels mandated to them. The
levels of this likelihood varied significantly among the various age groups of the
principals, from a high of 3.8222 for the youngest (30-39 year old) age group, to a low
of 2.9667 among the oldest (60+ year old) age group, and indicated that the likelihood
98
for the intention to promote diversity awareness decreases with increases in age.
Further, these intentions to promote diversity awareness differ among other demographic
characteristics. Significant differences were found among Texas public school
principals based upon their ethnicity and levels of academic degree held. In the case of
ethnicity, the Hispanic principals show a much higher likelihood than their African
American and White colleagues; and the higher the academic degree held by the Texas
principals, the lower was their likelihood to promote diversity awareness. Gender and
campus type do not significantly discriminate among the subgroups of principals.
The application of this model to this population indicated that full-time, public
school principals in Texas are not very likely to promote diversity awareness beyond the
levels mandated to them, scoring 3.38 on a 5-point scale (3 being “neither likely nor
unlikely” and 4 being “likely” to implement measures to promote awareness of
diversity). The levels of this likelihood varied significantly among the age groups of the
principals, from a high of 3.8222 for the youngest (30-39 year old) age group, to a low
of 2.9667 among the oldest (60+ year old) age group, and indicated that the likelihood
for the intention to promote diversity awareness decreases with increases in age.
Discussion of Context and Theoretical Development
Current and ongoing changes in the demographic composition of the U.S. have
increased the need to understand ethnically and culturally diverse people (Azevedo, Von
Glinow, & Paul, 2001). Diversity is a salient topic of study due to the “increasing
amount of diversity taking place in our nation, as well as our schools” (McCray, Wright,
& Beachum, 2004, p. 111). According to Patrick and Reinhartz (1999), society is
99
becoming more diverse than ever before in its history, and the populations of many
school systems reflect this diversity. In order “to advance learning and school
improvement, leaders need to recognize and challenge the confines of sameness and
move toward valuing and learning from differences” (Walker & Quong, 1998, p. 81).
School leadership and diversity “are invariably connected as schools move from
monocultural, nondiverse contexts to those that contain ethnically diverse, multilingual,
and economically disadvantaged children” (Madsen & Mabokela, 2002, p. 1). It is
“more appropriate to emphasize the phenomenon of increasing diversity in America,
since it is a society of multiple cultures and cross-cultural influences” (LeFlore, 2005).
These multiple cultures and cross-cultural influences found in America bring about
dynamic tension within a diverse society that is “struggling with a past involving
oppression, inequality, and buried knowledge” (Schmitz, Stakeman, & Sisneros, 2001, p.
612).
The growing population diversity was evident in the 2000 United States Census,
which showed that the U.S. is the most ethnically and racially varied nation in modern
times where nearly three in ten Americans are people of color and, as of 2002, nearly
twenty percent of the U.S. population lived in a household where a second language
other than English is spoken (Rosenblatt, 2001; Davis-Wiley, 2002). The number of
school-age children aged 5-18 who are second language learners has been conservatively
estimated to have reached 3.5 million in 2000, and to approach 6 million by 2020; ethnic
groups of students once labeled minorities were projected to soon become majorities,
especially in densely populated urban areas (Faltis, 2001). Garrett and Morgan’s

100
contention is that as the population of the U.S. is becoming increasingly diverse, there
are a growing number of linguistically and culturally diverse students confront school
personnel, representing an array of racial, ethnic, cultural, and socio-economically
diverse students, families, and communities that continue to emerge (Garrett & Morgan,
2002). The State of Texas is also growing, with more people, more urbanicity, and more
ethnic diversity; the state’s population grew sixteen percent between 1990
(approximately 17 million people) and 2000 (approximately 21) (Reid, 2001). This high
population growth rate is expected to impact the public schools.
Though ethnicity and race are associated frequently with the concept of diversity,
seven dimensions of diversity have been identified by Pohan and Aguilar (2001). These
are disabilities; gender; language; racial/ethnic; religious; sexual orientation; and social
class diversity (Pohan & Aguilar 2001). In order to heal and strengthen, we must grow
to appreciate and enjoy the multiple cultures, races, and realities; and recognize the
consequences of current and historical oppression (Schmitz, Stakeman, & Sisneros,
2001) at the national, state, and local levels. The increasing levels of diversity in society
indicate that schools must play a central role in the initiation and infusing of
multicultural concepts and ideas into the school cultures. The key element in addressing
the increasing diversity is the school leader, the principal who sets the cultural climate
for the campus (Decker, 1997) and who “must be able to shape the school to meet
emerging needs in its environment and among its students” (Donaldson, 2001, p. 4).
Principals must be aware of the cultures and diversity in their schools (Garrett & Morgan
101
2002) and must play a significant role as a model for students when dealing with racial
or diversity issues (O’Neil, 1993).
As school leaders, the principalship has come under consideration as an element
of educational reform for schools and school systems. For the past twenty-plus years,
“professional associations have taken the lead in a movement to develop professional
standards for school executives and apply them to improving the profession” (Hoyle, et
al., 2005, p. 9). Several organizations have developed standards and recommendations
for principals, including the American Association of School Administrators (AASA),
the Interstate School Leadership Licensure Consortium (ISLLC) under the auspices of
the Council of Chief State School Officers (CCSSO), and, the National Policy Board for
Educational Administration (NPBEA). The State of Texas developed its own standards
for principal certification to serve as the “foundation for the individual assessment,
professional growth plan, and continuing professional education activities required by
§241.30” of Texas public school principals (Texas Administrative Code, 2005, Title 19,
part 7, chapter 241, section 241.1.a; Flores, 2002, p. 154).
The need for diversity awareness as referenced in the Texas standards was used
in this study. The principal must understand, value, and promote diversity awareness in
the campus community (Texas Administrative Code, 2005, Title 19, part 7, chapter 241,
section 241.15.b.4). As evident by the Texas standards, it is important that a school’s
culture nurture tolerance for a diverse working system and facilitate educational
empowerment and progress for all ethnic groups (Banks, 1999). A strong principal
leader is a critical element that can influence the school culture (Deal & Peterson, 1991;
102
Reitzug & Reeves, 1992), as well as nurture tolerance and celebrate diversity. In
consideration of the key role principals play in influencing school culture and accepting
and celebrating diversity, literature was sought to identify a means to quantify, measure,
and analyze Texas principals’ intentions to promote diversity awareness. This means to
quantify, measure, and analyze intentions was found to be in an application of the
Theory of Planned Behavior (TPB).
Models of the theory of planned behavior (TPB) have been studied, and meta-
analyses indicate that the models have been significant across a wide variety of
disciplines (Sutton, 1998; Van den Putte, 1995). The theory of planned behavior focuses
on intentions to act as predictors of behavior. Ajzen noted that the ability to carry out
intention often depended on the level of volitional control that individuals have over
their behavior - where little volitional control exists, the intention to act (and thus
behavior) will be affected (Ajzen, 1985, 1988, 1991; Zint, 2002). The theory of planned
behavior (TPB) was developed to model “how all behaviors are produced, not just those
under volitional control. The TPB has become the dominant social-psychological model
for relating attitudes to behavior (Conner, et al., 2003). Within the TPB, Ajzen
postulated that the intention to perform an act was made up of three elements, namely
attitude towards the act, the subjective norm, and the perceived behavioral control.
The motivation that drove this study was the ongoing discussion regarding the
increasing population diversity in the United States and increasing population diversity
in schools which is included as an element in both general standards for principals and
Texas standards for principals. A basic necessity for an assessment of public school
103
principals’ professional intentions to promote diversity awareness in their schools is the
capability to empirically quantify and measure these intentions. This study used an
innovative approach in combining the TPB with the Professional Beliefs About
Diversity Scale in order to model principals’ general intentions to promote an awareness
of diversity, congruent with the Texas standards for principal certification and
evaluation/assessment. Based on the TPB attitudes, subjective norms, and perceived
behavioral control were used to assess Texas principals’ intentions to promote diversity
awareness in their campus communities by using the GPDI model to represent the
operational conversion of the theoretical constructs. The GPDI was then adapted as the
Principal’s Diversity Intentions (PDI) models that examined in turn the disabilities,
gender, language, race/ethnicity, and social class dimensions of diversity.
The methodology of this study involved taking a random sample of 476 subjects
from the population of full-time, public school principals serving on regular instructional
campuses in Texas during the 2004-2005 school year. Principals in random sample were
contacted via e-mail to participate in an electronic survey; the instrument for this survey
was based on the operationalized General Principal’s Diversity Intentions model. The
response rate for this survey was 31.72 percent, or 151 respondents; this exceeded the
minimum sample size of 147 necessary to meet the requirements of a 95 percent
confidence level, and an eight percent margin of error with a population of 6,161 full-
time, public school principals serving on regular instructional campuses in Texas during
the 2004-2005 school year.
104
In order to provide the context for this study, a demographic analysis of this
entire population of 6,161 Texas full-time, public school principals on regular
instructional campuses was conducted using the secondary data from TEA. Also, a
demographic analysis was conducted for the 151 respondents. The relationship between
the covert behavior (intentions) and overt behavior (the active implementation of the
intentions) is not a part of this study, because in order to measure this relationship a
longitudinal study would have to be conducted that would allow for enough time to pass
so that a principal could have the opportunity to implement that which he/she intended.
Further, there would be significant legal and personal limitations in order to be able to
find an objective measure (excluding principal’s self reporting) that would document
whether a successful implementation of the initiative took place.
Conclusions
Usability of the Operationalized GPDI Model for Assessing Principals’ Intentions to
Promote Diversity Awareness
The literature indicates that there is widespread agreement among the various
constituents in the field of education that the knowledge base and performance
expectations of principals should be standardized. In order to achieve such a goal,
principal education and licensing organizations such as the American Association of
School Administrators (AASA), the Interstate School Leaders Licensure Consortium
(ISLLC), the National Policy Board for Educational Administration (NPBEA), and
National Council for Accreditation of Teacher Education (NCATE) developed standards
for educator education, assessment, and evaluation. The NCATE standard states that
105
principals must promote multicultural awareness, gender sensitivity, and racial and
ethnic appreciation (National Council for Accreditation of Teacher Education, 1995).
The ISLLC standard stated that principals must promote the success of all students by
responding to diverse community interests and needs (Council of Chief State School
Officers, 1996). The NPBEA defined its standards as principals being able to analyze
and describe the cultural diversity in their school and describe community norms and
values especially in relation to the role of the school promoting social justice (National
Policy Board of Education Administration, 2002).
The State of Texas set forth standards for principal certification that serve as the
foundation for assessment, professional growth, and continuing principal education in
the Texas Administrative Code (2005). The Texas standard stated that a principal
understands, values, and is able to promote awareness of learning differences,
multicultural sensitivity, and ethnic appreciation (Texas Administrative Code, 2005).
The incorporation of a diversity standard both at the national and state levels is in direct
response to the ever increasing levels of diversity in our national and state education
systems, and in response to the expected demographic changes that the level of diversity
in the US in general and in Texas in particular will continuously increase in the years
ahead. Once standards are established it becomes a necessity to develop capabilities to
quantitatively measure those standards on an individual and population wide basis.
Without this capability we would lack an unbiased tool that would enable the specific
identification of the knowledge and performance of principals along any standard, and
specifically the standard of diversity. The main focus of this study therefore was to
106
attempt to develop an empirically based instrument that would be capable to measure
knowledge and performance of principals regarding the diversity standard. The
instrument was developed based upon the theory of planned behavior and
operationalized to measure the specific issue of principals’ intentions to promote an
awareness of diversity. This model includes a dependent principal’s intention variable
and three independent variables that are major indicators of the principal’s attitudes,
perceived behavioral control, and subjective norms, in accordance with the theory of
planned behavior.
The GPDI model was tested utilizing a random sample of 476 full-time, public
school principals serving on regular instructional campuses, derived from the total
population (6,161) of such principals in Texas (Texas Education Agency, 2005b). This
model has proven to be a statistically reliable and valid measure, and therefore could be
used in future research in measuring the intention of principals in other states to promote
diversity awareness. Since the Pohan and Aguilar (2001) summarize the fact that there
are at least five types or sub-dimensions of diversity regarding disabilities, gender,
language, racial/ethnic, and social class diversity, five sub-models of intention towards
diversity were created along each diversity type, and each sub-model was tested
separately. The results were that each and every sub-model was proven to be
statistically reliable and valid as well.
The GPDI will enable multi-state comparisons regarding the levels of fulfillment
for the diversity standard, and could become a basis for cross state and national level
policy making regarding the promotion of the need to promote awareness of diversity to
107
levels that policy makers should deem desirable. Since not only the major model but
also its sub-models were proven to be statistically reliable and valid, future research does
not only have to focus on diversity in general but could also be utilized for separate
research specifically focused on each and every diversity sub-type, such as principals
intention to promote disabilities diversity, gender diversity, language diversity,
racial/ethnic diversity, and social class diversity.
The nation’s and state’s demographic constituency is changing, becoming more
diverse than ever. It is believed that if diverse populations have special needs, and if we
believe that harmony among student bodies and among teachers and administrators is
necessary in order to increase the performance level of a diverse student and teacher
body then it is understandable why those that have developed the norms at the various
levels are all in agreement that it is significant that principals as the academic leaders of
the schools are well informed about diversity and are capable and willing to promote
awareness of diversity in their schools. Diversity by definition indicates differences in
cultures, and therefore possible differences in learning processes. Knowing that such
differences exist and being aware that such differences exist enables the addressing of
these differences by adjusting the curricular and instructional methods to the unique
characteristics of learning. This will most probably lead to an improvement of
educational attainment and cultural sensitivity processes for all constituents.

108
Intentions of Texas Principals to Promote Diversity in General and in its
Diversity Sub-Dimensions
As mentioned above, a standard identified the necessity to promote diversity
awareness by principals is not only a part of the national standards (NCATE/ISLLC) but
also a part of the Texas Standards for Principal preparation, assessment, and evaluation.
It was therefore a logical choice for a scholarly effort that originated in Texas to initially
apply this newly developed GPDI instrument for the purpose of measuring the intentions
of Texas principals to promote diversity awareness in their campus communities.
One of the major findings regarding the intentions of Texas principals on the
issue of promoting diversity in general in their campuses was that it was measured at an
average of 3.38 on a maximum of 5.00 scale, ranging from 1.00 being very unlikely, to
5.00 being very likely implement measures to promote diversity awareness. The
measurements of the principals’ intentions toward promoting diversity awareness did not
significantly change in the diversity sub-models. The highest score was in the likelihood
to promote disabilities diversity awareness with a score of 3.54. It should be noted that
the midpoint value of 3.00 indicated that the respondent was neither likely nor unlikely
to implement measures to promote diversity awareness beyond the level recommended
by their school district in the upcoming year. This indicates that there seems to be a lack
of intention to implement diversity awareness among Texas public school principals. It
becomes now a policy making issue in Texas whether and what should be done to try
and increase this disappointing levels of intent and develop an educational strategy
109
targeted towards elevating future intentions of Texas principals towards promoting
diversity awareness in their campuses.
Intentions Differ Among Principals Demographic Characteristics
This study incorporated the different demographics characteristics of each
individual respondent as covariates in the regression model in order to account for
possible significant differences in principals’ intentions to promote diversity awareness.
By incorporating the respondent’s characteristics of race/ethnicity, degree, gender,
campus type, and age into the proportion of the explained variance, it was possible to
measure and demonstrate whether principals with certain demographic characteristics do
differ significantly from each other based upon the differences in their demographics,
and whether the incorporation of these demographic differences contributes to a higher
R-squared value (proportion of the explained variance). The results have shown that
there are significant differences in the principals’ intentions to promote diversity
awareness based upon the principal’s racial/ethnic membership, their level of education
(degree held), and their age group. There were no significant differences measured based
on gender and campus type.
The additional information acquired through the incorporation of the covariates
could be very helpful to those that are expected to develop strategies for the increase of
principals’ intentions to promote diversity awareness. Strategists should take in to
account that Hispanic principals are the ones most likely to implement measures for the
promotion of diversity; that the strategy should take into consideration that the higher the
education, the lower is the intention of the principal to promote diversity awareness; and

110
that this finding is very closely correlated to the fact that the older the age group to
which the principal belongs to the lower is their intention to promote diversity
awareness. Therefore, a special strategy should be developed that would take into
consideration those that require the most attention in this respect are White, middle-aged
principals holding masters or doctoral degrees. No special measures targeting gender
differences or campus type are shown to be necessary.
An additional contribution of this study was to provide a demographic profile of
the 6,161 Texas full time principals working at public, regular instructional campuses in
2004-2005. Most principals (69.3 percent) were White, with 19.6 percent Hispanic and
10.8 percent African American principals. Most principals (58.2 percent) were female,
and most principals (61.2 percent) were serving at elementary schools; it was of interest
to note that 72.2 percent of female principals serve at elementary schools. The majority
of principals (93.4) held a masters degree or higher, and most (76 percent) were very
experienced, having between 11 and 30 years as principal.
This study provided empirical evidence that the theory of planned behavior is a
empirically acceptable tool that could be used for the quantitative assessment of school
principals’ intentions to promote diversity awareness in their campus communities. This
assessment was sought not only in the general form of diversity, but also in measuring
the intentions to promote dimensions of diversity awareness, such as disabilities, gender,
language, racial/ethnic, and social class diversity. Contributions from an analysis of the
data are in discovering the benchmark for principals’ diversity intentions. The analysis
showed that the school principals’ intentions to promote general diversity awareness in
111
their campus communities are positive yet weak, with a mean score slightly more
positive than the neutral midpoint. Sub-models of the diversity dimensions of gender,
language, and racial/ethnic diversity echo this finding. Principals have a neutral to only
slightly positive intention to promote an awareness of diversity in its dimensions of
disabilities, racial/ethnic, and social class diversity. The intention to implement diversity
awareness beyond mandated levels decreases with age and higher academic degree held.
Hispanic principals are more likely than their colleges to promote diversity awareness.
A further contribution of this study was the description of the demographic
profile of Texas full-time, regular instructional campus, public school principals drawn
from very reliable data. This profile did not interpolate sample findings but rather
derived its conclusions from the detailed data of the general population of principals as
collected by the Texas Education Agency. This contribution was made in order to
provide a foundation for understanding the data derived from the measurement of
principals’ intentions to promote diversity awareness in general, and in the dimensions
of diversity.
Recommendations
Findings from this study are a wake-up call for the educational leadership of
Texas. At present, Texas principals’ intentions are only slightly more positive than
neutral regarding an intention to promote diversity awareness in their campus
communities beyond the level recommended by their school districts. Implications of
these findings could inform legislatures, organizations, and constituents on the state of
‘what is’ versus ‘what should be’ regarding the principals’ intentions to implement
112
diversity awareness. Implications of these findings must be considered to provide the
foundation for measures that lead to an increase in the need for implementation of
diversity awareness in planning programs, in-service, and teacher and principal
preparation programs.
An important implication with future ramifications is the fact that this study can
provide tools for replication of similar studies among other populations in Texas
(superintendents, central office administrators in charge of curriculum and instruction,
campus administrators other than principals, teachers). This study could be replicated in
other geographic regions within the state, including a border/non-border comparison.
Interstate replications could provide important national insight for interesting
comparative analysis. Other researchers or policy makers could utilize the demographic
description of the Texas and national public school principal population for future
research purposes and educational related policy making.
As the nation and state become more diverse, schools also become more diverse.
Leadership and diversity are connected as schools move from monocultural, nondiverse
contexts to ethnically diverse, multilingual, economically diverse contexts (Madsen &
Mabokela, 2002). It is important that schools and school leaders understand the need to
promote diversity awareness on campus for the betterment of all constituents. In order to
advance learning and school improvement, leaders must recognize and challenge the
confines of sameness and move toward valuing and learning from difference (Walker &
Quong, 1998) by promoting diversity awareness.
113
REFERENCES
Ajzen, I. (1985). From intentions to actions: A theory of planned behavior. In J. Kuhl and J. Bechmann (Eds.), Action-Control: From Cognition to Behavior. Heidelberg, Germany: Springer.
Ajzen, I. (1988). Attitudes, personality and behavior. Milton Keynes,
Buckinghamshire, UK: Open University Press. Ajzen, I. (1991). The theory of planned behavior. Organizational Behavior and Human
Decision Processes, 50, 179-211. Ajzen, I. & Fishbein, M. (1980). Understanding attitude and predicting social behavior.
Englewood Cliffs, NJ: Prentice Hall. American Association of School Administrators (1981). Code of ethics. Arlington, VA:
American Association of School Administrators. Azevedo, A., Von Glinow, M. & Paul, K. (2001). Does ethnic diversity mean cultural
diversity? International Journal of Value-Based Management, 14, 273-291. Bandeira de Mello, V. & Broughman, S. (1996). SASS by state: 1993-94 schools and
staffing survey: Selected results. Washington, DC: US Department of Education, National Center for Education Statistics.
Bandura, A. (1977, March). Self-efficacy: Toward a unifying theory of behavioral
change. Psychological Review, 84(2), 191-215. Banks, J. A. (1993). Multicultural education: Development, dimensions, and
challenges. Phi Delta Kappan, 75(1), 22-28. Banks, J. A. (1999). An introduction to multicultural education. Boston: Allyn and
Bacon. Banks, J. A., Cookson, P., Gay, G., Hawley, W. D., Irvine, J. J., Nieto, S., Schofield, J.
W., & Stephan, W. G. (2001, November). Diversity within unity: Essential principles for teaching and learning in a multicultural society. Phi Delta Kappan, 196-203.
Baten, J. (2006). Multivariate regression analysis powerpoint. Retrieved March 13,
2006 from www.uni-tuebingen.de/uni/wwl/multivariate 20analyses.ppt. Beck, L. G. (1994). Reclaiming educational administration as a caring profession.
New York: Teachers College Press.
114
Beck, L. G. & Murphy, J. (1997). Ethics in educational leadership programs: Emerging
models. Columbia, MO: University Council for Educational Administration. Becker, E. A., & Gibson, C. C. (1998). Fishbein and Ajzen’s theory of reasoned action:
Accurate predication of behavioral intentions for enrolling in distance education courses. Adult Education Quarterly, 49(1), 43-55.
Bennett, C. I. (1999). Comprehensive multicultural education: Theory and practice
(4th edition). Boston, MA: Allyn and Bacon. Blair, L. A. (Ed.) (2000). As our nation becomes more diverse. SEDLetter, XII(2), 2. Blalock, H. M. (1979). Social statistics, (2nd ed.) New York: McGraw-Hill, Inc. Blase, J. (1987). Dimensions of effective school leadership: The teacher’s perspective.
American Educational Research Journal, 24, 589-610. Bogotch, I. E., Miron, L. F., & Murry, J. (1998). Moral leadership discourses in urban
school settings: The multiple influences of social context. Urban Education, 33(3), 303-330.
Brieve, F. J. (1972). Secondary principals as instructional leaders. NASSP Bulletin,
55(1), 11-15. Brookover, W., Beamer, L., Efthim, H., Miller, & Hathaway, D. (1982). Creating
effective schools. Holmes Beach, FL: Learning Publications. Capper, C. A. (Ed.). (1993). Educational administration in a pluralistic society. Albany,
NY: State University of New York Press. Carignan, N., Pourdavood, R. G., King, L. C., & Feza, N. (2005). Social
representations of diversity: Multi/intercultural education in a South African urban school. Intercultural Education, 16(4), 381-393.
Cohen, J., Fishbein, M., & Ahtola, O. (1972, November). The nature and uses of
expectancy-value models in consumer attitude research, Journal of Marketing Research, IX, 456-460.
Combs, J. P. (1994). A profile of the elementary school principalship in Texas in 1993.
Doctoral dissertation, East Texas State University, Commerce, Texas.
115
Conner, M., Povey. R., Sparks, P., James, R., and Shepherd, R. (2003). Moderating role of attitudinal ambivalence within the theory of planned behaviour. British Journal of Social Psychology, 42, 75-94.
Council of Chief State School Officers (1996). Interstate school leaders licensure
consortium: Standards for school leaders. Alexandria, VA: Council of Chief State School Officers.
Creative Research Systems (2005). The survey system sample size calculator. Retrieved October 15, 2005 from www.surveysystem.com/sscalc.html. Cronbach, L. J. (1951, September). Cronbach alpha and the internal structure of tests.
Psychometrika, 16, 297-334. Cross, C. T., & Rice, R. C. (2000). The role of the principal as instructional leader in a
standards-driven system. NASSP Bulletin, 84(620), 61-65. Cuban, L. (1988). The managerial imperative and the practice of leadership in schools.
Albany, NY: State University of New York Press. Davis-Wiley, P. (2002). A demographic profile of diversity in the United States: Who
are the newcomers of the 21st century? International Education 32(1), 49-57. Deal, T. E., & Peterson, K. D. (1991). The principal’s role in shaping school culture.
Washington, DC: Office of Educational Research & Improvement, U.S. Department of Education.
Decker, L. (1997). Is parent involvement your job? NEA Today 16. 6-7. DiPaola, M., & Tschannen-Moran, M. (2003). The principalship at a crossroads: A
study of the conditions and concerns of principals. NASSP Bulletin, 87(634), 43-50. Donaldson, G., Jr. (2001). Cultivating leadership in schools: Connecting people,
purpose, and practice. New York: Teachers College Press. Edmonds, R. R. (1979). Effective schools for the urban poor. Educational Leadership,
37(2), 15-24. El Jaam, B. (2005). Customer satisfaction with cellular network performance: Issues
and analysis. Doctoral dissertation, Iowa State University, Ames, Iowa.
116
Ellis, D. W. (1997). Measuring high school students’ perceptions of teacher respect: The relationship to success in school (academic success, teacher-student relationship, interpersonal skills). Doctoral dissertation, the University of Texas, Austin, Texas.
Faltis, C. J. (2001). Joinfostering: Teaching and learning in multilingual classrooms
(3rd ed.). Upper Saddle River, NJ: Merrill Prentice Hall. Fiore, T., Curtin, T., & Hammer, C. (1997). Public and private school principals in the
United States: A statistical profile, 1987-1988 to 1993-1994. Washington, DC: U. S. Government Printing Office.
Fishbein, M. (1967). Attitude and the prediction of behavior. In M. Fishbein (Ed.),
Readings in attitude theory and measurement (477-492). New York: Wiley. Fishbein, M. & Ajzen, I. (1973). Attribution of responsibility: A theoretical note.
Journal of Experimental Social Psychology, 9(2), 148-169. Flores, P. V. (2002). An analysis of the evolution in public high school principals’ roles
and leadership theories as compared to high school principal certification requirements in fives states in the United States from 1980-2001. Dissertation Abstracts International, 63 (05), 16401. (UMI No. 3054591).
Ford, S. G. (2003). The role of imagined interaction and self-efficacy in psychosocial
adjustment to spousal bereavement: A communication perspective. Doctoral Dissertation, Louisiana State University, Baton Rouge, Louisiana.
Fullan, M. & Hargreaves, A. (1991). What’s worth fighting for: Working together for
your school. Andover, MA: Regional Laboratory for Educational Improvement of the Northeast and Islands in association with Ontario Public School Teachers’ Federation.
Gall, M. D., Borg, W. R., & Gall, J. P. (1996). Applying educational research. A
practical guide. (4th ed.). White Plains, NY: Longman Publishers USA. Garrett, J. E. (2002). Cultural diversity: Applying technology. National Social Science
Perspectives Journal, 19, 55-60. Garrett, J. E., & Morgan, D. E. (2002). Celebrating diversity by educating all students:
Elementary teacher and principal collaboration. Education, 123(2), 268-275. Gaten, T. (2000). University of Leicester on-line statistics: Normal distribution.
Retrieved March 14, 2006 from www.le.ac.uk/biology/gat/virtualfc/ Stats/normal.htm.
117
Gay, G. (1995). Bridging multicultural theory and practice. Multicultural Education,
3(1), 4-9. Grant, G., & Ladson-Billings, G. (1997). Dictionary of multicultural education.
Phoenix, AZ: Oryx Press. Greene, W. H. (1993). Econometric analysis (2nd ed.). New York: Macmillan
Publishing Company. Growe, R., Schmersahl, K., Perry, R., & Henry, R. (2002). A knowledge base for
cultural diversity in administrator training. Journal of Instructional Psychology 29(3), 205-212.
Hair, J. F., Black, W. C., Babin, B. J., Anderson, R. E., & Tatham, R. L. (2006).
Multivariate data analysis. Upper Saddle River, NJ: Pearson Prentice Hall. Hallinger, P. (1992). The evolving role of American principals: From managerial to
instructional to transformational leaders. Journal of Educational Administration, 30(3), 35-48.
Hankins, M., French, D., & Horne, R. (2000). Statistical guidelines for studies of the
theory of reasoned action and the theory of planned behavior. Psychology & Health, 15(2), 151-162.
Hodgkinson, H. L. (2002). The demographics of diversity. Principal, 82(2), 14-16. Holland, P. (2004). Principals as supervisors: A balancing act. NASSP Bulletin, 88 (07),
3-14. Hoyle, J., Bjork, L., Collier, V., & Glass, T. (2005). The superintendent as CEO:
Standards based performance. Thousand Oaks, CA: Corwin Press. Hoyle, J., English, F., & Steffy, B. (1998). Skills for successful 21st century school
leaders: Standards for peak performers. Arlington, VA: American Association of School Administrators.
Isaacson, R. L., & Hunt, M. L. (1971). Psychology: The science of behavior. (2nd ed.)
New York, NY: Harper and Row. In M. J. Ryan & E. H. Bonfield, (1975). The Fishbein extended model and consumer behavior, Journal of Consumer Research, 2(2), 118-125.
Kerlinger, F. N. (1973). Foundations of behavioral research, (2nd ed.). New York:
Holt, Rinehart and Winston, Inc.
118
Kolekofski, K. E., Jr., & Heminger, A. R. (2003). Beliefs and attitudes affecting
intentions to share information in an organizational setting. Information & Management, 40(1), 521-532.
LeFlore, L. (2005). Valuing diversity. Morgantown, WV: West Virginia University
Extension Service. Li, N. (2002). Toward educational equality within the context of school teachers’
managing. Education, (123)2, 329-333. Livingston, A., (2006). The condition of education in brief. (NCES 2006-072).
Washington, DC: U.S. Government Printing Office. MacQueen, A. H., Wellisch, J. B., Carriere, R. A., & Duck, G. A. (1978). School
management and organization in successful schools. Sociology of Education, 51(1), 211-221.
Madsen, J. A. & Mabokela, R. O. (2002). Leadership and diversity: Creating inclusive
schools. Peabody Journal of Education, 77(1), 1-6. Marcus, A. C. (1976). Administrative leadership in a sample of successful schools from
the national evaluation of the emergency school aid act. Santa Monica, CA: System Development Corporation.
Maxcy, S. J. & Caldas, S. J. (1991). Moral imagination and the philosophy of school
leadership. Journal of Educational Administration, 29(3), 38-53. McCray, C. R., Wright, J. V., & Beachum, F. D. (2004). An analysis of secondary
school principals’ perceptions of multicultural education. Education, 125(4), 111-120.
Morgan, D. E. (2002, February). The school administrator’s role in fostering inclusive
schools for diverse students. Paper presented at the annual conference of the National Council of Professors of Educational Administration, San Diego, CA.
Murdock, S., Hoque, N., Michael, M., White, S., & Pecotte, B. (1997). The Texas
challenge: Population change and the future of Texas. College Station, TX: Texas A&M University Press.
Murdock, S., White, S., Hoque, N., Pecotte, B., You, X., & Balkan, J. (2002). A
summary of The Texas challenge in the twenty-first century: Implications of population change for the future of Texas. College Station, TX: Texas A&M University Press.
119
Murphy, J., & Shipman, N. J. (2002). The Interstate School Leaders Licensure
Consortium (ISLLC) story: A brief narrative. In K. Hessel & J. Holloway (2002), A framework for school leaders: Linking the ISLLC standards to practice (4-9). Princeton, NJ: Educational Testing Service.
National Council for Accreditation of Teacher Education. (1995). Standards,
procedures, and policies for the accreditation of professional education units. Washington, DC: National Council for Accreditation of Teacher Education.
National Education Association. (1948). The elementary-school principalship: Today
and tomorrow. Washington, DC: National Education Association. National Policy Board of Education Administration. (2002). The National Policy Board
of Education Administration principal standards. Arlington, VA: National Policy Board of Education Administration, 2002.
Nelson, D. K. (1983). A profile of the elementary school principalship in Texas in 1982.
Doctoral Dissertation, East Texas State University, Commerce, Texas. Noack, K. W. (2004). An assessment of the campus climate for gay, lesbian, bisexual,
and transgender persons as perceived by the faculty, staff and administration at Texas A&M University. Doctoral Dissertation, Texas A&M University, College Station, TX.
Norusis, M. J. (2002). SPSS guide to data analysis. Upper Saddle River, NJ: Prentice
Hall. O’Neil, J. (1993). A new generation confronts racism. Educational Leadership, 50(1).
60-63. Parks, S. (1999). Reducing the effects of racism in schools. Educational Leadership,
56(7), 14-26. Patrick, D., & Reinhartz, J. (1999). The role of collaboration in teacher preparation to
meet the needs of diversity. Education, 119, 388-399. Pedhazur, E. J. (1982). Multiple regression in behavioral research, second edition.
New York: CBS College Publishing. Phillips, J. J. & Phillips, P. P. (2004, August). Return to sender: Improving response
rates for questionnaires and surveys. Performance Improvemen, 43(7), 40-44.
120
Pohan, C. A., & Aguilar, T. E. (1999). The personal and professional beliefs about diversity scales: A user’s manual and scoring guide. Corpus Christi, TX: Pohan & Aguilar.
Pohan, C. A., & Aguilar, T. E. (2001). Measuring educators’ beliefs about diversity in
personal and professional contexts. American Educational Research Journal, 38(1). 159-182.
Raosoft, Incorporated (2005). Sample size calculator by Raosoft, Inc. Retrieved October 15, 2005 from www.raosoft.com/samplesize/html. Reid, S. (2001). Texas demographics: The state of change. Austin, TX: Texas
Association of Counties. Reitzug, U. C. & Reeves, J. E. (1992). “Miss Lincoln doesn’t teach here”: A descriptive
narrative and conceptual analysis of a principal’s symbolic leadership behavior. Educational Administration Quarterly, 28(2), 185-219.
Richard, A. (2000, November 1). Panel calls for fresh look at duties facing principal.
Education Week, 3-5. Riche, M. F. (2002). America’s diversity and growth: Signposts for the 21st century.
Population Bulletin, 55(2), 3-43. Risius, S. L. (2002). Practical applications of the ISLLC standards: Job analysis, job
descriptions, and performance evaluation criteria in selected school districts. Dissertation Abstracts International, 63 (7), 24-28. (UMI No. 3060166).
Rodriguez, V. J. (2000). Diversity training improves intercultural communication skills.
SEDLetter, XII (2). 1-2. Rosenberg, M. J. (1960a). Cognitive reorganization in response to the hypnotic reversal
of attitudinal effect. Journal of Personality, 28(1), 39-63. Rosenberg, M. J. (1960b). A structural theory of attitude dynamics. Public Opinion
Quarterly, 24(2), 319-340. Rosenblatt, R. A. (2001). Census illustrates diversity from sea to shining sea. The Los
Angeles Times, A16. Los Angeles, CA: The Los Angeles Times. Ryan, M. J., & Bonfield, E. H. (1975). The Fishbein extended model and consumer
behavior. Journal of Consumer Research, 2(2), 118-125.

121
Salkind, N. J. (2000). Statistics for people who (think they) hate statistics. Thousand Oaks, CA: Sage Publishers, Inc.
Santos, J. R. A (1999). Cronbach's Alpha: A tool for assessing the reliability of scales.
Journal of Extension, 37(2), April. Retrieved March 10, 2006 from www.joe.org/joe/1999april/tt3.html.
Scheurich, J. J. (1998). Highly successful and loving, public elementary schools
populated mainly by low-SES children of color. Urban Education, 33(4), 451-491.
Schmitz, C. L., Stakeman, C., & Sisneros, J. (2001). Educating professionals for
practice in a multicultural society: Understanding oppression and valuing diversity. Families in Society: The Journal of Contemporary Human Services, 82(6), 612-622.
Sergiovanni, T. J. (1992). Introduction: Postmodernism and supervision. In C. D.
Glickman (Ed.), Supervision in transition: 1992 yearbook of the Association for Supervision and Curriculum Development. Alexandria, VA: Association for Supervision and Curriculum Development.
Sergiovanni, T. J. (1994). Building community in schools. San Francisco, CA: Jossey-
Bass. Sheppard, B. H., Hartwick, J., & Warshaw, P. R. (1988). The theory of reasoned action:
A meta-analysis of past research with recommendations for modifications and future research, Journal of Consumer Research, (15)1, 325-343.
Skrla, L., Erlandson, D. A., Reed, E. M., & Wilson, A. P. (2001). The emerging
principalship. Larchmont, NY: Eye on Education. Smith, W., & Andrews, R. (1989). Instructional leadership: How principals make a
difference. Alexandria, VA: Association for Supervision and Curriculum Development Press.
SPSS, Inc. (2002). Statistical package for the social sciences, version 11.5. Upper
Saddle River, NJ: Prentice Hall, Inc. Stainback, W. & Stainback, S. (Eds.), (1990). Support networks for inclusive schooling
Baltimore, MD: Paul H. Brooks Publishers. State Board of Educator Certification, (2002). Number and percentage of Texas public
school principals by race/ethnicity and sex (1995 through 2002). Austin, TX: State Board of Educator Certification.
122
Strizek, G. A., Pittsonberger, J. L., Riordan, K. E., Lyter, D. M., & Orlofsky, G. F.
(2006). Characteristics of schools, districts, teachers, principals, and school libraries in the United States: 2003-2003 schools and staffing survey (NCES 2006-313 Revised. Washington, DC: U.S. Government Printing Office.
Sutton, S. (1998). Predicting and explaining intentions and behavior: How well are we
doing? Journal of Applied Social Psychology, 28(8), 1317-1338. Sweeney, J. (1982). Principals can provide instructional leadership: It takes
commitment. Education, 103(2), 204-207. Texas Administrative Code. (2005) Texas administrative code, 2005, Title 19, part 7,
chapter 241. Texas Education Agency (2005a). AskTED Texas education directory. Retrieved
December 1, 2005 from askted.tea.state.tx.us/org-bin/school/SCHOOL_RPT?Y::All::Directory.
Texas Education Agency (2005b). Role master file 2004-2005: Public education
information management system fall snapshot. Austin, TX: Texas Education Agency.
Texas Education Agency (2006). Academic excellence indicator system, 2004-05 State
Profile Report. Austin, TX: Texas Education Agency. Thomson, S. D. (Ed.), (1993). Principals for our change schools: The knowledge and
skills base. Lancaster, PA: Technomic. Urquhart, V. A. (2002). Three faces of diversity. Principal, (82)2, 24-26. U.S. Congress. (1972). Revitalizing the role of the school principal, Washington, DC:
Government Printing Office. Van den Putte, B. (1995). Applying structural equation modeling in the context of the
theory of reasoned action: Some problems and solutions. Structural Equation Modeling, 4(4). 320-337.
Walker, A. & Quong, T. (1998). Valuing differences: Strategies for dealing with the
tensions of educational leadership in a global society. Peabody Journal of Education, 73(2), 81-105.
Wallace, R. (1996). From vision to practice: The art of educational leadership.
Thousand Oaks, CA: Corwin Press, Inc.

123
Zacharias, Z. (2003). Beliefs, attitudes, and intentions of science teachers regarding the educational use of computer simulations and inquiry-based experiments in physics. Journal of Research in Science Teaching, 40(8), 792-823.
Zint, M. (2002). Comparing three attitude-behavior theories for predicting science
teacher’s intentions. Journal of Research in Science Teaching, 39(9), 819-844.

124
APPENDIX A
INSTRUMENT
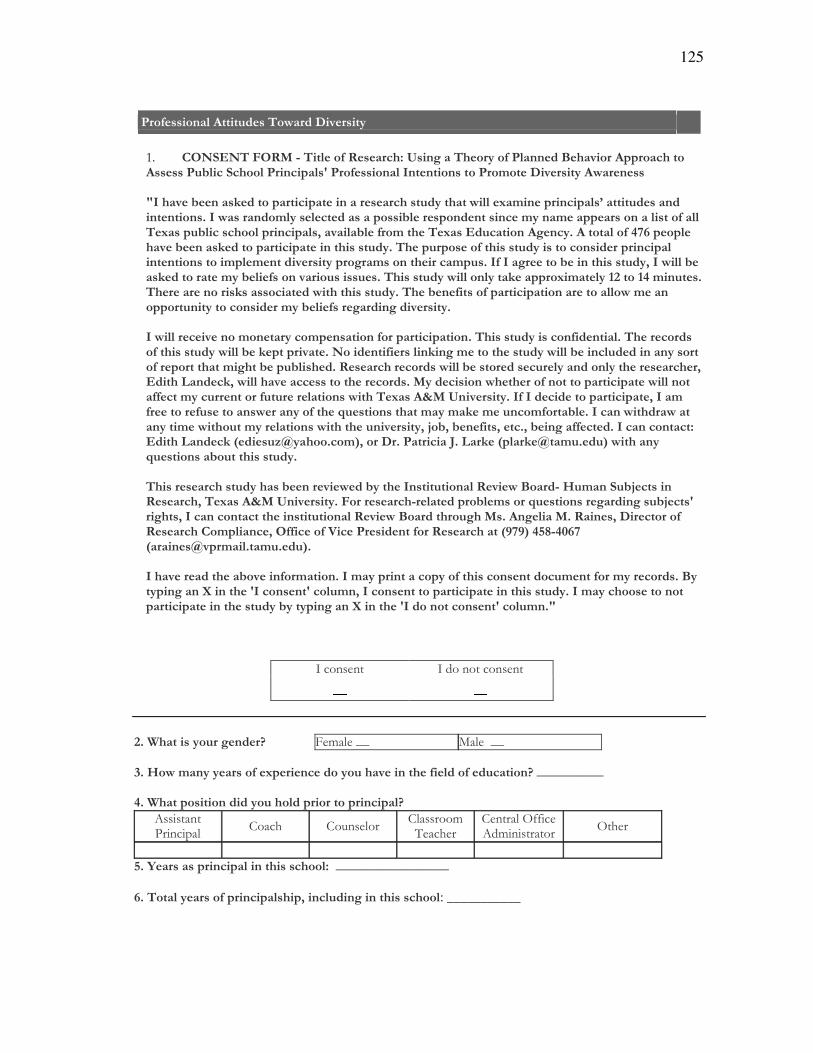
125
�� ��������������� �������������������������������������������������� !!������ �� �������"#�����������������!���$��������������%� �� ����� �����&� ��'������ �� (����������)%������#������*��� ��!�� ���!� ����������������� "��� �� �(�����+�&����!�����!���,�� � "���������� �� ����-�%�(��������&�������� ��������!����#������!����� �������&����&���!!������������� ����������+���!"#�����������!�����!���.�������#������&� �����+�����"�� ���� �����-� � � ������/01�!��!��������#������*��� ��!�� ���!� ����� ����� "��-�����!"�!������� ����� "������ �����������!�����!����� �� ����� ���&!��&�� �������� ��!�����&����� �������&!"�-�%��%������� ��#����� ����� "��.�%�(����#����*��� ���� ��&��#���������������"�����"��-������� "���(��������� �*���!!��+�&� ����23� ��2/�&��" ��-�����������������*��������� ���(� �� ����� "��-�����#����� �����!�� ���!� �������� ������(�&������!!�� "�� �� �����������&��#������������������������ �-��%�(���������������&��� ������&!���� ��������!�� ���!� ���-������� "�������������� ���-���������������� ����� "���(����#��*�! �!���� �-�������� ����������*����&�� �� ���� "���(����#������"�������������� ������!�� � �� �&��� �#��!"#������-�����������������(����#��� ��������"�������������� �������������.���� ��4�����*.�(���������������� �� ����������-������������(�� ��������� � ��!�� ���!� ��(������ ������ �&���"���� �����" "������� �����(� ����+��� 5��������� �-�%��%�������� ��!�� ���!� �.�%��&������ �����"��� �����(���������� ���6"�� ����� �� �&���&�*��&��"���&��� �#��-�%�����(� ����(�� ����� �&��(� ��" �&������ �����(� �� ���"������� �.�7�#.�#����� �.�� �-.�#���������� ��-�%�������� �� ������ ��4�����*�8�����"9:�����-��&;.����'�-��� ������<-�4��*��8!���*�: �&"-��";�(� ������6"�� ������#�" � ����� "��-������������������ "�������#���������(���#�� ���%�� � " ����������(��������="&����"#7�� ������������.���+��� 5��������� �-������������������ ���!��#��&�����6"�� ����������������"#7�� �$����� �.�%�������� �� � ������ � " ����������(������� ���"����-� �������-������.�'���� ����������������&!������.�����������>������������ �������������� �8?0?;�/@A�/B10�8�������:�!�&���- �&"-��";-��%����������� ����#���������&� ���-�%�&���!��� �����!����� ���������� ����"&�� �����&���������-���� �!�������C���� ���$%������� $����"&�.�%������� � ��!�� ���!� ����� ����� "��-�%�&���������� ���� �!�� ���!� ����� ���� "���#�� �!�������C���� ���$%������ ������� $����"&�-)�
������� �������������
��� ���
3-�D�� ������"��������E � ��������� ���������F-�=�(�&��������������+!�������������"��������� ��������������"�� ���E�GGGGGGGGGG�
�/-�D�� �!��� ����������"������!����� ��!�����!��E�
�����������������
����� ���������������� ������
�������������� ��������
���
� � � � � �
@-�H��������!�����!������ �������������GGGGGGGGGGGGGGGGG�
1-��� ������������!�����!�����!.�����"�������� ����������: ___________
�������������� � "������(����'������ ��
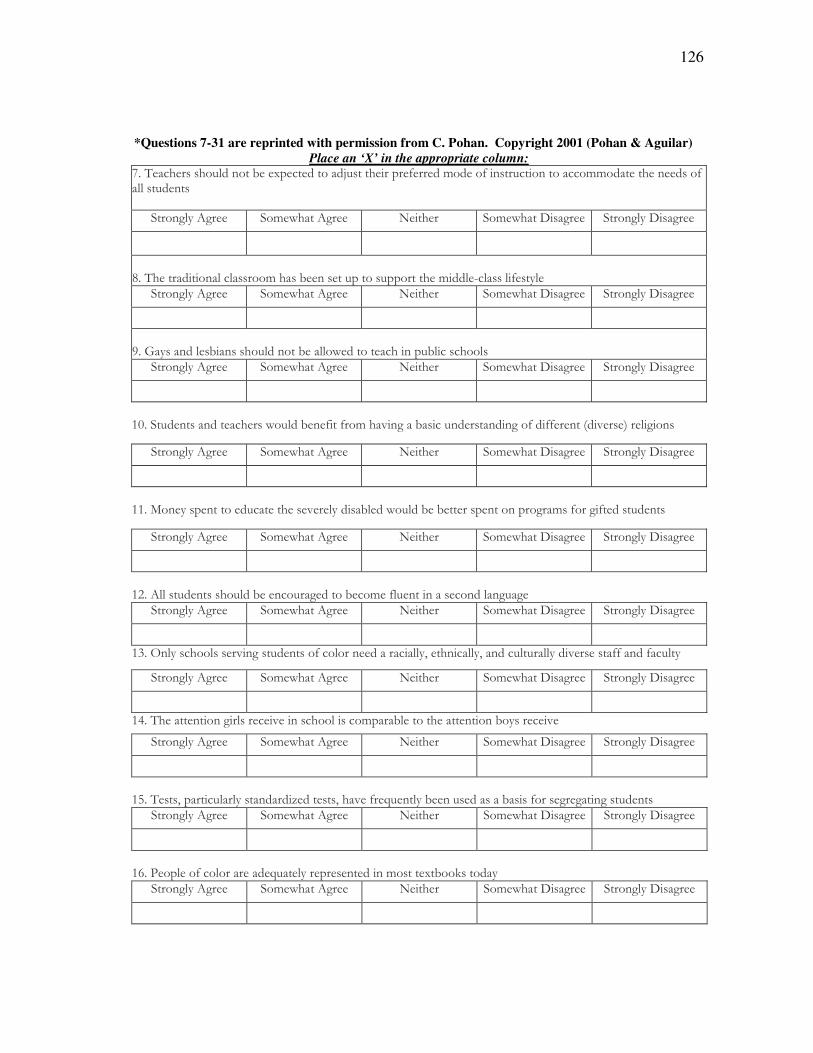
126
*Questions 7-31 are reprinted with permission from C. Pohan. Copyright 2001 (Pohan & Aguilar)
Place an ‘X’ in the appropriate column: ������������������������������� �������������� ���������������������� �����������������������
!���"�#��"��� !� $����"��� %����� !� $���&���"��� !���"�#�&���"��
�'����������������������� ������������������������ ����(����������#��!���"�#��"��� !� $����"��� %����� !� $���&���"��� !���"�#�&���"��
�)��*�#������������������������������$��������������������������!���"�#��"��� !� $����"��� %����� !� $���&���"��� !���"�#�&���"��
��+��!���������������$������������� ���,��"�������������������"�����������-��,��.����"�����
!���"�#��"��� !� $����"��� %����� !� $���&���"��� !���"�#�&���"��
��������#���������������,��#���������$��������������������"�� ������"����������
!���"�#��"��� !� $����"��� %����� !� $���&���"��� !���"�#�&���"��
��/���������������������������"������� ��������������������"��"�!���"�#��"��� !� $����"��� %����� !� $���&���"��� !���"�#�&���"��
�0�����#�����������,��"����������������������������#1��������#1�������������#���,�����������������#�
!���"�#��"��� !� $����"��� %����� !� $���&���"��� !���"�#�&���"��
�2�����������"��������,���������������� �������������������#�����,�
!���"�#��"��� !� $����"��� %����� !� $���&���"��� !���"�#�&���"��
��3�����1�����������#���������4����1���,���5���#������������������������"�"���"�������!���"�#��"��� !� $����"��� %����� !� $���&���"��� !���"�#�&���"��
��6���������������������5���#����������� �������7�����#�!���"�#��"��� !� $����"��� %����� !� $���&���"��� !���"�#�&���"��
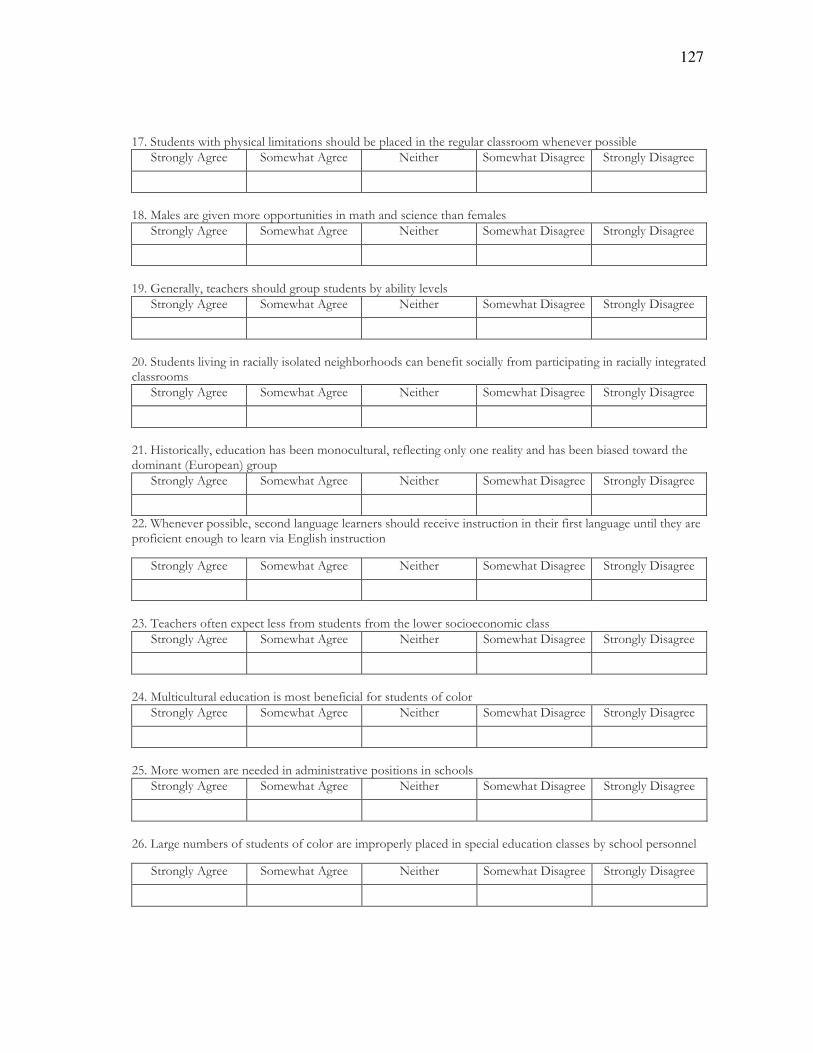
127
�����!�����$�����#�������� ����������������������������"������������� �$��,����������!���"�#��"��� !� $����"��� %����� !� $���&���"��� !���"�#�&���"��
��'����������"�,�� ����������������� ������������������ ����!���"�#��"��� !� $����"��� %����� !� $���&���"��� !���"�#�&���"��
��)��*�����#1��������������"������������#������#��,���!���"�#��"��� !� $����"��� %����� !� $���&���"��� !���"�#�&���"��
�/+��!�������,��"�����������#����������"��������������������������#���� �����������"�����������#���"������������ ��!���"�#��"��� !� $����"��� %����� !� $���&���"��� !���"�#�&���"��
�/���8���������#1���������������� ����������1�������"����#��������#�������������������$�������� �����-9������.�"�����!���"�#��"��� !� $����"��� %����� !� $���&���"��� !���"�#�&���"��
//��:��,���������1����������"��"������������������,��������������������������"��"�������#����������������"���������,���9�"���������������
!���"�#��"��� !� $����"��� %����� !� $���&���"��� !���"�#�&���"��
�/0������������������������ ���������� �����$����������� ���������!���"�#��"��� !� $����"��� %����� !� $���&���"��� !���"�#�&���"��
�/2������������������������� �������������������������������!���"�#��"��� !� $����"��� %����� !� $���&���"��� !���"�#�&���"��
�/3������$� �������������� �������,���������������������!���"�#��"��� !� $����"��� %����� !� $���&���"��� !���"�#�&���"��
�/6��;��"��� �������������������������� ������#���������������������������������#����������������
!���"�#��"��� !� $����"��� %����� !� $���&���"��� !���"�#�&���"��

128
�/�������������������,�$������������1����������������,��������$��7��"�$������������ ���,����������������������7"�������!���"�#��"��� !� $����"��� %����� !� $���&���"��� !���"�#�&���"��
�/'��!�������� ���$����������� ������7"�������#������#���,��$������������������������������� ����(����������!���"�#��"��� !� $����"��� %����� !� $���&���"��� !���"�#�&���"��
�/)��!���������������������$�������7������"��"���������9�"�����$��������������!���"�#��"��� !� $����"��� %����� !� $���&���"��� !���"�#�&���"��
�0+�������� �������������������"�������,���#�������"��������������������#�!���"�#��"��� !� $����"��� %����� !� $���&���"��� !���"�#�&���"��
0������������������������������� ��������������"1�$����"1����� ��1������� ���������#�
!���"�#��"��� !� $����"��� %����� !� $���&���"��� !���"�#�&���"��
Place an ‘X’ in the appropriate column for #32-34, ‘a’ through ‘e,’ below: F3-�%����"�(���� ���&!����9���(������������������ ��8������ ���#���(;�#������ �������������&&������#����"����� ��� .���(�� �������(�"���!�����(�����!�������������!��������"����"���!!������������!!����������"������� �E��
�� !���"�#������,� �����,� %���� &�������,� !���"�#�&�������,�
���<��=9�����#�&�,���#� �� �� �� �� �����*����&�,���#� �� �� �� �� �����!������������&�,���#� �� �� �� �� �����&����������&�,���#� �� �� �� �� ����;��"��"�&�,���#� �� �� �� �� ��������
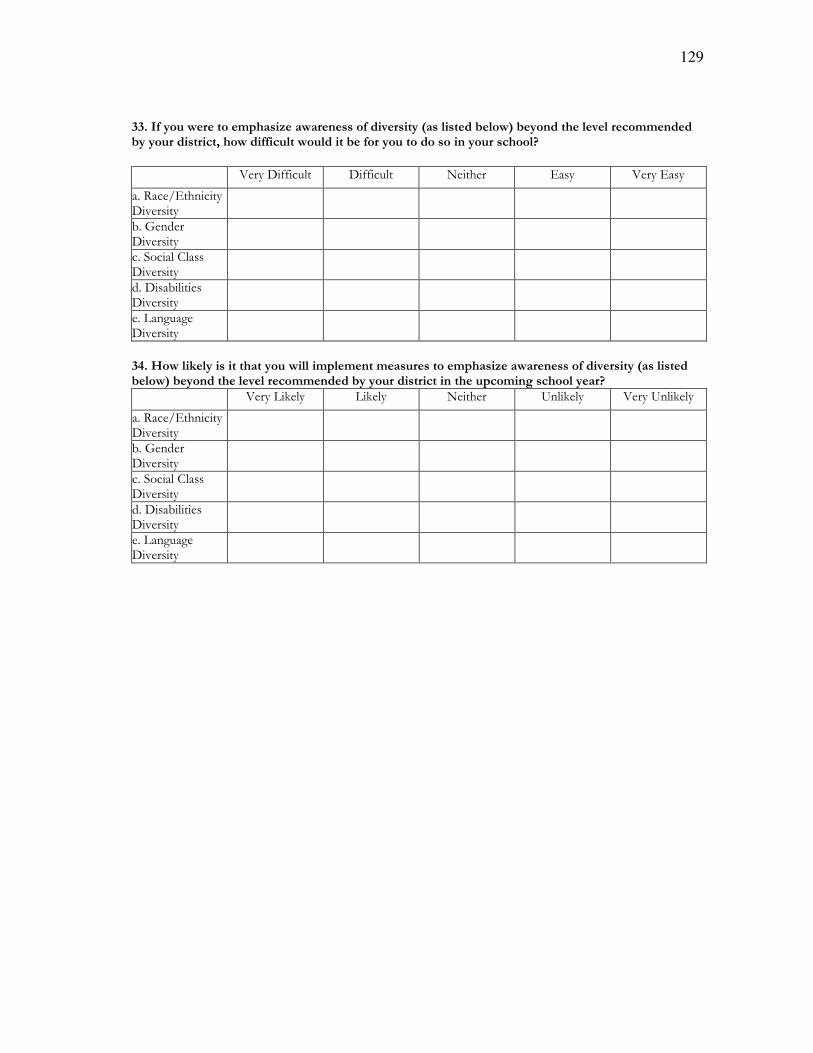
129
FF-�%����"�(���� ���&!����9���(������������������ ��8������ ���#���(;�#������ �������������&&������#����"����� ��� .���(�������"� �(�"���� �#��������"� �������������"��������E��
�� >�#�&�������� &�������� %���� 9��#�� >�#�9��#�
���<��=9�����#�&�,���#� �� �� �� �� �����*����&�,���#� �� �� �� �� �����!������������&�,���#� �� �� �� �� �����&����������&�,���#� �� �� �� �� ����;��"��"�&�,���#� �� �� �� �� ��
�F/-�=�(���*�������� � �� ���"�(�����&!��&�� �&���"���� ���&!����9���(������������������ ��8������ ���#���(;�#������ �������������&&������#����"����� ��� ���� ���"!��&���������������E�
�� >�#�;�7�#� ;�7�#� %���� ?���7�#� >�#�?���7�#�
���<��=9�����#�&�,���#� �� �� �� �� �����*����&�,���#� �� �� �� �� �����!������������&�,���#� �� �� �� �� �����&����������&�,���#� �� �� �� �� ����;��"��"�&�,���#� �� �� �� �� ��

130
APPENDIX B
IRB

131
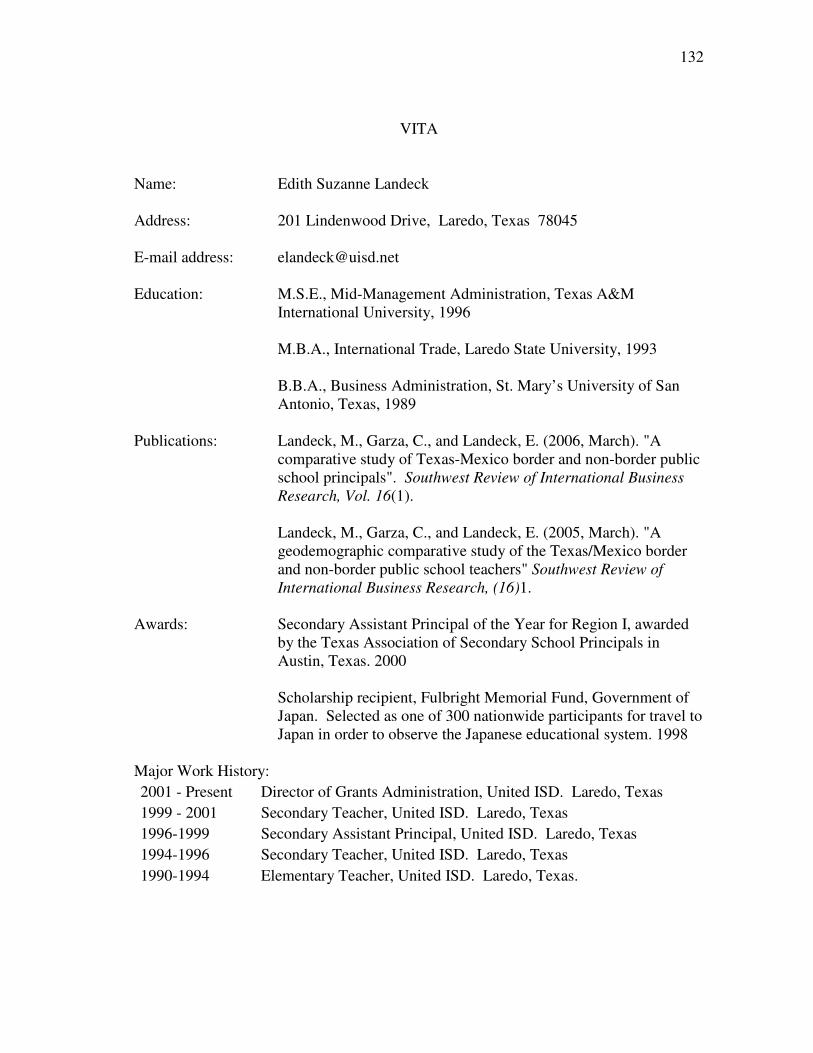
132
VITA
Name: Edith Suzanne Landeck Address: 201 Lindenwood Drive, Laredo, Texas 78045 E-mail address: [email protected] Education: M.S.E., Mid-Management Administration, Texas A&M
International University, 1996
M.B.A., International Trade, Laredo State University, 1993
B.B.A., Business Administration, St. Mary’s University of San Antonio, Texas, 1989
Publications: Landeck, M., Garza, C., and Landeck, E. (2006, March). "A
comparative study of Texas-Mexico border and non-border public school principals". Southwest Review of International Business Research, Vol. 16(1).
Landeck, M., Garza, C., and Landeck, E. (2005, March). "A
geodemographic comparative study of the Texas/Mexico border and non-border public school teachers" Southwest Review of International Business Research, (16)1.
�
Awards: Secondary Assistant Principal of the Year for Region I, awarded by the Texas Association of Secondary School Principals in Austin, Texas. 2000
Scholarship recipient, Fulbright Memorial Fund, Government of Japan. Selected as one of 300 nationwide participants for travel to Japan in order to observe the Japanese educational system. 1998
Major Work History: 2001 - Present Director of Grants Administration, United ISD. Laredo, Texas 1999 - 2001 Secondary Teacher, United ISD. Laredo, Texas 1996-1999 Secondary Assistant Principal, United ISD. Laredo, Texas 1994-1996 Secondary Teacher, United ISD. Laredo, Texas 1990-1994 Elementary Teacher, United ISD. Laredo, Texas.
Related Documents