This article appeared in a journal published by Elsevier. The attached copy is furnished to the author for internal non-commercial research and education use, including for instruction at the authors institution and sharing with colleagues. Other uses, including reproduction and distribution, or selling or licensing copies, or posting to personal, institutional or third party websites are prohibited. In most cases authors are permitted to post their version of the article (e.g. in Word or Tex form) to their personal website or institutional repository. Authors requiring further information regarding Elsevier’s archiving and manuscript policies are encouraged to visit: http://www.elsevier.com/authorsrights

Welcome message from author
This document is posted to help you gain knowledge. Please leave a comment to let me know what you think about it! Share it to your friends and learn new things together.
Transcript

This article appeared in a journal published by Elsevier. The attachedcopy is furnished to the author for internal non-commercial researchand education use, including for instruction at the authors institution
and sharing with colleagues.
Other uses, including reproduction and distribution, or selling orlicensing copies, or posting to personal, institutional or third party
websites are prohibited.
In most cases authors are permitted to post their version of thearticle (e.g. in Word or Tex form) to their personal website orinstitutional repository. Authors requiring further information
regarding Elsevier’s archiving and manuscript policies areencouraged to visit:
http://www.elsevier.com/authorsrights

Author's personal copy
Analysis
Using a choice experiment framework to value conservation-contingentdevelopment programs: An application to Botswana
Elizabeth F. Pienaar a,⁎, Lovell S. Jarvis b, Douglas M. Larson b
a Department of Wildlife Ecology and Conservation, Tropical Conservation and Development Program, University of Florida, United Statesb Department of Agricultural and Resource Economics, University of California, Davis, United States
a b s t r a c ta r t i c l e i n f o
Article history:Received 17 January 2013Received in revised form 16 December 2013Accepted 27 December 2013Available online 20 January 2014
JEL classification:Q56H41
Keywords:Community Based Natural ResourceManagementWildlifeCommunity developmentChoice experimentsBotswana
Community Based Natural Resource Management (CBNRM) programs in Botswana have had limited conserva-tion effect because the provision of development benefits is not contingent on wildlife conservation. Buildingon existing discussions about which development initiatives these programs should implement, we use choiceexperiment data to empirically determine what value CBNRM community members place on both private andquasi-public development interventions. We show that these interventions are sufficient to incentivize house-holds to engage in anti-poaching enforcement, revegetation of wildlife habitat and wildlife monitoring. Ourmethodology may be adapted to investigate a range of potential development interventions for which in-kindlabor contributions are required.
© 2014 Elsevier B.V. All rights reserved.
1. Introduction
Efforts to integrate wildlife conservation and rural development inBotswana continue to face a myriad of problems. In common withother integrated conservation and development (ICD) programs,Botswana's wildlife-based ICD programs (referred to as CommunityBased Natural Resource Management or CBNRM programs) seek to en-courage sustainablemanagement ofwildlife by providing rural commu-nities with tourism-funded development benefits. Unfortunately, theseprograms have largely failed to improve conservation incentives at ei-ther the community or individual level, reduce human-wildlife conflictor generate continued development benefits (Pienaar et al., 2013).Although rural villages capture a share of wildlife-based tourism reve-nues, the development benefits generated do not appear to offset thesubstantial costs associated with wildlife conservation, including re-duced access to land, crop damage, and livestock depredation (Pienaarand Kerapeletswe, 2005).
Part of this problemmay be the specificmechanisms that govern theultimate use of tourism revenues by communities. In Botswana, tourismrevenues flow to Community Based Organizations or ‘Trusts’. Trusts
usually lack sufficiently complete, rigorous information on how to allo-cate funds in a way that would have the greatest chance of achievingconservation objectives, thereby securing future tourism revenues.Since the burden of conservation falls on individual households withina Trust, the two key elements to closing the wildlife conservation loopare 1) providing households sufficient benefits and/or compensationfor forgoing actions that destroy wildlife and habitat and 2) ensuringthat these benefits are linked to conservation actions undertaken bythose same households.
This paper demonstrates a straightforward approach to providingdetailed, rigorous and quantitative information to decision-makersabout whether a linked conservation-development program is likelyto gain the support of those most responsible for the necessary conser-vation actions, namely village households. Although we focus onBotswana's ICD program, it is worth noting that the approach can beused quite broadly to assess the benefits associated with public invest-ment programs. To implement the approach, we conducted a series ofchoice experiments about ICD programs that provide rural householdswith quasi-public and private benefits in return for household participa-tion in wildlife conservation. This information enables us to provide es-timates of the value to households of both individual program featuresand of the program itself.
Since the programs include a work requirement, the approach pro-vides insight into the value of household members' time, in particularthe opportunity cost of labor time. This is attractive since in areas
Ecological Economics 98 (2014) 39–48
⁎ Corresponding author at: Department of Wildlife Ecology and Conservation, Instituteof Food and Agricultural Sciences, P.O. Box 110430, Gainesville, FL 32611-0430, UnitedStates. Tel.: +1 352 846 0630; fax: +1 352 392 6984.
E-mail address: [email protected] (E.F. Pienaar).
0921-8009/$ – see front matter © 2014 Elsevier B.V. All rights reserved.http://dx.doi.org/10.1016/j.ecolecon.2013.12.015
Contents lists available at ScienceDirect
Ecological Economics
j ourna l homepage: www.e lsev ie r .com/ locate /eco lecon

Author's personal copy
where labor markets are thin or missing, one would otherwise have toimpute a shadow wage from distant labor markets or by other means.The programs also vary in duration, which provides an opportunity toestimate the personal discount rates implied by the observed choices.In addition, the inclusion of cash payments to households in our analysisprovides a straightforward way of making program adjustments (bychanging the cash payment) to achieve whatever probability of adop-tion is desired. Since public support of ICD programs no doubt tracksclosely with the probability a household would choose them over nothaving a program, such adjustments can be helpful to build public ac-ceptance of ICD programs in a cost-effective manner.
The data used are from 499 household surveys conducted in fiveCBNRM programs during 2007. This analysis allows us to determineboth how rural households value different development benefits andthe mix of development benefits required to incentivize households toengage in wildlife conservation.
The remainder of this paper proceeds as follows. Section 2 outlinesthe choice experiments and the rationale for the development benefitsand conservation tasks included in these experiments. Section 3 de-velops an estimation model to explain respondents' choices amongthe offered CBNRM programs. Section 4 presents the data included inthe empirical specification. Section 5 discusses the estimated model.Section 6 summarizes the estimated value of conservation program, orCBNRM, attributes. Section 7 provides concluding thoughts about howwildlife-based CBNRM programs in Botswana could be restructured toachieve sustainable development.
2. The Choice Experiments
The purpose of our research is to determine what value ruralcommunity members place on various development initiatives, andwhether these are sufficient to incentivize them to engage in wildlifeconservation. To this end we implemented a series of choice experi-ments in five CBNRM programs in Botswana: the Molema Trust, theChobe Enclave Conservation Trust, the Okavango Community Trust,the Nqwaa Khobe Xeya Trust, and the Sankuyo Tshwaragano Manage-ment Trust.1 To obtain a representative sample of village households,we used stratified random sampling to survey proportionate numbersof male- and female-headed households, low-, medium-, and high-income households, and households belonging to different tribalgroups.
Respondents were given a detailed explanation of the CBNRM pro-grams they were to be offered. They were then presented with fourchoice experiment questions, which asked them to choose whichoption they preferred from among two CBNRM programs or no pro-gram at all. Each program consisted of a conservation task to be per-formed by an adult household member, the development benefitsprovided, and a cash payment to the household. The duration ofthe programs varied, being one, three, and five years in length.Addelman's (1962) orthogonal main-effects experimental plan wasused to determine the combination of CBNRM program attributes inthe choice experiments.
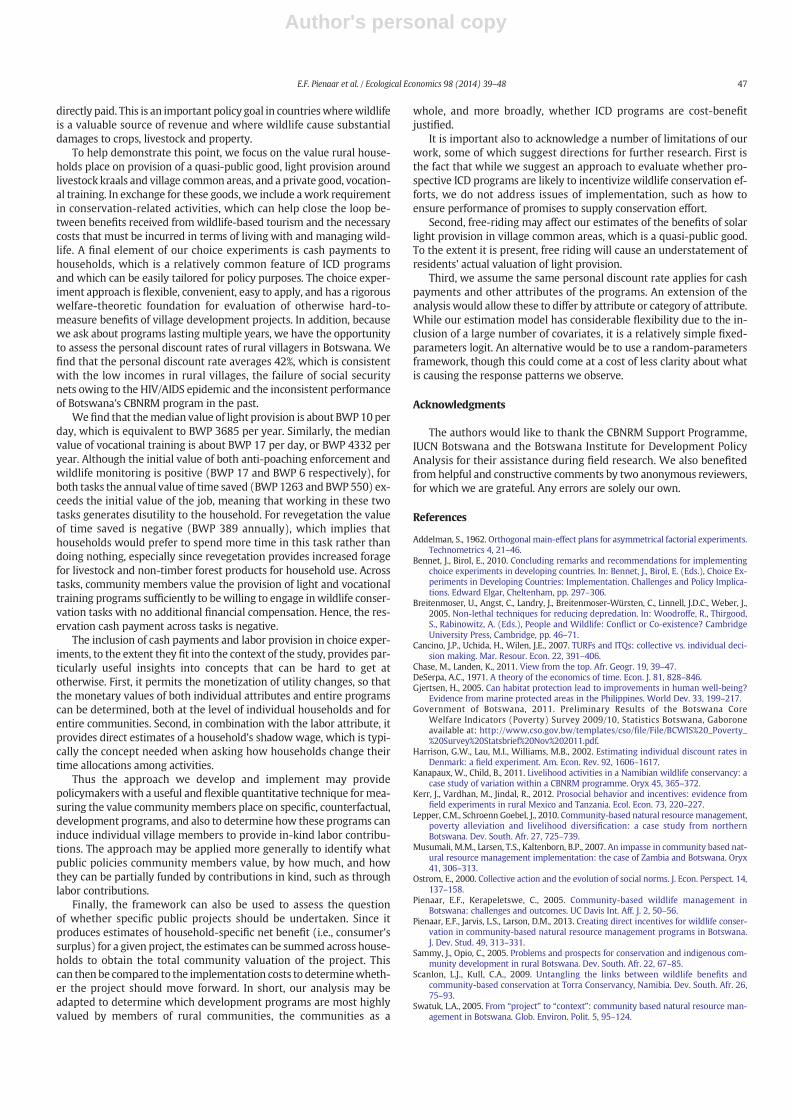
Following best practices for implementing choice experiments in adeveloping country context (Bennet and Birol, 2010), we pretestedthe survey (in the village of Zutshwa); surveys were conducted face-to-face; and illustrated cards were used as a visual aid for respondentsduring the choice experiments (See Fig. 1 for an example choice exper-iment card). Prior to presenting respondents with the choice experi-ment cards, they were provided with three key pieces of information:
(1) access to development benefits would be contingent on one adultmember of the household allocating seven days per month to wildlifeconservation for the duration of the program2; (2) no wages would bepaid to the household member engaging in the conservation task; and(3) the task could be performed by any able adultmember in the house-hold. As such, different adult members could perform the task eachmonth so that the respondent would not necessarily have to allocatehis or her time to conservation. This allowed the household greater flex-ibility in meeting the conservation requirements of the proposedCBNRM program than if a single individual had been required to supplyall the necessary labor. But it could reduce the conservation effective-ness of the programby reducing the amount of experience and skill pro-vided by the household. Although we recognize this issue, our purposewas to ascertain which development programs would incentivize ruralhouseholds to engage inwildlife conservation, rather than to determinethe optimal allocation of effort to conservation tasks to maximize wild-life conservation.
The development benefits each CBNRM program offered were 1)zero, six or 12 months of vocational training in basic secretarial, book-keeping and business skills, 2) a cash payment of BWP 0, BWP 600(US$ 71) or BWP 1200 (US$ 143)3 to be paid to the head female of thehousehold at the beginning of the school year, and 3) solar power4 toprovide light around kraals and the village at night to deter predators,a dummy variable taking the values of zero or one.
The rationale for this selection of development benefits, which areexpected to complement existing government-funded developmentprograms such as schools, health clinics and pensions, is taken fromthe CBNRM literature. When asked to identify which additional devel-opment interventionswould be of greatest benefit to them, rural house-holds typically prioritize employment, food, cash transfers, and greaterauthority to manage human-wildlife conflict (Kanapaux and Child,2011; Musumali et al., 2007). In Botswana, CBNRM stakeholders alsoidentified training, economic diversification, higher savings and im-proved understanding of natural resources management (Sammy andOpio, 2005).
Rural communities are poor and badly want increased employ-ment (Lepper and Schroenn Goebel, 2010). CBNRM targets tourismemployment, but the tourism industry is low density (Vanderpost,2006) and community members often lack the skills needed to per-form more productive, higher paid tourism jobs. Communitieswould benefit from increased investment in vocational training to in-crease their marketable skills (Vanderpost, 2006), in particular smallbusiness and conservation skills (Wainwright and Wehrmeyer, 1998;see also Gjertsen, 2005).
In addition to improved human capital, communities require in-creased cash income to meet their consumption needs—potentiallythrough the payment of cash dividends (Lepper and Schroenn Goebel,2010; Scanlon andKull, 2009). Rural income in Botswana is low, averag-ing BWP 2346 (US$ 211) permonth in 2009/10, of which 24%was com-posed of income in kind, own produce, and government assistance(Government of Botswana, 2011). Remittances or cash transfers are ofkey importance in meeting consumption needs (Swatuk, 2005), andhave been a feature of the CBNRM program in Botswana.
1 The Trusts differ in terms of geographic location, number of member villages, type oftourism (photographic tourism or safari hunting), length of operation of the Trust, tourismrevenues earned and development benefits generated, diversity of wildlife, proximity totourism centers, tribal composition of the Trust, and employment opportunities withinthe village and in the nearest regional center. The Sankuyo Tshwaragano ManagementTrust was the best performing Trust in terms of benefits generated for its members duringthe research period.
2 Respondents were also told that their household would no longer receive develop-ment benefits if an adult member of the household failed to complete seven days of con-servation activity every month. Respondents were made aware that the CBNRM programwould be implemented by an environmental NGO, which implied that their compliancewith the program would be monitored by both other village members and a third party.
3 For BWP that are estimated in 2007, the exchange rate of BWP 8.42 to USD 1 is used.To convert BWP to USD in the current year (2013), the exchange rate of BWP 11.13 to USD1 should be used.
4 The choice of solar power to provide electricity needed for lighting around the villageand kraals at nightwas based on theBotswana government's stated commitment to devel-oping solar power. However, electricity could be provided using a gasoline-powered gen-erator, which is less expensive to install and maintain.
40 E.F. Pienaar et al. / Ecological Economics 98 (2014) 39–48

Author's personal copy
The rationale for offering solar-powered lights derives from theconservation biology literature (e.g. Breitenmoser et al., 2005;Woodroffe et al., 2005). Predators prefer to attack under the coverof darkness, so provision of light should deter livestock predationand injury to people, which in turn would improve community com-mitment to CBNRM.
The choice experiments included a detailed description of the con-servation tasks required to receive program benefits. The three taskswere anti-poaching enforcement, revegetation andwildlifemonitoring.Although CBNRM participants claim that poaching has declined,poaching statistics collected by Botswana's Department of Wildlifeand National Parks and the recent aerial survey of wildlife in northernBotswana (Chase and Landen, 2011) suggests that poaching continues.Providing community members with training in patrolling is expectedto reduce poaching (Gjertsen, 2005). Wildlife monitoring to recordthe number, type and location of wildlife in the surrounding area isneeded to assist the Department of Wildlife and National Parks, whichhas insufficient staff to accurately record wildlife stocks. Given thatrural communities lack general knowledge about wildlife, its valueand the need for wildlife management, engaging community membersin wildlife monitoring would improve their understanding of wildlifedynamics (Wainwright and Wehrmeyer, 1998). Finally, revegetationis required to attain ecological sustainability of CBNRM programs by re-versing habitat degradation.
Respondentswere told to consider each combination of CBNRMpro-grams separately, and that for the purpose of answering each question,any other CBNRM programs they might have previously seen were un-available. Respondentswere informed that if they elected not to join theCBNRM program they would not be asked to engage in conservationtasks but they would also be excluded from development benefits pro-vided by the program.
One issue of possible concern is the potential for free riding. Al-though households can readily be excluded from entering vocationaltraining programs or receiving cash transfers, the provision of lightaround the village and kraals is to some degree a public good. On onelevel this creates a moral hazard problem, in that households receive
some portion of CBNRM-funded benefits without necessarily allocatinglabor to wildlife conservation. This could, in some situations, leadhouseholds to attempt to free ride. Cultural norms within small, cohe-sive societies can play a strong role in dampening incentives to freeride (e.g. Cancino et al., 2007; Ostrom, 2000; Wilen et al., 2012),5 butwe do not have a good way to ascertain the degree to which it is occur-ring in our study. To the degree that it does occur, the clearest effect willlikely be an understatement of the value of light provision.6
In 131 instances (7% of all choice experiments), respondents choseno program. Programs that required antipoaching enforcement werethe least popular with only 37% of programs that required antipoachingenforcement being accepted by respondents. In contrast, respondentschose 45% of programs that required wildlife monitoring and 63% ofprograms that required revegetation, the least dangerous task.
3. The Estimation Framework
An estimation model is developed to explain the observed set ofchoices preferred by respondents from among the options theywere of-fered (two CBNRM programs and no program). The fact that programsvary in duration must be accounted for, and provides an opportunity
5 During pre-tests and survey implementation, we were repeatedly informed by re-spondents that time spent in activities that generate a public good was to be given freelyby village members, according to local custom. Even stronger social pressure is brought tobear when the village headman endorses a program. This is consistent with literatureshowing social norms that favor communal work result in high participation in tasks thatbenefit the community regardless of compensation regime (e.g. Kerr et al., 2012; Vatn,2009).
6 The choice experiment framework may be less susceptible to free riding than someother choice elicitation formats. While the incentive to free ride is readily seen in situa-tions where the quasi-public good is provided in isolation and a person is asked whatthey'd pay for it, itmay be less likely to occur inmulti-dimensional choiceswhere the per-son is asked which bundle they like best, not howmuch they would pay. It is not obvioushow a person would understate their willingness to pay for the quasi-public good in thiscontext. It seems unlikely they would assume the good would be provided regardless oftheir response (whichwouldmean therewould be no significance to the parameter on so-lar power, which is refuted by our empirical results).
Fig. 1. A choice experiment card.
41E.F. Pienaar et al. / Ecological Economics 98 (2014) 39–48

Author's personal copy
to estimate the personal discount rate implied by the choices.When program j is selected by household i as preferred, it conveys Yijyears of program attributes to the household (where Yij = 1, 3, 5)with the exception of business training, which provides Rij yearsof training (with Rij = 0, 0.5, 1). The selection of program j alsocommits the household to work seven days per month for Yij years inthe conservation task. This means that in choosing a program, thehousehold will have 84 ⋅Yij less days of adult time to spend on other ac-tivities over the lifetime of the program, compared to not participating.In addition, the household receives a cash payment of Cij per year for Yijyears.
Given these features of the programs that respondents consider, wedevelop the estimation model by first presenting the indirect utilityfunction for choice of a one-year program (which doesn't involvediscounting), and then explain how the choices for longer programsare modified by discounting.
3.1. Choice from Among One-Year Programs
The utility received by household i from choosing program j fromamong two one-year programs offered is
Vij ¼X
kα0k þ α1k � Dð Þ � Iijk þ γs � Sij þ γR � Rij þ λ � Ei þ Cij
� �
þ μ � Ti−Dð Þ þ εij¼ Uij þ εij; j ¼ 1;2;
ð1Þ
whereUij is the systematic part of utility and εij is a Type I extreme valueerror.
There are five terms in the utility function in the systematic part ofEq. (1), corresponding to the five elements of the CBNRM programs of-fered to respondents. Thefirst is thedisutility associatedwithworkingDdays7 in the conservation task k required by CBNRM program j, which isassumed to have two components, one time-varying and the other not.The “initial utility” α0k is the time-invariant change in household utility(positive or negative) associated with having a household memberworking in task k, while α1k is the marginal (dis)utility per day worked.The variable Iijk is an indicator (dummy) variable taking the valueIijk = 1when conservation task k is part of CBNRMprogram j, and 0 oth-erwise. We expect one or both of α0k and α1k to be negative, and theoverall effect of both to be negative, in light of the observation thatmost work is a source of disutility.
The second term on the right side of Eq. (1) is the utility part-worthassociated with the provision of solar lighting, where Sij is an indicatorvariable taking the value Sij = 1 when solar power is part of programj offered to household i, and 0 otherwise. Thus γs is the marginal utilityto the household of light provision using solar power. The third term isthe marginal utility of a year of business training, γR, times the fractionof a year it is available, Rij. The fourth term is the marginal utility ofmoney, λ, times the amount of money the household will have, whichconsists of income from other sources, Ei, plus the payment Cij fromtheCBNRMprogram. Thefinal term is the product of themarginal utilityof household time, μ, and the amount of time the household has afterparticipating in the conservation task. The latter is the difference be-tween the total adult time in the household, Ti (which for one year is365 days multiplied by the number of adults in the household) andthe number of days worked in the conservation task during that period,D (84 for a single-year decision period).
If no program is preferred, the household does not have awork com-mitment and also does not receive program benefits. In this case, utilityover the same (one-year) time period is
Vij ¼ λ � Ei þ μ � Ti þ εi0;¼ Ui0 þ εi0;
ð2Þ
where Ui0 and εi0 are the systematic and random parts of thehousehold's utility from this option.
It is useful to do two things before introducing the variation of pro-gram lengths and discounting. First is to express Eqs. (1) and (2) inerror difference form, as this simplifies the expressions to be estimatedand provides some useful interpretations of what is estimated. The sec-ond is to rewrite the error difference by pulling out the marginal utilityof money (λ) from each term, which helpsmake clear the rationale andapproach for discounting.
Since the systematic part of Eq. (2) is common to all the utilities, itcan be subtracted from each utility function without changing thechoice probabilities. The result, when terms involving days worked(D) are combined, is
ΔUij ¼X
kα0k− μ−α1kð Þ � D½ � � Iijk þ γs � Sij þ γR � Rij þ λ � Cij þ uij j ¼ 1;2
ΔUi0 ¼ 0;
where uij ≡ εij − εi0 are the differences in program and no-programerrors.
Now extracting the common term, λ, these equations become
ΔUij ¼ λ �X
k
α0k
λ− μ
λ−α1k
λ
� �� D
h i� Iijk þ
γs
λ� Sij þ
γR
λ� Rij þ Cij
oþ uij; j ¼ 1;2
n
ð3Þ
ΔUi0 ¼ 0: ð4Þ
Eq. (3) makes clear a couple of important points. First, each of theterms divided byλ is amarginalmoney value, sincemarginal utilities di-vided by themarginal utility ofmoney aremarginal money values. Thusthe term in braces is the sum of money values of all the attributes ofprogram j. Weighting this by the marginal utility of money yields themarginal utility of the program. Since all attributes have money (cashpayment) or monetary-equivalent values (marginal values of all otherprogram attributes), it is appropriate to apply discounting to all attri-butes when considering multi-year programs, not just those involvingmoney directly.
The other useful aspect of Eq. (3) is the interpretation it yields. Thefirst part of the summation term in Eq. (3) is the initial value of the con-servation task associated with program j, and the second term has theexpression (μ/λ − α1k/λ) multiplied by days.8 This second term is the“value of saving time,” a concept familiar from the transportation eco-nomics literature, and emanating from the seminal article by DeSerpa(1971). Intuitively, in this setting, it is the opportunity cost of allocatingan additional day to conservation task k, or the shadow wage. What isgiven up is themarginal value of time generally, μ/λ, and what is gainedis the marginal value of performing the task, α1k/λ. The terms γs/λ andγR/λ are the marginal values of solar lighting and business training, re-spectively. The last term in braces in Eq. (3), the cash payment, is differ-ent only in that it is the change in, rather than the level of, householdincome from choosing program j as the preferred program.
3.2. Choice from Among Multi-Year Programs
For programs that provide benefits for more than one year, the ap-propriate notion of the value of an attribute is its present value, i.e.,7 We use the general formulationD for daysworked, even though in our application it is
held constant at 84 days per year, for ease in seeing the parallel to other discrete choiceapplications involving time commitments (e.g., the household production and commutechoice literatures). The fact that D is constant does not make α0k and α1k perfectly corre-lated in our application, since they vary in different ways with household demographics.
8 With 3 choice equations and 4 parameters associated with the days worked (D) vari-able, not all of μ andα1k, k = 1,2,3 can be estimatedwithout other identifying restrictions,but their differences can be.
42 E.F. Pienaar et al. / Ecological Economics 98 (2014) 39–48

Author's personal copy
the discounted value of the sum of the flows of benefits (and costs) overtime. The value of a program is the sum of present values across all itsattributes. When the model is written in utility (or value) differenceform, the value of no program is zero, and the present value of each pro-gram is compared to this. The alternative with the highest non-negativepresent value will be chosen.
Since programs vary in both overall length andwhen benefits begin,these variations allow us to estimate the personal discount rate alongwith either the annual benefits of each attribute or (in the case of busi-ness training) the present value of training benefits to the household.The difference in what is estimated is due to the nature of the attributesthemselves.
All the attributes other than business training (solar lighting, cashpayments, and the work requirement) start in the first year of the pro-gram and last only for the duration of the program.9 Thus, they can bethought of as conveying annual benefits to the household, and the pres-ent value of annual benefits is the relevant value concept for theseattributes.
To develop the discounting expressions for these attributes, we usethe common convention that benefits to be received more than oneyear after the program commences are discounted. Benefits receivedin the first year are not discounted, so the discount factor associatedwith the annual benefit in that year is 1/(1 + r)0 = 1. For a 3-year pro-gram, the discount factor is
1þ 11þ rð Þ þ
11þ rð Þ2
and, in general, for a Y-year program, the discount factor is
11þ rð Þ0 þ…þ 1
1þ rð ÞY−1 ¼ 1þ 1r� 1− 1
1þ rð ÞY−1
� �:
The discount factor for job training is different for two reasons. First,when job training is offered as part of a program, it does not occur everyyear; instead, it is a session of zero, six, or 12 months that is offered tothe household once during the lifetime of a program. Second, it conveysbenefits that may last beyond the duration of the program, since it is aninvestment in human capital. These two features mean that when therespondent evaluates a programwhich contains training, s/he is consid-ering that the training session will occur at some point during multi-year programs, and that its value to the household when the choiceamong programs is made (i.e., before they begin) is the present valueof benefits which the training will provide.
It is not possible to assess the annual benefits from training to ahousehold receiving training, since the lifetime over which trainingbenefits are received is unknown. This is not amajor hindrance, howev-er, since it is possible to estimate directly the present value of the train-ing session from the point at which training starts, and this is therelevant value for the choice among ICD programs. The only issue tobe dealt with in multi-year ICD programs is when the training starts.All else equal, business training which occurs later in a multi-year pro-gram is worth less because of a greater delay in receiving the benefitsfrom training.
Since the training session could occur at any point during a 3- or 5-year program, we assume that, on average, respondents expect trainingto occur during themiddle year of the program. The discount factors as-sociated with the present value of training benefits for each of theseprogram lengths are 1/(1 + r) and 1/(1 + r)2, respectively, and thedis-count factor for the middle year of a Y-year program is 1
1þrð ÞY−12.
Combining the above discount terms with Eq. (3), the discountedutility difference for program j lasting Yij years and offering Rij years oftraining to household i is
ΔUij ¼ A � 1þ 1r� 1− 1
1þ rð ÞYij−1
� �� �þ γR � Rij
1þ rð ÞYij−1
2
þ uij ; j ¼ 1;2
ð5Þ
where
A ¼X
kα0k− μ−α1kð Þ � D½ � � Iijk þ γs � Sij þ λ � Cij
is the sum of annual utility flows from the work requirement, solarlighting provision, and cash payments; and γR ⋅ Rij is the present valueof training benefits for a period of Rij years (with Rij = 0, 0.5, 1) duringthe program. The other alternative, choosing no program, has utility dif-ference
ΔUi0 ¼ 0 ð6Þ
With Type I extreme value errors, the choice probabilities that followfrom Eqs. (5) and (6) are
Pr program 1 preferred by household ið Þ ¼ eΔUi1
1þ eΔUi1 þ eΔUi2
Pr program 2 preferred by household ið Þ ¼ eΔUi2
1þ eΔUi1 þ eΔUi2
Pr no program preferred by household ið Þ ¼ 11þeΔUi1þeΔUi2
.
Denoting these probabilities as Pi1,Pi2, and Pi0 respectively, the log-likelihood of observing the sample pattern of choice experimentresponses is
log−L ¼Xi
Hi0 � Pi0 þ Hi1 � Pi1 þ Hi2 � Pi2 ð7Þ
whereHij is an indicator variable taking the value 1when program jwasoffered to household i, and 0 otherwise.
4. Data
Summary statistics for the categorical variables used in the modelestimation are presented in Table 1. In total 305 females (61% of respon-dents) and 194 males (39%) were surveyed.10 The number of membersper Trust varied from 24 (Sankuyo TshwaraganoManagement Trust) to179 (Chobe Enclave Conservation Trust). Questions about effortexpended on agriculture and crop and livestock protection indicatedthat 63% of households kraaled their livestock at night and approxi-mately 31% of households protected their fields by scaring away croppests. Themajority of respondents (78%) felt that there are toomany el-ephants, one of thewildlife species that are considered by villagers to bethe biggest pests in terms of crop raiding, property damage and threatsto human safety.
Summaries of characteristics of the wildlife conservation manage-ment programs, and of households, are contained in Table 2. Theamount of conservationwork (Dij) requested in return for developmentbenefits ranged from 84 to 420 days in total (one to five years), with amedian of three years for anti-poaching enforcement and revegetationand amedian of five years for wildlifemonitoring. Half the conservationprograms offered solar-powered light provision and, on average,
9 It seems reasonable to believe that respondents expected this to be true of the provi-sion of solar lighting aswell as cash payments and thework requirement. Individual inter-views in pretesting suggested that often when development projects provideinfrastructure (such as solar lighting provision would), inadequate provision for ongoingmaintenancemeans thatwhen the program ends, the benefits from the infrastructure alsoend.
10 Females were oversampled relative to their overall proportion (55%) in surveyedhouseholds because more women tended to be at home during the day. To correct forover-sampling of females, which we detected after surveying the Molema and Chobe En-clave Conservation Trusts, enumerators were instructed to interview adults whowere thesame gender as the household head if the household head was not available.
43E.F. Pienaar et al. / Ecological Economics 98 (2014) 39–48

Author's personal copy
programs offered six months of training. The median annual cash pay-ment offered for anti-poaching enforcement and wildlife monitoringwas BWP 600, whereas for revegetation programs the mean was BWP1200. The total cash payment offered (taking both the annual cash pay-ment and duration of the program into account) averaged BWP1104 foranti-poaching enforcement, BWP 3534 for revegetation and BWP 2440for wildlife monitoring. The median age of respondents was 36 yearsand median education attained was 7 years. On average, male adultsaccounted for 28% of the household and female adults accounted for33% of the household. The median gross annual income for the house-hold was BWP 10,780 (US$ 1281) and the median annual time endow-ment for the household was 1095 days. The median and mean cattleherd sizes were zero and 9.3 respectively.
5. Results
Results of maximizing the likelihood function in Eq. (7) with Gaussversion 10.0 are presented in Table 3. We estimated a fixed-parameters logit model with a large number of covariates that provideexplanation for variation in choice experiment responses in terms ofthe observable characteristics of respondents. Because the preponder-ance of these covariates is demographic, and there is no theory aboutexpected signs, a model-reduction strategy to minimize the correctedAikake Information Criterion (AICc) was used in developing the modelpresented in Table 3. A separate, “full” model, with 66 covariates andproviding a lot of flexibility to represent individual response patterns,is not reported for the sake of space.11
Each of the principal elements of the choice experiments model wasallowed to varywith covariates, c, Thus, the initial utility of conservationtasks is α0(c), with α0k(c) for task k, with k representing revegetation,wildlife monitoring, and anti-poaching patrols; similarly, the time-varying utility of a conservation task is denoted α1(c), with α1k(c) asso-ciated with each conservation task. Specific elements of α0 and α1 thatwere significant in estimation are listed under each of these headingsin Table 3. The covariates pertaining to the marginal utility of solar-powered lighting, vocational training, and household time are givenby γS(c),γR(c), and μ(c), respectively, while the marginal utility ofmoney (λ) and the personal discount rate (r) were estimated asconstants.
As noted earlier, theory does not provide strong guidance about theexpected signs of some individual parameters. This is especially true ofthe utility of working, which has both time-invariant [α0(c)] and time-
variant [α1(c)] components and numerous interaction terms. In othercases, though, one can form reasonable expectations for individual pa-rameters and for functions of parameters. The combined effects of allterms in the utility of working would generally be expected to be nega-tive, particularly for conservation tasks that are perceived as dangerousor require manual labor. Thus wewould expect that the utilities of anti-poaching patrols andwildlifemanagementwould be lower than that forrevegetation, a common activity in many villages that often providesauxiliary benefits such as non-timber forest products for householduse, forage for livestock, and the like. The combined effects of the pa-rameters related to provision of lighting and of business trainingwould be expected to be positive, as well as the marginal utilities oftime and money and the personal discount rate.
Interpreting individual parameters, for both revegetation and anti-poaching enforcement, the constant term for the initial utility of thetask is positive and statistically significant at the one percent level.The initial utility of wildlife monitoring is increasing in household in-come. The initial value of revegetation and anti-poaching enforcementis lower for respondentswho believe that there are toomany elephants,which is consistent with the fact that these tasks may bring villagersinto contact or conflict with elephants.
As noted above, the value of saving time in the conservation task de-pends on the difference μ − α1k. The estimates in Table 3 imply that thevalue of saving time increases with the share of female adults in thehousehold, and for anti-poaching enforcement and wildlife monitoring,it increases in respondents' age. This is consistentwith the fact that bothanti-poaching enforcement and wildlife monitoring require staminaand a certain degree of literacy, and are considered to be dangeroustasks, more suited to younger, able-bodied men than to either womenor older individuals. In contrast, revegetation is considered suitable forboth men and women. Households that kraal their livestock at nightto protect them from predators place higher value on not allocatingtime to any of the three conservation tasks. Respondents who scareaway crop pests from their fields to protect their crops place highervalue on saving time in revegetation, although this result is only signif-icant at the 10% level. Across several Trusts the value of time saved tendsto be lower for revegetation and higher for anti-poaching enforcementand wildlife monitoring. This is consistent with the fact that revegeta-tion is considered to be a less dangerous task that may be undertakenby both men and women.
The value of light provision is higher for householdswith cattle, whowould benefit from reduced livestock predation, and formembers of theOkavango Community Trust. The value of vocational training is higherfor people with more education; presumably, these individuals would
11 Thismodelwas qualitatively very similar to the one reported in Table 3, andhad only amodestly-smaller likelihood function value, despite having more than twice as many co-variates as the minimum-AICc model reported in Table 3. The model is available uponrequest.
Table 2Characteristics of wildlife conservation programs and households.
Median Mean Min Max
Wildlife conservation program characteristicsProgram length (years) 3 3.2 1 5Solar power (yes or no) 0 0.5 0 1Training (months) 6 6.8 0 12Annual cash payment(total Pula per household)a
600 675.15 0 1200
Household characteristicsAge of respondent (years) 36 39.5 15 95Education (years) 7 5.9 0 17Annual Household time endowmentin days (T)
1095 1337 365 5475
Annual Household income inBWP (M)
10,780 21,513 0 184,580
Male adults as a proportion ofhousehold size
0.25 0.28 0 1
Female adults as a proportion ofhousehold size
0.33 0.33 0 1
Cattle herd size 0 9.3 0 200
a BWPvalues are for 2007, theyear inwhich the choice experimentswere implemented.The 2007 exchange rate is BWP 8.42 to USD 1.
Table 1Summary of categorical variables.
Variable Number Percentage
Gender of respondentFemale 305 61.1Male 194 38.9
Distribution of respondents by trustMolema Trust (MT) 59 11.8Chobe Enclave Conservation Trust (CECT) 179 35.9Okavango Community Trust (OCT) 143 28.7Nqwaa Khobe Xeya Trust (NKXT) 94 18.8Sankuyo Tshwaragano Management Trust (STMT) 24 4.8
Crop and livestock protection measuresKraal livestock at night 313 62.7Scare away crop pests 153 30.7
Opinions about wildlifeAgreed that “There are too many elephants” 387 77.6
44 E.F. Pienaar et al. / Ecological Economics 98 (2014) 39–48

Author's personal copy
be more able to fully utilize this additional training to obtain employ-ment. Female respondents and respondents from households with ahigher share ofmale adults also placed higher value on vocational train-ing. In debriefing after surveying households, multiple female respon-dents noted that they would send male members of the household tothe vocational training program, in order to increase the earning poten-tial of the household — a comment that is consistent with these modelresults. In contrast to light provision, the marginal value of vocationaltraining is lower for the Okavango Community Trust, a relatively isolat-ed Trust with reduced opportunities for household members to utilizetraining without relocating away from the Trust to regional centers.
The marginal utility of money and the personal discount rate areboth highly significant and positive, as expected. The discount rate isconsiderably higher than market rates, at about 42%, but this is consis-tent with a fairly broad set of findings from studies that have jointly es-timated the discount rate as part of a larger model (e.g., Harrison et al.,2002). Additionally, this value is not unreasonable especially in the ruralregions of Botswana. First, the HIV/AIDS epidemic has undermined thesocial safety net, decreased lifespans, and increased the need to obtaincash and development benefits in the short term. Second, given the
poor performance of CBNRM programs in the past, or their tendencyto perform well for only short periods of time, respondents may haveplaced greater weight on immediate benefits.
6. Estimated Values of Conservation Program Attributes
The two marginal values relating to the conservation tasks are theinitial value of the job,
Initial Value of Conservation Task IVikð Þ ¼ α0k cð Þλ
ð8Þ
and the value of time saved,
Value of Time Saved VTSikð Þ ¼ μ cð Þ−α1k cð Þλ
; ð9Þ
where the dependence of parameters on demographics c is made ex-plicit. The initial value is a lump-sum value, while the value of timesaved is a per-day value. The marginal values of training and solar-powered lighting, which are per-day and lump sum, respectively, are
Marginal Value of Business Training VBTið Þ ¼ γR cð Þλ
ð10Þ
and
Value of Solar Lighting VSLið Þ ¼ γS cð Þλ
: ð11Þ
Another useful concept for program design is the “reservation cashpayment,” i.e., the magnitude of the cash payment to households thatleaves them indifferent between accepting or rejecting a program.This is obtained by setting the utility difference in Eq. (5) to zero andsolving for the cash payment. The reservation cash payment varieswith program attributes, and is counterfactual, since in general it willdiffer from the actual cash payment levels offered to households aspart of the programs they evaluate. It is useful for at least two reasons.First, the difference between the actual cash payment in a programand the reservation payment is the net monetary benefit, or consumer'ssurplus, associatedwith the program.12 Second, it can be a guide to pro-grammodification, since a larger cash payment will increase the utilityof a program to the household, and therefore increase its acceptability.
Because the vocational training attribute differs from the other attri-butes, being offered to the household once rather than annually,discounting of multi-year programs tends to obscure the essential rela-tionships involved with the reservation cash payment (RCP). For sim-plicity, we present results for a 1-year CBNRM program i.e, for Yij = 1,as discounting does not play a role. Multi-year programs can also be an-alyzed in a straightforward way, using Eq. (5) with Yij N 1.
For the case of a 1-year program, setting the left hand side of Eq. (5)equal to zero and solving for the money attribute,
Reservation Cash Payment ¼ −X
k
α0k
λ− μ−α1k
λ� D
� �� Iijk−
γS
λ� Sij−
γR
λ� Rij
ð12Þ
or, substituting Eqs. (8)–(11) into (12), the reservation cash paymentcan be expressed as a function of the marginal benefits (and costs) ofattributes, as
Reservation Cash Payment ¼ −X
kIVik−VTSik � Dð Þ � Iijk−VSPi � Sij−VBTi � Rij
If the reservation cash payment is less than the actual payment of-fered, the program generates positive utility to the respondent, and if itis greater, the program generates negative utility (and will be rejected).
12 More technically, it is the compensating variation, or exact (utility-constant) con-sumer's surplus, associated with the program.
Table 3Parameter estimates for the choice experiment model.
Parameter Estimate S.E. Est./S.E.
Initial utility of conservation task (α0)Revegetation 0.1231 0.0338 3.641⁎⁎⁎
Anti-poaching 0.2610 0.0611 4.264⁎⁎⁎
Wildlife monitoring 0.0478 0.0321 1.491Wildlife monitoring × income/1000 0.0461 0.0201 2.294⁎⁎
Revegetation × too many elephants −0.1552 0.0284 −5.470⁎⁎⁎
Anti-poaching × too many elephants −0.0933 0.0451 −2.065⁎⁎
Time-varying utility of conservation task (α1)Anti-poaching × age −0.0204 0.0071 −2.857⁎⁎⁎
Wildlife monitoring × age −0.0091 0.0051 −1.785⁎
Revegetation × scare away crop pests −0.0435 0.0223 −1.953⁎
Revegetation × kraal livestock −0.0444 0.0202 −2.194⁎⁎
Anti-poaching × kraal livestock −0.0581 0.0243 −2.382⁎⁎
Wildlife monitoring × kraal livestock −0.0394 0.0159 −2.481⁎⁎
Revegetation × CECT 0.0990 0.0282 3.506⁎⁎⁎
Revegetation × OCT 0.0982 0.0322 3.046⁎⁎⁎
Revegetation × STMT 0.1436 0.0499 2.874⁎⁎⁎
Anti-poaching × OCT −0.1322 0.0333 −3.966⁎⁎⁎
Anti-poaching × NKXT −0.1128 0.0560 −2.014⁎⁎
Anti-poaching × STMT −0.1050 0.0528 −1.987⁎⁎
Wildlife monitoring × OCT −0.0645 0.0192 −3.364⁎⁎⁎
Utility of light provision (γS)Solar lighting 0.0867 0.0094 9.171⁎⁎⁎
Solar lighting × cattle 0.1103 0.0372 2.965⁎⁎⁎
Solar lighting × OCT 0.0329 0.0173 1.894⁎
Utility of vocational training (γR)Training 0.0511 0.0250 2.046⁎⁎
Training × gender 0.0372 0.0163 2.283⁎⁎
Training × education 0.0805 0.0162 4.955⁎⁎⁎
Training × proportion male adults 0.1034 0.0317 3.257⁎⁎⁎
Training × OCT −0.0416 0.0165 −2.528⁎⁎
Marginal utility of time (μ)Household time × gender 0.0001 0.0002 0.361Household time × education −0.0002 0.0002 −1.108Household time × proportion female adults 0.0014 0.0004 3.152⁎⁎⁎
Household time × proportion male adults 0.0006 0.0004 1.646⁎
Marginal utility of money (λ)Cash payment 0.0145 0.0012 12.447⁎⁎⁎
Personal discount rate (r) 0.4201 0.0867 4.843⁎⁎⁎
Mean log-likelihood −1609.83AIC 3285.66AICc 3290.48BIC 3424.67
⁎ Denote significance at the 10% significance level (two-tailed test).⁎⁎ Denote significance at the 5% significance level (two-tailed test).⁎⁎⁎ Denote significance at the 1% significance level (two-tailed test).
45E.F. Pienaar et al. / Ecological Economics 98 (2014) 39–48

Author's personal copy
Themedian andmean are both useful benchmarks for the reservationcash payment, as different ways to look at the “average” person beingsatisfied with the ICD program. The median reservation cash paymentis the amount thatwill make amajority of people better off with the pro-gram than without. The mean reservation cash payment, in contrast, isthe average of cash payments thatmake people indifferent between hav-ing and not having the program. Provision of the mean reservation cashpayment to all does not assure majority support, however.
Table 4 presents results on the marginal values of CBNRM programattributes (reported in 2013 BWP values). Across all three conservationtasks the median initial value of the task is approximately BWP 6.08,suggesting a small one-time increase in utility from having work. Forboth anti-poaching enforcement and wildlife monitoring, the medianinitial value of the task is positive, but for revegetation it is slightlynegative.
The initial values provide only part of the picture regarding the valueof working; every conservation task also has a days-worked require-ment with an associated value of saving time. For anti-poaching en-forcement and wildlife monitoring, the value of saving time ispositive, meaning that every additional day worked in these tasks gen-erates negative value. The net effect is that when householdsmust allo-cate labor to anti-poaching enforcement or wildlife monitoring, theyplace positive overall value on the tasks for only a short duration (oneday at most). Given that households are required to allocate 84 daysper year to these conservation tasks, they place negative value onanti-poaching enforcement and wildlife monitoring.
Interestingly, the opposite holds true for revegetation, for which thevalue of time saved is negative. The implication is that households pre-fer to spend more time in revegetation, the least dangerous task that issuited to both men and women, and also provides forage for livestockand non-timber forest products for household use. If households haveconsiderable free time then it is conceivable that they would prefer tobe engaged in a task rather than remaining idle, provided that it is notdangerous.
Households have a higher value of time saved in anti-poaching en-forcement than in wildlife monitoring, which is sensible. Althoughboth tasks are generally considered to be dangerous because of poten-tial contact with wildlife, anti-poaching enforcement may also resultin conflict with poachers, who may be Trust members or armed.
The median and mean value of solar lighting is positive. Themedianvalue of light provision is approximately BWP 10.10, or US$ 0.91 per
day. Extrapolated to an annual value, the median value of solar lightingis BWP3685. Themediandaily value of vocational training is about BWP16.60, which translates to BWP 2166 (US$ 195) and BWP 4332 (US$389) for 6-month and 1-year programs, respectively (with training of-fered five days per week).13 The higher value placed on business train-ing likely reflects the need for vocational training within thecommunities, as well as expectations of increased long-term incomeearning potential as a result of skills gained. By contrast, solar-powered light provision is a quasi-public good that would be providedfor the duration of the program (up to 5 years) and would providegreatest benefit to livestock owners.
Given themagnitude of the positive values placed on solar-poweredlight provision and vocational training, the estimated reservation cashpayments are negative for all respondents, with a median of approxi-mately BWP 18 (US$ 1.59) per day. This is consistent with the factthat the no-program option was chosen in only 7% of the choice exper-iments. In principle, this means that even with lower cash paymentsthan we offered respondents, they would choose a CBNRM programover having no program.
7. Policy Implications and Concluding Comments
This paper develops and estimates a framework for evaluating inte-grated conservation anddevelopment (ICD) projects from choice exper-iments conducted with the prospective beneficiaries of such projects.Based on a utility maximization framework with personal discountingof programs lasting more than a year in duration, we show how thevalues of individual program attributes can be assessed, including themagnitudes of cash payments that are commonly made as part of ICDprograms. Provision of cash benefits is themost fungible of program at-tributes, and can be used in the design of programs to ensure their sup-port politically or within a benefit-cost rubric.
In our study of Botswana's ICDprogram,we investigate how the pro-vision of development benefits can be used to directly foster communityengagement in wildlife conservation. Our results suggest that develop-ment programs can encourage households to undertake conservationtasks that reduce human-wildlife conflict even if such work is not
Table 4Values of conservation program attributes (2013 BWP).
Program attribute Median Mean Std dev Min Max
Value of solar lightingDaily value 10.10a 11.13 2.85 8.96 31.76Annual value 3685 4063 1037 3269 11,592
Value of vocational trainingDaily value 16.61 16.33 4.64 2.32 28.73Value of 6-month program 2166 2129 605 301 3745Value of 12-month program 4332 4258 1210 604 7492
Initial value of conservation task 6.08 8.33 9.02 −3.31 26.98Revegetation −3.31 0.81 7.03 −3.31 12.73Anti-poaching enforcement 17.33 19.61 4.10 17.33 26.98Wildlife monitoring 5.54 6.08 1.44 4.94 13.72
Value of time saved (daily values) 5.66 6.08 8.45 −12.45 31.08Revegetation −4.64 −2.68 4.52 −12.45 7.70Anti-poaching enforcement 15.04 15.15 5.81 3.06 31.08Wildlife monitoring 6.55 6.85 3.18 1.38 15.56
Value of time saved (annual values) 476 511 710 −1046 2611Revegetation −389 −225 381 −1046 646Anti-poaching enforcement 1263 1272 488 256 2611Wildlife monitoring 550 575 267 115 1308
Reservation cash payment (daily values) −17.66 −17.81 4.63 −44.09 −5.30Revegetation −18.79 −18.91 4.34 −44.09 −9.59Anti-poaching enforcement −16.24 −16.58 4.76 −42.75 −5.30Wildlife monitoring −17.66 −17.71 4.49 −38.08 −7.01
a BWP values were inflated from 2007 to 2013 estimates using inflation rates published by the Bank of Botswana (http://www.bankofbotswana.bw/indicators).
13 When the annual values of solar-powered lighting and vocational training are esti-mated in 2007 Pula they account for 23% and 27% of 2007 median household incomerespectively.
46 E.F. Pienaar et al. / Ecological Economics 98 (2014) 39–48
Author's personal copy
directly paid. This is an important policy goal in countrieswherewildlifeis a valuable source of revenue and where wildlife cause substantialdamages to crops, livestock and property.
To help demonstrate this point, we focus on the value rural house-holds place on provision of a quasi-public good, light provision aroundlivestock kraals and village common areas, and a private good, vocation-al training. In exchange for these goods, we include a work requirementin conservation-related activities, which can help close the loop be-tween benefits received from wildlife-based tourism and the necessarycosts that must be incurred in terms of living with and managing wild-life. A final element of our choice experiments is cash payments tohouseholds, which is a relatively common feature of ICD programsand which can be easily tailored for policy purposes. The choice exper-iment approach is flexible, convenient, easy to apply, and has a rigorouswelfare-theoretic foundation for evaluation of otherwise hard-to-measure benefits of village development projects. In addition, becausewe ask about programs lastingmultiple years, we have the opportunityto assess the personal discount rates of rural villagers in Botswana. Wefind that the personal discount rate averages 42%, which is consistentwith the low incomes in rural villages, the failure of social securitynets owing to the HIV/AIDS epidemic and the inconsistent performanceof Botswana's CBNRM program in the past.
We find that themedian value of light provision is about BWP10 perday, which is equivalent to BWP 3685 per year. Similarly, the medianvalue of vocational training is about BWP 17 per day, or BWP 4332 peryear. Although the initial value of both anti-poaching enforcement andwildlife monitoring is positive (BWP 17 and BWP 6 respectively), forboth tasks the annual value of time saved (BWP 1263 and BWP 550) ex-ceeds the initial value of the job, meaning that working in these twotasks generates disutility to the household. For revegetation the valueof time saved is negative (BWP 389 annually), which implies thathouseholds would prefer to spend more time in this task rather thandoing nothing, especially since revegetation provides increased foragefor livestock and non-timber forest products for household use. Acrosstasks, community members value the provision of light and vocationaltraining programs sufficiently to bewilling to engage inwildlife conser-vation tasks with no additional financial compensation. Hence, the res-ervation cash payment across tasks is negative.
The inclusion of cash payments and labor provision in choice exper-iments, to the extent they fit into the context of the study, provides par-ticularly useful insights into concepts that can be hard to get atotherwise. First, it permits the monetization of utility changes, so thatthe monetary values of both individual attributes and entire programscan be determined, both at the level of individual households and forentire communities. Second, in combination with the labor attribute, itprovides direct estimates of a household's shadow wage, which is typi-cally the concept needed when asking how households change theirtime allocations among activities.
Thus the approach we develop and implement may providepolicymakerswith a useful and flexible quantitative technique formea-suring the value community members place on specific, counterfactual,development programs, and also to determine how these programs caninduce individual village members to provide in-kind labor contribu-tions. The approach may be applied more generally to identify whatpublic policies community members value, by how much, and howthey can be partially funded by contributions in kind, such as throughlabor contributions.
Finally, the framework can also be used to assess the questionof whether specific public projects should be undertaken. Since itproduces estimates of household-specific net benefit (i.e., consumer'ssurplus) for a given project, the estimates can be summed across house-holds to obtain the total community valuation of the project. Thiscan then be compared to the implementation costs to determinewheth-er the project should move forward. In short, our analysis may beadapted to determine which development programs are most highlyvalued by members of rural communities, the communities as a
whole, and more broadly, whether ICD programs are cost-benefitjustified.
It is important also to acknowledge a number of limitations of ourwork, some of which suggest directions for further research. First isthe fact that while we suggest an approach to evaluate whether pro-spective ICD programs are likely to incentivize wildlife conservation ef-forts, we do not address issues of implementation, such as how toensure performance of promises to supply conservation effort.
Second, free-riding may affect our estimates of the benefits of solarlight provision in village common areas, which is a quasi-public good.To the extent it is present, free riding will cause an understatement ofresidents' actual valuation of light provision.
Third, we assume the same personal discount rate applies for cashpayments and other attributes of the programs. An extension of theanalysis would allow these to differ by attribute or category of attribute.While our estimation model has considerable flexibility due to the in-clusion of a large number of covariates, it is a relatively simple fixed-parameters logit. An alternative would be to use a random-parametersframework, though this could come at a cost of less clarity about whatis causing the response patterns we observe.
Acknowledgments
The authors would like to thank the CBNRM Support Programme,IUCN Botswana and the Botswana Institute for Development PolicyAnalysis for their assistance during field research. We also benefitedfrom helpful and constructive comments by two anonymous reviewers,for which we are grateful. Any errors are solely our own.
References
Addelman, S., 1962. Orthogonal main-effect plans for asymmetrical factorial experiments.Technometrics 4, 21–46.
Bennet, J., Birol, E., 2010. Concluding remarks and recommendations for implementingchoice experiments in developing countries. In: Bennet, J., Birol, E. (Eds.), Choice Ex-periments in Developing Countries: Implementation. Challenges and Policy Implica-tions. Edward Elgar, Cheltenham, pp. 297–306.
Breitenmoser, U., Angst, C., Landry, J., Breitenmoser-Würsten, C., Linnell, J.D.C., Weber, J.,2005. Non-lethal techniques for reducing depredation. In: Woodroffe, R., Thirgood,S., Rabinowitz, A. (Eds.), People and Wildlife: Conflict or Co-existence? CambridgeUniversity Press, Cambridge, pp. 46–71.
Cancino, J.P., Uchida, H., Wilen, J.E., 2007. TURFs and ITQs: collective vs. individual deci-sion making. Mar. Resour. Econ. 22, 391–406.
Chase, M., Landen, K., 2011. View from the top. Afr. Geogr. 19, 39–47.DeSerpa, A.C., 1971. A theory of the economics of time. Econ. J. 81, 828–846.Gjertsen, H., 2005. Can habitat protection lead to improvements in human well-being?
Evidence from marine protected areas in the Philippines. World Dev. 33, 199–217.Government of Botswana, 2011. Preliminary Results of the Botswana Core
Welfare Indicators (Poverty) Survey 2009/10, Statistics Botswana, Gaboroneavailable at: http://www.cso.gov.bw/templates/cso/file/File/BCWIS%20_Poverty_%20Survey%20Statsbrief%20Nov%202011.pdf.
Harrison, G.W., Lau, M.I., Williams, M.B., 2002. Estimating individual discount rates inDenmark: a field experiment. Am. Econ. Rev. 92, 1606–1617.
Kanapaux, W., Child, B., 2011. Livelihood activities in a Namibian wildlife conservancy: acase study of variation within a CBNRM programme. Oryx 45, 365–372.
Kerr, J., Vardhan, M., Jindal, R., 2012. Prosocial behavior and incentives: evidence fromfield experiments in rural Mexico and Tanzania. Ecol. Econ. 73, 220–227.
Lepper, C.M., Schroenn Goebel, J., 2010. Community-based natural resource management,poverty alleviation and livelihood diversification: a case study from northernBotswana. Dev. South. Afr. 27, 725–739.
Musumali, M.M., Larsen, T.S., Kaltenborn, B.P., 2007. An impasse in community based nat-ural resource management implementation: the case of Zambia and Botswana. Oryx41, 306–313.
Ostrom, E., 2000. Collective action and the evolution of social norms. J. Econ. Perspect. 14,137–158.
Pienaar, E.F., Kerapeletswe, C., 2005. Community-based wildlife management inBotswana: challenges and outcomes. UC Davis Int. Aff. J. 2, 50–56.
Pienaar, E.F., Jarvis, L.S., Larson, D.M., 2013. Creating direct incentives for wildlife conser-vation in community-based natural resource management programs in Botswana.J. Dev. Stud. 49, 313–331.
Sammy, J., Opio, C., 2005. Problems and prospects for conservation and indigenous com-munity development in rural Botswana. Dev. South. Afr. 22, 67–85.
Scanlon, L.J., Kull, C.A., 2009. Untangling the links between wildlife benefits andcommunity-based conservation at Torra Conservancy, Namibia. Dev. South. Afr. 26,75–93.
Swatuk, L.A., 2005. From “project” to “context”: community based natural resource man-agement in Botswana. Glob. Environ. Polit. 5, 95–124.
47E.F. Pienaar et al. / Ecological Economics 98 (2014) 39–48

Author's personal copy
Vanderpost, C., 2006. Pathways of human sprawl in wilderness buffer zones. Popul. Envi-ron. 27, 285–306.
Vatn, A., 2009. Cooperative behavior and institutions. J. Socio-Econ. 38, 188–196.Wainwright, C., Wehrmeyer, W., 1998. Success in integrating conservation and develop-
ment? A study from Zambia. World Dev. 26, 933–944.
Wilen, J.E., Cancino, J., Uchida, H., 2012. The economics of territorial use rights fisheries, orTURFs. Rev. Environ. Econ. Policy 6, 237–257.
Woodroffe, R., Thirgood, S., Rabinowitz, A., 2005. The impact of human-wildlife conflict onnatural systems. In: Woodroffe, R., Thirgood, S., Rabinowitz, A. (Eds.), People andWildlife: Conflict or Co-existence? Cambridge University Press, Cambridge, pp. 1–12.
48 E.F. Pienaar et al. / Ecological Economics 98 (2014) 39–48
Related Documents