Ken Sprankle Connecticut River Coordinator U. S. Fish and Wildlife Service Connecticut River Coordinator’s Office

USFWS Ken Sprankle CT River diadromous restoration Jan 2015
Jul 15, 2015
Welcome message from author
This document is posted to help you gain knowledge. Please leave a comment to let me know what you think about it! Share it to your friends and learn new things together.
Transcript
Ken Sprankle Connecticut River Coordinator
U. S. Fish and Wildlife ServiceConnecticut River Coordinator’s Office

Commission = Agency Directors and Public Representatives (Policy)Technical Committee = Senior Biologists (Implementation)
Agency cooperative restoration work started on watershed scale in 1967CRASC created in 1983

American shad
Alewife
Blueback herring
Hickory shad
Gizzard shad
Diadromous Fishes
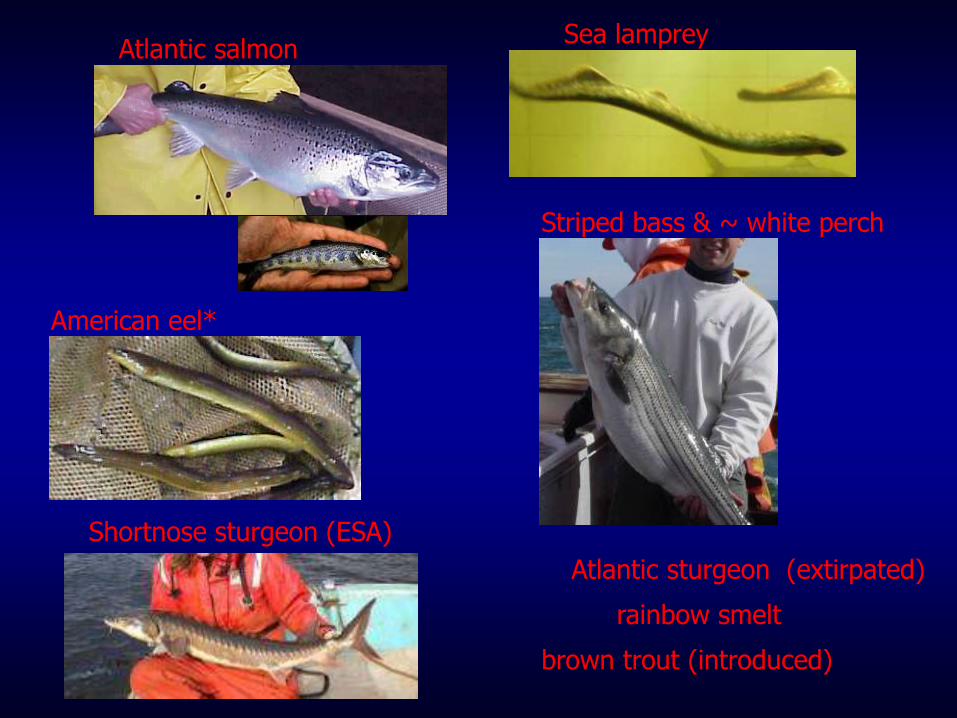
Atlantic salmon
American eel*
Atlantic sturgeon (extirpated)
Sea lamprey
Striped bass & ~ white perch
brown trout (introduced)
Shortnose sturgeon (ESA)
rainbow smelt
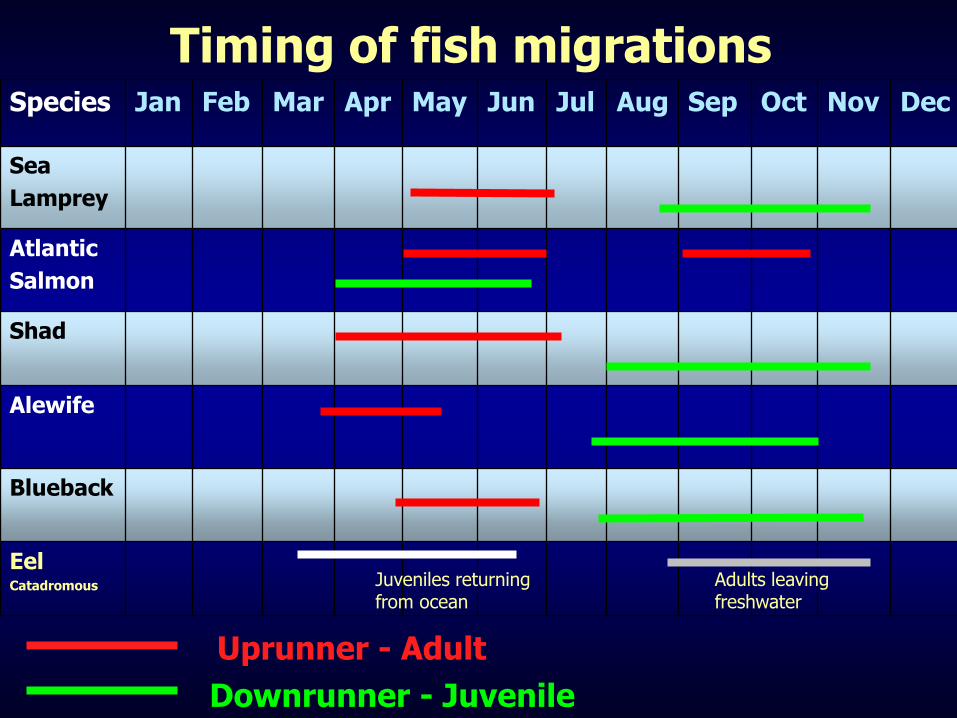
Timing of fish migrationsSpecies Jan Feb Mar Apr May Jun Jul Aug Sep Oct Nov Dec
Sea
Lamprey
Atlantic
Salmon
Shad
Alewife
Blueback
EelCatadromous
Uprunner - Adult
Downrunner - Juvenile
Juveniles returning from ocean
Adults leaving freshwater

American shadN
um
be
r P
asse
d
Ho
lyo
ke
Fis
h L
ift
0
200x103
400x103
600x103
800x103
Atlantic salmon
Nu
mb
er
Co
un
ted
(Ba
sin
To
tal)
0
100
200
300
400
500
600
Blueback herring
Nu
mb
er
Pa
sse
dH
oly
oke
Fis
h L
ift
0
200x103
400x103
600x103
800x103
Connecticut River Fish Counts 1967-2014
Year
1970 1980 1990 2000 2010
0
20x103
40x103
60x103
80x103
100x103
120x103
Nu
mb
er
Pa
sse
dH
oly
oke
Fis
h L
ift Sea lamprey
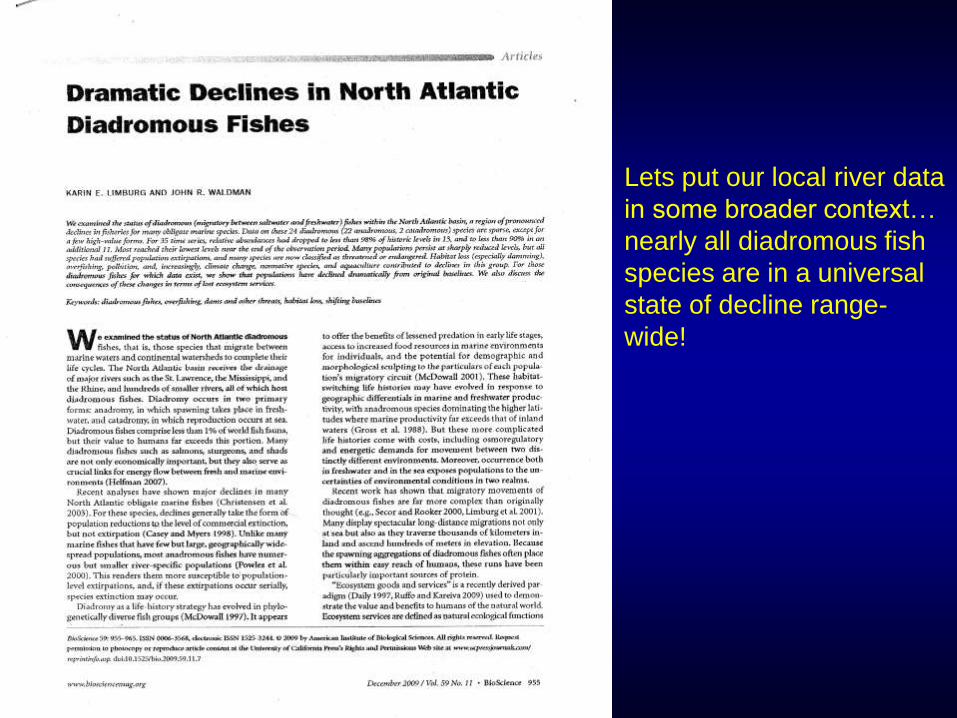
Lets put our local river data
in some broader context…
nearly all diadromous fish
species are in a universal
state of decline range-
wide!

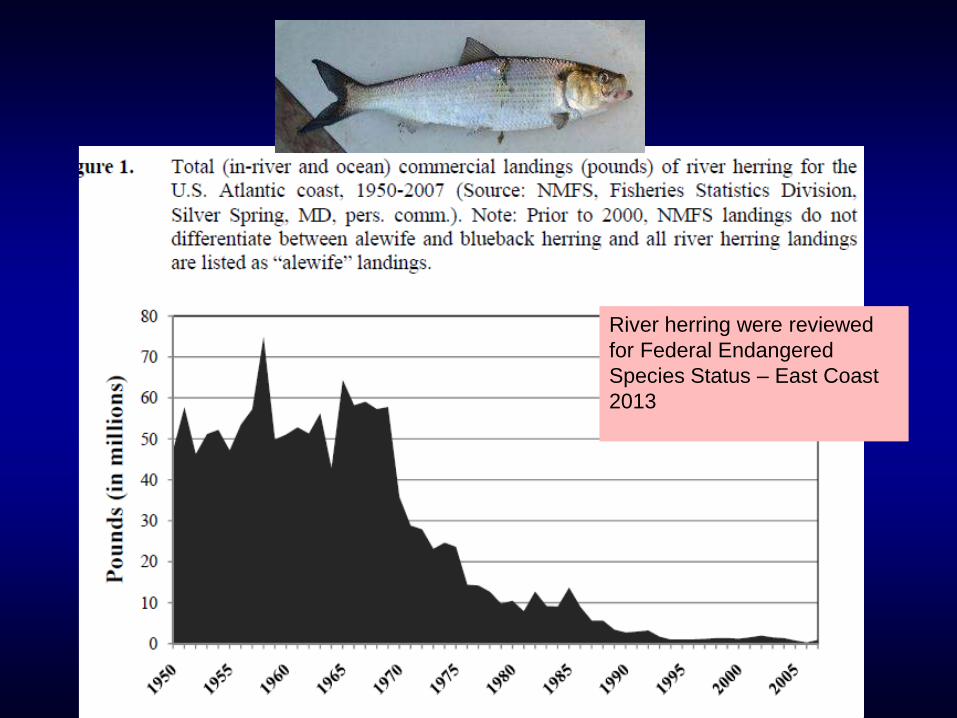
River herring were reviewed
for Federal Endangered
Species Status – East Coast
2013

What does USFWS Fisheries Do?
With Partners…
• Population assessments: species status and trends
• Fish passage: Manhan River Ladder, ongoing guidance
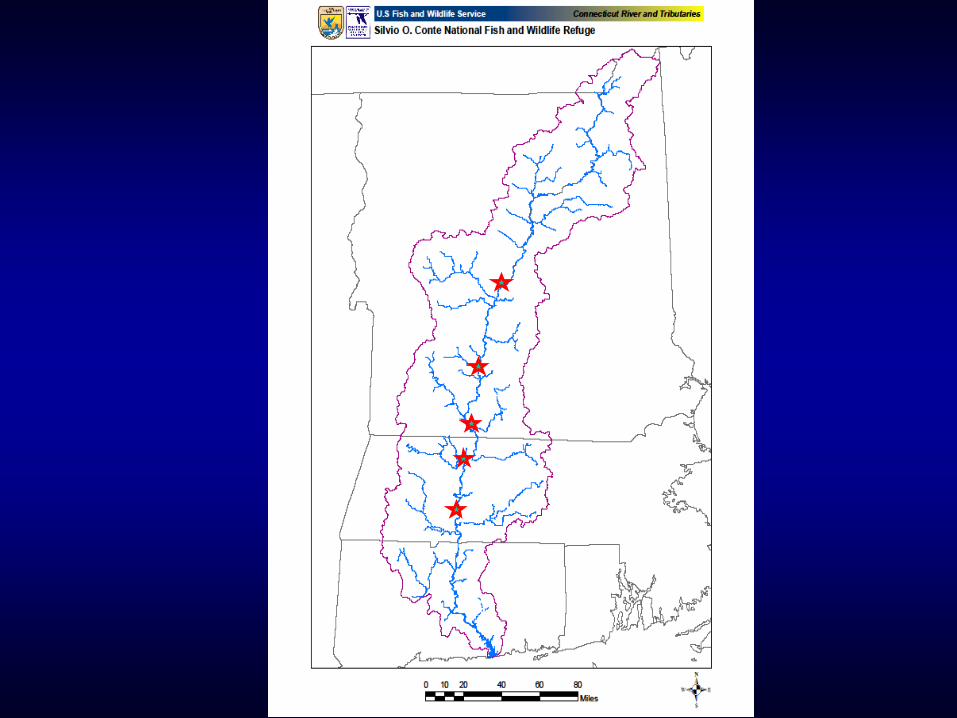
• Hydro-power relicensing / Regulatory: five main stem projects 140
river miles affected, 30 yr. license*, Holyoke Downstream SA*
• Habitat monitoring: water temperatures
• Habitat restoration: Fall River Dam removal
• Population restoration: capture and translocations
• Technical and management team work and planning: ASMFC,
CRASC and subcommittees…
• Research: identify and understand factors that influence survival
…passage…spawning…drivers of population dynamics
(abundance, juvenile production, age structure)
• Outreach/Education: can do better! Interns…volunteers…talks
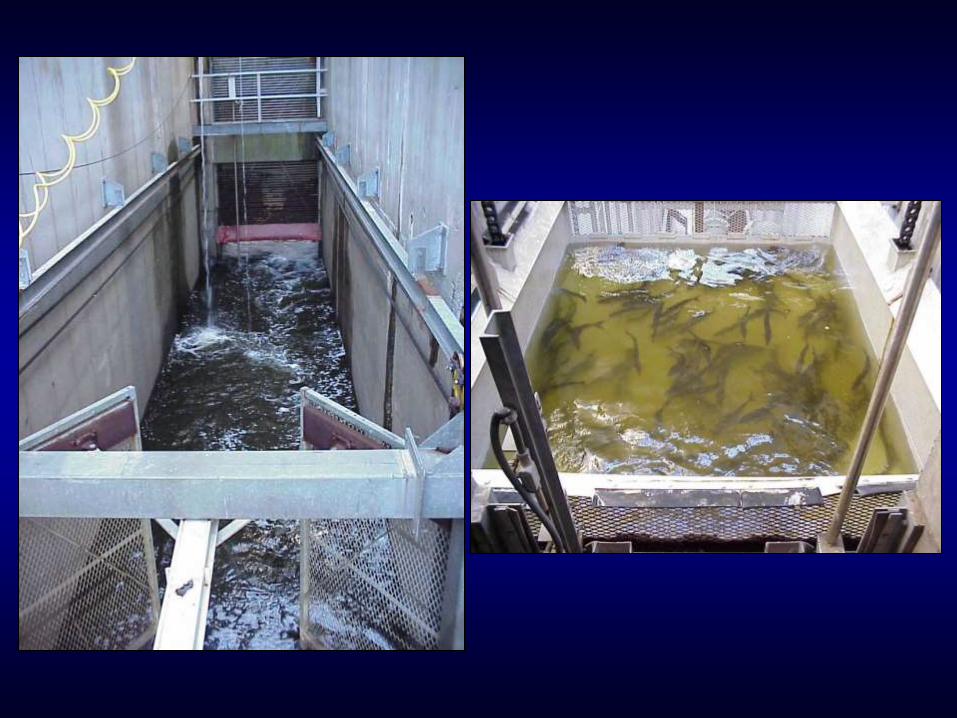
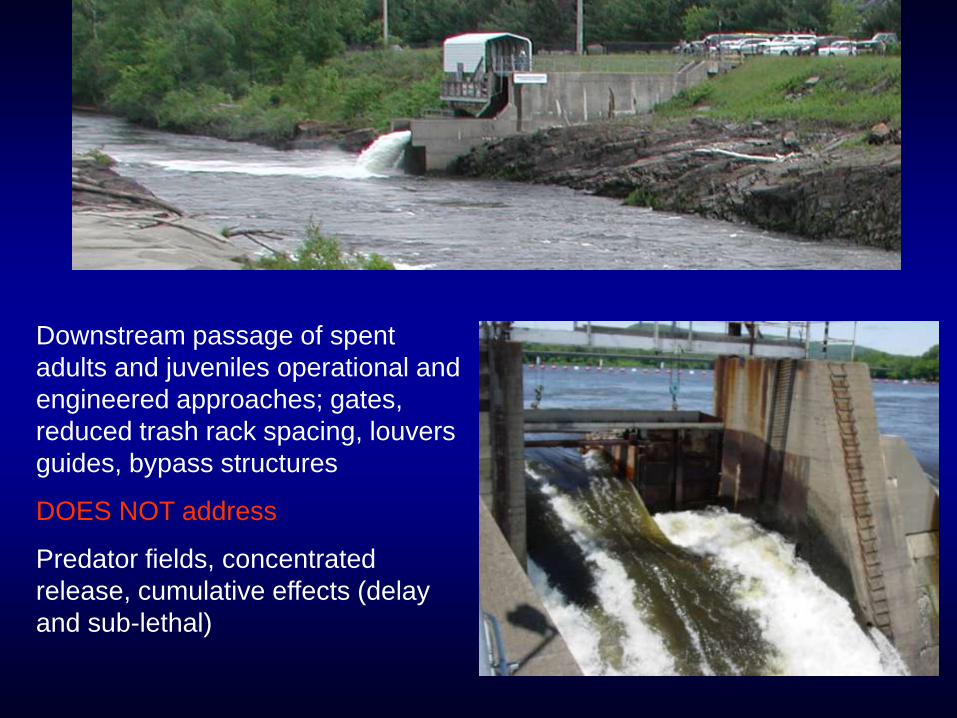
Downstream passage of spent
adults and juveniles operational and
engineered approaches; gates,
reduced trash rack spacing, louvers
guides, bypass structures
DOES NOT address
Predator fields, concentrated
release, cumulative effects (delay
and sub-lethal)
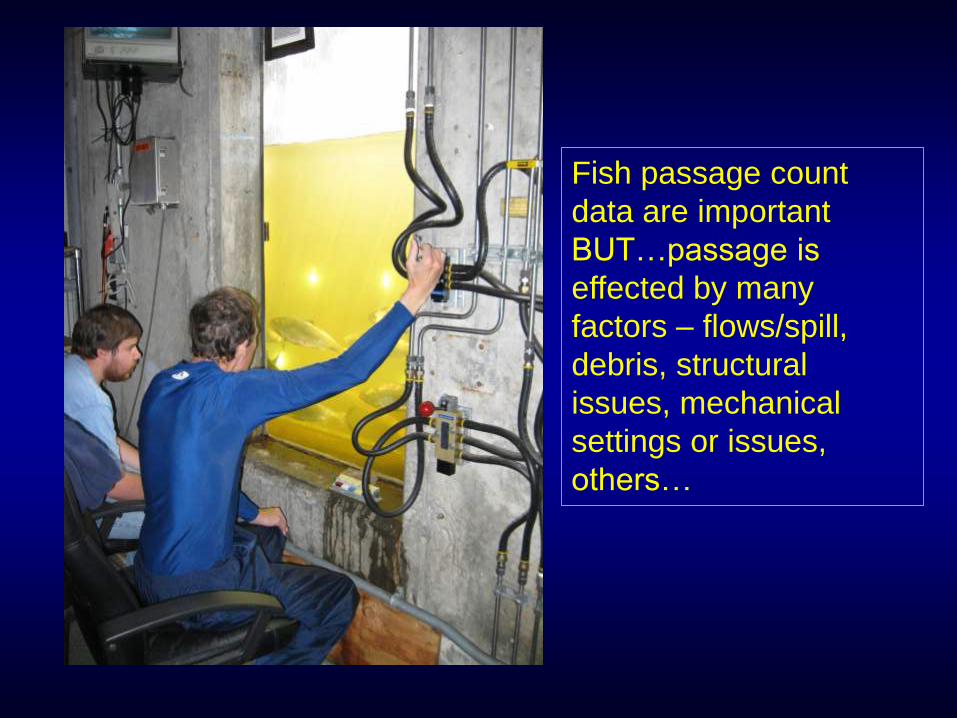
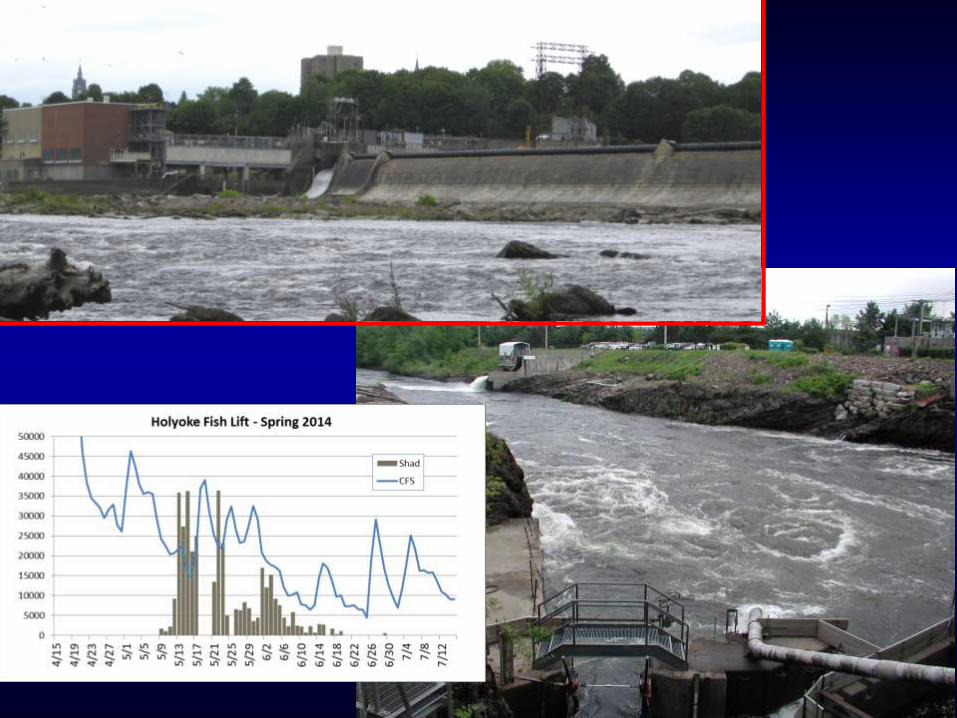
Fish passage count
data are important
BUT…passage is
effected by many
factors – flows/spill,
debris, structural
issues, mechanical
settings or issues,
others…

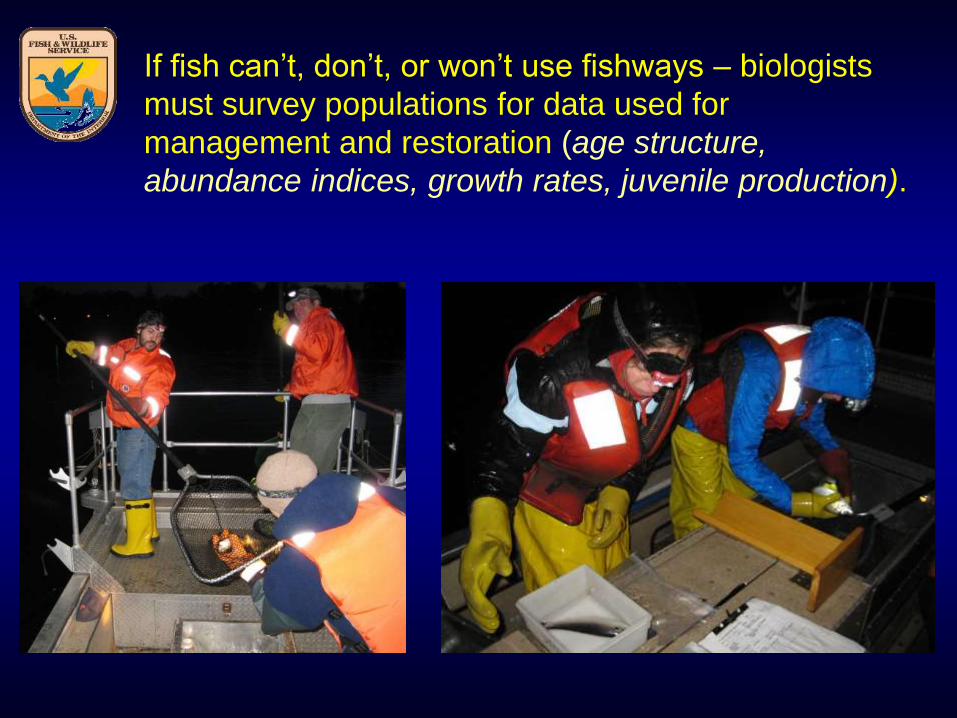
If fish can’t, don’t, or won’t use fishways – biologists
must survey populations for data used for
management and restoration (age structure,
abundance indices, growth rates, juvenile production).

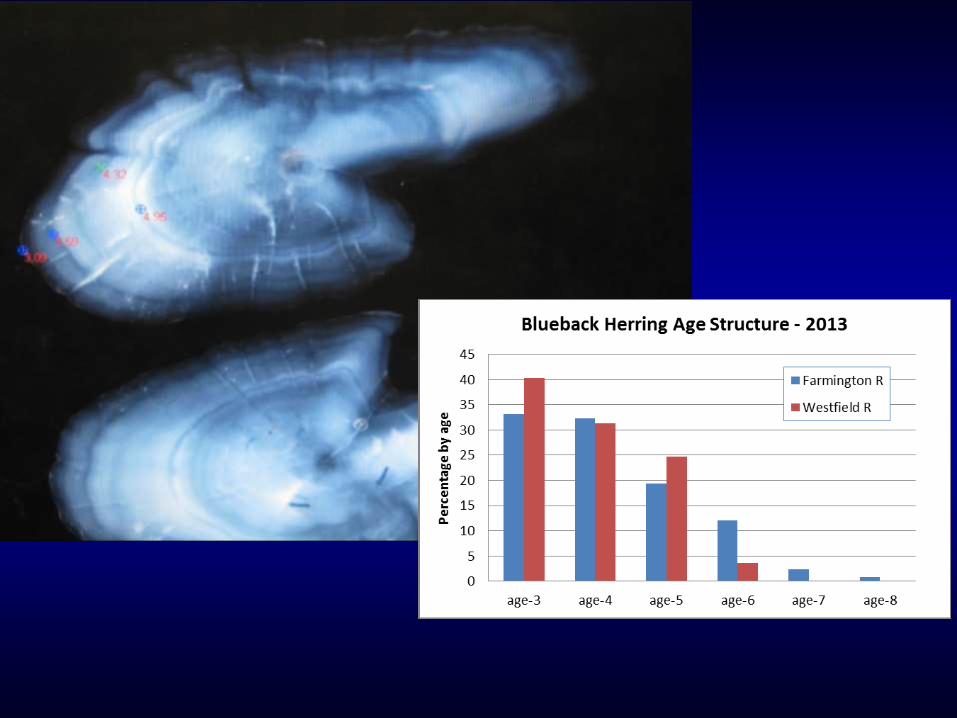
Sampled fish are processed
for otoliths and scales in lab
for later examination

River Herring Population
Assessment
Objectives –
1) Survey for fish occurrence over time (run timing) and
space (target areas)
2) Derive relative abundance catch rates (fish/min),
repeated measures, analytical procedures used
3) Determine species freq., lengths, sex, weight, obtain
structures for aging
4) Determine age structure (by sex, area,…)
5) Develop baseline measures and compare year to year
for status, trends…relationships to variables…
…responses to management measures.


2014 2013
Number of sampling dates 21 18
Total Sample Runs 124 81
Total Efishing seconds 55,736 41,177
Total bluebacks captured 2,593 714
Total alewives captured 220 107
Blueback herring oto/scale - lab 655 501*
Alewife oto/scale - lab 188 103*
Draft CTR Alewife Length @ Age2013 Samples
Age
1 2 3 4 5 6 7 8 9
Toatl L
eng
th (
mm
)
220
240
260
280
300
320
340
Female
Male

Figures by TNC

River Herring Population
Restoration
Objectives –
1) Target of 10,000 river herring, pre-spawn collected in lower river
area
2) Transfer fish to areas of suitable spawning habitat, accessible, but
not utilized
3) Target areas – above dams/fishways in MA and CT, repeated
releases to improve success
4) Evaluate juvenile production

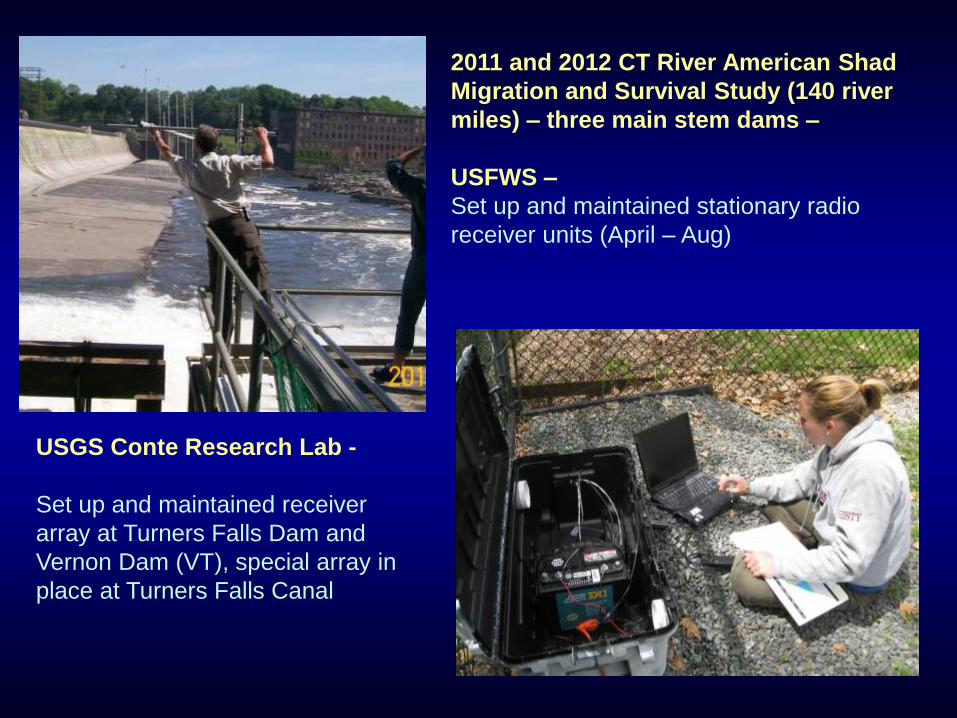
2011 and 2012 CT River American Shad
Migration and Survival Study (140 river
miles) – three main stem dams –
USFWS –
Set up and maintained stationary radio
receiver units (April – Aug)
USGS Conte Research Lab -
Set up and maintained receiver
array at Turners Falls Dam and
Vernon Dam (VT), special array in
place at Turners Falls Canal
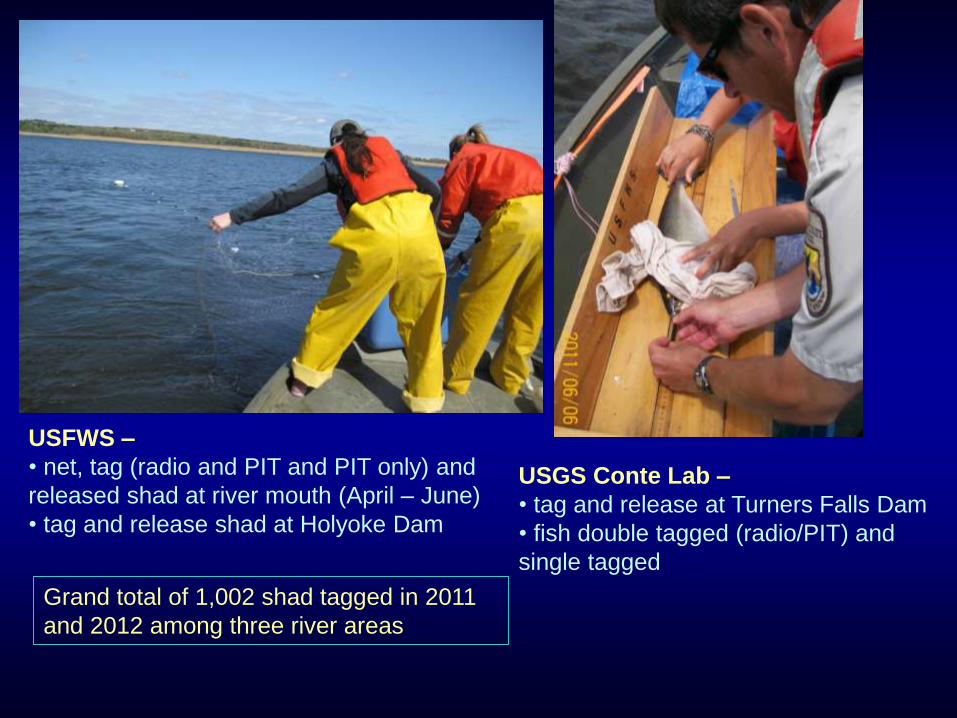
USFWS –
• net, tag (radio and PIT and PIT only) and
released shad at river mouth (April – June)
• tag and release shad at Holyoke Dam
USGS Conte Lab –
• tag and release at Turners Falls Dam
• fish double tagged (radio/PIT) and
single tagged
Grand total of 1,002 shad tagged in 2011
and 2012 among three river areas

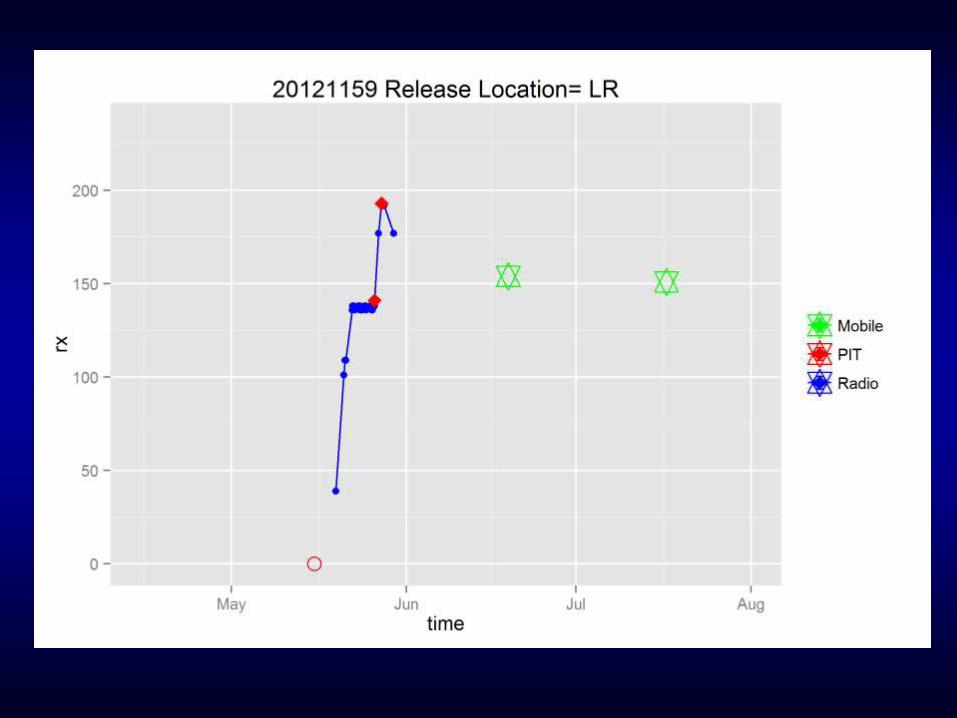
Preliminary Results – lower river releases only –
2011 – total of 82 shad radio/PIT (double tagged) at mouth
• 48 double tagged fish “viable”
• 35 of those passed at Holyoke Fish Lift = 73% passage
2012 – total of 89 shad radio/PIT (double tagged) at mouth
• 39 double tagged shad “viable”
• 25 of those passed at Holyoke Fish Lift = 64% passage
What rate do they move upstream? What factors (flow) affect
them? When do fish arrive at dams? What proportion pass?
What is the timing/rate? What are factors of influence?...many
more.

Date of tagged shad release (river mouth) vs. number of days until PIT tag detection at HFL - Spring 2011
(PIT tag data, 38 detected of 92 released)
Date shad tagged and released at river mouth
4/25 5/2 5/9 5/16 5/23 5/30 6/6
# D
ays f
rom
re
lea
se
to
pa
ssa
ge
at
HF
L
0
5
10
15
20
25
30
35
40


Related Documents