Uses of Safety Performance Functions and Potential for Safety Improvement Values David L. Piper, P.E. Illinois Department of Transportation

Uses of Safety Performance Functions and Potential for Safety Improvement Values David L. Piper, P.E. Illinois Department of Transportation.
Dec 26, 2015
Welcome message from author
This document is posted to help you gain knowledge. Please leave a comment to let me know what you think about it! Share it to your friends and learn new things together.
Transcript

Uses ofSafety Performance
Functionsand
Potential for Safety Improvement Values
David L. Piper, P.E.Illinois Department of
Transportation

Applications of SPF and PSI
• Using the HSIP Five Percent Report• Safety Analysis in Phase I• Quantitative Site Analysis
July 29 and 30, 2009 2

Using the HSIP Five Percent Report
• Is my location a “5%” site?– Map– Illinois Roadway Information System
(IRIS) location
July 29 and 30, 2009 3
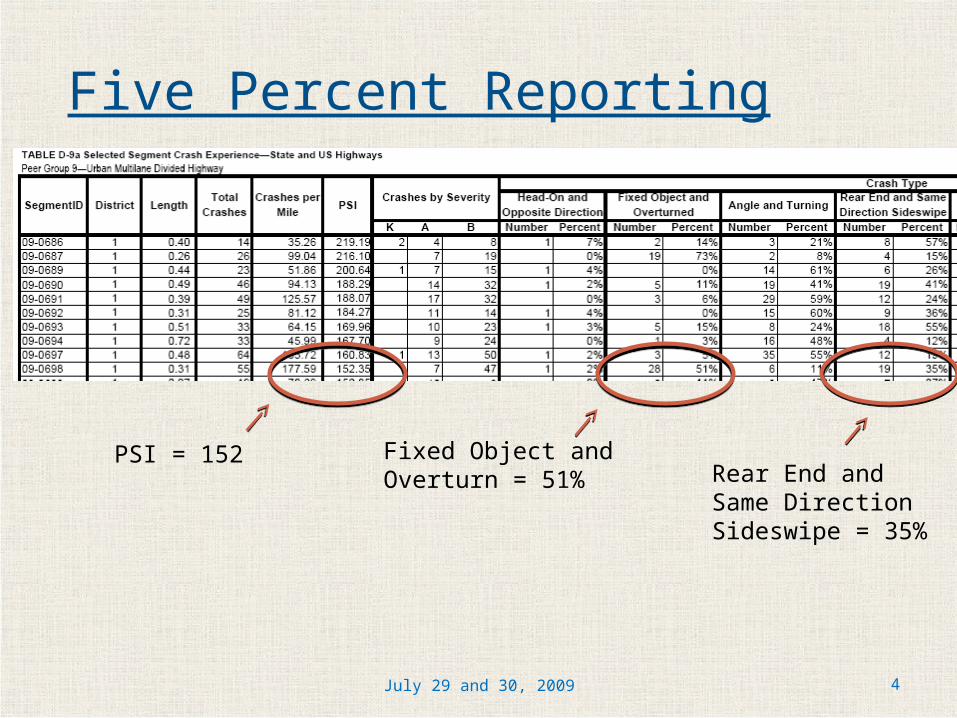
Five Percent Reporting
July 29 and 30, 2009 4
PSI = 152 Fixed Object and Overturn = 51% Rear End and Same
Direction Sideswipe = 35%

Five Percent Reporting
July 29 and 30, 2009 5
Driving too fast for conditions = 45%

Listing of Crashes
July 29 and 30, 2009 6
06-0698
Using SPF and PSI Information in Phase I
• Creation of the 5% Report requires a look at 100% of sites.
• Weighting of PSI supports goal to reduce K’s and A’s
• Substantive safety measure at project level
• Breakdown by segments and intersections within the project
7
Using SPF and PSI Information in Phase I
• Suggested triggers for Road Safety Assessment if:– PSI is 10 or higher– Segment or intersection in top 33% of
its peer group– If segment or intersection has PSI 50%
higher than adjacent similar location(s)
July 29 and 30, 2009 8
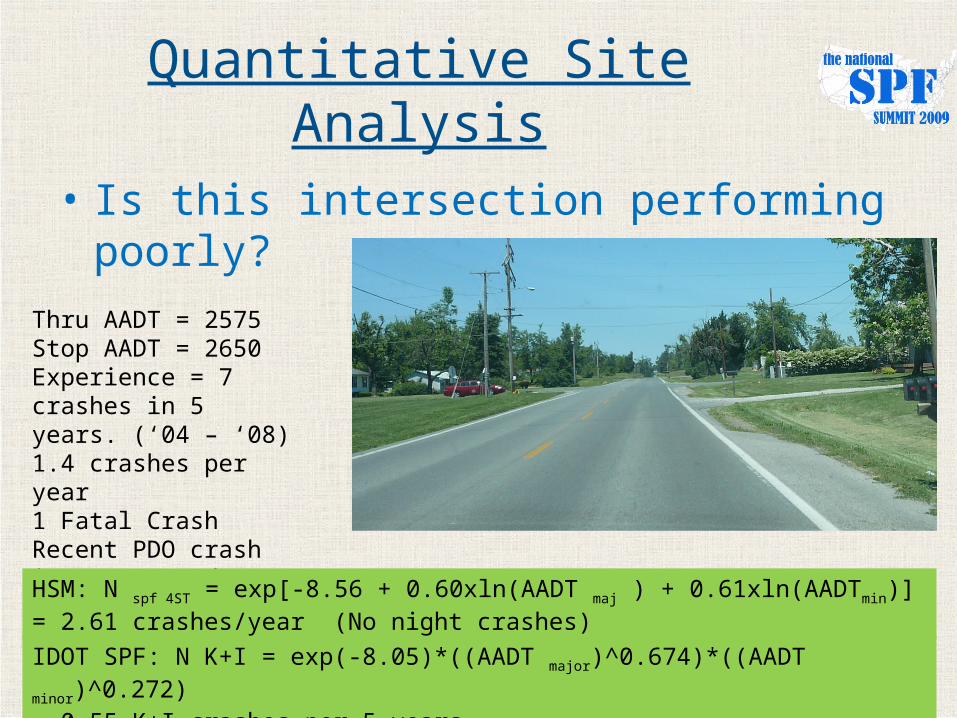
Quantitative Site Analysis
• Is this intersection performing poorly?
9
Thru AADT = 2575Stop AADT = 2650Experience = 7 crashes in 5 years. (‘04 – ‘08)1.4 crashes per year1 Fatal CrashRecent PDO crash in 12/08, and A-Injury crash in 01/09
HSM: N spf 4ST = exp[-8.56 + 0.60xln(AADT maj ) + 0.61xln(AADTmin)]= 2.61 crashes/year (No night crashes)
IDOT SPF: N K+I = exp(-8.05)*((AADT major)^0.674)*((AADT minor)^0.272) = 0.55 K+I crashes per 5 years.

Quantitative Site Analysis
• Countermeasures Completed– Lighting– Improve sight distance (hedge clearing)– Relocated utility sign
• Countermeasures Under Consideration– Improved warning signs– Police private signs on ROW
July 29 and 30, 2009 10

Quantitative Site Analysis
• Is this intersection performing poorly?
July 29 and 30, 200911
Thru AADT = 2300Stop AADT = 650Experience = 10 crashes in 5 years. (‘04 – ‘08)2.0 crashes per year1 Fatal Crash3 A-Injury Crashes2B-Injury Crashes
HSM: N spf 4ST = exp[-8.56 + 0.60xln(AADT maj ) + 0.61xln(AADTmin)]= 1.04 crashes/year
IDOT SPF: N K+I = exp(-8.05)*((AADT major)^0.674)*((AADT minor)^0.272) = 0.34 K+I crashes per 5 years.
Quantitative Site Analysis
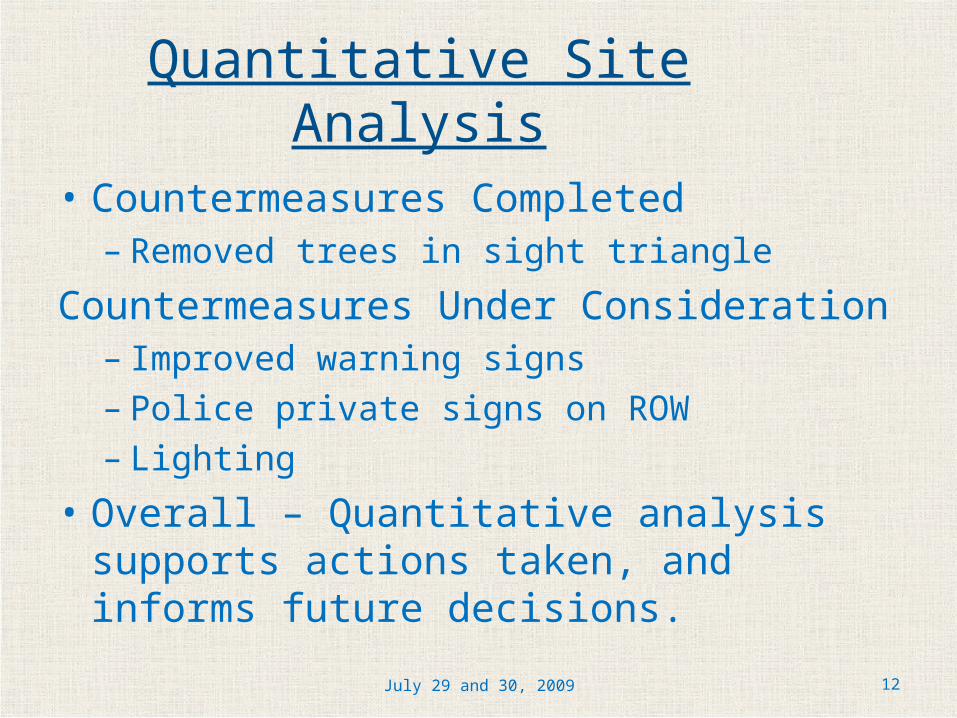
• Countermeasures Completed– Removed trees in sight triangle
Countermeasures Under Consideration– Improved warning signs– Police private signs on ROW– Lighting
• Overall – Quantitative analysis supports actions taken, and informs future decisions.
July 29 and 30, 2009 12

Summary
• SPF/PSI Products Support– Identification of safety opportunities– IDOT goal to reduce K’s and A’s– Office review of 5% locations– Focus of resources to best effect– Credibility of analysis
• SPF/PSI Products will Support– SafetyAnalyst– Highway Safety Manual
July 29 and 30, 2009 13

Related Documents


![CPUC Safety En Banc on Safety Management Systems - 5 ......The Public Inquiry into the Piper Alpha Disaster. ... [Piper Alpha] 2. Simple but detailed systems, policies, standards and](https://static.cupdf.com/doc/110x72/60e84ef5187a963e6167b5ef/cpuc-safety-en-banc-on-safety-management-systems-5-the-public-inquiry.jpg)


