User Interfaces and Discrete Event Simulation Models Jasminka Kuljis Dissertation submitted in fulfilment of the requirement for the degree of Doctor of Philosophy at the London School of Economics and Political Sciences University of London March, 1995

Welcome message from author
This document is posted to help you gain knowledge. Please leave a comment to let me know what you think about it! Share it to your friends and learn new things together.
Transcript
User Interfaces and Discrete Event
Simulation Models
Jasminka Kuljis
Dissertation submitted in fulfilment of the requirement for the degree of
Doctor of Philosophy
at the
London School of Economics and Political Sciences
University of London
March, 1995

UMI Number: U074652
All rights reserved
INFORMATION TO ALL USERS The quality of this reproduction is dependent upon the quality of the copy submitted.
In the unlikely event that the author did not send a complete manuscript and there are missing pages, these will be noted. Also, if material had to be removed,
a note will indicate the deletion.
Dissertation Publishing
UMI U074652Published by ProQuest LLC 2014. Copyright in the Dissertation held by the Author.
Microform Edition © ProQuest LLC.All rights reserved. This work is protected against
unauthorized copying under Title 17, United States Code.
ProQuest LLC 789 East Eisenhower Parkway
P.O. Box 1346 Ann Arbor, Ml 48106-1346

T\-\~ c S
f7I&>
/ <3 1177/ ZS4
Abstract
A user interface is critical to the success of any computer-based system. Numerous studies
have shown that interface design has a significant influence on factors such as learning time,
performance speed, error rates, and user satisfaction. Computer-based simulation modelling is
one of the domains that is particularly demanding in terms of user interfaces. It is also an area that
often pioneers new technologies that are not necessarily previously researched in terms of human-
computer interaction.
The dissertation describes research into user interfaces for discrete event simulation. Issues
that influence the ‘usability’ of such systems are examined. Several representative systems were
investigated in order to generate some general assumptions with respect to those characteristics of
user interfaces employed in simulation systems. A case study was carried out to gain practical
experience and to identify possible problems that can be encountered in user interface
development. There is a need for simulation systems that can support the developments of
simulation models in many domains, which are not supported by contemporary simulation
software.
Many user interface deficiencies are discovered and reported. On the basis of findings in this
research, proposals are made on how user interfaces for simulation systems can be enhanced to
match better the needs specific to the domain of simulation modelling, and on how better to
support users in simulation model developments. Such improvements in user interfaces that better
support users in simulation model developments could achieve a reduction in the amount of time
needed to learn simulation systems, support retention of learned concepts over time, reduce the
number of errors during interaction, reduce the amount of time and effort needed for model
development, and provide greater user satisfaction.
J. Kuljis User Interfaces and Discrete Event Simulation Models Page i

Acknowledgements
I would like to thank my supervisor Professor Ian O. Angell for his incomparable guidance and
reassuring support, and for giving me a chance to pursue this research in the belief that I will get
there in the end.
To my parents and sisters who always believed in me and always supported me in any way they
could.
To Alistair Gardiner for helping me to capture graphics from a screen.
To the Roehampton Institute for helping me with the fees and providing me with some free time to
finish writing this dissertation.
I cannot thank Ray enough for providing his constant support, encouragement, and advice, and
for putting up with me throughout this period.
J. Kuljis User Interfaces and Discrete Event Simulation Models Page ii
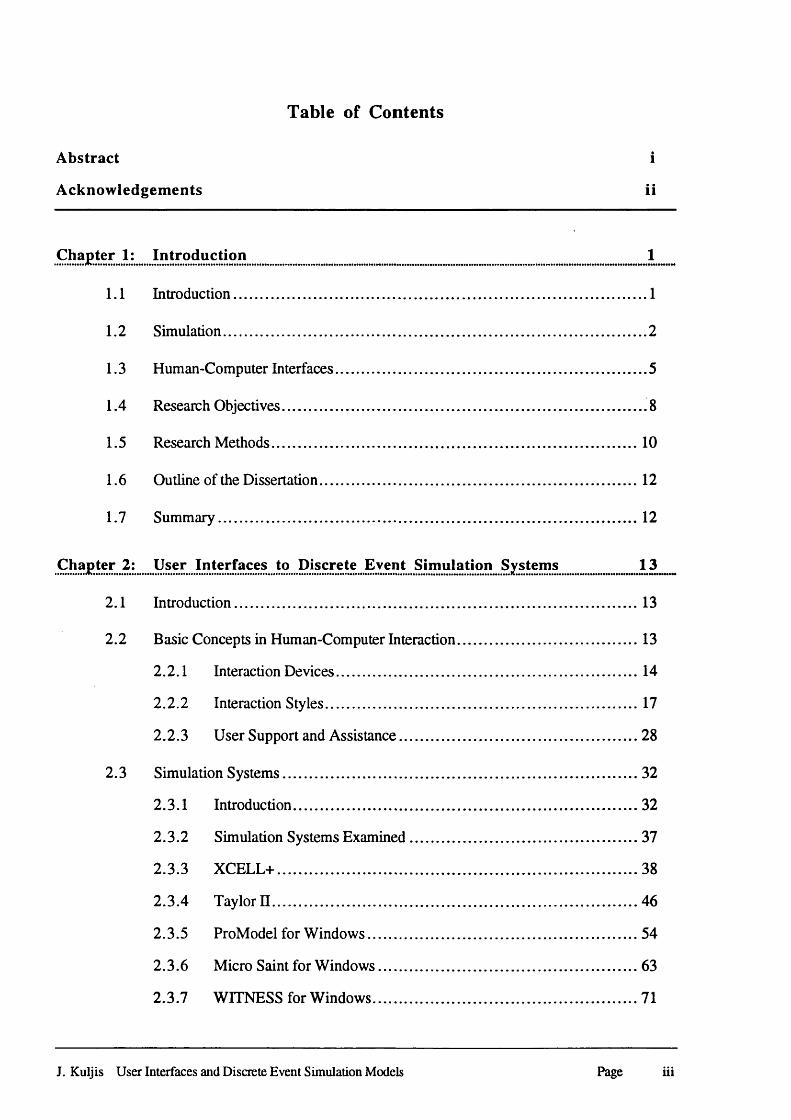
Table of Contents
Abstract i
Acknowledgements ii
Chapter 1: Introduction 1
1.1 Introduction.............................................................................................................. 1
1.2 Simulation.................................................................................................................2
1.3 Human-Computer Interfaces................................................................................... 5
1.4 Research Objectives................................................................................................. 8
1.5 Research Methods.................................................................................................. 10
1.6 Outline of the Dissertation......................................................................................12
1.7 Summary................................................................................................................ 12
Chapter 2: User Interfaces to Discrete Event Simulation Systems 13^
2.1 Introduction............................................................................................................ 13
2.2 Basic Concepts in Human-Computer Interaction..................................................13
2.2.1 Interaction Devices..................................................................................14
2.2.2 Interaction Styles.....................................................................................17
2.2.3 User Support and Assistance.................................................................28
2.3 Simulation Systems............................................................................................... 32
2.3.1 Introduction.............................................................................................32
2.3.2 Simulation Systems Examined..............................................................37
2.3.3 XCELL+.................................................................................................38
2.3.4 Taylor n .................................................................................................. 46
2.3.5 ProModel for Windows.........................................................................54
2.3.6 Micro Saint for Windows...................................................................... 63
2.3.7 WITNESS for Windows....................................................................... 71
J. Kuljis User Interfaces and Discrete Event Simulation Models Page iii
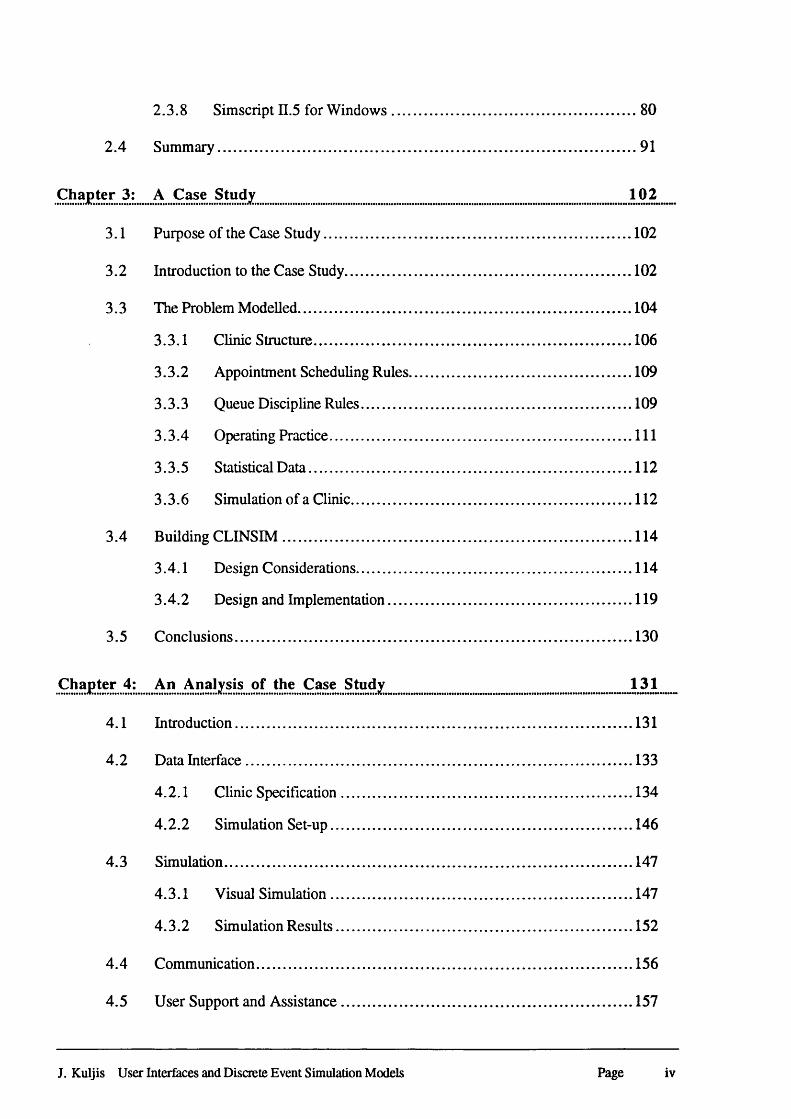
2.3.8 Simscript II.5 for Windows.................................................................. 80
2.4 Summary................................................................................................................91
C hapter 3: A Case Study 102
3.1 Purpose of the Case Study.................................................................................. 102
3.2 Introduction to the Case Study.............................................................................102
3.3 The Problem Modelled......................................................................................... 104
3.3.1 Clinic Structure..................................................................................... 106
3.3.2 Appointment Scheduling Rules............................................................ 109
3.3.3 Queue Discipline Rules......................................................................... 109
3.3.4 Operating Practice................................................................................. I l l
3.3.5 Statistical Data.......................................................................................112
3.3.6 Simulation of a Clinic............................................................................112
3.4 Building CLINSIM............................................................................................. 114
3.4.1 Design Considerations.......................................................................... 114
3.4.2 Design and Implementation.................................................................. 119
3.5 Conclusions.......................................................................................................... 130
C hapter 4: An Analysis of the Case Study 131
4.1 Introduction.......................................................................................................... 131
4.2 Data Interface....................................................................................................... 133
4.2.1 Clinic Specification...............................................................................134
4.2.2 Simulation Set-up................................................................................. 146
4.3 Simulation.............................................................................................................147
4.3.1 Visual Simulation..................................................................................147
4.3.2 Simulation Results................................................................................ 152
4.4 Communication.................................................................................................... 156
4.5 User Support and Assistance.............................................................................. 157
J. Kulj is User Interfaces and Discrete Event S imulation Models Page iv
4.6 Usability Evaluation..............................................................................................158
4.7 Conclusions.......................................................................................................... 159
Chapter 5: HCI Relevance to Simulation Systems 161
5.1 Introduction.......................................................................................................... 161
5.2 Human Issues........................................................................................................163
5.2.1. The Human........................................................................................... 163
5.2.2 The Interaction....................................................................................... 173
5.3 Some Design Issues..............................................................................................175
5.3.1 The Process of Ensuring Usability...................................................... 175
5.3.2 Design Guidelines.................................................................................177
5.4 HCI Theories........................................................................................................193
5.4.1 The Empirical Approach........................................................................194
5.4.2 The Cognitive Approach.......................................................................195
5.4.3 The Predictive Modelling Approach.................................................... 199
5.4.4 The Anthropomorphic Approach..........................................................205
5.5 Evaluation of User Interfaces.............................................................................. 207
5.6 Conclusions.......................................................................................................... 211
Chapter 6: Proposed Enhancements 217
6.1 Introduction.......................................................................................................... 217
6.2 Simulation Environments..................................................................................... 220
6.2.1 Model Development Aid.......................................................................221
6.2.2 Colour Use Aid.....................................................................................226
6.2.3 Flexibility of Interaction.......................................................................227
6.3 Data Input/ Model Specification.......................................................................... 228
6.4 Visual Simulation..................................................................................................231
6.5 Simulation Statistics/Results................................................................................234
J. Kuljis User Interfaces and Discrete Event Simulation Models Page v
6.6 User Support and Assistance.............................................................................. 237
6.7 Summary...............................................................................................................241
C hapter 7: Sum m ary and Conclusions 2 4 3_
7.1 Summary...............................................................................................................243
7.2 Conclusions.......................................................................................................... 245
7.3 Future W ork......................................................................................................... 247
R eferences 2 5 0_
Software Manuals Referenced........................................................................................ 261
Publications Resulting from this Research 263
J. Kuljis User Interfaces and Discrete Event Simulation Models Page vi
List of Figures and Tables
Figure 2.1 XCELL+: Environment......................................................................................... 40
Figure 2.2 XCELL+: Model design........................................................................................40
Figure 2.3 XCELL+: An element’s details.............................................................................42
Figure 2.4 XCELL+: A model run......................................................................................... 42
Figure 2.5 XCELL+: Simulation results................................................................................. 44
Figure 2.6 XCELL+: The only help screen............................................................................44
Figure 2.7 Taylor II: Environment......................................................................................... 48
Figure 2.8 Taylor II: Data entry............................................................................................... 48
Figure 2.9 Taylor II: The icon editor.......................................................................................50
Figure 2.10 Taylor II: A model run...........................................................................................50
Figure 2.11 Taylor II: Simulation results................................................................................. 52
Figure 2.12 Taylor II: On-line help........................................................................................... 52
Figure 2.13 ProModel: Specifying locations............................................................................56
Figure 2.14 ProModel: Specifying processes...........................................................................56
Figure 2.15 ProModel: A model run..........................................................................................59
Figure 2.16 ProModel: Output results for locations................................................................59
Figure 2.17 ProModel: Output results for a location................................................................61
Figure 2.18 ProModel: Context-sensitive help........................................................................61
J. Kuljis User Interfaces and Discrete Event Simulation Models Page vii
Figure 2.19 Micro Saint: Network diagram for a model......................................................... 65
Figure 2.20 Micro Saint: Data entry for a task.......................................................................... 65
Figure 2.21 Micro Saint: A model run (with symbols)............................................................67
Figure 2.22 Micro Saint: Model run (with numbers)............................................................... 67
Figure 2.23 Micro Saint: Output results....................................................................................69
Figure 2.24 Micro Saint: On-line help.......................................................................................69
Figure 2.25 WITNESS: Defining a model................................................................................72
Figure 2.26 WITNESS: Specifying the display options......................................................... 72
Figure 2.27 WITNESS: Specifying queue characteristics.......................................................74
Figure 2.28 WITNESS: A model run .......................................................................................74
Figure 2.29 WITNESS: A model output for buffers............................................................... 78
Figure 2.30 WITNESS: On-line help........................................................................................ 78
Figure 2.31 Simscript n.5: Program editor in SimLab.............................................................82
Figure 2.32 Simscript 13.5: A menu definition in SimDraw.................................................... 82
Figure 2.33 Simscript II.5: Drawing icons in SimDraw..........................................................85
Figure 2.34 Simscript n.5: A model run...................................................................................85
Figure 2.35 Simscript n.5: SimVideo facility...........................................................................88
Figure 2.36 Simscript D.5: On-line help................................................................................... 88
Table 2.1 Minimal system requirements................................................................................91
Table 2.2 Main system characteristics...................................................................................92
J. Kuljis User Interfaces and Discrete Event Simulation Models Page viii
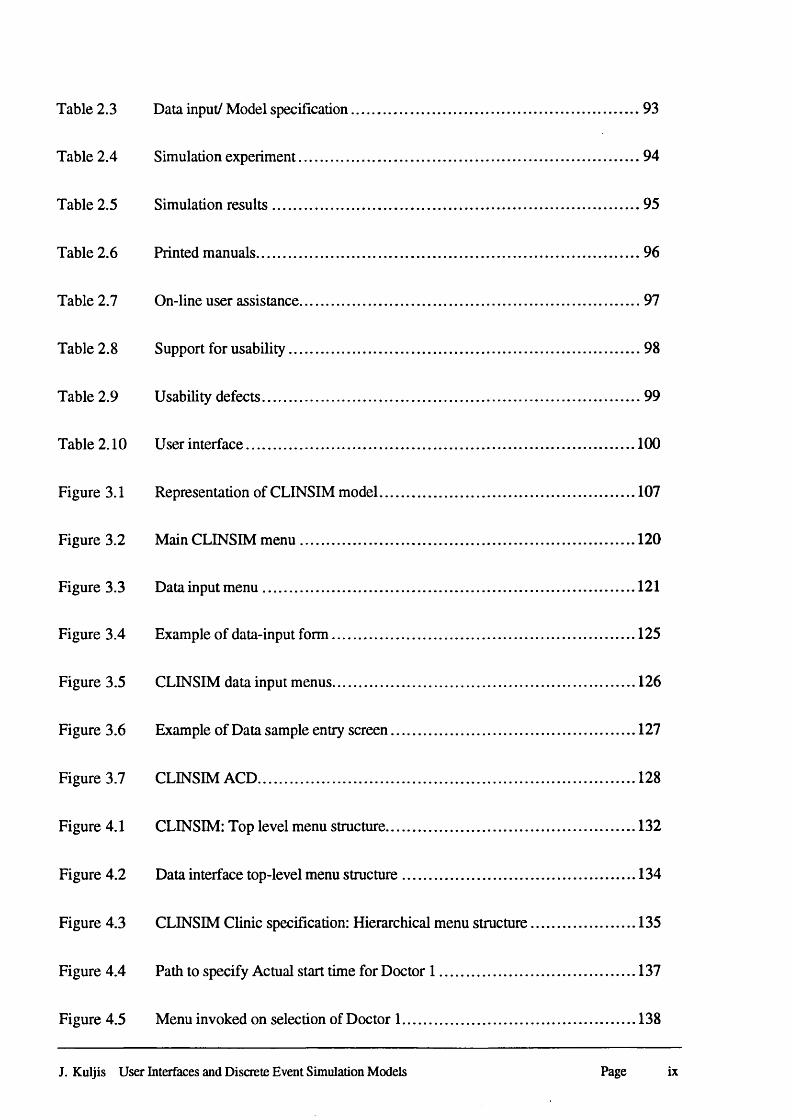
Table 2.3 Data input/ Model specification.............................................................................93
Table 2.4 Simulation experiment...........................................................................................94
Table 2.5 Simulation results.................................................................................................. 95
Table 2.6 Printed manuals...................................................................................................... 96
Table 2.7 On-line user assistance........................................................................................... 97
Table 2.8 Support for usability..............................................................................................98
Table 2.9 Usability defects.....................................................................................................99
Table 2.10 User interface........................................................................................................100
Figure 3.1 Representation of CLINSIM model.................................................................... 107
Figure 3.2 Main CLINSIM m enu......................................................................................... 120
Figure 3.3 Data input menu................................................................................................... 121
Figure 3.4 Example of data-input form................................................................................. 125
Figure 3.5 CLINSIM data input menus................................................................................. 126
Figure 3.6 Example of Data sample entry screen..................................................................127
Figure 3.7 CLINSIM ACD.....................................................................................................128
Figure 4.1 CLINSIM: Top level menu structure................................................................... 132
Figure 4.2 Data interface top-level menu structure...............................................................134
Figure 4.3 CLINSIM Clinic specification: Hierarchical menu structure.............................135
Figure 4.4 Path to specify Actual start time for Doctor 1 ..................................................... 137
Figure 4.5 Menu invoked on selection of Doctor 1...............................................................138
J. Kuljis User Interfaces and Discrete Event Simulation Models Page ix
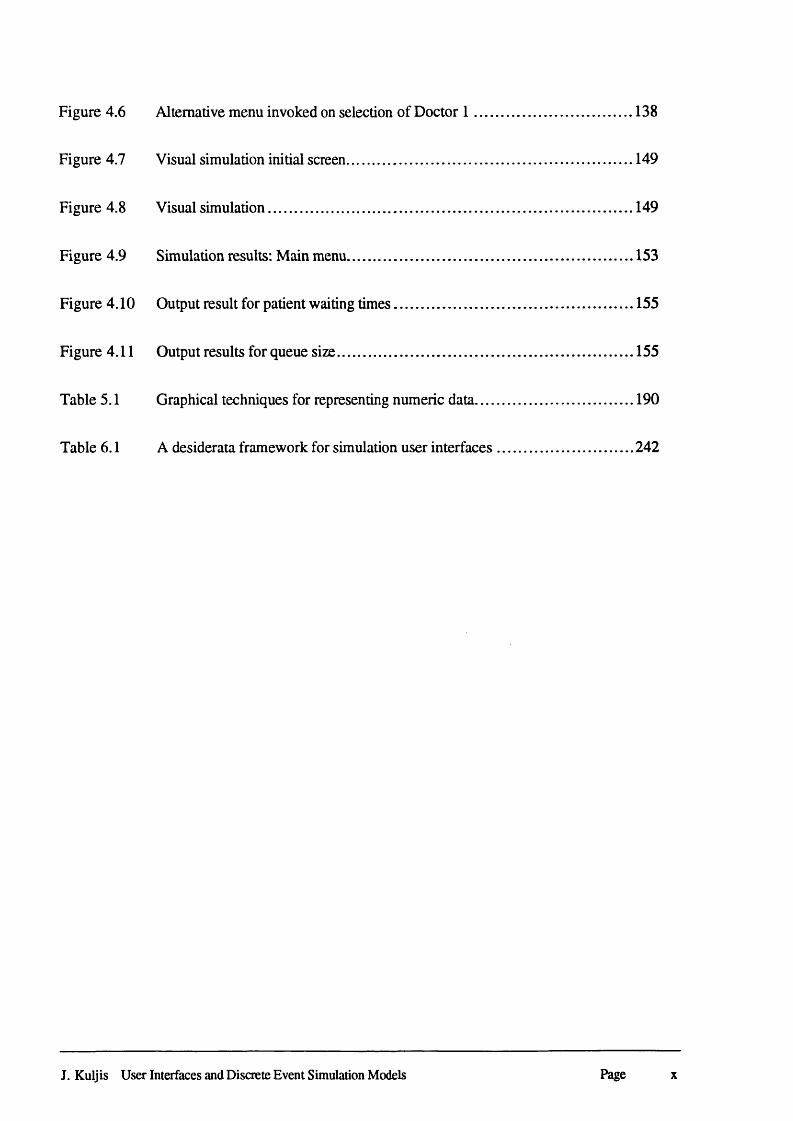
Figure 4.6 Alternative menu invoked on selection of Doctor 1 ...........................................138
Figure 4.7 Visual simulation initial screen.............................................................................149
Figure 4.8 Visual simulation................................................................................................. 149
Figure 4.9 Simulation results: Main menu.............................................................................153
Figure 4.10 Output result for patient waiting times................................................................ 155
Figure 4.11 Output results for queue size............................................................................... 155
Table 5.1 Graphical techniques for representing numeric data........................................... 190
Table 6.1 A desiderata framework for simulation user interfaces..................................... 242
J. Kuljis User Interfaces and Discrete Event Simulation Models Page x
Chapter 1: Introduction
1.1 Introduction
When examining the history of how computer systems have evolved over a time-span of four
decades one has to notice that the development of new technologies follows amazing
developments in the modes of interaction between humans and computer systems. When using
current interactive computer systems it is almost impossible to understand what it was like to use
the old systems with their rigid structures and rudimentary types of user interfaces. Research into
human-computer interaction (HCI) is by no means over. We are only at the beginning of such
research. The population of computer users is increasing in numbers and expanding to all areas of
human activities. HCI research is driven by that expansion. At the same time as computer systems
become more ‘usable’, that brings in more new users and new uses of computers. Therefore,
research in HCI and expansion of the user population are inevitably linked in a feedback like
process. Despite all the advances and improvements in today’s interactive computer systems we
are all too well aware that there are still many deficiencies in current user interfaces. Computer
systems now have to cater for all kinds of task domains and for all types of user populations. This
means that user interfaces have to bridge the gap between often computer illiterate, users and
computer systems.
Computer-based simulation modelling is one of the domains that is particularly demanding in
terms of user interfaces. It is an area that covers aspects of user interfaces that usually span over
several application areas. It is also an area that often pioneers new technologies that are not
necessarily previously researched in terms of human-computer interaction. Simulation systems
therefore are worthy of examination from the user interface point of view. So one question is,
whether there are any obvious and relatively easily resolved deficiencies in user interfaces to
current simulation systems? The other question is, whether user interfaces to simulation systems
can offer new insights into human-computer interaction in general, and if this is the case what it
can offer? Related questions are: can theories in human-computer interfaces in general help
eliminate simulation HCI deficiencies? If it cannot what can we do about it?
J. Kuljis: User Interfaces and Discrete Event Simulation Models Page 1
Chapter 1: Introduction
1.2 Simulation
Simulation is the process of designing a model of a real system and conducting experiments with
this model for the purpose of either understanding the behaviour of the system or for evaluating
various strategies for the operation of the system (Shannon, 1975). As a technique, simulation is
one of the most widely used in operations research and management science. However, it is, and
can be, applied in other areas like, for example, decision-support systems. Eom and Lee (1990)
conducted a survey of the modelling techniques used in decision-support systems. They found
that of the 20 modelling techniques surveyed, 41 out of 203 applications used simulation.
Application areas for simulation are numerous and diverse. Law and Kelton (1991) provide a list
of some particular kinds of problems for which simulation has been found to be a useful and
powerful tool:
• Designing and analysing manufacturing systems.
• Evaluating hardware and software requirements for a computer system.
• Evaluating a new military weapons system or tactic.
• Determining ordering policies for an inventory system.
• Designing communications systems and message protocols for them.
• Designing and operating transportation facilities such as freeways, airports, subways,
or ports.
• Evaluating designs for service organisations such as hospitals, post offices, or fast-
food restaurants.
• Analysing financial or economic systems.
A distinction can be drawn between models of continuous and discrete systems. In continuous
systems the changes through time are predominantly smooth, and are conveniently described by
sets of difference equations. A discrete system changes at specific points in time and a model of
such a system is concerned only with these events (Paul and Baimer, 1993). The simulations and
models we consider in this dissertation are discrete event simulation models.
J. Kuljis User Interfaces and Discrete Event Simulation Models Page 2
Chapter 1: Introduction
Simulation systems are a particular kind of decision support system. Their nature is, as for
any modelling process, to understand and structure a problem that is constantly changing to a
varying degree, both with respect to changes in the outside world, and with respect to the
perceptions of the problem owners (Paul, 1991). That change has to be apparent in the working
system. Simulation always involves experimentation, usually on a computer-based model of some
system. The simulation model can be used to compare alternative systems, or the effect of
changing a decision variable; to predict what would happen to the state of the system at some
future point in time; and to investigate how the system would behave and react to normal and
abnormal stimuli (Pidd, 1992a). The model is used as a vehicle for experimentation where trial
and error and learning methods of experimentation help support management decision making.
Such modelling systems have the desired characteristics of interactive user input, algorithmic
processing, and intricate and flexible output. They typically involve non-linear development,
which is interruptable and restartable to meet changing specifications in the light of improved
understanding during development. Because of the research nature of modelling, there is an active
need for the users or problem owners to participate in the modelling process. Requirements and
specification are therefore particularly subject to change as an understanding of the problem being
modelled evolves, for both the users and the developers. This can lead to severe difficulties in
modelling implementation because of the changing basis of the model. One aim in these situations
might be to determine general principles concerning the flexibility of applications to meet
specifications and specification changes, and customisability.
Simulation has for a long time been a popular technique, but until it was visualised, its
operation was a mystery to many problem owners. There is evidence that visual simulation
systems, especially visual interactive modelling systems (VIM) have a much greater impact than
non-visual. The results from a survey conducted by Kirkpatrick and Bell (1989) support the
claims that VIM has considerable managerial support in industry, is useful in providing modelling
support for group decision making, and provides major benefits to managers in the areas of model
validation, incorporation of qualitative dimensions into modelling, and modelling complex
systems. It substantiated the belief that VIM leads to an improved understanding of the problem
and the alternatives available, and in the decision maker’s greater confidence in and commitment to
J. Kuljis User Interfaces and Discrete Event Simulation Models Page 3
Chapter 1: Introduction
the results. However, there is a recognised danger that visual modelling can induce undue over
confidence in modelling accuracy because the model looks ‘alright* (Paul, 1991).
Recent advances in microcomputer technology have had a major impact on simulation
modelling and the use of graphics in particular. Visual representation in simulation modelling
comes in a variety of forms. There are a number of ways of visually representing the logic of a
simulation model whilst it is running. Graphical interfaces can be extremely useful in the
development of sophisticated training and simulation environments. Users of such interfaces are
able to obtain a much more immediate impression of what is happening to the object or system in
question by looking at a graphical representation than by looking at a textual or symbolic
representation of a mathematical model. As the user watches the progress of a visual simulation it
may become obvious that performance could be improved by a small change to one of the
variables. Interrupting the running program, modifying the appropriate variables and restarting the
simulation from its previous state are becoming more commonly available features in commercial
simulation packages.
Most simulation software offers graphical facilities for the representation of simulation
statistics. Besides the standard reports for commonly occurring performance statistics (e.g.,
utilisation, queue sizes and delays, and throughput) most of the newer software allow the
development of tailored reports. The user can choose the form of representation (e.g., textual
output, table, representational graph, bar diagram, pie chart, histogram, time series, etc.),
colours, labels, etc. In most of the visual interactive simulation software, partial statistical results
can be viewed during the simulation run. Some authors question whether replacing numbers with
multi-coloured graphics improves the usefulness of the display for decision making (Ives, 1982;
Bell, 1991). But this is not an issue here since there is always the possibility to resort to numbers
when the user, after exploring several scenarios, becomes satisfied with the system behaviour.
Increasingly, discrete event computer simulations are being written on personal computers and
workstations. Also commonly, they are written as delivered software for use by the client directly
rather than by the analysts on the client’s behalf. This necessitates a more elaborate user interface
that will aid clients in their decision making tasks.
J. Kuljis User Interfaces and Discrete Event Simulation Models Page 4
Chapter 1: Introduction
Some of the most important decisions a modeller or analyst must make in performing a
discrete event simulation study is the choice of a language, or package, or environment. There are
currently two major classes of simulation software: languages and simulators (Pidd, 1992a). A
simulation language is a computer package that is general in nature but may have special features
for certain types of applications. A simulator is a computer package that allows one to simulate a
system, contained with a specific class of systems, with little or no programming. Perhaps the
most important feature for a simulation package to have is modelling flexibility. If the simulation
package does not have the necessary capabilities for a particular application then the system must
be approximated, resulting in a model with unknown validity (Law and Kelton, 1991).
The bulk of current model development uses high level programming languages as the basis
for bespoke design and construction (Paul, 1991). Market demand for software of this kind is
generally insufficient to make investment in these methods worthwhile. Models are relatively
unique developments. The type of application is likely to play a major part in determining the
features of the software to be used to write a simulation model and to run the simulation. If the
application being considered is entirely novel then the analyst may have no option but to write a
program from scratch, either in a general-purpose language or in a simulation language. But in
any event, it is becoming increasingly important to consider the anticipated end-user of the
simulation.
13 Human-Computer Interfaces
Only a small number of computer systems today are designed to run autonomously. Most of them
are interactive systems in which human users and computers interact through a user interface (UI).
The success of a computer system is often dependent on how easily the user can learn to use the
user interface. Today, the user interface is the first thing many people ask about when discussing
a new software application. Before the 1970s there were relatively few scientific and behavioural
studies of user interfaces. By the late 1970s and early 1980s numerous corporations were joining
IBM and Xerox in mounting major efforts to study and improve the human factors of computing
systems (Baecker and Buxton, 1987). Work also began on the academic front In the 70s and 80s
there were a series of forums for technical discussion, interchange, and publications among
members of the profession.
J. Kuljis User Interfaces and Discrete Event Simulation Models Page 5
Chapter 1: Introduction
To users, the interface is the system (Hix and Hartson, 1993). Computer systems often lack
good user interfaces for a variety of reasons, including the lack of a good user interface design
methodology and the lack of good tools to implement a user interface. An interface is often the
single most important factor in determining the success or failure of a system (Larson, 1992). It is
also one of the most expensive. Smith and Mosier (1984) conducted a survey of people concerned
with information systems design who on average estimated that 30 to 35 percent of operational
software is required to support the user interface. Bobrow et al. (1986) claim that the user
interface often constitutes one third to one half of the code of typical knowledge-based systems.
This claim is reinforced by Myers and Rosson (1992) who argue that anywhere from an average
of 48% to a maximum of nearly 100% of the code for an interactive system is now used to
support the user interface.
Human-computer interaction concerns itself with the domain of interaction between humans
and computers, and all the issues associated with that activity: the interaction itself (as a process)
and knowledge about that interaction. The area has been variously labelled:
• Human-Computer Interface (HCI)
• Man-Machine Interface (MMI)
• Human-Systems Interface (HSI)
• Computer-Human Interaction (CHI)
There is no agreed upon definition of the range of topics which form the area of human-
computer interaction. The following definition is one from ACM SIGCHI (1992):
Human-computer interaction is a discipline concerned with the design, evaluation
and implementation o f interactive computing systems for human use and with the
study o f major phenomena surrounding them.
Benyon and Murray (1988) make an important distinction between the terms Human-
Computer Interaction and Human-Computer Interface :
Interaction includes all aspects o f the environment such as the working practices,
office layout, provision o f help and guidance, and so on.
J. Kuljis User Interfaces and Discrete Event Simulation Models Page 6
Chapter 1: Introduction
The interface is the part o f a system with which the user comes into contact
physically, perceptually or cognitively.
There is an increasing recognition of the importance of organisational issues and the need for
user interfaces that properly supports organisations as well as individuals (Booth and Marsden,
1989). Traditionally, human-computer interaction has focused on how to design for data
availability - is the available data legible and accessible? It is the domain actor’s task to use the
available data to answer questions and detect and solve problems. The perspective of
representation design shifts emphasis away from the display of available data as signals to be
interpreted, towards a focus on communicating what is signified by the data (Woods and Roth,
1988). Frequently, what data are relevant depends on the state of domain or the intentions of the
problem solver. A second dimension along which representations can vary is whether the
information is presented as description (i.e., linguistic or digital form) or as depiction (graphic or
analogue form). The use of graphics in user interface displays is becoming more and more
important. Visualisation can be a powerful aid to comprehension and conceptualisation, as will be
shown in chapter 3 and chapter 4 on the case study, concerning the visual simulation system
CLINSIM.
Today the discipline of HCI is well established and as such it has its gurus and prophets, and
its more specialised fields of study. The major characteristics of the research is its inter
disciplinary nature. Most researchers in the field agree that the study of HCI spans over the
following disciplines: computer science, cognitive psychology, social and organisational
psychology, ergonomics and human factors, engineering, design, sociology, linguistics, and
artificial intelligence. Computer science provides knowledge about technology, and of software
tools and methods for facilitating design and development. Cognitive psychology provides
knowledge about the capabilities and limitations of users. Social psychology helps to explain the
structure and functions of organisations. Ergonomics and human factors knowledge ensure that
hardware and software is designed so that it does not damage users physiologically. As Terry
Winograd, one of the HCI gurus, said (in interview in Preece et al., 1994):
Human-computer interaction is the kind o f discipline which is neither the study o f
humans, nor the study o f technology, but rather the bridging between those two.
J . Kuljis User Interfaces and Discrete Event Simulation Models Page 7
Chapter 1: Introduction
So you always have to have one eye open to the question: what can the technology
do? How can you build it? What are the possibilities? And one eye open to the
question: what are people doing and how would this fit in? What would they do
with it? I f you lose sight o f either o f those, you fail to design w ell.... I think the
challenge is to really keep knowledge o f both the technology and the people
playing off against each other in order to develop new things.
Because human-computer interaction studies a human and a machine in communication, it
draws from supporting knowledge on both the machine and the human side. On the machine side,
techniques in computer graphics, operating systems, programming languages, and development
environments are relevant. On the human side, communication theory, graphics and industrial
design disciplines, linguistics, social sciences, cognitive psychology, and human performance are
relevant. And, of course, engineering and design methods need to be considered.
It is clear that the role of HCI in system design is to enhance the quality of the interaction
between humans and computer systems. In this dissertation we concentrate on the interface part of
the system or more specifically on the user interface parts of simulation systems. Our goal is
practical rather than theoretical: we want to know how to apply the theory to the problem.
1.4 Research Objectives
Research into Human-Computer Interfaces is now well established. The research spans across
many disciplines. As a consequence the theories and methodologies developed within HCI are
beginning to be used in a prescriptive way to develop new software products. This path resembles
very much the path of software engineering in general, that started off as an attempt to bring some
order to chaos and ended up as a doctrine. In this dissertation we examine the usability and
appropriateness of such approaches when dealing with software development, particularly the
development of modelling systems.
The aim of this dissertation is to examine user interfaces for discrete event simulation. In
particular, to investigate issues that influence ‘usability’ of simulation systems. There is no
generally agreed defmition of usability. A definition of usability proposed by the International
J. Kuljis User Interfaces and Discrete Event Simulation Models Page 8
Chapter 1: Introduction
Standards Organization (ISO) and listed in Booth (1989) states: “The usability of a product is the
degree to which specific users can achieve specific goals within a particular environment;
effectively, efficiently, comfortably, and in an acceptable manner.” This definition does not
explicitly specify operational criteria that might lead to an understanding of what we should
evaluate. In this dissertation we use a more operational definition which is given by Shackel
(1991) who suggests that any system should have to pass the usability criteria of effectiveness,
leamability, flexibility, and user attitude. Usability dimensions should be captured such that they
can readily be translated into meaningful quantitative statements (Shackel, 1991):
• Effectiveness: the required range of tasks, completed at a specified level of
performance, within a certain time (i.e. speed, accuracy) by some required percentage
of the specified target range of users within some required proportion of the range of
usage environments.
• Leamability: within a certain specified time, relative to the beginning of user training,
based upon some specified amount of training and user support, within some specified
re-leaming time each time for intermittent users.
• Flexibility: with flexibility allowing adaptation to some specified percentage variation in
tasks and/ or environments beyond those first specified.
• Attitude: within acceptable levels of human cost in terms of tiredness, discomfort,
frustration, and personal effort so that satisfaction causes continued and enhanced usage
of the system.
Particular attention in the research is therefore also placed on investigating issues related to
interaction styles, interaction objects, screen layout design, navigation through interfaces, user
support and assistance. This could result in more awareness among the simulation community of
the importance to provide user interfaces that better match the needs specific to the domain of
simulation modelling. This could lead to user interfaces that better support users in simulation
model developments, and hence achieve a reduction in the amount of time needed to learn
simulation systems, support retention of learned concepts over time, reduce the number of errors
during interaction, reduce the amount of time and effort needed for model developments, and
provide greater user satisfaction.
J. Kuljis User Interfaces and Discrete Event Simulation Models Page 9
Chapter 1: Introduction
To accomplish these objectives, we conducted an examination of several representative
simulation system. We assessed the usability of their user interfaces using Shackel’s (1991)
definition of usability. The usability evaluation was carried out using structured walkthrough
(Booth, 1989), i.e. we worked through a series of tasks the user might be expected to perform
looking for sources of potential difficulties. We have based the examination on simulation
software for personal computers partly because the issues of interaction are not dependent on the
computer platform and partly because the PC platform predominates among commercial
simulation systems. Therefore, the results and findings can be generalised across the whole
spectrum of simulation software regardless of the host system.
We furthermore carried out a case study for the Operational Research Division at the
Department of Health. This study involves the development of a visual simulation package that
models outpatient clinics. Visual simulation can be used to show interested parties how the clinic
appointment and operating policy can influence patient waiting times. The experience acquired
emphasised the importance of user interface issues, and helped identify the interaction deficiencies
in current simulation systems.
The major objective of the research is to give a critical evaluation of the theory underlying
existing user interfaces to simulation systems. The evaluation covers the basic features of user
interfaces in relation to adopted HCI theories. The working hypothesis is that the HCI theories
have evolved as a consequence of empirical experience and that this is always going to be the
case.
1.5 Research Methods
While conducting research for this dissertation we have used several research methods. The
methods used are classified by Galliers (1992) as: the subjective/augmentative approach, the case
study approach, and the descriptive/interpretative approach.
We conducted a subjective evaluation study of user interface capabilities for several
representative simulation systems. The subjective/augmentative approach (Galliers, 1992) is
creative research based more on opinion/speculation than observation, thereby placing greater
emphasis on the role/perspective of the researcher. It can be applied to the existing body of
J. Kuljis User Interfaces and Discrete Event Simulation Models Page 10
Chapter 1: Introduction
knowledge (reviews) as well as to actual/ past events/ situations. It is useful approach in building
theory that can subsequently be tested, and for the creation of new ideas and insights. Therefore it
contributes to cumulative knowledge. However, it is recognised that the researcher will interpret
what is being studied in a particular way. The weaknesses of this research approach is the
unstructured and subjective nature of the research process, and therefore the likelihood of biased
interpretations.
We carried out a case study at the Department of Health. The study involved the development
of a run time visual simulation package to be used by system analysts in the health service to
model out-patient hospital clinics. Case studies are a common approach to information systems
research in the real world. The strength of the case study approach (Galliers, 1992) is that it
enables the capture of reality in considerably greater detail, than is possible with many other
approaches (i.e. laboratory experiments, field experiment, surveys). Even though there are
problems associated with making generalisations from individual case studies, single case studies
are helpful in developing and refining generalisable concepts and frames of reference.
We conducted an extensive literature survey on HCI in general, on user interface
characteristics of existing simulation software, and on user interfaces to simulation systems.
Based on the literature search, the case study experience, and the study of user interface
characteristics of simulation systems, we came to some general findings that can be applied in
future research. This form of research is known as descriptive/interpretative (Galliers, 1992).
Descriptive or interpretative research can be focused on the literature or on past developments, in
addition to actual, current happenings. Significant advances in our knowledge, and our ability to
develop theory, can be made through an in-depth review of this kind in a particular aspect of our
subject matter. A thorough review of past research/developments may not only lead to new
insights but also is more likely to ensure that subsequent research builds on past endeavours. The
strengths of this form of research lie in its ability to represent reality, following an in-depth self
validating process in which presuppositions are continually questioned and our understanding of
the phenomena under study is refined. The approach’s weaknesses include the problems the
reviewer faces in interpreting the results of research with which they may be unfamiliar.
J. Kuljis User Interfaces and Discrete Event Simulation Models Page 11
Chapter 1: Introduction
The research methods, then, consist of the above approaches intertwined as an interconnecting
set of mutually reinforcing methods.
1.6 Outline of the Dissertation
In this dissertation we describe research into user interfaces in relation to discrete event simulation
systems. We identify good practices and examine how these can be applied to improve the
usability of simulation systems. The dissertation is structured as follows.
In Chapter 1 we introduce some basic concepts in simulation modelling and in human
computer interaction. In Chapter 2 we expand on some of the ideas considered in Chapter 1 and
describe some of the simulation software and their user interface characteristics. In Chapter 3 we
present a case study which was carried out on a real problem. The case study exemplifies the
‘classical’ approach that appears to be taken as regards visual simulation interfaces. We describe
the problem in detail and describe the design and implementation of simulation model. In Chapter
4 we make a critical analysis of the case study introduced in Chapter 3. We critique the case study
development on the basis of both the development experience, and its relationship to any relevant
HCI theory.
In Chapter 5 we give an overview of the most influential theories in HCI and their contribution
to the design of more usable computer system, and try to put this research into the context of
simulation systems. In Chapter 6 we make some general observations about user interface to
simulation systems, and make some recommendations on possible improvements. Finally, in
Chapter 7 we present the conclusions and areas for further research.
1.7 Summary
In this chapter we provide the introductory information with respect to this dissertation. We give
the background to the research presented in this dissertation, and establish the objectives of this
research.
J. Kuljis User Interfaces and Discrete Event Simulation Models Page 12
Chapter 2: User Interfaces to Discrete Event Simulation Systems
2.1 Introduction
In this chapter we consider some of the existing simulation systems in terms of human-computer
interaction. To start with we are concerned with the technological aspects of interaction. That
means that we are basically examining the means of interaction in terms of the hardware necessary
to interact with a particular simulation system, and the mode of interaction, i.e., the interface
dialogue style. The following section provides the basis for discussion and serves as a reference
point to user interfaces. This is necessary to put into context the issues that are raised in the
section on simulation systems that follows. It gives the basic definitions and terminology in the
area of human-computer interaction and provides an overview of major concerns of the area in
general.
2.2 Basic Concepts in Human-Computer InteractionIn this section we consider the nature of the interaction style of human-computer interaction.
Throughout the history of computing new interaction devices and technologies have been
developed. This is to be expected given the initial limited range of tools that could be used for
input and output. Indeed, there still appears to be a need for a greater variety of devices and
technologies for interaction. Interaction styles are very much dependent on the available
technology. The availability or absence of a particular interaction device can enable or prevent the
application of a particular interaction style. For example, the wide availability of pointing devices
such as mice and pens resulted in the wide use of mouse driven interaction. This section
demonstrates the current complexity involved in HCI, even though the history and development of
HCI is still relatively young.
J. Kuljis: User Interfaces and Discrete Event Simulation Models Page 13
Chapter 2: User Interfaces to Discrete Event Simulation Systems
2.2.1 Interaction Devices
In order for the user to be able to interact with the computer and its software there must be some
aspect of hardware with which the user can interact; these form channels enabling the user to
access the software and the system to communicate information to the user. These elements of the
hardware include all the interactive input and output devices, and are described bellow based on
Booth (1989).
Input devices
An input device might be simply thought of as any instrument, apparatus or mechanism that can
be used to enter information into a computer. The purpose of HCI research into development and
refinement of input devices is to create input devices that maximise the advantages of human
physical and cognitive characteristics, and so promote efficient, reliable and even pleasurable input
to a system (Booth, 1989). Input devices include keyboards, pointing devices, voice-recognition
systems, and other input devices that have been experimentally developed and tested, but are not
yet in wide commercial use such as: handwriting recognition devices, gesture recognition devices,
foot-operated computer input devices, eye trackers, and data gloves.
The keyboard
The keyboard is one of the oldest forms of input devices, and for most tasks is still the most
efficient. The primary mode of textual data entry is still the keyboard. Keyboard design issues
include hardware operating characteristics, such as: the shape of keys, the force required to
depress them, and key layout. Keyboard operating characteristics include: keyboard thickness,
keyboard angle, the palm rest area, keytop size, key centre spacing, key force range, key
displacement range, keytop surface, activation feedback, and keytop surface finish. Current
keyboards generally permit only one keypress at a time, although dual keypresses (SHIFT plus a
letter) are used to produce capitals and special functions (CTRL plus a letter).
Most keyboards can be thought of as containing one or more major groups of keys: alpha
keys, cursor keys, numeric keypads, and function keys. Beyond the letters, many debates rage
about the placement of additional keys and numbers. Telephones have 1-2-3 keys on the top row,
J. Kuljis User Interfaces and Discrete Event Simulation Models Page 14
Chapter 2: User Interfaces to Discrete Event Simulation Systems
but many calculators place 7-8-9 keys on the top row. Studies have shown a slight advantage for
the telephone layout (Lutz and Chapanis, 1955; Deininger, 1960), but most computer keyboards
use the calculator layout. Many keyboards contain a set of additional function keys for special
functions or programmed functions. These keys are often labelled F1...F10 or PF1..PF24. Users
must remember the functions, leam about them from the screen, or consult an attachable plastic
template. This strategy attempts to reduce user keystrokes by replacing a command name with a
single keystroke and therefore the association of a function with a key is vital. Consistent key use
is also very important. Many systems confuse users with inconsistent key use. For example, the
HELP key varies from FI to F9 to F12 on some systems. The placement of function keys is
important if the task requires users to go from typing to using function keys.
Pointing devices
Most computer keyboards have four special cursor keys for moving the cursor up, down, left,
and right through text, menu options, fill-in fields, or other display objects. These keys are
typically labelled with arrows, and are sometimes called ‘arrow keys’. Traditional computer
systems employed only cursor keys as a mechanism for locating the input area and pointing to
desired display objects. More recently, alternative pointing devices have become popular. When a
screen is used to display information it is often convenient to point at and thus to select an item.
This direct manipulation approach is attractive because the users can avoid learning commands,
reduce the chance of typographic errors on a keyboard, and keep their attention on the display.
Pointing devices are applicable in six types of pointing tasks:
• Select: The user chooses from a set of items.
• Position: The user chooses a point in a one-, two-, three-, or higher- dimensional
space.
• Orient. The user uses direction in a one-, two-, three-, or higher- dimensional
space.
• Path: The user rapidly performs a series of position and orient operations.
• Quantify: The user specifies a numeric value.
• Text: The user enters, moves, and edits text in a two-dimensional space.
In the past, the keyboard was used to perform all these tasks, but novel devices have been
created that permit users to perform these tasks more rapidly and with fewer errors. These devices
J. Kuljis User Interfaces and Discrete Event Simulation Models Page 15
Chapter 2; User Interfaces to Discrete Event Simulation Systems
can be grouped into those that offer direct control on the screen surface and those that offer
indirect control away from the screen surface. Direct pointing devices are lightpens, touchscreens,
and pens or styluses. Indirect pointing devices are mice, trackballs, joysticks, graphic tablets, and
touchpads. When considering human factors, variables of interest in judging each pointing
concept are speed of motion for short and long distances, accuracy of positioning, error rates,
learning time, and user satisfaction. Other variables are cost, durability, space requirements,
weight, left- versus right-hand use, and compatibility with other systems. The conventional
wisdom is that pointing devices are faster than keyboard controls, such as cursor-movement keys,
but this result depends on the task. Pointing devices are efficient for accomplishing tasks that
require spatial manipulation. The keyboard is more efficient for sequential tasks.
Output devices
An output device might be simply thought of as any instrument, apparatus or mechanism that can
be used to present information to the user. The purpose of the development and refinement of
output devices is to create output devices that maximise the advantages of human physical and
cognitive characteristics, and so to promote efficient, reliable and even pleasurable interaction
between humans and computers (Booth, 1989). Output devices include: visual display terminal
(VDT) or visual display unit (VDU) screens, voice-synthesis systems, and other output devices.
VDU screen
The VDU has become the primary source of feedback to the user from the computer. The
widespread use of VDUs has led designers to develop a variety of technologies with hundreds of
special-purpose features. International standards are beginning to appear. Health concerns such as
visual fatigue, stress, and radiation levels are being addressed by manufacturers and government
agencies. Screen design issues include hardware operating characteristics such as resolution,
flicker, and glare. For many applications, monochrome displays are adequate, and even preferred,
especially if monochrome display has a higher resolution than does the colour display.
Monochrome displays are produced by several technologies. Each display technology has
advantages and disadvantages with respect to: size, refresh rate, capacity to show animation,
resolution, surface flatness, surface glare from reflected light, contrast between characters and
background, brightness, flicker, line sharpness, character formation, and tolerance for vibration.
J. Kuljis User Interfaces and Discrete Event Simulation Models Page 16
Chapter 2: User Interfaces to Discrete Event Simulation Systems
Colour displays can make video games, simulation, CAD, and many other applications
programs more attractive and effective for users, but there are real dangers of misusing colour.
Colour images are attractive to the eye, and colour coding of screen objects can lead to rapid
recognition and identification. The excessive or inappropriate use of colour can inhibit
performance and confuse the user. Software for creating colour graphics images is rapidly
becoming more effective. Dramatic progress in computer graphics has led to increasing use in
motion pictures and television.
Printers
Although there has been a good deal of research into how best to represent information to users on
VDUs, displaying information on a screen is still considered to be inferior in several ways to
presenting information on paper. Paper documents can be easily copied, mailed, marked, and
stored. There is a variety of different printer technologies: dot-matrix printers, daisy-wheel
printers, inkjet printers, thermal printers, laser printers, impact line printers, colour printers, and
plotters. The choice of a printer depends on many factors. Shneiderman (1992) has produced a list
of criteria against which different types of printer might be considered: speed, print quality, cost,
compactness, quiet operation, use of ordinary paper, character set, variety of fonts and sizes,
highlighting techniques, support for special forms, and reliability.
2.2.2 Interaction Styles
There are a number of ways in which the user can communicate with the computer system. At one
extreme is batch input, in which the user provides all information to the computer at once and
leaves the machine to perform the task. This approach does involve an interaction between the
user and a computer but does not support many tasks well. At the other extreme are highly
interactive input devices and paradigms, such as direct manipulation and the applications of virtual
reality. The user is constantly providing instruction and receiving feedback. The latter are the
types of interactive system in which we are particularly interested.
Interaction can be seen as a dialogue between the computer and the user. The choice of
interface style can have a profound effect on the nature of this dialogue. Here we discuss the most
common interface styles and note the different effects these have on the interaction. There are a
J. Kuljis User Interfaces and Discrete Event Simulation Models Page 17
Chapter 2: User Interfaces to Discrete Event Simulation Systems
number of common interaction styles (dialogue styles, interface styles) including: windows,
menus, fill-in forms and spreadsheets, boxes, command languages, and graphical interfaces. It is
not always possible to draw clear, unambiguous borders between these dialogue styles. Most user
interfaces employ more than one dialogue style, and each may not appear in its most pure form.
Many of the interaction styles listed here are used in direct manipulation interfaces. In a direct
manipulation interface, the user performs the intended actions by immediately interacting with
interaction objects, rather than by indirectly describing the actions to perform. The central idea of
direct manipulation is:
• the visibility of objects and actions of interest
• rapid, reversible, incremental actions
• replacement of complex command-language syntax by the direct manipulation of objects
of interest
Because direct manipulation interfaces present tasks visually to the user, the effect of user
input is immediately and directly visible, without the need to run a program to produce the output.
Direct manipulation interfaces present task concepts visually, are easy to learn, are easy to retain,
encourage exploration, allow errors to be avoided, and permit high subjective satisfaction
(Shneiderman, 1992). However, such interfaces require more design and implementation effort
Windows
A window is a screen object that provides an arena for presentation of, and interaction with, other
interaction objects (Hix and Hartson, 1993). All interaction between a user and the system occurs
through a window. There are at least two kinds of windows: primary windows and secondary
windows. The primary window is the one through which all other windows in an application are
generated and usually the only window through which an application can be closed. A secondary
window is generated through a primary window. When multiple windows are open on the screen
at one time, generally only one is active - that is, it can accept user input. Multiple open windows
allow users to move back and forth between activities without losing their place. When the user’s
work is naturally fragmented, with many activities carried on simultaneously, windowing can help
support this work style in a way that traditional non-windowing systems cannot (Mayhew, 1992).
J. Kuljis User Interfaces and Discrete Event Simulation Models Page 18
Chapter 2:: User Interfaces to Discrete Event Simulation Systems
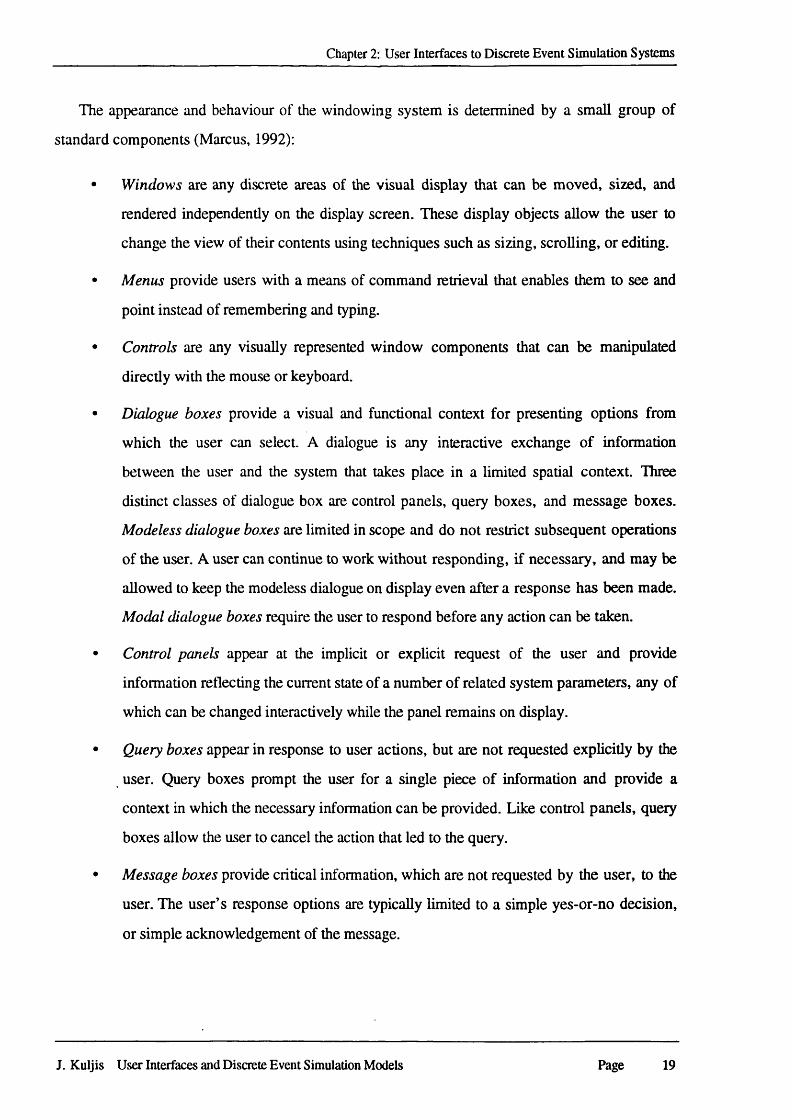
The appearance and behaviour of the windowing system is determined by a small group of
standard components (Marcus, 1992):
• Windows are any discrete areas of the visual display that can be moved, sized, and
rendered independently on the display screen. These display objects allow the user to
change the view of their contents using techniques such as sizing, scrolling, or editing.
• Menus provide users with a means of command retrieval that enables them to see and
point instead of remembering and typing.
• Controls are any visually represented window components that can be manipulated
directly with the mouse or keyboard.
• Dialogue boxes provide a visual and functional context for presenting options from
which the user can select. A dialogue is any interactive exchange of information
between the user and the system that takes place in a limited spatial context. Three
distinct classes of dialogue box are control panels, query boxes, and message boxes.
Modeless dialogue boxes are limited in scope and do not restrict subsequent operations
of the user. A user can continue to work without responding, if necessary, and may be
allowed to keep the modeless dialogue on display even after a response has been made.
Modal dialogue boxes require the user to respond before any action can be taken.
• Control panels appear at the implicit or explicit request of the user and provide
information reflecting the current state of a number of related system parameters, any of
which can be changed interactively while the panel remains on display.
• Query boxes appear in response to user actions, but are not requested explicitly by the
user. Query boxes prompt the user for a single piece of information and provide a
context in which the necessary information can be provided. Like control panels, query
boxes allow the user to cancel the action that led to the query.
• Message boxes provide critical information, which are not requested by the user, to the
user. The user’s response options are typically limited to a simple yes-or-no decision,
or simple acknowledgement of the message.
J. Kuljis User Interfaces and Discrete Event Simulation Models Page 19
Chapter 2: User Interfaces to Discrete Event Simulation Systems
The systems use a mouse and keyboard as the primary interaction devices. The mouse
provides an efficient means of accomplishing tasks that require spatial manipulation. The
keyboard is more efficient for sequential tasks.
Menus
A menu is a list of options from which the user selects the desired choice. In menu-driven user
interfaces, the primary form of interaction is a sequence in which the user is repetitively presented
with sets of choices and asked to select one or more from among them (Mayhew, 1992). Menu
selection is an attractive and convenient way of guiding users through a complex command
sequence. Menu selection is especially effective when users have little training, use the system
only sporadically, are unfamiliar with the terminology, and need help in structuring their decision
making process (Shneiderman, 1992). Effective menu-selection systems emerge only after careful
consideration of and testing for numerous design issues, such as: semantic organisation, menu-
system structure, number and sequence of menu items, selection of titles, prompting format,
graphic layout and design, phrasing of menu items, display rates, response time, shortcuts
through the menu for knowledgeable frequent users, on-line help, and selection mechanisms
(keyboard, pointing devices, touch screen, voice, etc.) (Norman, 1991).
Semantic organisation of items in an application requires the items to be classified into
categories. Hierarchical decompositions are appealing because every item belongs to a single
category. For computer menus, the categories should be comprehensible and distinctive so that the
users are confident in making their selections. Semantic organisation can be divided into the
following groupings: single menu, linear sequences and multiple menus, tree structured menus,
acyclic and cyclic menu networks. Single menus may have two or more items, may require two or
more screens, or may allow multiple selections. Single menus may pop up on the current work
area or may be permanently available.
The most common structure for menu interfaces is hierarchical. In such a tree structure, each
choice made determines which choices will be offered next, and the user might proceed along a
number of different pathways. Alternatively, menus can be structured linearly. In a linear menu
structure, alternative pathways do not exist. There is only one pathway, but at each point the user
must still make a selection from among a set of options. Finally, menus can also be networked. A
J. Kuljis User Interfaces and Discrete Event Simulation Models Page 20
Chapter 2: User Interfaces to Discrete Event Simulation Systems
network menu provides an option known as menu bypass that allows the user to jump directly
from one leaf or node in a hierarchical menu to another, without backing up along the pathway to
one leaf and then proceeding down the pathway to another leaf, that would be necessary in a
strictly hierarchical menu. Of the numerous possible kinds of menus Hix and Hartson (1993)
identify the following:
• Pull-down menus are usually found across the top of a window or screen. Only the
menu’s tide bar, which is always visible, takes up permanent screen space. A pull
down menu appears always in the same location on the screen when the user depresses
a mouse button over the menu title. Pull-down menus are used for access to major
functionality of a system.
• Cascading (hierarchical) menus look and behave much like a sequence of pull-down
menus. When the user depresses the mouse button over the title of the first menu in the
sequence, that menu appears. The user may then move the cursor down to select a
choice from that menu, leading to the appearance of another menu, usually to the right
of the first one, from which the user may make another choice, and so on. While such a
series of menus is a good way to organise a hierarchical menu structure and to provide
further selection detail, users sometimes have trouble with eye-hand co-ordination of
cascading menus that go more than three levels deep.
• A pop-up menu can appear in different places on the screen, determined by the current
location of the cursor when the user depresses a specific mouse button. There is no
visual cue to the availability of a pop-up menu. Pop-up menus are often used to select
functions and parameters. The set of menu choices can be context dependent, based on
the screen or window location of the cursor when the user requests the pop-up menu.
• An option menu looks like a field (e.g., in a form), with its current value visible. Other
values appear, in a list menu, when the user depresses the mouse button over the visible
field. The user can then move the cursor up or down to select any one choice from the
list menu. This way the user is prevented from typing an incorrect value into a field that
has a known set of possible valid values.
J. Kuljis User Interfaces and Discrete Event Simulation Models Page 21

Chapter 2: User Interfaces to Discrete Event Simulation Systems
• A toggle menu, like an option menu, looks much like a field, with its current value
visible, but a toggle menu rotates through all possible choices, one at a time, as the user
clicks the mouse button over the field in which a selection of the menu appears. The
user makes a selection simply by leaving the desired value visible in the field.
• In a push-button menu, choices are distributed over physically separate buttons, and the
buttons are typically visible at all times. Some of the more common push buttons that
appear throughout many interfaces include ‘cancel’, ‘ok’, ‘quit’, ‘exit’, and ‘help’. On
a given bank of push buttons, one button is generally chosen as the default and has a
different appearance from the others (e.g., bold outline, an extra border to look as if it
is already pressed in). The default button can usually be chosen by pressing the ‘Enter’
or ‘Return’ key.
• Radio-button menus offer choices that are exhaustive and mutually exclusive. The user
makes exactly one choice from a set of two or more choices, usually by clicking with
the mouse. The current choice is indicated by a visual cue (e.g., a small darkened circle
or square beside the choice). Radio-button menus are often found in dialogue or
property boxes.
• Check-button menus offer choices that are not mutually exclusive. The user can make
one or more choices from a set of two or more possibilities, again by clicking with the
mouse. The current choice is indicated by a visual cue. Like radio-button menus, check-
button menus are often found in dialogue or property boxes.
• Pie menus display choices in a circular or semicircular arrangements of labelled pie
wedges. Pie menus minimise mouse movement but are only useful for a small to
medium-sized number of selections, otherwise there is not enough space to display
labels for the choices in the wedge. When used for patterns or colours, for example, the
pattern or colour itself can serve as a label.
• Palette, or iconic, menus are menus in which the choices are represented as graphical
icons, rather than as words, on what are essentially push buttons grouped together. The
choices are usually mutually exclusive. They are often found in graphical editors and
are used for selecting self-labelling visual choices, such as colours, patterns, shapes,
and so on.
J. Kuljis User Interfaces and Discrete Event Simulation Models Page 22
Chapter 2 : User Interfaces to Discrete Event Simulation Systems
• Embedded menus are found in what are more commonly called “hypertext” or
“hypermedia”. In a screen display of text/ or graphics, some of the objects are
designated as selectable (e.g., by highlighting), usually with a mouse click. Upon
selection of a highlighted word or icon, the user can navigate to a different screen.
Sequences of these connections can be used to link related information together.
• Dynamic menus contain choices that are runtime dependent The choices vary, based on
runtime conditions and / or values. A simple example of a dynamic menu is one in
which currently unavailable choices are greyed out so that the user cannot select them.
The content of the menu cannot be known until the request is processed.
With modem graphical user interfaces, menu selection by mouse clicks becomes the common
method of working with pull-down and pop-up menus plus the dialogue boxes containing radio
buttons, check boxes, text-entry fields, and scrollable lists of choices. The key issues are how to
show where selection is possible, which item has been selected, whether de-selection is possible,
and how activation is invoked. Spatial placement of items can also be helpful in showing
relationships among items and in guiding users through a sequence of selections. Boxes around
items, white spaces, varying font sizes, and use of colour can help organise the display. Other
important issues related to the menu selection cover response time and display rates, moving
through menus, menu screen design, selection mechanisms, and embedded menus. Users can
become very proficient at menus. Menus can, however, be overused; too many menus may slow
down frequent users, especially if the hardware cannot support very rapid menu choices. Menus
also require a lot of screen space when they are displayed.
Fill-in forms
Fill-in form interfaces are used primarily for data entry but can also be useful in data retrieval
applications. The user is presented with a display resembling a paper form, with slots to fill in.
Spreadsheets are a sophisticated variation on form fill-in (Dix et al., 1993). The user can enter and
alter values and formulae in any order and the system will maintain consistency amongst the
values displayed, ensuring that all formulae are obeyed. The user can therefore manipulate values
to see the effects of changing different parameters. There are several types of values for a field in a
form (Hix and Hartson, 1993), including:
J. Kuljis User Interfaces and Discrete Event Simulation Models Page 23
Chapter 2: User Interfaces to Discrete Event Simulation Systems
• User typed strings can be either invalidated or validated. In an invalidated field, the user
can type any free-form character string, and it will be accepted by the system. In a
validated field, the user must type in a string with a specific syntax. If the user does not
follow this prescribed format, the string will not be accepted by the system, and the
user will need to try again. In a validated field, the designer should indicate the required
syntax visually.
• In fields with user choices from a list, all allowable choices can be itemised. Use of an
option or toggle menu to present the choices to the user will reduce errors due to typing
and also remove the need for the user to remember all possible values for the field.
• Some fields have logical default values for fields. The user should never have to enter
values in a field for which a reasonable default value can be obtained from the system.
• Required values in a form have to be filled with valid values by the user before the form
can be processed. Optional values are those that can remain empty. On a form, required
fields should be distinguished from optional fields by their appearance.
• Fields for dependent values in a form need to be filled in only if another field has a
particular value entered. The system can automate and enforce these inter field
dependencies.
Boxes
A box is a rectangular, delineated screen area that is used for messages, text entry, commands,
selection, and user control. Many kinds of boxes appear as a result of user actions (e.g., list
boxes), while others (e.g., message boxes) are displayed by the system, to inform the user about
a current situation. There are several kinds of boxes, including (Hix and Hartson, 1993):
• List boxes can be used when the choice list is quite long and /or variable in length. The
content of a list box is usually dynamic; the system can add choices to the list, based on
runtime actions and results. A list box usually has a vertical and often a horizontal scroll
bar, so that the user can navigate in all directions within the box. The user makes a
selection by clicking the mouse over the desired choice.
J. Kuljis User Interfaces and Discrete Event Simulation Models Page 24
Chapter 2: User Interfaces to Discrete Event Simulation Systems
• Entry boxes allow users to enter text; they usually have basic text-editing functions built
in. An entry box can be a single line or a multiple-line area. It can be both vertically and
horizontally scrollable.
• Message boxes are typically used for presenting information to the user, showing
progress, asking the user a question, giving the user a warning, or requesting some
action by the user. Message boxes are effective in focusing the user on a situation
needing attention before a task can continue. Modal (pre-emptive) message boxes are
often used to force this kind of user attention.
• Dialogue boxes are used to group functions for several related user tasks, as opposed to
a menu which allows a user to perform only one function at a time. A dialogue box is a
composite interaction object that can contain other interaction objects, such as lists,
buttons, boxes, text-entry fields, valuators, and so on. A dialogue box is typically
displayed as part of a task sequence, often in a response to a choice from a pull-down
menu or an accelerator-key action. Dialogue boxes are often movable by a user but are
rarely resizable.
Typed-command languages
The command line interface was the first interactive dialogue style to be commonly used and, in
spite of the availability of menu-driven interfaces, it is still widely used. It provides a means of
expressing instructions to the computer directly, using function keys, single characters,
abbreviations or whole word commands. In some systems the command line is the only way of
communicating with the system; more commonly today it is supplementary to menu-based
interfaces providing accelerated access to the system’s functionality for experienced users (Dix et
al., 1993). Command languages, which originated with operating-systems commands, are
distinguished by their immediacy and by their impact on devices or information. Users issue a
command and watch what happens. If the result is correct, the next command is issued; if not,
some other strategy is adopted. Command languages are distinguished from menu-selection
systems in that their users must recall notation and initiate action. Command-language users are
often called to accomplish remarkable feats of memorisation and typing. Users have to learn the
semantics and syntax, but they can initiate rather than respond, rapidly specifying actions
involving several objects and options. Command languages can be attractive when frequent use of
J. Kuljis User Interfaces and Discrete Event Simulation Models Page 25
Chapter 2: User Interfaces to Discrete Event Simulation Systems
a system is anticipated, users are knowledgeable about the task domain and computer concepts,
screen space is at a premium, response time and display rates are slow, and numerous functions
that can be combined in many ways are supported (Shneiderman, 1992).
Graphical interfaces
Any user interaction that has windows, buttons, boxes, icons, and so on, is commonly called a
graphical user interface, or GUI. They have also been called “WIMP” (windows, icons, menus,
and pointers) and “NERD” (navigation, evaluation, refinement, and demonstration interfaces). All
the interaction styles that we have covered so far, with the exception of typed-command
languages, could be classified as GUIs. The trend in current computer applications is toward
asynchronous, multi-threaded dialogue (event-based dialogue) where many tasks (threads) are
available to the end-user at one time, and the sequencing of each thread is independent of the
others (Hartson and Hix, 1989). This trend is one of the most significant phenomena in the field
today and is exemplified by the Apple Macintosh personal computer and the success of Microsoft
Windows and Windows applications. This trend is followed by many simulation systems as well.
The trend in using graphical user interfaces is definitely upwards. A survey conducted and
reported on by a firm of independent research analysts in the U.S. claims that productivity of GUI
users does increase (Wright, 1991). Klinger (1991) argues that visual interfaces upgrade a
human’s ability to deal with computer data, but argues that information access is less free due to
the complexity inherent in dealing with computer interfaces and that the gain in facility or learning
they offer occurs at a significant increase in user interaction time. At the same time, developers’
tools are following this trend as well. More and more tools use visual languages for human-
computer interaction. The benefits of such systems are widely agreed (Shneiderman, 1983;
Tanimoto and Glinert, 1986; Potosnak, 1988).
Graphical interfaces can be extremely useful in the development of sophisticated training and
simulation environments. Users of such interfaces are able to obtain a much more immediate
impression of what is happening to the object or system in question by looking at a graphical
representation than by looking at a textual or symbolic representation of a mathematical model.
There is a broader use of graphics in user interfaces and that is the use of visual representation,
rather than textual or numeric representations, to communicate with a user. Graphics are important
J. Kuljis User Interfaces and Discrete Event Simulation Models Page 26
Chapter 2: User Interfaces to Discrete Event Simulation Systems
in user interfaces, to represent both input by a user to the application and output from the
application to a user. Graphical objects can be, and often are, shared between the user and the
system, and the actions of both can have an effect on those objects. Graphics promote exploration
and the understanding of complex domains. There are many kinds of graphical interfaces. We will
mention several that are relevant to the domain of simulation systems.
• Data and scientific visualisation, one of the earliest uses of graphics in user interfaces,
includes graphs, charts, histograms, and various kinds of elaborate screen images.
Numerous application areas are making heavy use of visualisation techniques (e.g.,
medical imaging of the interior of the human body, fluid flow, weather patterns, heat
transfer).
• Visual databases facilitate techniques for navigating and browsing through a visual,
rather than common textual, representation of a database. Digital images and/ or
computer-generated images can be represented.
• Animation can represent the output of simulation as it changes over time. It provides an
excellent medium for producing training simulators that can be very valuable for
training in dangerous or inaccessible domains.
• Full-motion video, and the audio that typically accompanies it, can be combined with
other interaction styles in an interface. Video gives the most realistic illustration of real-
world activities and, like animation, can be used especially effectively for training.
• Multimedia and hypermedia involve the fusion of graphical, audio, and video media,
often linked in an associative pattern. Multimedia user interfaces consist of more than
one medium, typically video and/ or animation and other interaction styles. Hypermedia
interfaces provide links for a user to navigate among interaction objects, such as data,
records, help information, documents, and even idea and concepts, in a highly flexible
fashion. This user navigation is a central concern in the design of these kinds of
interfaces.
There is evidence that different people have different cognitive styles. It may be that
preferences will vary by user and by tasks. Icons are often used in painting programs to represent
the tools or actions, whereas word processors usually have textual menus for their actions. This
difference appears to reflect the differing cognitive styles of visually and textually oriented users,
J. Kuljis User Interfaces and Discrete Event Simulation Models Page 27
Chapter 2: User Interfaces to Discrete Event Simulation Systems
or at least differences in the tasks. Maybe, while working on visually oriented tasks, it is helpful
to stay visual by using icons, whereas, while working on a text document, it is helpful to stay
textual by using textual menus. Deciding between icons and text depends not only on the users
and the tasks, but also on the quality of the icons or the words that are proposed.
2.2.3 User Support and Assistance
User documentation is part of the user interface (Shneiderman, 1992; Mayhew, 1992; Cox and
Walker, 1993; Dix atal., 1993; Preece et al, 1994; Lindgaard, 1994). There are various types of
user support materials which commonly accompany software package sold in the market place.
Often it is a user’s first encounter with a system. Users may form impressions of the usability of a
system by reading the manual or accessing on-line help or a tutorial. The quality of the user
documentation determines in large part both the perception of, and the actual ease of learning and
use of the system. On the other hand, good documentation and/ or a good on-line help are no
substitute for a poor user interface. In all kinds of user support, the importance of effectiveness is
paramount for determining the value of the system (Lindgaard, 1994). For example, a help system
that fails to assist users in trouble is useless as a form of user support. Similarly, user
documentation in which the information a user needs cannot readily be located, correcdy
interpreted, or easily applied to a given situation will prove extremely unpopular. Finally, a
tutoring system that does not enable users to leam and transfer the product of learning into the
environment the system is supposed to prepare the learner for, is not at all effective.
On-line help
Most contemporary user interfaces provide at least some of the following on-line information for
user assistance (Preece et al., 1994):
• Help messages generated by selecting a desired object.
• Context-sensitive help built into application system states or dialogue boxes.
• Generic help text, usually limited in length, available through a help command, menu
bar item, function key, or icon.
J. Kuljis User Interfaces and Discrete Event Simulation Models Page 28
Chapter 2: User Interfaces to Discrete Event Simulation Systems
• Extended help screens, accessible through a ‘More’ button, an Index, or Table of
Contents. These help items can be linked together to form a hypertext.
• Extensive written documentation available on-line. This is typically authored so that it
can be read like a book.
Advantages of on-line documentation are that, unlike hard copy, it cannot be lost or damaged,
it does not require desk space, it is faster and cheaper to update than hard copy, and is potentially
faster to access and navigate in (Shneiderman, 1992). In a well designed help system, the user can
control the level of information detail, which it is not true in a manual. Disadvantages of on-line
help when compared to hard copy manuals are that text on the screen is not as legible as printed
material and paging is slower. When interacting with a computer system, users encounter
problems sooner or later from which they cannot recover without assistance. One of the main
objectives of ‘help systems’ is to assist users in trouble. In order to achieve this effectively, the
help system designer would need to understand when, how, and why users get stuck during an
interactive session. The more accurately user problems have been correctly identified, captured,
and addressed by the help information, the more successful and hence effective the help facility
should be. Typical questions expected that on-line help should tackle are (Preece et al., 1994):
• Goal exploration: What can I do with this program?
• Definition and description: What is this? What is it for?
• Task achievement: How do I do this?
• Diagnostic: How did that happen?
• State identification: Where am I?
The usability of a help system is at least related to the degree to which a user can readily
recover from problems and thus is reflected by the extent to which system trouble spots are
addressed. Help systems often fail to fulfil their purpose of assisting users in trouble. Problems
with help information have been found to relate to the amount of information provided, the way it
is presented, or the vocabulary used. Lindgaard (1994) lists the reasons that account for the failure
of help systems to assist users into three categories:
• Problems with access to help information and/ or exit methods.
J. Kuljis User Interfaces and Discrete Event Simulation Models Page 29
Chapter 2: User Interfaces to Discrete Event Simulation Systems
• Problems with the actual information provided.
• Difficulties of users to recognise their problem.
Many menu systems are organised hierarchically and even when users can rely on recognition
of terms used elsewhere in the system, and select options from menus, they do experience
difficulties navigating through such systems. Two methods can be applied for overcoming
navigational user problems: one is to reduce the menu hierarchy to as few levels as possible
(increase menu breadth over depth), and the other is to show which options will be coming up at
the next level of the menu hierarchy. In many systems, access to help information is provided by
user issued commands. In order to obtain the right information, the user must know which terms
are allowed, what the allowed terms refer to and what information the user needs to solve a given
problem, access certain data, or recover from a particular error. It is unlikely that the user new to a
given system will be familiar with a system’s commands. The full range of commands presented
on a list of keywords together with an explanation of the function associated with each command
should be provided.
Printed manuals
User manuals are often poorly designed. They are intimidating, full of technical jargon, hard to
navigate in, and difficult to read (Mayhew, 1992). Writing manuals was often left to the most
junior and inexperienced member of the project team at the end of the project (Lindgaard, 1994).
As a result, the manuals were often poorly written, were not suited to the background of the
users, were delayed or incomplete, and were tested inadequately (Shneiderman, 1992).
Alternatively, different chapters in user manuals may have been written by different people who
use a variety of expressions, differ in writing style and discuss the topics at different levels of
depth. The resulting user manual is thus a jumble of mixed ideas and metaphors which lack
consistency in style, emphasis, layout, and terminology between chapters (Lindgaard, 1994). The
focus of many manuals tends to be on technical matters such as system structure, mechanics or
idiosyncratic smart-moves in the software, and outlining the methods underlying the various
operations rather than helping the user to complete certain user-relevant task. From the user’s
perspective, research has shown that users often do not know how to formulate questions. One
way to assist users in asking more precise questions is to provide them with trouble shooting tools
J. Kuljis User Interfaces and Discrete Event Simulation Models Page 30
Chapter 2: User Interfaces to Discrete Event Simulation Systems
that allude them to different problems that might be the cause of currently experienced difficulties
(Lindgaard, 1994).
User manuals can be grouped into four types:
• Tutorials are meant to be read from cover to cover, and they are organised as a course
or training program would be. Tutorials are best for true novice users who may know
little about the semantics of the application (what the system can do) and probably
nothing about the syntax of the human interface (how to do anything in particular on the
system).
• Reference manuals are aimed at experts. A reference manual is organised to allow quick
retrieval of specific syntactic information. It provides complete information on all
system functions.
• Quick reference summarise information on a small subset of the most important or most
frequendy used functions.
• User guides are aimed at intermediate users. Intermediate users know something about
the semantics of the application, but not necessarily all aspects of it. They may be at
some intermediate stage in the learning process and know the syntax for some
functions, but not all. Thus, the user guide must simultaneously address the needs of all
classes of users.
Tutorials
One attribute that distinguishes tutorials from other user support materials such as help systems
and user/ reference manuals is that learners are generally expected to work through the tutoring
systems from beginning to end. This means that tutorials should be written in order of increasing
complexity, starting with the easiest and ending up with the most complex operations and
procedures. Since it is not always easy to determine which are the most complex tasks, and who,
amongst all possible users, will be likely to need knowledge of which features at what stage of
learning it is helpful if an index is included in the tutorial package (Lindgaard, 1994). One
advantage of on-line tutorial over a printed tutorial is the possibility of interaction with the tutorial.
An on-line tutorial can give the user practice using the system in the process of teaching. It is
J. Kuljis User Interfaces and Discrete Event Simulation Models Page 31
Chapter 2: User Interfaces to Discrete Event Simulation Systems
feasible to expect learners to go through the tutorial in several sessions and return to it at times to
refresh their minds, perhaps when the system has not been used for some time, or when they are
tackling new tasks on the computer system.
23 Simulation Systems
2.3.1 Introduction
Almost every computer application can be simplistically described as the inputting of the data, it
being processed, and producing some form of output. Simulation systems are not much different
and can be viewed as consisting of three parts:
Data input
Simulation engine
Simulation results
This dissertation will concentrate on the user interface aspects of simulation systems. Before
drawing any conclusions it is interesting to have a historical perspective on the modes of user
interaction presently used with simulation systems because it gives us clues as to what was, and
is, considered to be an aid to the user’s understanding of the system.
The first computer based simulation systems were in batch mode, followed by interactive
computer systems. These systems were designed for the exclusive use of computer specialists.
They conformed to a ‘black box approach’, where only the analyst was in control. The data was
either given as a file of numerical values or was integrated in the simulation engine’s program
code. The simulation experiment was in a “silent mode” giving no feedback to the user of what
was happening. It was therefore hard to detect errors in the logic of the system. The systems
created cryptic outputs that needed interpretation and explanation by the analysts.
To aid understanding of the system, visual simulation and graphical outputs were added to the
systems, the advantages of which are discussed in Pidd (1992a). When properly designed, a
graphical display can give a very good idea of the logical behaviour of the simulation program.
The client may quickly gain an idea of whether the model logic is correct or not. There is less need
J. Kuljis User Interfaces and Discrete Event Simulation Models Page 32
Chapter 2: User Interfaces to Discrete Event Simulation Systems
for the user to take on trust that the simulation is a valid representation of the system. This logical
clarity also makes it possible to think of developing simulation programs in co-operation with the
client. The developing display will give the client some idea of whether the model being developed
is sensible. The graphics are an aid to effective experimentation on the model and may help to
reduce the potential set of feasible experiments.
Unlike many other types of computer program, the main concerns in simulation programs are
often logical variables rather than numeric ones. That is, in a discrete event simulation the state of
the system results from the states of the individual entities, and the important variables are the
ones which represent and link these logical states. It is easier to recognise errors of logic when
entities are seen to change state wrongly on a properly designed graphical display (Pidd, 1992a).
Graphical interfaces can be extremely useful in the development of sophisticated training and
simulation environments. Users of such interfaces are able to obtain a much more immediate
impression of what is happening to the object or system in question by looking at a graphical
representation than by looking at a textual or symbolic representation of a mathematical model. As
the user watches the progress of the visual simulation it may become obvious that performance
could be improved by a small change to one of the input variables. Interrupting the running
program, modifying the appropriate variables and restarting the simulation from its previous state
are becoming more commonly available features in commercial simulation packages.
In the following sections of this chapter we are assessing the usability of current simulation
systems based on the definition of usability that we adopted from Shackel (1991). Shackel’s four
distinguishable and quantifiable dimensions: effectiveness, leamability, flexibility, and attitude are
not mutually exclusive in the sense that measures of, for example, effectiveness can, at the same
time, also give some indication of system leamability. Effectiveness refers to levels of user
performance, measured in terms of speed and/ or accuracy, in terms of proportion of task(s),
proportion of users, or probability of completion of a given task. Flexibility refers to variations in
task completion strategies supported by a system. Leamability refers to the ease with which new
or occasional users may accomplish certain tasks. Attitude refers to user acceptability of the
system in question.
J. Kuljis User Interfaces and Discrete Event Simulation Models Page 33
Chapter 2: User Interfaces to Discrete Event Simulation Systems
There are some problems, however, in setting appropriate numerical values against usability
goals. This, approach would be more appropriate when the usability goals are set during the design
stage of requirements specification than as an evaluation criteria once a system is finished.
Operational defmitions such as Shackel’s suggest how we might practically measure usability, but
do not give any indication how we might improve the usability of system (Booth, 1989).
Although quantitative data is required to accurately assess the usability of a system, it is qualitative
information that informs designers how to change an unusable system. Our objectives are both to
assess the usability of current simulation systems and to identify usability defects. We therefore
identify general interface usability principles which are essential for supporting the usability of
graphical user interfaces (Molich and Nielsen, 1990):
• Simple and natural dialogue: Dialogues should not contain information that is irrelevant
or rarely needed. All information should appear in a natural and logical order. To be
natural the structure of a dialogue has to achieve a close match with the user’s task
organisation instead of being matched to the internal structure of the application.
• Speak the user’s language: The dialogue should be expressed clearly in words, phrases,
and concepts familiar to the user, rather than in system-oriented terms.
• Minimise the user’s memory load: The user should not have to remember information
from one part of the dialogue to another. Instructions for use of the system should be
visible or easily retrievable whenever appropriate.
• Consistency: Users should not have to wonder whether different words, situations, or
actions mean the same thing.
• Provide feedback: The system should always keep users informed about what is going
on through appropriate feedback within a reasonable time.
• Provide clearly marked exits: Users often choose system functions by mistake and will
need a clearly marked “emergency exit” to leave the unwanted state without having to
go through an extended dialogue.
• Provide shortcuts: Clever shortcuts - unseen by the novice user - may often speed up
the interaction for the expert user such that the system caters both inexperienced and
experienced users.
J. Kuljis User Interfaces and Discrete Event Simulation Models Page 34
Chapter 2: User Interfaces to Discrete Event Simulation Systems
• Good error messages: They should be expressed in plain language (no codes), precisely
indicate the problem, and constructively suggest a solution.
• Prevent errors: Even better than good error messages is a careful design that prevents a
problem from occurring in the first place.
These usability principles support the four identified usability dimensions. Effectiveness is
supported with the following usability principles: simple and natural dialogue, minimal memory
load for the user, consistency, provision of feedback, provision of clearly marked exits, good
error messages, and prevention of errors. Leamability is supported with the following usability
principles: simple and natural dialogue, using the user’s language, consistency. Flexibility is
supported by providing shortcuts. Positive user attitude is supported with the following usability
principles; simple and natural dialogue, minimal memory load for the user, using the user’s
language, provision of feedback, good error messages, and prevention of errors.
Testing the usability of products often requires task scenarios. While a task scenario sets the
context for usability testing, the notion of a usability defect can provide the means by which the
performance of a system can be considered. Booth (1989) defines a usability defect as anything in
the product which prevents a target user completing a target task with reasonable effort and within
reasonable time. Lindgaard (1994) identifies categories of typical usability defects:
• Navigation: The ease with which users move around the system, within and between
modules - layout and understandability of menu options; An understanding of where the
user currently is, where s/he came from and where s/he is going in a sequence of
screens; Attention to provision of short cuts, and signals that such short cuts are
available, and the removal of redundant screens, menu options, or steps. Error recovery
assistance in the form of error messages, help information and hard copy
documentation which can assist or hinder smooth navigation.
• Screen design and layout: The way information is presented on the screen. Problems
may arise when the screen is crammed, when there are too many alignment points to
allow easy scanning, the logical flow of different fields, legibility of characters,
identification of fields (distinguishing between mandatory and discretionary fields), the
nature of the information to be entered, organisation of groupings, screen ID, title, etc.
J. Kuljis User Interfaces and Discrete Event Simulation Models Page 35
Chapter 2: User Interfaces to Discrete Event Simulation Systems
• Terminology: Words, sentences, and abbreviations. Problems can occur when jargon is
used inappropriately (i.e. for a population that does not know it) or not used where it
should be, clarity of meaning of field captions, codes, prompts, commands,
introduction of concepts (i.e. clarity and meaningfulness of vocabulary).
• Feedback: The way the system communicates with users as a result of user actions or
about the state of the system (error or warning messages, confirmation messages,
highlighting, regularity of response).
• Consistency: The degree to which the system performs in a predictable, well organised
and standard fashion.
• Modality: The state of the system operation that the user selects to perform a particular
function (how easy is it to move between modes; how many different modes must the
user know; how easy is it to recognise where one is at any time?)
• Redundancies: Repetitions (do any unnecessary data, fields or screens get in the user’s
way; are there any fields or screens that are never used; are there any unnecessary
prompts or messages that have no direct relevance to the user?)
• User control: user’s feeling of being in control (does the user feel in control of the
system; are there any actions which are initiated, controlled or paced by the system;
how well is the user kept informed about what is happening in the background; how
much trust or confidence does the user have in the system and what it will do/has it
done what it has been ordered to do?)
• Match with user tasks: the degree to which the system matches tasks as carried out in
the current environment; how well does it map and reflect what users want and the way
they want to do it; are any details left out; is every step in each task consistent with user
expectations; is the flow of steps -> subtasks -> tasks -> jobs logical; are links between
related tasks established; that is, is data taken to all destinations where it is wanted when
entered once?)
Effectiveness of the system can be hindered if there are: defects in navigation through the
system, problems in screen design and layout, inappropriate terminology, inappropriate feedback
or complete lack of feedback, problems with modality, inconsequential redundancies, and
problems in matching with user tasks. Leamability can be impeded if there are: defects in
J. Kuljis User Interfaces and Discrete Event Simulation Models Page 36
Chapter 2: User Interfaces to Discrete Event Simulation Systems
navigation, problems in screen design and layout, inappropriate terminology, inappropriate
feedback or complete lack of feedback, and problems in matching with user tasks. Flexibility is
impeded if there is no user control over the system and if the system imposes the order in which
the steps in a task are performed. The user attitude towards the system can be seriously affected
by any of the above usability defects.
2.3.2 Simulation Systems Examined
The following sections give general information on each of the commercial simulation systems
that are going to be analysed. Simulation software classification and modelling capabilities are not
discussed here. These can be found in Law and Kelton (1991), in Paul (1991) and in Pidd
(1992a). Hlupic (1993) provides a comprehensive set of criteria for the evaluation of simulation
systems. Even though the criteria are drawn for manufacturing systems they can be used for
evaluating more general purpose simulation software if some of the specifics related to
manufacturing systems are ignored. She concentrates primarily on modelling capabilities, taking
the user interface into account broadly as “user friendliness”, “user support” (documentation,
tutorials, demonstration models), “modelling assistance” (on-line help, prompting, logic checks),
and “visual aspects” (animation, icon editors/library). However, what basis is used exactly to
determine “user friendliness”, for example, is not elaborated.
We have reviewed six discrete simulation systems: XCELL+, Taylor II, ProModel for
Windows, Micro Saint for Windows, WITNESS for Windows, and Simscript II.5 for windows.
We examine the following interaction characteristics of these systems: input-output devices
employed, interaction styles, and use of graphics. We are also interested in: type of simulation
system, application areas, hardware platform, operating system, and hardware requirements. For
each simulation system we examine the user interface for the three identified modules: data
input/model specification, simulation experiments, and presentation of output results. We are
interested in adopted interaction styles, modes of interaction, screen design and layout, interaction
flexibility, supported functionality, navigation styles, use of colour, and the possibility to import
and export data. We also examine what kind of user support and assistance is provided and
analyse how this provision is facilitated. Finally, we evaluate each system against the usability
criteria set in the previous section. To achieve that we test each of the six listed systems on the
J. Kuljis User Interfaces and Discrete Event Simulation Models Page 37
Chapter 2: User Interfaces to Discrete Event Simulation Systems
task of developing a small queuing model (a bank). The test is performed by a user with a high
computer literacy, low domain knowledge, and no knowledge of any of the six simulation
systems. The ability to accomplish the task must be based solely on consulting the user manuals
and help (i.e. without formal training). We try to identify which of the general usability principles
are applied and also establish where the usability defects are in each examined system. We want to
find out where in a system users might run into problems and what kind of problems they are
likely to encounter. We conduct the usability testing in order to identify what changes are needed
and where in the system the changes should occur that will improve the usability of the system.
When examining the user interface we are particularly interested in three aspects: firstly, how
the user interface for a particular system aids the user in a model development process; secondly,
can the user modify the existing interface to either accommodate the user’s own preferences or to
adjust the modelling environment to the needs of a particular model; and thirdly, does the system
facilitate user interface development.
The next six sections describe these aspects of each package in detail, with a summary in
section 2.4.
2.3.3 XCELL+
XCELL+ is a data-driven VIM manufacturing simulation system. It is a PC/ AT based system that
runs under MSDOS 2.1 or later and requires 640K of memory and 1MB of hard disk space. It
requires an EGA compatible colour monitor. XCELL+ developers (Conway et al., 1990) claim
that they built a tool that is meant to be used by the end users, reducing their dependence on
simulation specialists. Models are built graphically with a menu-driven interface. The interaction is
facilitated by using command keys. XCELL+ starts with a black background screen filled with
information about the system in four very bright coloured areas: red with white text, yellow with
black text, blue with white text, green with black text. The top of the screen contains the logo,
release details, and the licence reminder. Across the bottom of the screen there is a row of eight
green boxes (see Figure 2.1). These boxes describe the role that is currently assigned to each of
the eight function keys that XCELL+ uses. These are function keys FI to F8 from left to right.
Above them is displayed in small print that this is the main menu. In the main menu there are only
four keys with a defined function: FI for help, F4 for creating a new factory, F6 for invoking the
J. Kuljis User Interfaces and Discrete Event Simulation Models Page 38
Chapter 2: User Interfaces to Discrete Event Simulation Systems
file manager, and F8 to quit. If there is a factory model in the workspace, the main menu offers
additional choices: F2 to change the form of the display of the model, F3 to analyse the structure
and flow potential of the model, F5 to modify the characteristics (design) of the model, and F7 to
run the model. In other menus or screens, the FI key can have some other function.
Data input/ model specification
XCELL+ uses symbolic graphics during the construction of a model to represent the logic of the
model. XCELL+ provides eight basic building blocks: work centres (where processes are run to
perform work), receiving areas (where material is received from the outside world), shipping
areas (from which finished material is shipped to the outside world), buffers (where work in
process inventory is stored), maintenance centres (from which service teams are sent to repair or
provide scheduled maintenance for work centres), control points (intersections of paths and traffic
control points in an asynchronous materials handling system), auxiliary resources (sites from
which resources are supplied to perform processes), and path segments (connecting two control
points over which carriers can transport material). For each of these eight elements there is a
slightly different graphical symbol.
A factory floor is represented as a uniform grid of “cells” and each element of the factory
occupies exactly one of these cells. To construct an XCELL+ model the user has to choose
elements and position each element in some cell of the factory floor. Graphical symbols are placed
on the screen by pressing one of the seven function keys (for the first seven elements) in the
‘Design menu’ screen (see Figure 2.2). The path segments are not autonomous, they exist only as
components of a path between control points, and are created in the ‘Path’ menu. Each element is
assigned a default name and default values for attributes associated to that element There are
several operations that are permitted for each of these factory building blocks. The elements can
be: named (up to 10 characters that must start with alpha characters and are automatically
transformed into upper case), the default values of its parameters can be changed, deleted, copied,
moved, and positioned on the screen. All these operations are performed by pressing appropriate
function keys and thus moving into a different “menu” that allows desired changes to be made. In
addition to the eight factory building elements, mentioned above, there are three other important
design elements: processes (that describe the work done at a work centre), links (that describe the
J. Kuljis User Interfaces and Discrete Event Simulation Models Page 39
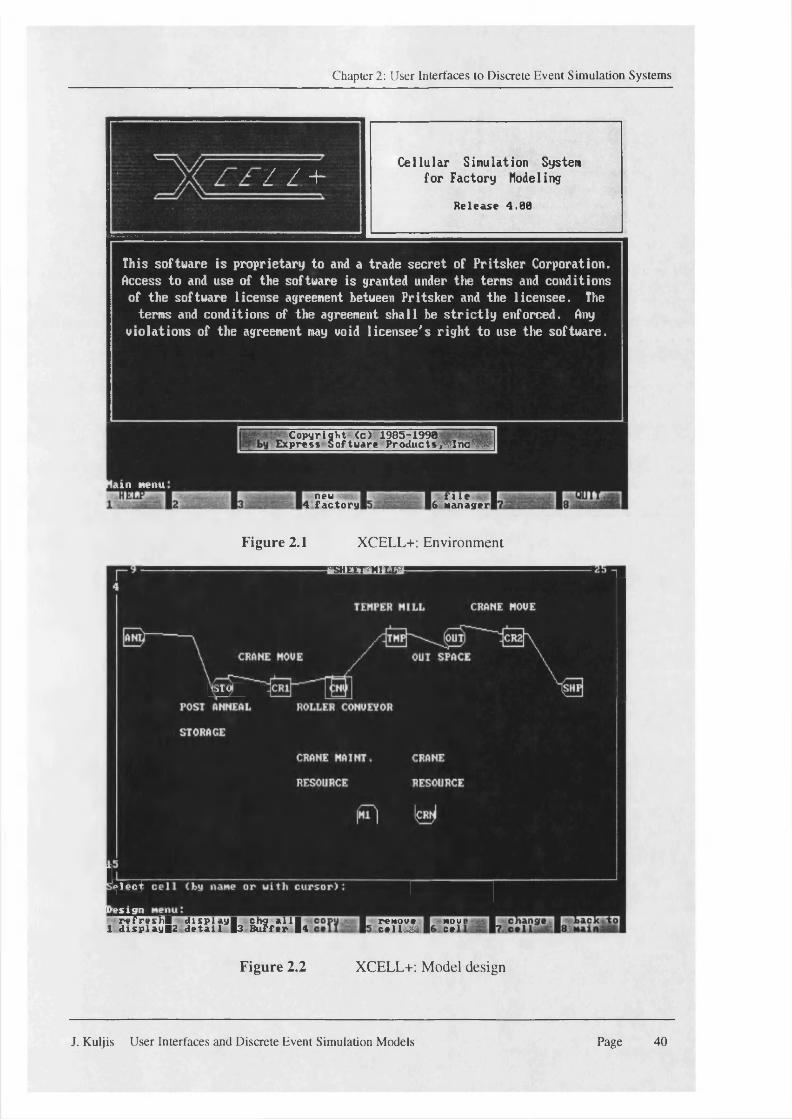
Chapter 2: User Interfaces to Discrete Event Simulation Systems
7 / + ■Cellular Simulation System
for Factory Modeling
Release 4 .00
This software is proprietary to and a trade secret of Pritsker Corporation. Access to and use of the software is granted under the terns and conditions of the software license agreement between Pritsker and the licensee. The
terms and conditions of the agreement shall be str ic tly enforced. Any violations of the agreement may void licensee's right to use the software.
Copyright (c) 1905-1990 press Softuare P roducts^Inc-^P
am menuf i l e
6 Managerneu
4 factory
Figure 2.1 XCELL+: Environment
rsHErr*MiLEyj
mm '
JPUj BHHHjHi
iii
r e f r e s h ! d i s p l a y ! chg a l l !1 d isp la y 12 d e ta i1 |3 B uffer-14
Figure 2.2
n ttS L S " '
XCELL+: Model design
J. Kuljis User Interfaces and Discrete Event Simulation Models Page 40
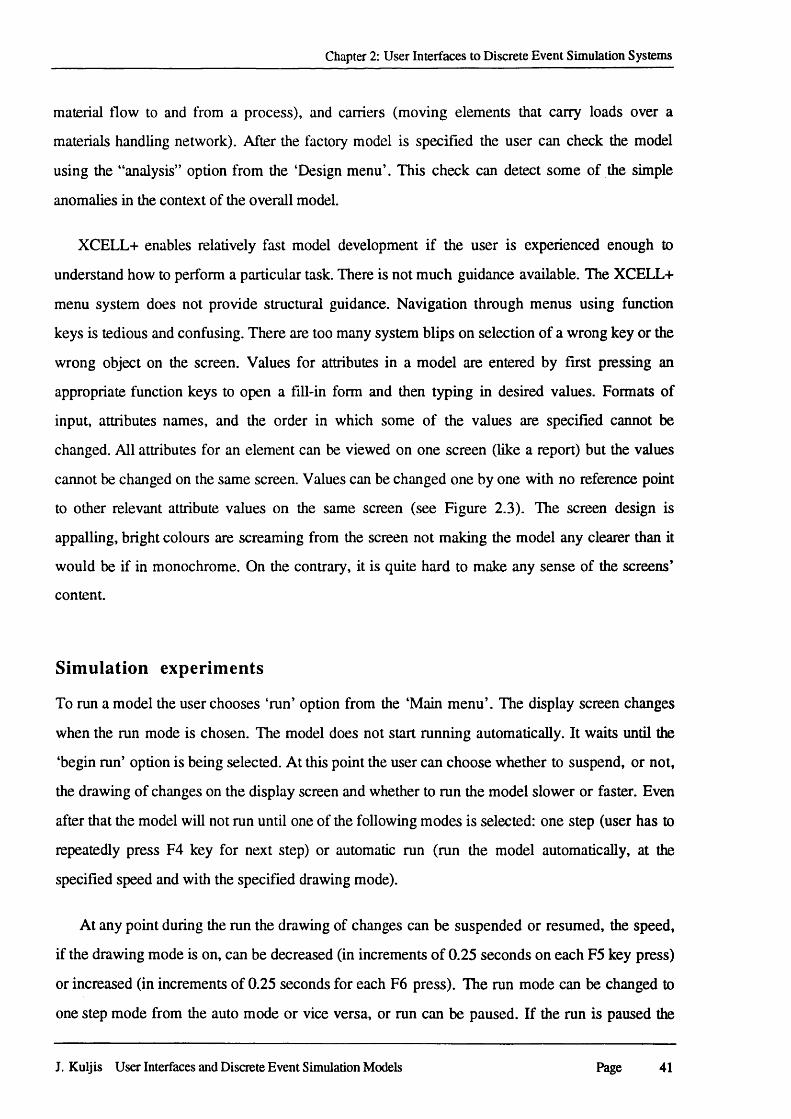
Chapter 2: User Interfaces to Discrete Event Simulation Systems
material flow to and from a process), and carriers (moving elements that carry loads over a
materials handling network). After the factory model is specified the user can check the model
using the “analysis” option from the ‘Design menu’. This check can detect some of the simple
anomalies in the context of the overall model.
XCELL+ enables relatively fast model development if the user is experienced enough to
understand how to perform a particular task. There is not much guidance available. The XCELL+
menu system does not provide structural guidance. Navigation through menus using function
keys is tedious and confusing. There are too many system blips on selection of a wrong key or the
wrong object on the screen. Values for attributes in a model are entered by first pressing an
appropriate function keys to open a fill-in form and then typing in desired values. Formats of
input, attributes names, and the order in which some of the values are specified cannot be
changed. All attributes for an element can be viewed on one screen (like a report) but the values
cannot be changed on the same screen. Values can be changed one by one with no reference point
to other relevant attribute values on the same screen (see Figure 2.3). The screen design is
appalling, bright colours are screaming from the screen not making the model any clearer than it
would be if in monochrome. On the contrary, it is quite hard to make any sense of the screens’
content.
Simulation experiments
To run a model the user chooses ‘run’ option from the ‘Main menu’. The display screen changes
when the run mode is chosen. The model does not start running automatically. It waits until the
‘begin run’ option is being selected. At this point the user can choose whether to suspend, or not,
the drawing of changes on the display screen and whether to run the model slower or faster. Even
after that the model will not run until one of the following modes is selected: one step (user has to
repeatedly press F4 key for next step) or automatic run (run the model automatically, at the
specified speed and with the specified drawing mode).
At any point during the run the drawing of changes can be suspended or resumed, the speed,
if the drawing mode is on, can be decreased (in increments of 0.25 seconds on each F5 key press)
or increased (in increments of 0.25 seconds for each F6 press). The run mode can be changed to
one step mode from the auto mode or vice versa, or run can be paused. If the run is paused the
J. Kuljis User Interfaces and Discrete Event Simulation Models Page 41
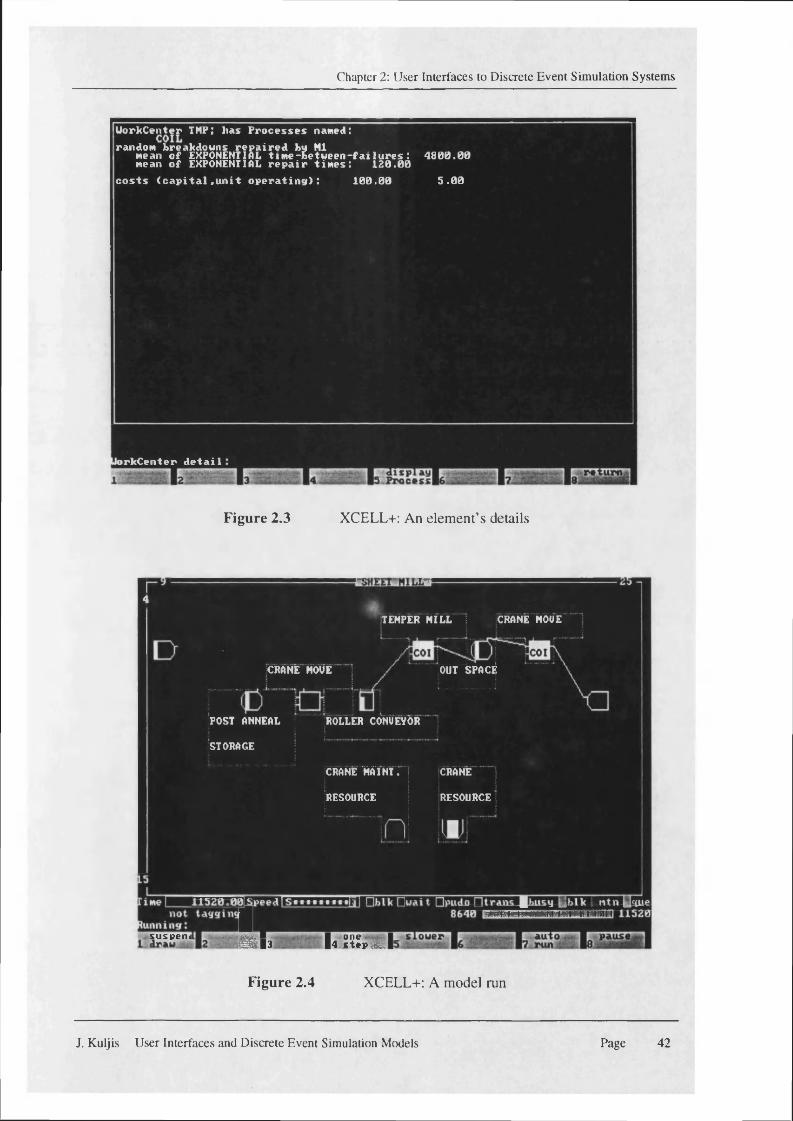
Chapter 2: User Interfaces to Discrete Event Simulation Systems
U orkCenter TMP; lias P r o c e s s e s named:random breakdowns r e p a ir e d by Ml
mean o f EXPONENTIAL t i me - b e t w e e n - f a i l u r e s : 4 8 0 0 .0 0mean o f EXPONENTIAL r e p a i r t im e s : 1 2 0 .0 0
c o s t s ( c a p i t a l . u n i t o p e r a t i n g ) : 1 0 0 .0 0 5 . 0 0
o rk C en ter d e t a i l
Figure 2.3 XCELL+: An element’s details
TEMPER MILL i CRANE MOUE
CRANE MOVE OUT SPACE
POST ANNEAL ROLLER CONUEYOR
STORAGE
crane M i n t ." :
RESOURCE
CRANE
RESOURCE
suspenc1■ 13 1. o n e 1 4 s te p iS I
Figure 2.4 XCELL+: A model run
J. Kuljis User Interfaces and Discrete Event Simulation Models Page 42
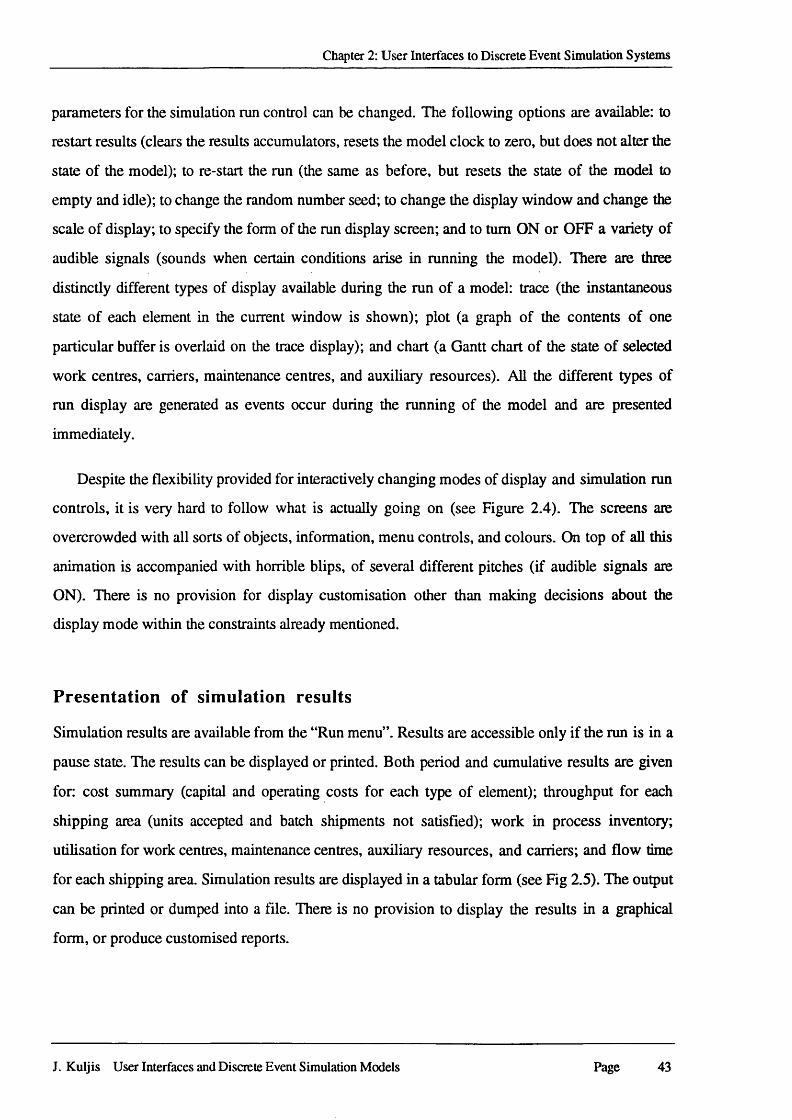
Chapter 2: User Interfaces to Discrete Event Simulation Systems
parameters for the simulation run control can be changed. The following options are available: to
restart results (clears the results accumulators, resets the model clock to zero, but does not alter the
state of the model); to re-start the run (the same as before, but resets the state of the model to
empty and idle); to change the random number seed; to change the display window and change the
scale of display; to specify the form of the run display screen; and to turn ON or OFF a variety of
audible signals (sounds when certain conditions arise in running the model). There are three
distinctly different types of display available during the run of a model: trace (the instantaneous
state of each element in the current window is shown); plot (a graph of the contents of one
particular buffer is overlaid on the trace display); and chart (a Gantt chart of the state of selected
work centres, carriers, maintenance centres, and auxiliary resources). All the different types of
run display are generated as events occur during the running of the model and are presented
immediately.
Despite the flexibility provided for interactively changing modes of display and simulation run
controls, it is very hard to follow what is actually going on (see Figure 2.4). The screens are
overcrowded with all sorts of objects, information, menu controls, and colours. On top of all this
animation is accompanied with horrible blips, of several different pitches (if audible signals are
ON). There is no provision for display customisation other than making decisions about the
display mode within the constraints already mentioned.
Presentation of simulation results
Simulation results are available from the “Run menu”. Results are accessible only if the run is in a
pause state. The results can be displayed or printed. Both period and cumulative results are given
for: cost summary (capital and operating costs for each type of element); throughput for each
shipping area (units accepted and batch shipments not satisfied); work in process inventory;
utilisation for work centres, maintenance centres, auxiliary resources, and carriers; and flow time
for each shipping area. Simulation results are displayed in a tabular form (see Fig 2.5). The output
can be printed or dumped into a file. There is no provision to display the results in a graphical
form, or produce customised reports.
J. Kuljis User Interfaces and Discrete Event Simulation Models Page 43
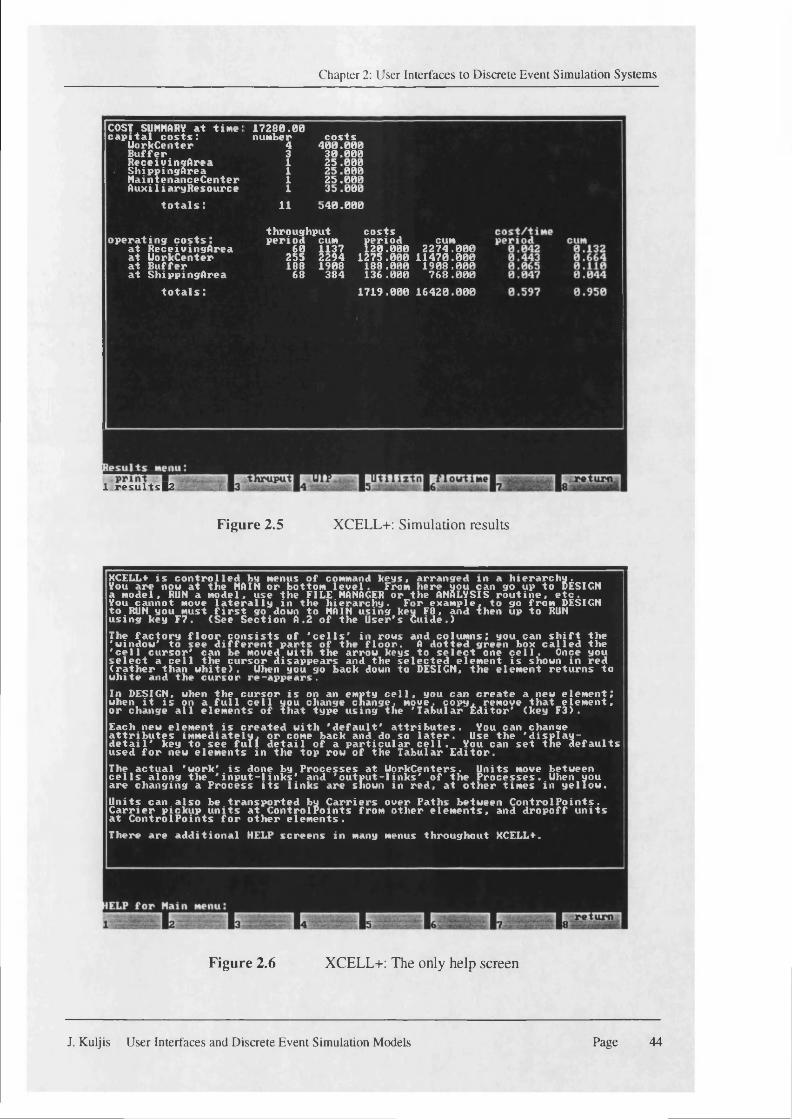
Chapter 2: User Interfaces to Discrete Event Simulation Systems
COST SUMMARY a t t i n e : c a p i t a l c o s t s :
UorkCenter B u f f e rR ece iv in g A r e a ShippingArea M ain ten an ceC en ter A u x i1 i aryR esou rce
t o t a l s :
1 7 2 8 0 .0 0number
431111
11
c o s t s4 0 0 .0 0 0
3 0 .0 0 02 5 .0 0 0 25 .0002 5 .0 0 03 5 .0 0 0
5 4 0 .0 0 0
o p e r a t i n g c o s t s : a t R ec e iv in g A rea a t UorkCenter a t B u f f e r a t S h ip p ingA rea
t o t a l s :
th roughput p e r io d cum
60 1137255 2294188 1908
68 384
c o s t sp e r io d cum1 2 0 .0 0 0 2 2 7 4 .0 0 0
1 2 7 5 .0 0 0 1 1 4 7 0 .0 0 01 8 8 .0 0 0 1 9 0 8 .0 0 01 3 6 .0 0 0 7 6 8 .0 0 0
1 7 1 9 .0 0 0 1 6 4 2 0 .0 0 0
1 r e s u l t s | 2 .. s. % I
XCELL+: Simulation resultsFigure 2.5
XCELL+ i s c o n t r o l l e d by menus o f command k e y s , a rran g ed in a h ie r a r c h y .You a re now a t th e MAIN o r bottom l e v e l . From h ere you can go up to DESIGN a m od el , RUN a m odel , u se th e FILE MANAGER or th e ANALYSIS r o u t i n e , e t c .You ca n n o t move l a t e r a l l y in th e h ie r a r c h y . For ex a m p le , to go from DESIGNt o RUN you must f i r s t go down to MAIN u s in g key F 8 , and th en up t o RUNu s i n g key F 7 . (S e e S e c t i o n A .2 o f th e U s e r ' s G u id e . )The f a c t o r y f l o o r c o n s i s t s o f ' c e l l s ' in rows and co lu m n s; you can s h i f t th e 'w indow' t o s e e d i f f e r e n t p a r t s o f th e f l o o r . A d o t t e d g reen box c a l l e d th e ' c e l l c u r s o r ' can be moved w ith th e arrow keys to s e l e c t one c e l l . Once you s e l e c t a c e l l th e c u r s o r d is a p p e a r s and th e s e l e c t e d e le m e n t i s shown in red ( r a t h e r than w h i t e ) . Uhen you go back down to DESIGN, t h e e lem en t r e tu r n s to w h ite and th e c u r s o r r e - a p p e a r s .In DESIGN, when th e c u r s o r i s on an empty c e l l , you can c r e a t e a new e le m e n t ;when i t i s on a f u l l c e l l you change ch an ge , move, c o p y , remove t h a t e le m e n t ,o r change a l l e le m e n ts o f t h a t ty p e u s in g th e 'T a b u la r E d i t o r ' (key F 3 ) .Each new e lem en t i s c r e a t e d w ith ' d e f a u l t ' a t t r i b u t e s . You can change a t t r i b u t e s im m e d ia te ly , o r come back and do so l a t e r . Use th e ' d i s p l a y - d e t a i l ' key to s e e f u l l d e t a i l o f a p a r t i c u l a r c e l l . You can s e t t h e d e f a u l t s u se d f o r new e le m e n ts in th e to p row o f th e Tabular E d i t o r .The a c t u a l 'work' i s done by P r o c e s s e s a t U o rk C en ters . U n it s move b etu een c e l l s a lo n g th e ' in p u t -1 in k s ' and ' o u t p u t -1 in k s ' o f t h e P r o c e s s e s . Uhen you are c h a n g in g a P r o c e s s i t s l i n k s are shown in r e d , a t o t h e r t im e s in y e l l o w .U n it s can a l s o be t r a n s p o r t e d by C a r r ie r s o v er P aths betw een C o n t r o l P o i n t s . C a r r ie r p ick u p u n i t s a t C o n tr o lP o in t s from o th e r e l e m e n t s , and d r o p o f f u n i t s a t C o n t r o lP o in t s f o r o t h e r e l e m e n t s .There a re a d d i t i o n a l HELP s c r e e n s in many menus th rou g h ou t XCELL+.
Figure 2.6 XCELL+: The only help screen
J. Kuljis User Interfaces and Discrete Event Simulation Models Page 44
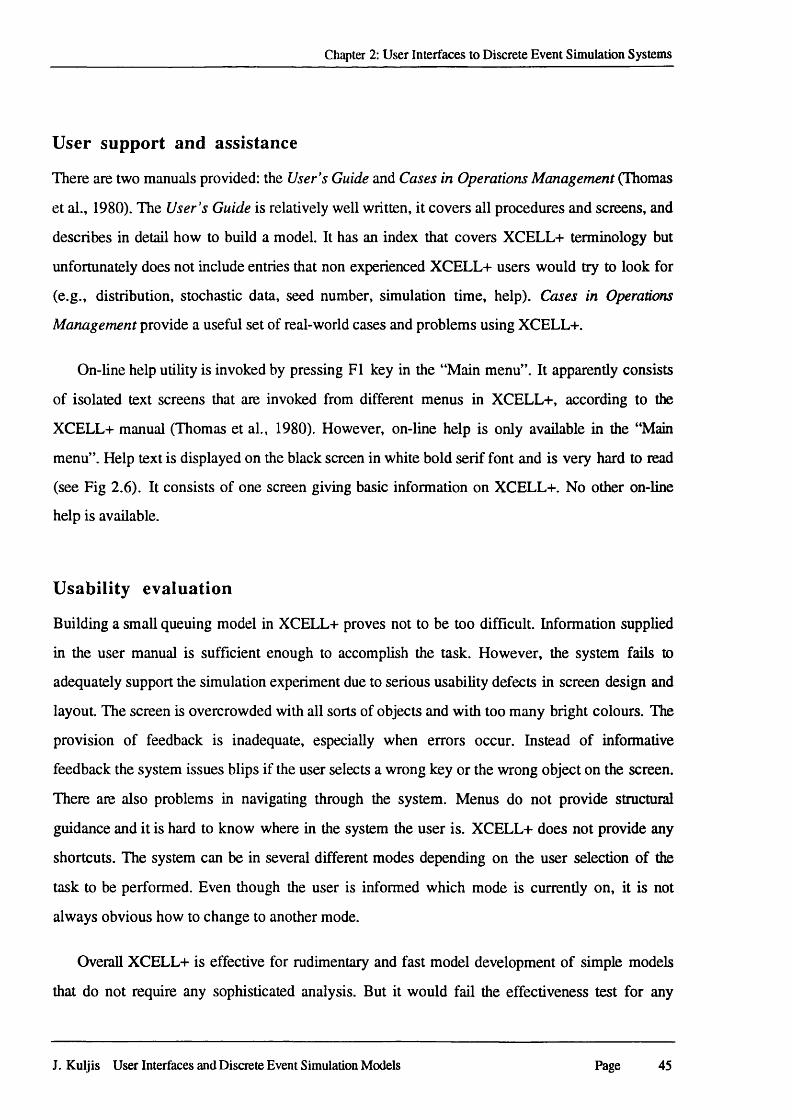
Chapter 2: User Interfaces to Discrete Event Simulation Systems
User support and assistance
There are two manuals provided: the User's Guide and Cases in Operations Management (Thomas
et al., 1980). The User’s Guide is relatively well written, it covers all procedures and screens, and
describes in detail how to build a model. It has an index that covers XCELL+ terminology but
unfortunately does not include entries that non experienced XCELL+ users would try to look for
(e.g., distribution, stochastic data, seed number, simulation time, help). Cases in Operations
Management provide a useful set of real-world cases and problems using XCELL+.
On-line help utility is invoked by pressing FI key in the “Main menu”. It apparently consists
of isolated text screens that are invoked from different menus in XCELL+, according to the
XCELL+ manual (Thomas et al., 1980). However, on-line help is only available in the “Main
menu”. Help text is displayed on the black screen in white bold serif font and is very hard to read
(see Fig 2.6). It consists of one screen giving basic information on XCELL+. No other on-line
help is available.
Usability evaluation
Building a small queuing model in XCELL+ proves not to be too difficult. Information supplied
in the user manual is sufficient enough to accomplish the task. However, the system fails to
adequately support the simulation experiment due to serious usability defects in screen design and
layout. The screen is overcrowded with all sorts of objects and with too many bright colours. The
provision of feedback is inadequate, especially when errors occur. Instead of informative
feedback the system issues blips if the user selects a wrong key or the wrong object on the screen.
There are also problems in navigating through the system. Menus do not provide structural
guidance and it is hard to know where in the system the user is. XCELL+ does not provide any
shortcuts. The system can be in several different modes depending on the user selection of the
task to be performed. Even though the user is informed which mode is currendy on, it is not
always obvious how to change to another mode.
Overall XCELL+ is effective for rudimentary and fast model development of simple models
that do not require any sophisticated analysis. But it would fail the effectiveness test for any
J. Kuljis User Interfaces and Discrete Event Simulation Models Page 45
Chapter 2: User Interfaces to Discrete Event Simulation Systems
complex problems. The terminology used in the system is appropriate for manufacturing domain
but can create problems in matching with user tasks when applied in some other domains, for
example a queuing domain. Leamability of the system is not well supported (it fails to provide
simple and natural dialogue, it has serious problems in screen design and provision of appropriate
feedback, and in matching the user tasks). XCELL+ fails to provide an adequate level of
flexibility in carrying out the tasks. Therefore, the system does not provide user satisfaction and
fails the user attitude test on many criteria.
2.3 .4 Taylor II
Taylor II version 2.10 (1993) is a PC based data-driven VIM manufacturing simulation system.
Taylor II requires 2MB of RAM and at least 5MB hard disk space, a mouse with two buttons,
VGA monitor, at least 30386 processor, and mathematical co-processor is recommended. Some
of the typical applications are:
• Assembly line systems.
• Conveyor systems.
• Warehouses.
• Flexible manufacturing systems.
Even though Taylor II is used primarily for modelling manufacturing systems it can be used to
model some of the queuing problems.
Data input/ model specification
Model specification is done using a visual diagramming tools. The system starts with a main
screen which shows a model area that occupies most of the screen, a menu area (right side of the
screen), and an area at the bottom of the screen. This area contains a number of buttons, boxes,
bars, and a clock that can be activated by clicking with the mouse whilst in the main menu, the
only exception being the help function that is available at all times. The main menu consists of the
following options: Create (to create a model - layout and routing), Detail (to determine behaviour
of the model), Go (to run simulation), Results (to see simulation results), File (to handle model
storage and retrieval, and to exit the program), Options (to perform all those program features that
J. Kuljis User Interfaces and Discrete Event Simulation Models Page 46
Chapter 2: User Interfaces to Discrete Event Simulation Systems
do not belong to any other menu like to define new Taylor Language Interface (TLI) functions and
to change the program default settings), and Visuals (to determine visualisation of the model). The
logic of the model is presented graphically using either predefined shapes for entities in the model
or by creating new ones (see Figure 2.7).
The depth of the Taylor II menu system never exceeds three levels (where the main menu is
level zero). The mouse point and click action is used to invoke a menu option. ESC key is used to
go up one level in the menu system. Each of the leaf nodes in a menu tree (except for the Create
option) has a fill-in form that requires some data input (see Fig 2.8). To define an element in a
model one has to specify 19 values/ parameters that relate to that element. Of these 19 parameters
only five are shown on the form. To see the rest of the form the user has to scroll down the form.
The mouse use is not supported in forms, therefore, the user has to switch to using the keyboard.
Arrow keys are used to move up and down in the forms. Key FI is used for help on the item. To
activate a particular value field in a form we have to hit ENTER key. The value fields can be:
switches (on/off) that are changed by pressing the SHIFT BAR or the ENTER key; fields where a
value has to be typed in; and multiple choice fields where user chooses one of the values from the
provided list. To exit the form ESC key is used. This kind of input form has no option for
cancellation. All changes are automatically saved.
There are some serious problems with the fill-in forms. If the user enters an invalid value into
a field, then on an attempt to save or exit the form the following will occur. The form will remain
on the screen, the value field will be set to blank, and that process will cycle indefinitely. There is
no way to find out what should be entered, except an expert knowledge of the system. Context
sensitive help does not provide this sort of information. There is no cancellation key. The system
will persist in expectation of a valid entry. It is unusual to have pre-emptive value fields if no
guidance on valid values is provided. Other types of forms require confirmation, like for example
“Current model saved?”, or provide information, like for example “Cannot continue, use
Simulate”. These forms usually have one, two, or three buttons (e.g., OK, Cancel, Edit,
Retrieve) and the mouse use is supported. There is no consistency in the use of interaction
devices.
J. Kuljis User Interfaces and Discrete Event Simulation Models Page 47
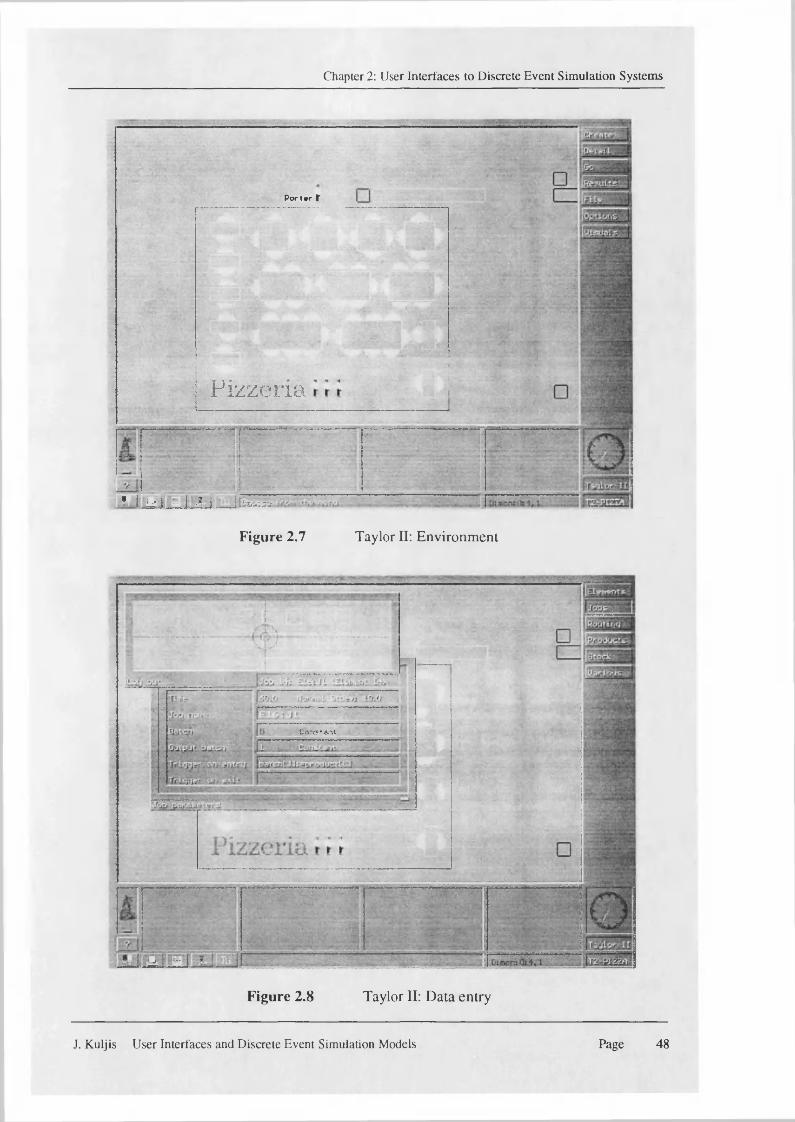
Chapter 2: User Interfaces to Discrete Event Simulation Systems
P o rt» r t
Pizzeria— ——
* ,1 iz 1 i •?- i Ibfc-x**
Figure 2.7 Taylor II: Environment
Cons* ant
.-i
V '
"... •
Figure 2.8 Taylor II: Data entry
J. Kuljis User Interfaces and Discrete Event Simulation Models Page 48
Chapter 2: User Interfaces to Discrete Event Simulation Systems
Simulation experiments
Simulation experiment can be conducted either to run a current model or to run a batch. The batch
is used to run a number of simulations automatically and/ or to run a presentation automatically
(animation of one or more models, explanatory text, or illustrations). To run a batch experiment, a
TLI program is used. Otherwise, one can run a model that is just created or that is retrieved from a
file. Some of the options for simulation can be set (kind of animation, speed of animation, stop
conditions, recording the history of events) or the user can keep the default setting.
As a part of the model specification is the visualisation of the model. Visualisation does not
influence the logic of the model but can provide a better understanding on what is going on. If
judged on the provided examples Taylor II facilitates quite a sophisticated animation. The problem
can be, however, encountered when one tries to create the icons oneself. The instructions
provided are rather vague how to go about it. The available tool for creating the animation
background and user-defined icons - ‘paintbox’ - is anything but easy. Paintbox has a variety of
painting tools but to do any precision drawings is a long and painful process (see Figure 2.9).
During the visual simulation run besides an animation of a model, in the bottom area of the
screen the dynamic icons can be used to represent variables in a form of text, graphs, or icons (see
Figure 2.10). Again, like with the creating icons for simulation, definition of dynamic icons and
their placement on the screen is not well explained. Taylor II allows use of 16 colours (mostly
shades of grey). The user can change the default set of colours through a tedious and not very
satisfactory process. In any case, it seems that whichever colours are defined by the user the
system sticks to its default colours for most of the screen elements (text, graphs, etc.).
Presentation of simulation results
If the history of events was recorded then the user can view simulation results. There are four
options available: Reports, Graphs, TLI Report, and Document. ‘Reports’ offers six predefined
reports, five of which are in a tabular form and one is a trace report. The contents of tabular
reports can be changed by the user, if desired. A trace report contains all events or selection of
events that took place during the last simulation (see Figure 2.11). ‘Graphs’ offers a user defined
J. Kuljis User Interfaces and Discrete Event Simulation Models Page 49
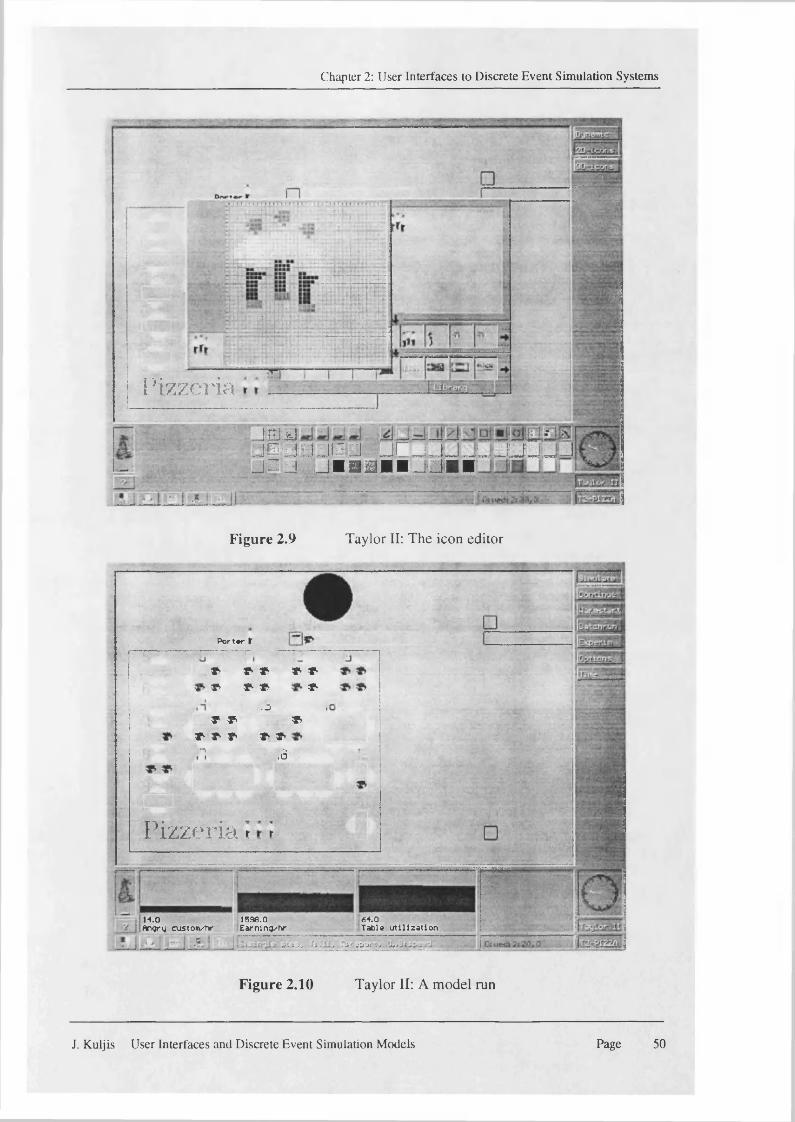
Chapter 2: User Interfaces to Discrete Event Simulation Systems
Pizzeria
j a i lj r j j j r j j r _j _ j j _____ u j j jj r j ,J ■ ■ 3■ ■ JJB ■
Figure 2.9 Taylor II: The icon editor
*4.0Table u tiliz a tio n
14.0Angry custom/hr
1598.0 E arn ings hr
wi Z'rij fs I .1 tXf XU'Xl 1 <* - j.> ~
Porter t
Pizzeria r i
«•*•
*r>
*■ v> * & *
.J*
*> *.d
** * T> *•
*
Figure 2.10 Taylor II: A model run
J. Kuljis User Interfaces and Discrete Event Simulation Models Page 50
Chapter 2: User Interfaces to Discrete Event Simulation Systems
graph and four predefined graphs to choose from; status diagram, utilisation pie, queue graph,
and waiting time histogram. User defined graphs are always available regardless of whether or not
a history of the simulation was kept. ‘TLI Report’ is fully defined by the user. ‘Document’
provides a full description of the model.
There is not much flexibility offered when choosing colours and patterns for graph
presentation. Textual reports are by default black characters on a white background. Graphs can
be either in colour or in monochrome, and they can be changed easily using the colour switch. If
the monochrome version is requested predefined patterns represent otherwise coloured areas in a
graph. In the colour version the user has not much influence on setting colours, patterns, and
typesets. The default is made by choosing the colour setting for the whole system. There are three
main colours that can be set: Indicator (determines in which colour the information, like the bars in
a graph, is displayed); Background (determines the background colour); and Warning (if the
warning level is reached the colour of information changes into the warning colour). The
comforting thing is that the result statistics can be exported to text files or to *.OVL, *.MVL files.
User support and assistance
Taylor II has a comparatively high standard of the provided documentation. There are five books
that provide four manuals: Tutorial (1993), User’s Guide (1993), TLI (Taylor Language
Interface) Syntax Guide (1993), and Examples Appendices Index (1993). The manuals are
relatively well written, structured, and contain information on how to use them. However, the
high confidence in manuals rapidly vanishes when one tries to build a model with the manuals and
the on-line help as an only aid. The tutorial is not so good since it does not properly explain how
and why some of the system functions are performed. The index is global for all five books
therefore to find anything one has to have all the manuals available. The system comes with a
demonstration disk that takes more than 3MB of disk space. It has a variety of examples from
different application areas. The demonstration program does not provide a guided tour of a model
development and does not offer much guidance of how to use it.
On-line help is constantly available by either hitting the FI key or by mouse point and click
action on the button labelled “?” that is always available on the screen (see Figure 2.12). The
Taylor help system contains the complete manual, including colour illustrations. To navigate
J. Kuljis User Interfaces and Discrete Event Simulation Models Page 51
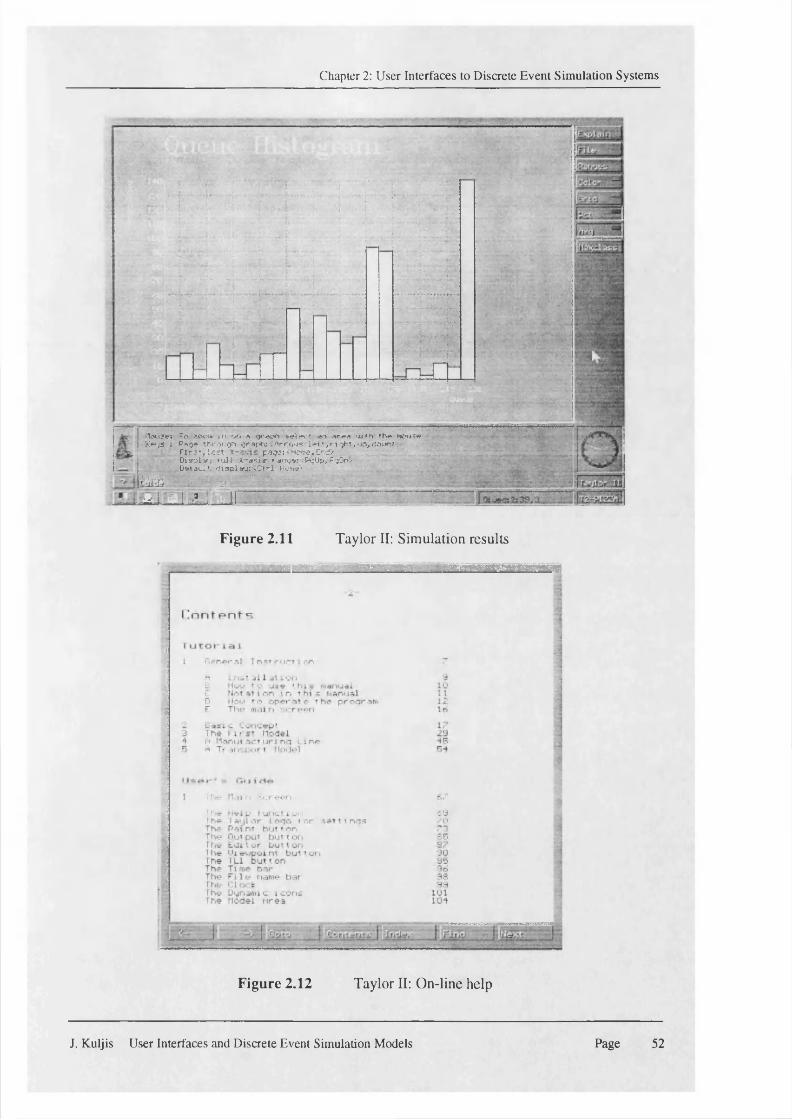
Chapter 2: User Interfaces to Discrete Event Simulation Systems
V,*
riouJet To-toor. in or, * qraph select an area ‘ji >h the mous#K&jS i.Paij* through graphJ rtrreriS let.%hight.up,<3aur»?
r t r s t | J « s t -p ^ e : <'Ho»?,£rse>Display hil l X-ar.ie r arftj*:, PoUp,PqOr>r Dm iU » display: .C trl (low.'
c i j a* . • /v ; . ..v ~: . •••mi ".I * : II ' ~ ...
Figure 2.11 Taylor II: Simulation results
Figure 2.12 Taylor II: On-line help
J. Kuljis User Interfaces and Discrete Event Simulation Models Page 52
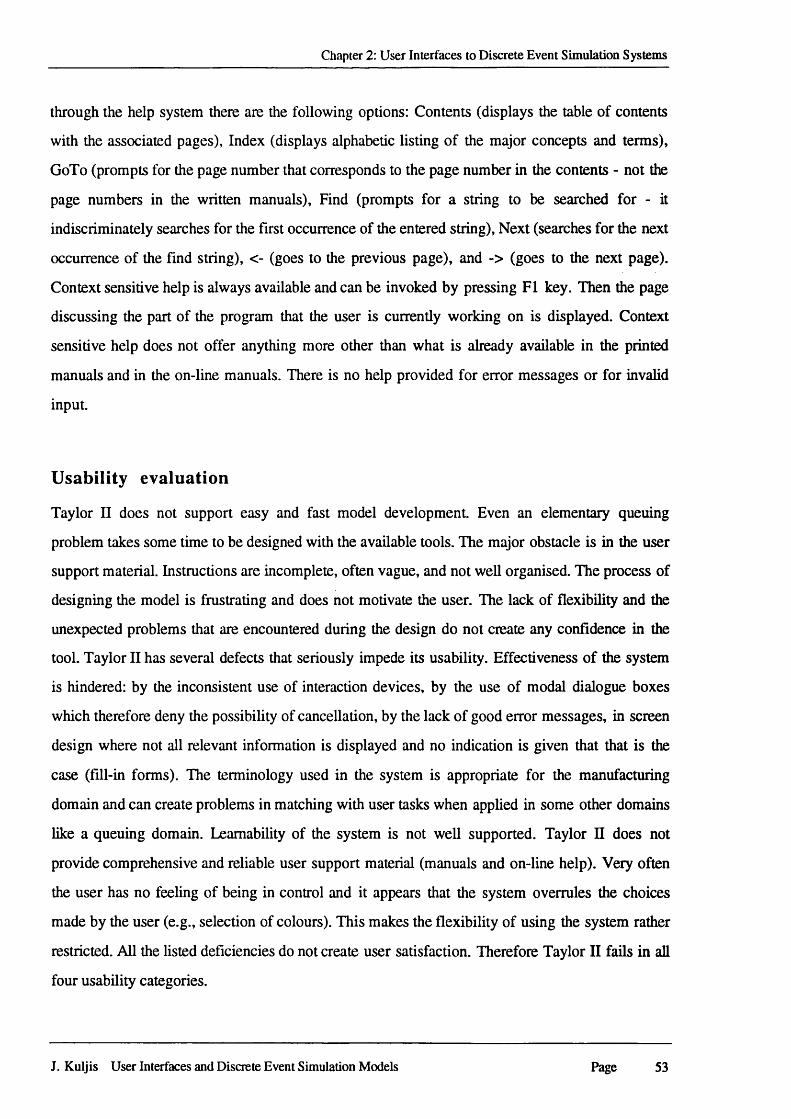
Chapter 2: User Interfaces to Discrete Event Simulation Systems
through the help system there are the following options: Contents (displays the table of contents
with the associated pages), Index (displays alphabetic listing of the major concepts and terms),
GoTo (prompts for the page number that corresponds to the page number in the contents - not the
page numbers in the written manuals), Find (prompts for a string to be searched for - it
indiscriminately searches for the first occurrence of the entered string), Next (searches for the next
occurrence of the find string), <- (goes to the previous page), and -> (goes to the next page).
Context sensitive help is always available and can be invoked by pressing FI key. Then the page
discussing the part of the program that the user is currently working on is displayed. Context
sensitive help does not offer anything more other than what is already available in the printed
manuals and in the on-line manuals. There is no help provided for error messages or for invalid
input.
Usability evaluation
Taylor II does not support easy and fast model development. Even an elementary queuing
problem takes some time to be designed with the available tools. The major obstacle is in the user
support material. Instructions are incomplete, often vague, and not well organised. The process of
designing the model is frustrating and does not motivate the user. The lack of flexibility and the
unexpected problems that are encountered during the design do not create any confidence in the
tool. Taylor II has several defects that seriously impede its usability. Effectiveness of the system
is hindered: by the inconsistent use of interaction devices, by the use of modal dialogue boxes
which therefore deny the possibility of cancellation, by the lack of good error messages, in screen
design where not all relevant information is displayed and no indication is given that that is the
case (fill-in forms). The terminology used in the system is appropriate for the manufacturing
domain and can create problems in matching with user tasks when applied in some other domains
like a queuing domain. Leamability of the system is not well supported. Taylor II does not
provide comprehensive and reliable user support material (manuals and on-line help). Very often
the user has no feeling of being in control and it appears that the system overrules the choices
made by the user (e.g., selection of colours). This makes the flexibility of using the system rather
restricted. All the listed deficiencies do not create user satisfaction. Therefore Taylor II fails in all
four usability categories.
J. Kuljis User Interfaces and Discrete Event Simulation Models Page 53
Chapter 2: User Interfaces to Discrete Event Simulation Systems
2.3.5 ProModel for Windows
ProModel is a discrete event simulator that can run under DOS (ProModelPC), Windows 3.1
(ProModel for Windows), and the Macintosh operating system (ProModelMac). It is intended
primarily for modelling discrete part manufacturing systems. We are here assessing ProModel for
Windows (1993) which is based upon ProModelPC. In this section, whenever referencing
ProModel for Windows, we will refer to it as ProModel. ProModel focuses on issues such as
resource utilisation, production capacity, and inventory levels. Typical applications for using
ProModel include:
• Assembly lines
• Job Shops
• Transfer lines
• Flexible manufacturing systems
ProModel views a production system as an arrangement of processing locations, such as
machines or work stations, through which parts (or entities) are processed according to some
processing logic. A system may also include paths, such as aisle-ways for movement, as well as
supporting resources, such as operators and material handling equipment to be used in the
processing and movement of parts. ProModel is a typical Windows application and, as such, it
provides features that are commonly present in such applications (i.e., GUI, point and click
operations). When ProModel is started it opens its window with a main menu bar offering the
following selections: File (contains: open new or existing models, save current models, view a
text version of the model and print either the model text file or the graphical layout of the model),
Edit (contains relevant selections for editing the contents of edit tables and logic windows
depending on the origin from which the Edit menu is selected), Build (contains all of the modules
for defining a model), Simulation (controls the execution of the model), Output (for viewing
model output), Tools (contains various utilities), Options (contains selections for setting up the
modelling environment), Window (contains standard Windows options), and Help (on-line help
and tutorial).
J. Kuljis User Interfaces and Discrete Event Simulation Models Page 54
Chapter 2: User Interfaces to Discrete Event Simulation Systems
Data input/ model specification
ProModel gives the user flexibility to define a model in several ways. The easiest method is to use
a graphical point and click approach to first define locations in the system (see Figure 2.13). Once
locations have been defined, entities (parts) are defined and scheduled to arrive at locations in the
system. Then the user has to define any optional model elements such as attributes, variables or
arrays that will be referenced in the processing. Finally, the processing of entities at each location
is specified in the processing logic (see Figure 2.14). Models can be built manually using the
‘Build’ menu or using a structured environment called ‘Auto-Build’ that guides the user through
the required and optional modelling elements. The AutoBuild feature starts automatically each time
the user enters ProModel, unless the user has selected ‘Advanced User’ in the ‘Options’ menu.
The ‘Options’ menu enables the user to change certain model aspects such as background
colours, to display a layout grid or not, etc. The user can also change the colour of the layout
background, add text and basic graphical objects (i.e., lines, rectangles, circles), or import a bit
mapped graphic and use it as the background of the simulation model under construction. The
Graphic editor that can be invoked from the ‘Tools’ menu consists of: a graphic tool menu,
colours menu, and a drawing window. Objects that can be drawn on the screen are text, lines,
triangles, regular squares and rectangles, rounded squares and rectangles, raised squares and
rectangles, circles and ellipses, polygons, and entity spots. Objects drawn on the screen can be
resized, reshaped, repositioned, flipped or rotated, copied, and deleted. The colour and pattern of
objects can be changed. There are 48 basic colours to choose from. In addition, the user can
specify 16 custom colours. All of the 64 colours may be used as the fill and line colours for
graphic primitives or for the background colour. There are eight fill patterns defined. The user can
change only a pattern’s foreground colour. The pattern’s background colour is always the same as
the screen background colour. There are four line styles. The user can vary the thickness of the
line or border. Text attributes that can be defined include font type, font size, colour, alignment,
and various options for a text frame. The Graphic editor is very simple to use, it is flexible, and
icons that represent tools are fairly self-explanatory. Once the simulation background is drawn the
user can start to define the model.
J. Kuljis User Interfaces and Discrete Event Simulation Models Page 55
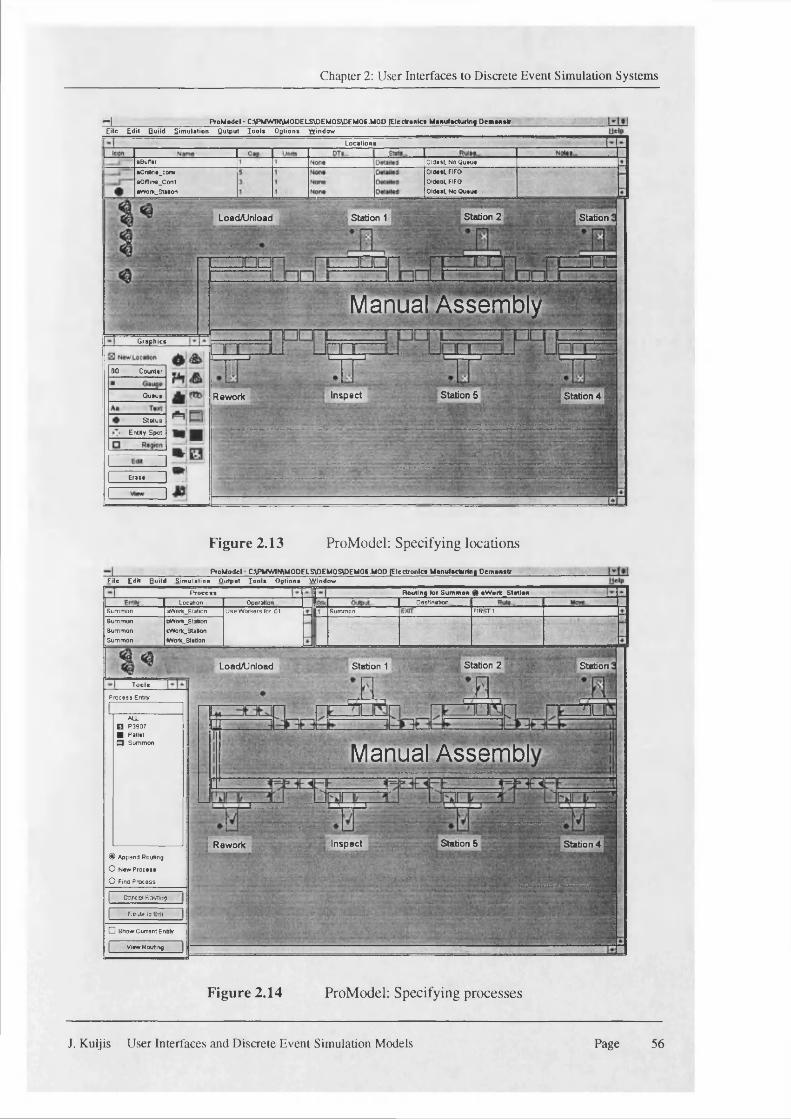
Chapter 2: User Interfaces to Discrete Event Simulation Systems
- J ________________________ ProM»d«»- C:\PMW1N\M00E1-S\DEM0S\DEM0S.M0P [ElecSroalca MaouFocluflng DewotssSrEile Edit Build S im ulation flu tput lo o ts OQlion« W indow _____________________________________________________
lo c a tio n s
aBuffer Oldest. No QueueOld* at. FIFO Oldest, FIFO Old**!. No Queue
aOnHne.con*aOffline_ContsWorteStalon
Station 2LoadAJnload Station 1 Station
Manual AssemblyG raphics
00 Counter
Station 5Inspect Station 4Queue Rework
Status
Entity Spot
Eras#-i- •* : •
F ile E d it Q u ild S im u la tio n O u tp u t l o o t s O p tio n s W in d o w
Routing tot Summon % eWsrtc_StetlonF*rocesaOperatior Destinationlocation
FIRST 1Sum m on a W o rkS ta lio n U se W orkers (or Ot SummonSummonSummonSummon
BWork_StatroncWorV_StiBonWor*_S1atlon
Station 2 ,r ; 'LoadAJnload Station 1 Station
Tools
Process Entity.
Manual Assembl
Inspect Station 5 Station 4Rework® Append Routing
O New Process
O Find Process
C nnral fcdvsng
Rout* lo fell
□ Show Current EnMy
View Routing
ALL O P3907 ■ Pellet □ Summon
Figure 2.13 ProModel: Specifying locations
ProM odel C.V>MW1N\MOOELS\OEMOS\DEMOt.MOD (Electronics M an u tac tarim D cm an str
Figure 2.14 ProModel: Specifying processes
J. Kuljis User Interfaces and Discrete Event Simulation Models Page 56
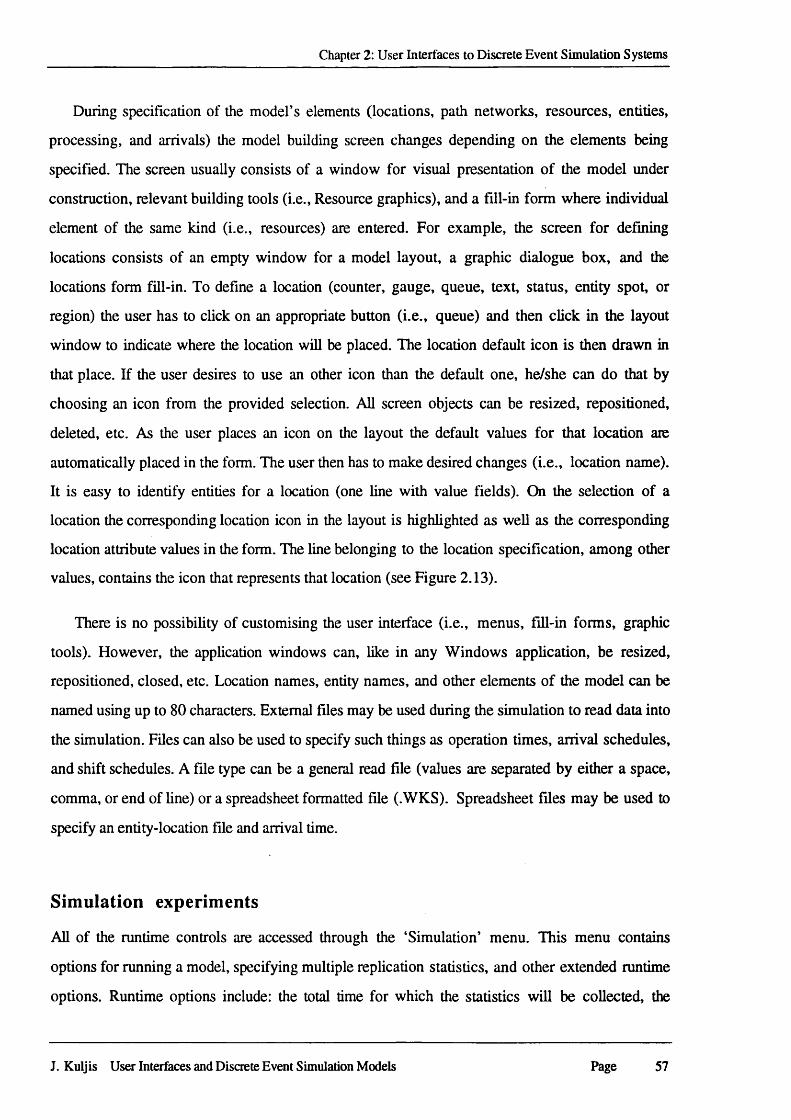
Chapter 2: User Interfaces to Discrete Event Simulation Systems
During specification of the model’s elements (locations, path networks, resources, entities,
processing, and arrivals) the model building screen changes depending on the elements being
specified. The screen usually consists of a window for visual presentation of the model under
construction, relevant building tools (i.e., Resource graphics), and a fill-in form where individual
element of the same kind (i.e., resources) are entered. For example, the screen for defining
locations consists of an empty window for a model layout, a graphic dialogue box, and the
locations form fill-in. To define a location (counter, gauge, queue, text, status, entity spot, or
region) the user has to click on an appropriate button (i.e., queue) and then click in the layout
window to indicate where the location will be placed. The location default icon is then drawn in
that place. If the user desires to use an other icon than the default one, he/she can do that by
choosing an icon from the provided selection. All screen objects can be resized, repositioned,
deleted, etc. As the user places an icon on the layout the default values for that location are
automatically placed in the form. The user then has to make desired changes (i.e., location name).
It is easy to identify entities for a location (one line with value fields). On the selection of a
location the corresponding location icon in the layout is highlighted as well as the corresponding
location attribute values in the form. The line belonging to the location specification, among other
values, contains the icon that represents that location (see Figure 2.13).
There is no possibility of customising the user interface (i.e., menus, fill-in forms, graphic
tools). However, the application windows can, like in any Windows application, be resized,
repositioned, closed, etc. Location names, entity names, and other elements of the model can be
named using up to 80 characters. External files may be used during the simulation to read data into
the simulation. Files can also be used to specify such things as operation times, arrival schedules,
and shift schedules. A file type can be a general read file (values are separated by either a space,
comma, or end of line) or a spreadsheet formatted file (.WKS). Spreadsheet files may be used to
specify an entity-location file and arrival time.
Simulation experiments
All of the runtime controls are accessed through the ‘Simulation’ menu. This menu contains
options for running a model, specifying multiple replication statistics, and other extended runtime
options. Runtime options include: the total time for which the statistics will be collected, the
J. Kuljis User Interfaces and Discrete Event Simulation Models Page 57
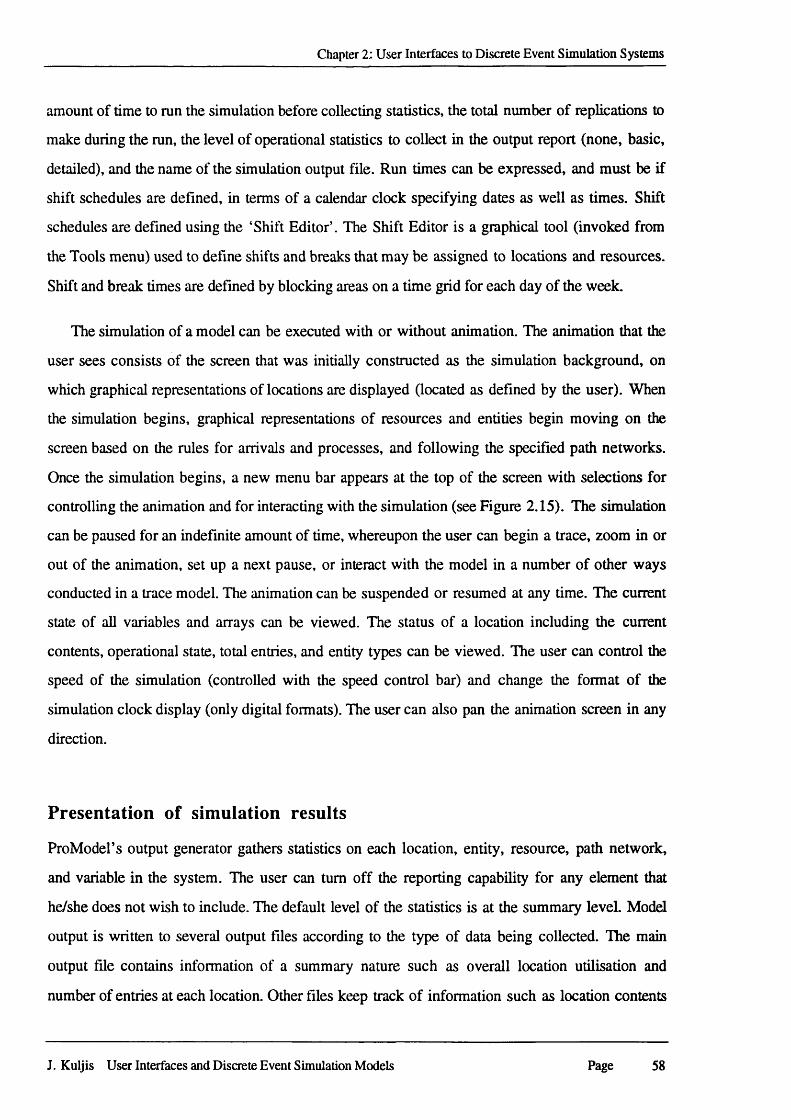
Chapter 2: User Interfaces to Discrete Event Simulation Systems
amount of time to run the simulation before collecting statistics, the total number of replications to
make during the run, the level of operational statistics to collect in the output report (none, basic,
detailed), and the name of the simulation output file. Run times can be expressed, and must be if
shift schedules are defined, in terms of a calendar clock specifying dates as well as times. Shift
schedules are defined using the ‘Shift Editor’. The Shift Editor is a graphical tool (invoked from
the Tools menu) used to define shifts and breaks that may be assigned to locations and resources.
Shift and break times are defined by blocking areas on a time grid for each day of the week.
The simulation of a model can be executed with or without animation. The animation that the
user sees consists of the screen that was initially constructed as the simulation background, on
which graphical representations of locations are displayed (located as defined by the user). When
the simulation begins, graphical representations of resources and entities begin moving on the
screen based on the rules for arrivals and processes, and following the specified path networks.
Once the simulation begins, a new menu bar appears at the top of the screen with selections for
controlling the animation and for interacting with the simulation (see Figure 2.15). The simulation
can be paused for an indefinite amount of time, whereupon the user can begin a trace, zoom in or
out of the animation, set up a next pause, or interact with the model in a number of other ways
conducted in a trace model. The animation can be suspended or resumed at any time. The current
state of all variables and arrays can be viewed. The status of a location including the current
contents, operational state, total entries, and entity types can be viewed. The user can control the
speed of the simulation (controlled with the speed control bar) and change the format of the
simulation clock display (only digital formats). The user can also pan the animation screen in any
direction.
Presentation of simulation results
ProModel’s output generator gathers statistics on each location, entity, resource, path network,
and variable in the system. The user can turn off the reporting capability for any element that
he/she does not wish to include. The default level of the statistics is at the summary level. Model
output is written to several output files according to the type of data being collected. The main
output file contains information of a summary nature such as overall location utilisation and
number of entries at each location. Other files keep track of information such as location contents
J. Kuljis User Interfaces and Discrete Event Simulation Models Page 58
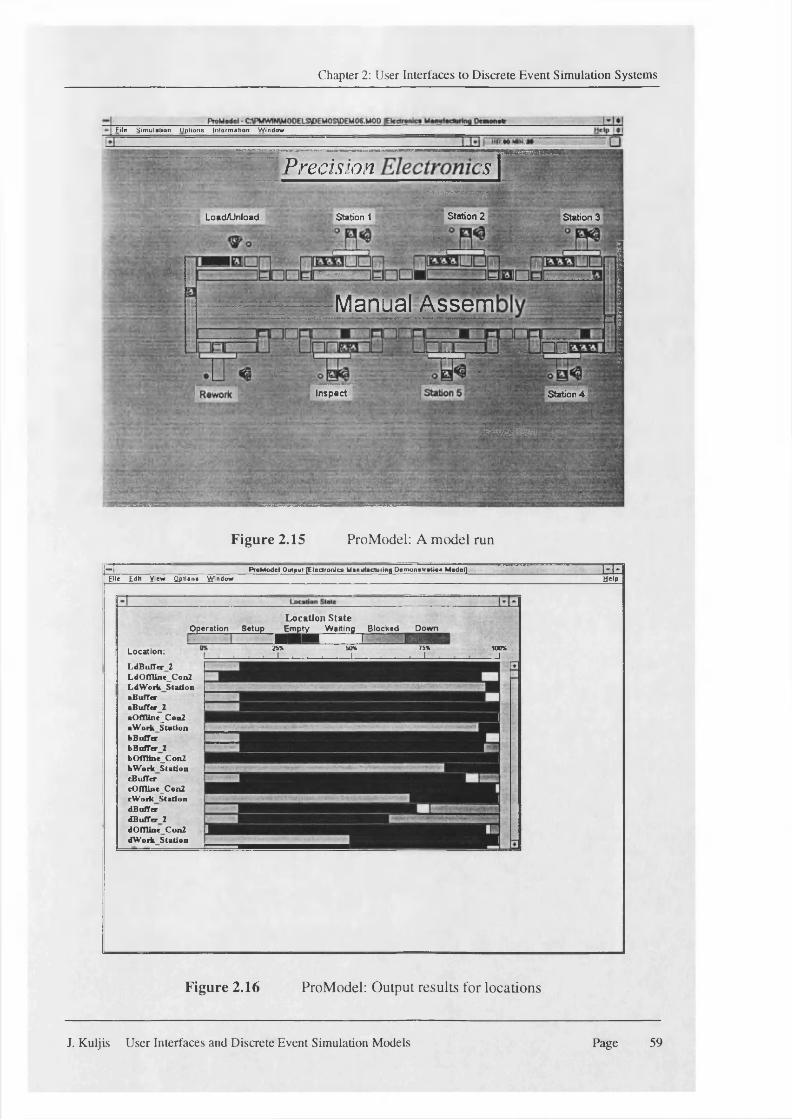
Chapter 2: User Interfaces to Discrete Event Simulation Systems
m m m m
File S im ulation Options |n lo im ation W indow
Precision E
Station 2LoadAJnload Station 1 Station 3
Manual Assem• ■ ,
Inspect Station 4
y, , - C. -I,
Figure 2.15 ProModel: A model run
—I ProM odel Output [Electronics M anufacturing D om onetralioa Model] l.-J-Ellt Edit y iew O ptions W indow Uelp
Location:
LdBufTer 2L dO m int Con2L dW o rk S tad o n> B u fT « raBu(T«r_2»Omine_Coa2aW o rk S tad o nbBufferb B u f f e r 2bOfTUnc_Con2
IbW o rk S ta tio u cBulTer cOmine_Con2 cW orkS tadon dBufTar dBufTer 2 dOfnine Con2 dW orkS ta tion
Location State Operation Setup Empty Waiting Blocked DownEmpty Waiting Blocked Down
H BH I '■2S% 50% f 5%
_l ,__ .__, . |__. c . * I , 100%_ J
Figure 2.16 ProModel: Output results for locations
J. Kuljis User Interfaces and Discrete Event Simulation Models Page 59
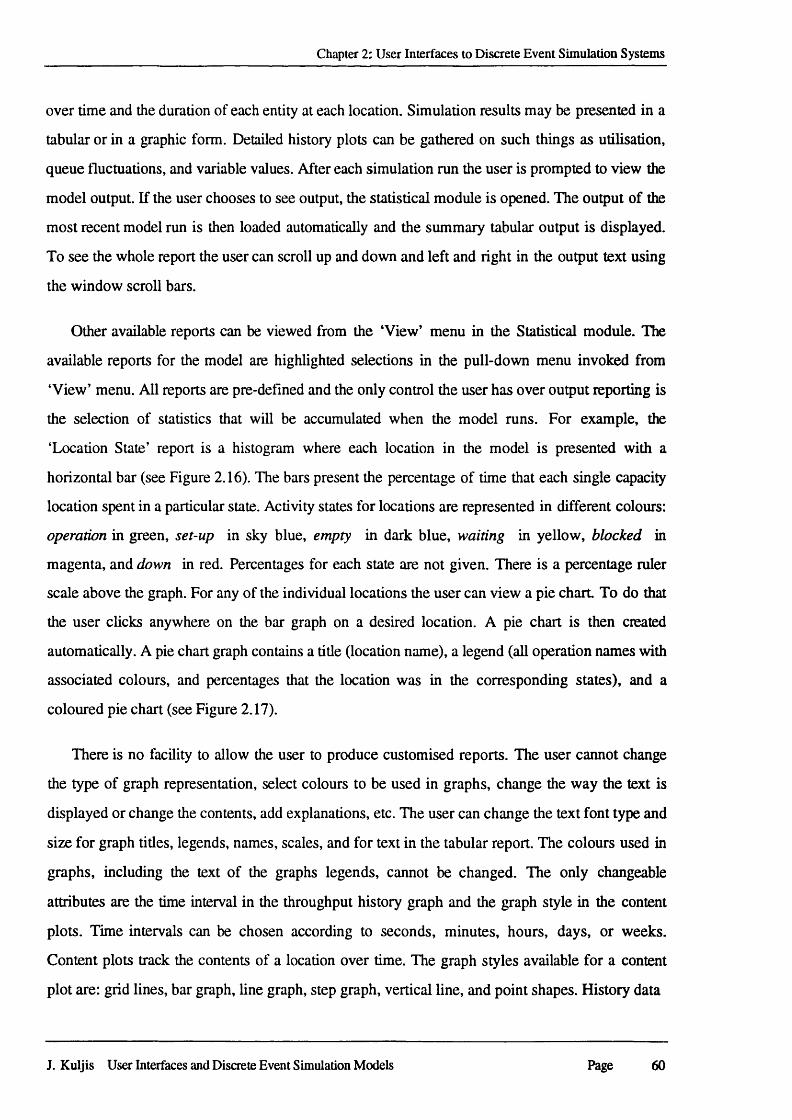
Chapter 2: User Interfaces to Discrete Event Simulation Systems
over time and the duration of each entity at each location. Simulation results may be presented in a
tabular or in a graphic form. Detailed history plots can be gathered on such things as utilisation,
queue fluctuations, and variable values. After each simulation run the user is prompted to view the
model output. If the user chooses to see output, the statistical module is opened. The output of the
most recent model run is then loaded automatically and the summary tabular output is displayed.
To see the whole report the user can scroll up and down and left and right in the output text using
the window scroll bars.
Other available reports can be viewed from the ‘View’ menu in the Statistical module. The
available reports for the model are highlighted selections in the pull-down menu invoked from
‘View’ menu. All reports are pre-defined and the only control the user has over output reporting is
the selection of statistics that will be accumulated when the model runs. For example, the
‘Location State’ report is a histogram where each location in the model is presented with a
horizontal bar (see Figure 2.16). The bars present the percentage of time that each single capacity
location spent in a particular state. Activity states for locations are represented in different colours:
operation in green, set-up in sky blue, empty in dark blue, waiting in yellow, blocked in
magenta, and down in red. Percentages for each state are not given. There is a percentage ruler
scale above the graph. For any of the individual locations the user can view a pie chart To do that
the user clicks anywhere on the bar graph on a desired location. A pie chart is then created
automatically. A pie chart graph contains a title (location name), a legend (all operation names with
associated colours, and percentages that the location was in the corresponding states), and a
coloured pie chart (see Figure 2.17).
There is no facility to allow the user to produce customised reports. The user cannot change
the type of graph representation, select colours to be used in graphs, change the way the text is
displayed or change the contents, add explanations, etc. The user can change the text font type and
size for graph titles, legends, names, scales, and for text in the tabular report. The colours used in
graphs, including the text of the graphs legends, cannot be changed. The only changeable
attributes are the time interval in the throughput history graph and the graph style in the content
plots. Time intervals can be chosen according to seconds, minutes, hours, days, or weeks.
Content plots track the contents of a location over time. The graph styles available for a content
plot are: grid lines, bar graph, line graph, step graph, vertical line, and point shapes. History data
J. Kuljis User Interfaces and Discrete Event Simulation Models Page 60
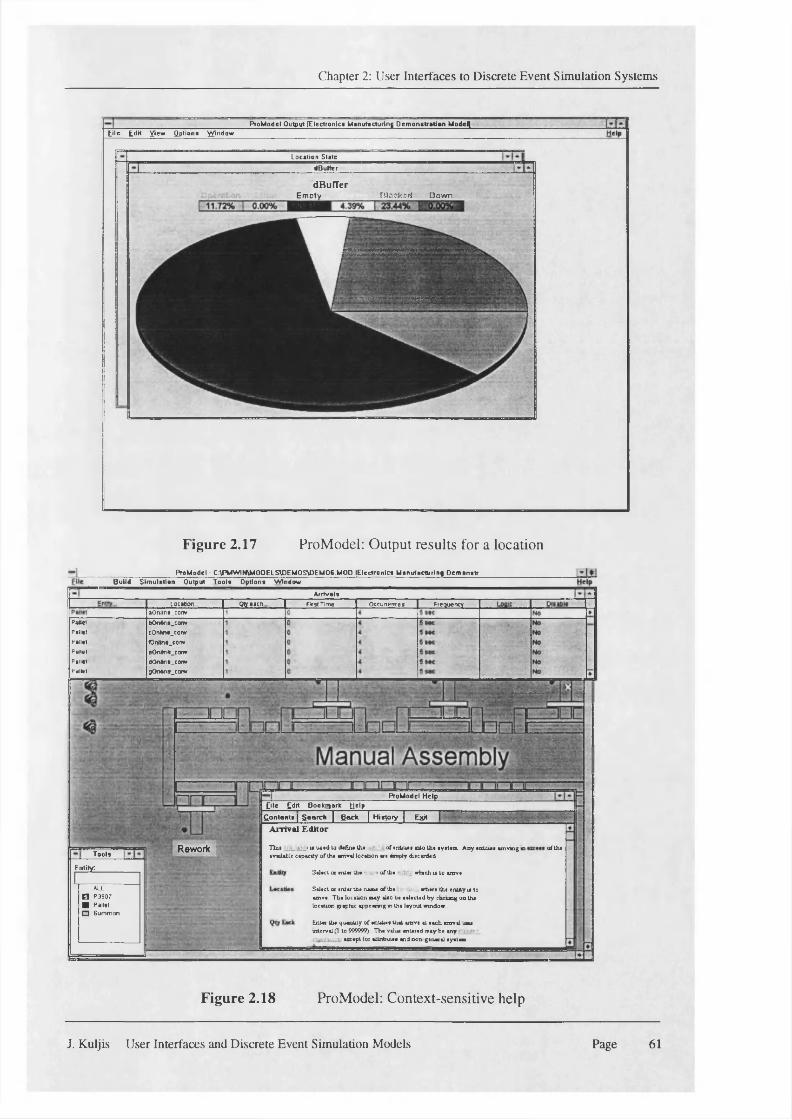
Chapter 2: User Interfaces to Discrete Event Simulation Systems
E m p ty Blackad Down
ProM odel Output [E lectronic! M anufacturing D em o n stra tio n M o d e lt i l e Edit y iew Qptions W indow
Locetion Slate
dB ulftr
dBulTer
B uild S im ulation Output Toole O ptlom W indow
Arrival*Location
»Onllne_convQtyaacn. First Time Occurrences Frequency
ProM odel HelpEile Edit Bookm ark Help
Contents j S»ard> | Bode | Hietory | E&H
Arrival Editor
Rework Thu : - i u u«»d lo cUfei* Ul* -- - of inbtiasmlo tha system Any entities emvmgid of thsavailable capacity of tha arrival location are amply discardedTools
Salad oc anlat the • . < of tha which is Lo amva
Salad or enter tha aaea of tha where the entity is toamva. Tbs location may also bs seledsd by clicking on tha location ptphic appeanrg m the layout enndoer
Entas tha quantity of antitiss that trove at each axxzval lima interval 0 to 999999) Tha valua antaead may be any ' :
arc apt for attnbutas and nonginaral system
Figure 2.17 ProModel: Output results for a location
ProM odel - C:\PMW1M\MODELS\DEMOS\DEM06.MOD lE lcctronlcs M anufacturing D em enstr
MM bOndna_conycOnima.corwlOnMna.conveOn«re_can»dOnllne_convjOntine.cony
Pallet
Pallet
Pallet
Pallet
P a lle t
Entity:
ALL El P3907 ■ Pallet P Summon
Figure 2.18 ProModel: Context-sensitive help
J. Kuljis User Interfaces and Discrete Event Simulation Models Page 61
Chapter 2: User Interfaces to Discrete Event Simulation Systems
can be exported to an external text or a binary file that can then, in theory be used in a spreadsheet
program for more complex data analysis.
User support and assistance
Compared with the other examined simulation systems, ProModel looks like a professional
product Manuals are separated into Getting Started (1993), User Manual (1993), and Reference
Manual (1993). The manuals are carefully organised and well written using a not too technical
language. Every manual contains an index of discussed topics. Finding a topic in the index is not
easy if the user does not know the terminology used. For example, the index in the User’s Guide
has no entry for icons. The manual uses the term graphics for icons as well for other graphic
concepts like, for example, output graphs. ProModel comes with a demonstration disk that is
done professionally. The user can use the demonstration program at his/her own pace. All major
components of the systems are covered and the user can choose the topic to be introduced to. The
demonstration program provides some animated examples and gives the feel of the system prior to
using it.
An on-line help system is provided throughout a ProModel session. The help structure and
navigation is the standard Windows type of help. It is in the form of hypertext and the user can
navigate through it using link nodes. Help has standard facilities for printing, editing, bookmarks,
and help on using help. In any of the help windows the user can see the help contents, search for
a particular topic, go back to the previous help window, and view the help viewing history. Every
ProModel module has a Help option in the main menu. Help can be obtained by choosing the
Help menu and then making one of the following selections: index, context, and tutorial. Index
contains about a dozen major topics. Topics are sorted based on the order of their use in a model
development cycle rather than alphabetically (i.e., ProModel Overview, Building a Model,
Running a Model, etc.). One of the topics is a Glossary that provides a short alphabetic listing of
ProModel concepts. All topics listed in the index and in the glossary are link nodes to relevant
help screens. Context provides context-sensitive help for a particular ProModel module (e.g. if the
user is building locations, context will provide help on the Location Editor). Context-sensitive
help can also be invoked by pressing the FI key at any point in model building, running, and
viewing simulation output, or using built-in tools. Context-sensitive help gives a concise
J. Kuljis User Interfaces and Discrete Event Simulation Models Page 62
Chapter 2: User Interfaces to Discrete Event Simulation Systems
description of the current module, or of the current dialogue box (see Figure 2.18). The user can
then explore in more detail instructions/ descriptions of the desired features/ topics using the link
nodes in the text.
Tutorial provides: the system overview (lessons on the Windows environment, on building
models, running models, and on output reports), getting started (a step by step tutorial for
building a simple model), and how to ...(an interactive lesson on how to use the system’s major
modules like, for example, creating background graphics). Tutorial also provides instructions on
how to use the tutorial. The tutorial is an easy to use effective tool to get familiarised with the
ProModel modelling environment and its basic concepts.
Usability evaluation
ProModel provides an easy to use environment that supports model building well. Development
of our small queuing problem was not too difficult. The available user documentation, extensive
on-line help, and demonstration programs provide all the necessary material to accomplish the
task. The system provides consistent and structured dialogue that matches the user task. The
screen design and dialogue do not require the user to memorise information from previous
screens. Instructions for use of the system are visible and always available. ProModel always
provides feedback on where in the system the user is, what actions are being performed, and
which objects are affected. Error messages are well explained and there are always clearly marked
exits. Leamability is therefore also well supported. Flexibility is supported quite well. There is a
facility for guiding an inexperienced user through the necessary steps of model development.
Experienced users can choose the order in which to perform the steps of tasks. All the above
system characteristics promote a high user satisfaction and willingness to use the system again.
However, since the used terminology is from the manufacturing domain it can create some
problems when dealing with problems from other domains (e.g., queuing problems).
2.3 .6 Micro Saint for Windows
Micro Saint is “a network simulation software package for building models to simulate real-life
processes”. It runs on the Macintosh, MS-Windows, and Unix. Micro Saint for Windows (1992)
is a PC based system that runs under Microsoft Windows 3.0 (or later). It requires at least 3MB
J. Kuljis User Interfaces and Discrete Event Simulation Models Page 63
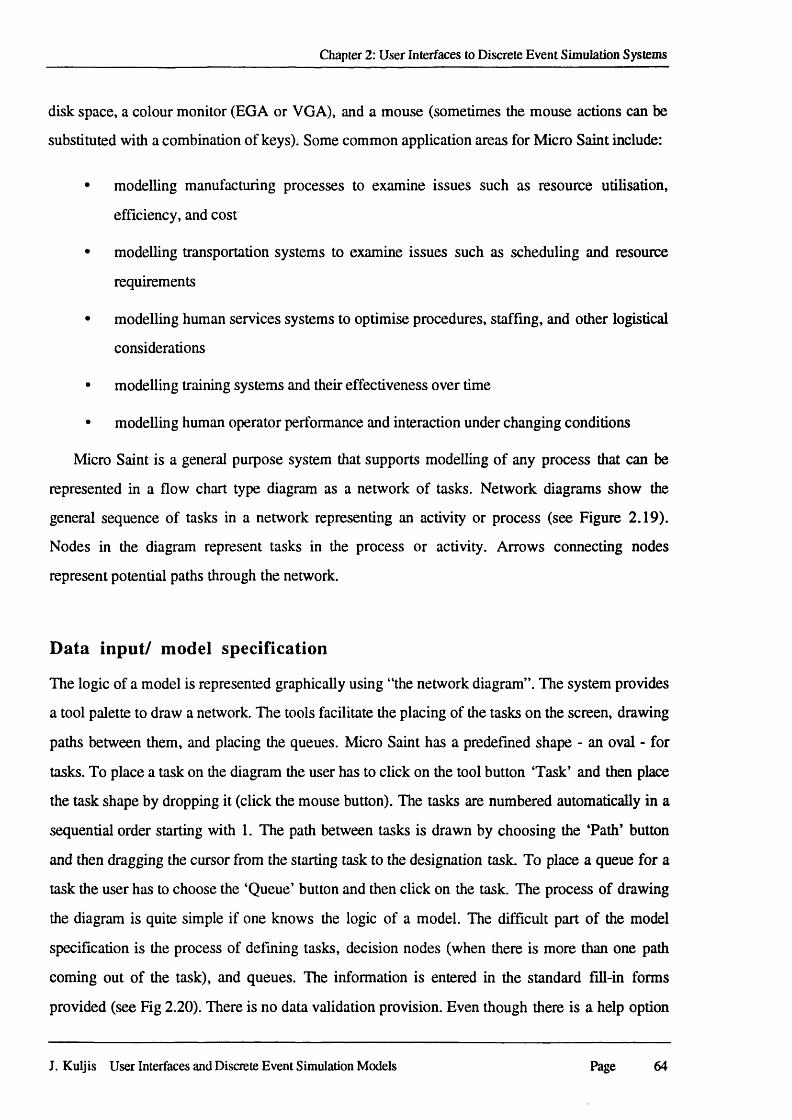
Chapter 2: User Interfaces to Discrete Event Simulation Systems
disk space, a colour monitor (EGA or VGA), and a mouse (sometimes the mouse actions can be
substituted with a combination of keys). Some common application areas for Micro Saint include:
• modelling manufacturing processes to examine issues such as resource utilisation,
efficiency, and cost
• modelling transportation systems to examine issues such as scheduling and resource
requirements
• modelling human services systems to optimise procedures, staffing, and other logistical
considerations
• modelling training systems and their effectiveness over time
• modelling human operator performance and interaction under changing conditions
Micro Saint is a general purpose system that supports modelling of any process that can be
represented in a flow chart type diagram as a network of tasks. Network diagrams show the
general sequence of tasks in a network representing an activity or process (see Figure 2.19).
Nodes in the diagram represent tasks in the process or activity. Arrows connecting nodes
represent potential paths through the network.
Data input/ model specification
The logic of a model is represented graphically using “the network diagram”. The system provides
a tool palette to draw a network. The tools facilitate the placing of the tasks on the screen, drawing
paths between them, and placing the queues. Micro Saint has a predefined shape - an oval - for
tasks. To place a task on the diagram the user has to click on the tool button ‘Task’ and then place
the task shape by dropping it (click the mouse button). The tasks are numbered automatically in a
sequential order starting with 1. The path between tasks is drawn by choosing the ‘Path’ button
and then dragging the cursor from the starting task to the designation task. To place a queue for a
task the user has to choose the ‘Queue’ button and then click on the task. The process of drawing
the diagram is quite simple if one knows the logic of a model. The difficult part of the model
specification is the process of defining tasks, decision nodes (when there is more than one path
coming out of the task), and queues. The information is entered in the standard fill-in forms
provided (see Fig 2.20). There is no data validation provision. Even though there is a help option
J. Kuljis User Interfaces and Discrete Event Simulation Models Page 64
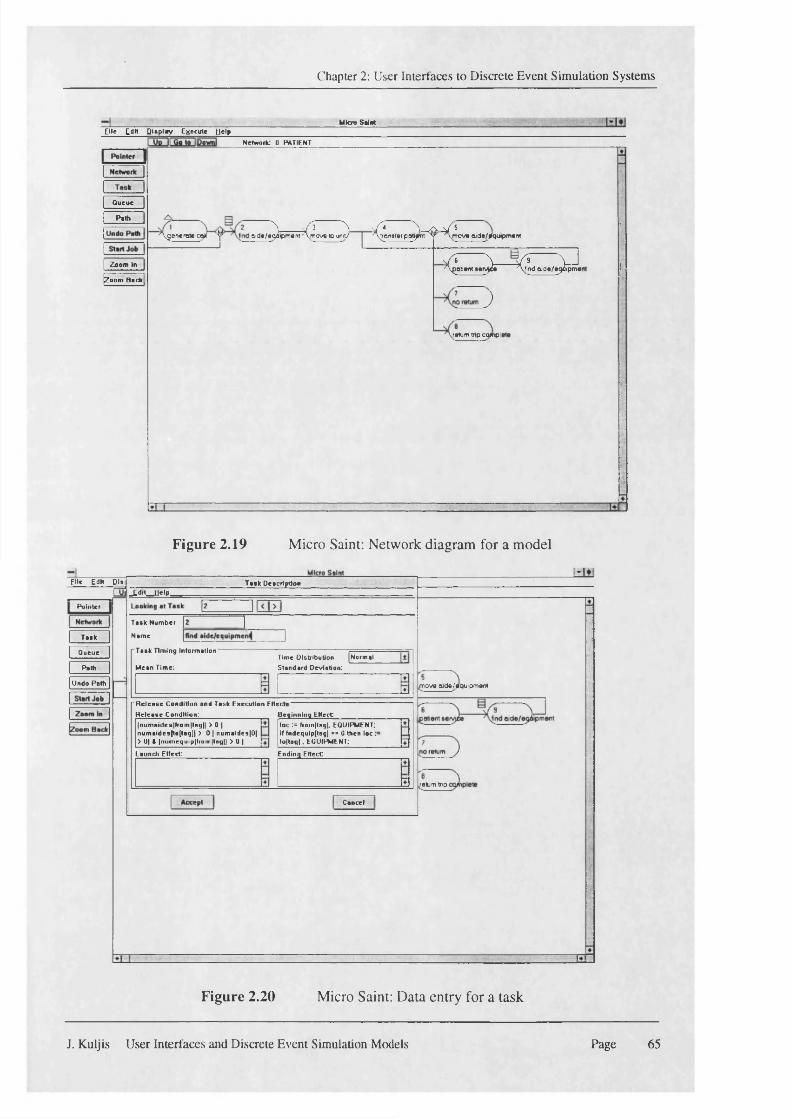
Chapter 2: User Interfaces to Discrete Event Simulation Systems
M kro SalatElle Edit D isp lay Egecute Help
Network: 0 PATIENT
Q ueue
P ith
Zoom In
(zoom B ickl
\__V3 ^ >A V^jvVs-^ g e n e ra te cqM y aide/ecyiipment ^ \m o v e to u rw 7\tran»(er pot^rtt Y ^ y m o v o aids/Vquipmertl
~7> V-4T5 vJ7\g a tie r» s a i v y a 7\find ad e /e^ o ip m e n
J
/ \re tum trip cy n p li
Figure 2.19 Micro Saint: Network diagram for a model
Elle Edit g i g T a lk D escription-L d 't— Help.
Poin ter
T ask N um ber
Nam eT aak
T a lk Tim ing Inform ationQ ueueNormalTime D istribution
S tandard Deviation:M ean Time:Path
Undo Path m ove aido/oquipm ent
" R e le a se C ondition and Task Execution EHecti R e le a s e Condition: B eginning E ltec t_____________
loc : - trorn|lng|. EQUIPMENT; If fndequlpftag] == 0 then loc :■ lo |la g |. EQUIPMENT;________
|n u m a id e s |f r o m |l a g | | > 0 | n u m iid e s |to ( tag ]l > 0 | n u m ald es |0 | > 0 | I |n u m e q u ip |t r o m |ta g || > 0 |
Launch Effect: Ending E ffect
rekimtnp
Cancel
Figure 2.20 Micro Saint: Data entry for a task
J. Kuljis User Interfaces and Discrete Event Simulation Models Page 65
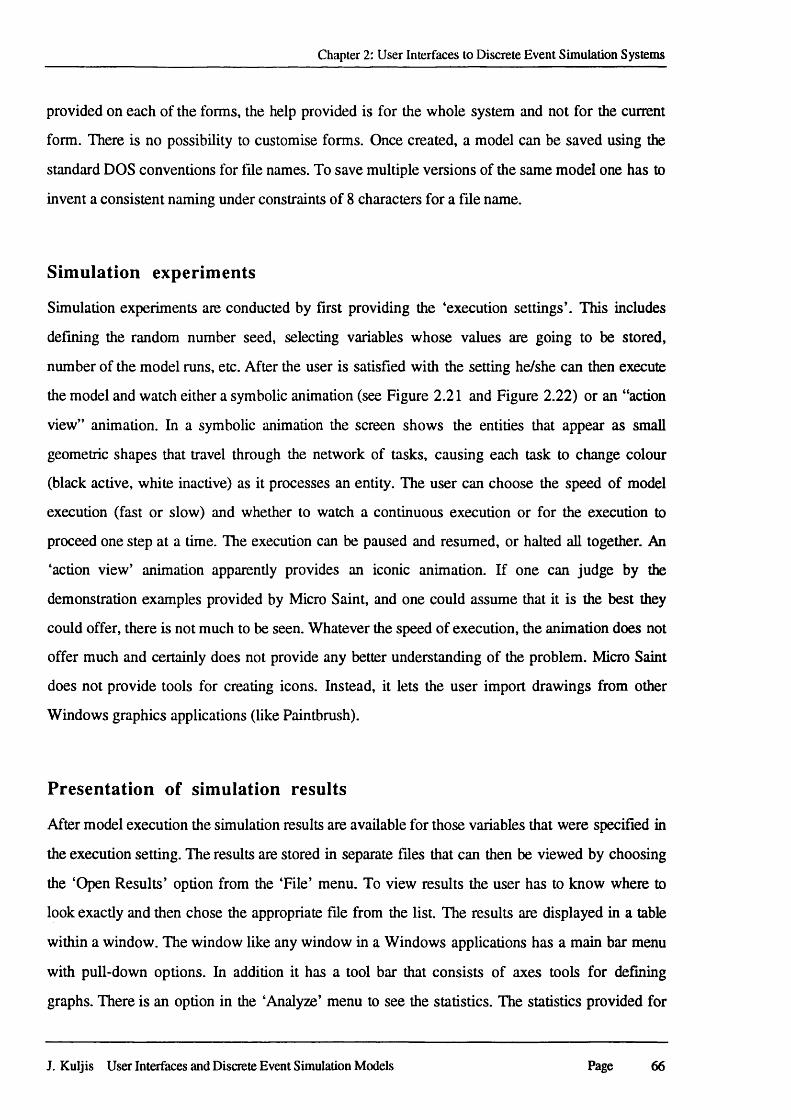
Chapter 2: User Interfaces to Discrete Event Simulation Systems
provided on each of the forms, the help provided is for the whole system and not for the current
form. There is no possibility to customise forms. Once created, a model can be saved using the
standard DOS conventions for file names. To save multiple versions of the same model one has to
invent a consistent naming under constraints of 8 characters for a file name.
Simulation experiments
Simulation experiments are conducted by first providing the ‘execution settings’. This includes
defining the random number seed, selecting variables whose values are going to be stored,
number of the model runs, etc. After the user is satisfied with the setting he/she can then execute
the model and watch either a symbolic animation (see Figure 2.21 and Figure 2.22) or an “action
view” animation. In a symbolic animation the screen shows the entities that appear as small
geometric shapes that travel through the network of tasks, causing each task to change colour
(black active, white inactive) as it processes an entity. The user can choose the speed of model
execution (fast or slow) and whether to watch a continuous execution or for the execution to
proceed one step at a time. The execution can be paused and resumed, or halted all together. An
‘action view’ animation apparently provides an iconic animation. If one can judge by the
demonstration examples provided by Micro Saint, and one could assume that it is the best they
could offer, there is not much to be seen. Whatever the speed of execution, the animation does not
offer much and certainly does not provide any better understanding of the problem. Micro Saint
does not provide tools for creating icons. Instead, it lets the user import drawings from other
Windows graphics applications (like Paintbrush).
Presentation of simulation results
After model execution the simulation results are available for those variables that were specified in
the execution setting. The results are stored in separate files that can then be viewed by choosing
the ‘Open Results’ option from the ‘File’ menu. To view results the user has to know where to
look exactly and then chose the appropriate file from the list. The results are displayed in a table
within a window. The window like any window in a Windows applications has a main bar menu
with pull-down options. In addition it has a tool bar that consists of axes tools for defining
graphs. There is an option in the ‘Analyze’ menu to see the statistics. The statistics provided for
J. Kuljis User Interfaces and Discrete Event Simulation Models Page 66
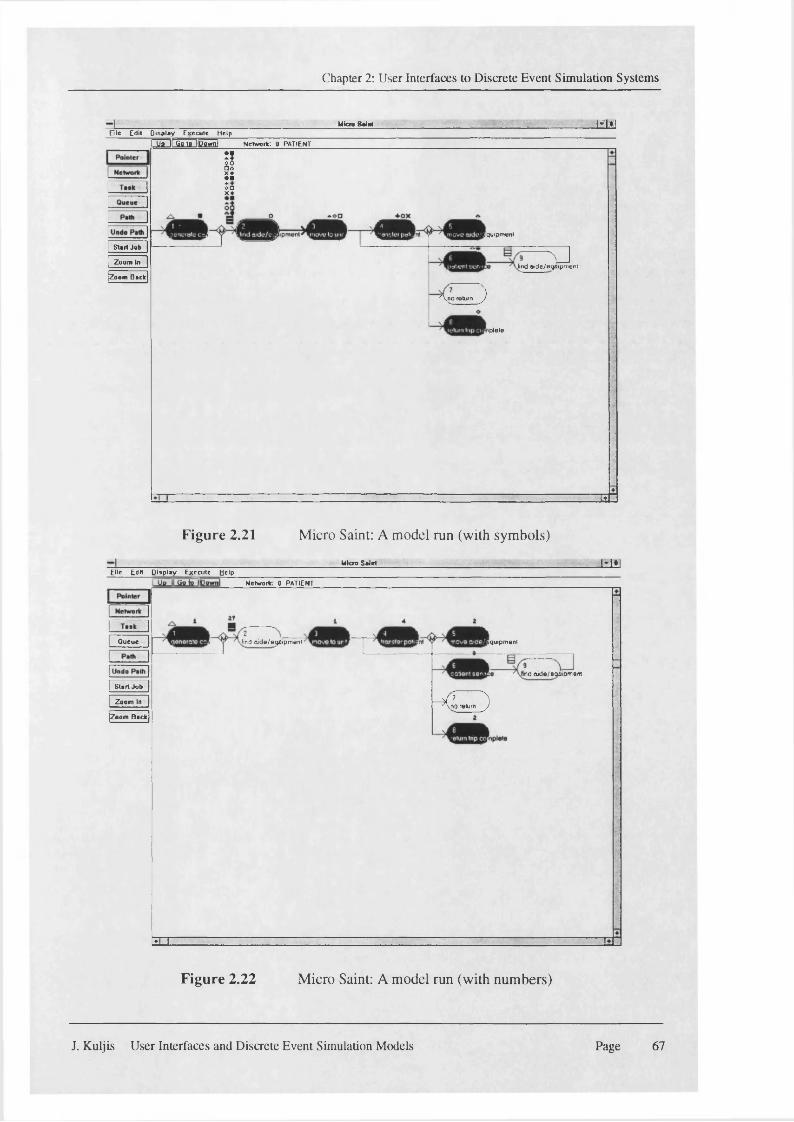
Chapter 2: User Interfaces to Discrete Event Simulation Systems
Mien Salat Milp i c E d it D is p la y E x e c u te H e lp ____________________________
I Un II Go tT llPow nl Network-. 0 PATIENT
Start Job
Zoom In
jZnom Back
i!X*«■Zox
Equipment
S 3eqoipmeiknd oide/eqoipm ent
'l^ \ n o return J
iplele
14
Figure 2.21 Micro Saint: A model run (with symbols)
___________________________________________________________________ Micro Salat___________________________________________________________________ 1*1*1p ie Edit D isp lay Execute Help _______________________________________________________
air»lfrn,H»
Queue
Start Job
Zoom In
jZnom Back
find a id e /e q f iip m B n i
Network: 0 PATIENT
Equipment
md oide/eooipm em
-M7 }/\ n o return J
ILL
Figure 2.22 Micro Saint: A model run (with numbers)
J. Kuljis User Interfaces and Discrete Event Simulation Models Page 67
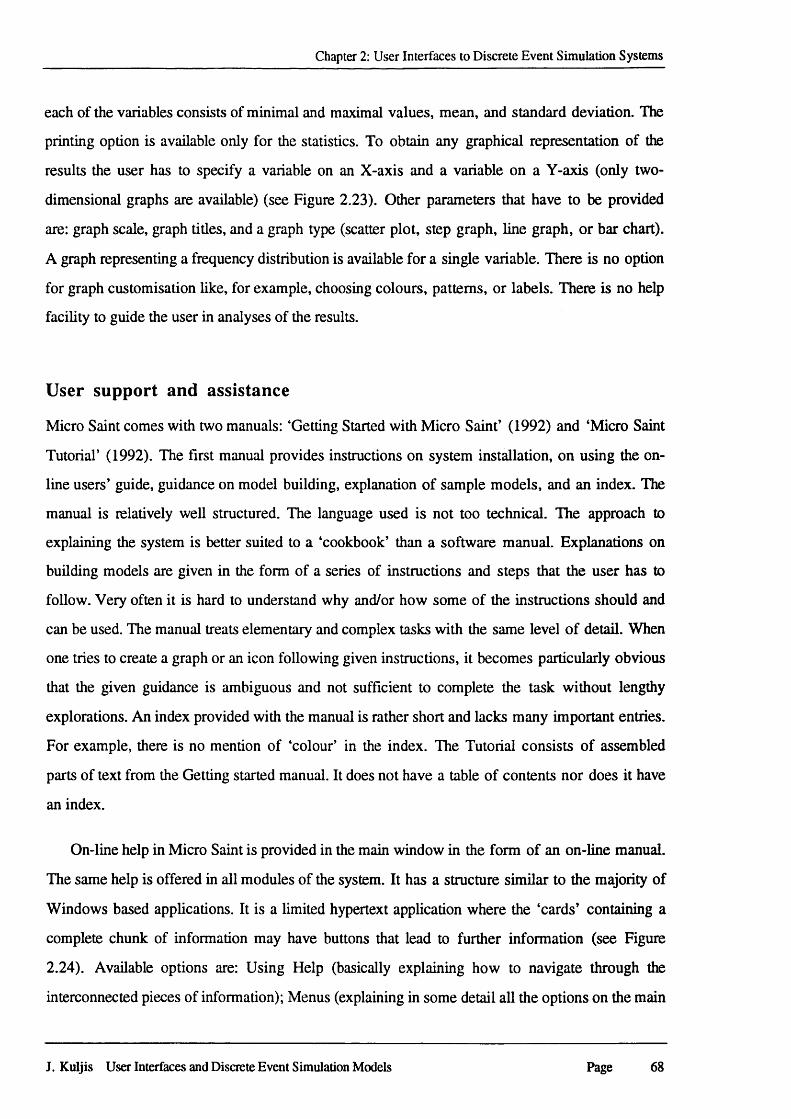
Chapter 2: User Interfaces to Discrete Event Simulation Systems
each of the variables consists of minimal and maximal values, mean, and standard deviation. The
printing option is available only for the statistics. To obtain any graphical representation of the
results the user has to specify a variable on an X-axis and a variable on a Y-axis (only two-
dimensional graphs are available) (see Figure 2.23). Other parameters that have to be provided
are: graph scale, graph titles, and a graph type (scatter plot, step graph, line graph, or bar chart).
A graph representing a frequency distribution is available for a single variable. There is no option
for graph customisation like, for example, choosing colours, patterns, or labels. There is no help
facility to guide the user in analyses of the results.
User support and assistance
Micro Saint comes with two manuals: ‘Getting Started with Micro Saint’ (1992) and ‘Micro Saint
Tutorial’ (1992). The first manual provides instructions on system installation, on using the on
line users’ guide, guidance on model building, explanation of sample models, and an index. The
manual is relatively well structured. The language used is not too technical. The approach to
explaining the system is better suited to a ‘cookbook’ than a software manual. Explanations on
building models are given in the form of a series of instructions and steps that the user has to
follow. Very often it is hard to understand why and/or how some of the instructions should and
can be used. The manual treats elementary and complex tasks with the same level of detail. When
one tries to create a graph or an icon following given instructions, it becomes particularly obvious
that the given guidance is ambiguous and not sufficient to complete the task without lengthy
explorations. An index provided with the manual is rather short and lacks many important entries.
For example, there is no mention of ‘colour’ in the index. The Tutorial consists of assembled
parts of text from the Getting started manual. It does not have a table of contents nor does it have
an index.
On-line help in Micro Saint is provided in the main window in the form of an on-line manual.
The same help is offered in all modules of the system. It has a structure similar to the majority of
Windows based applications. It is a limited hypertext application where the ‘cards’ containing a
complete chunk of information may have buttons that lead to further information (see Figure
2.24). Available options are: Using Help (basically explaining how to navigate through the
interconnected pieces of information); Menus (explaining in some detail all the options on the main
J. Kuljis User Interfaces and Discrete Event Simulation Models Page 68
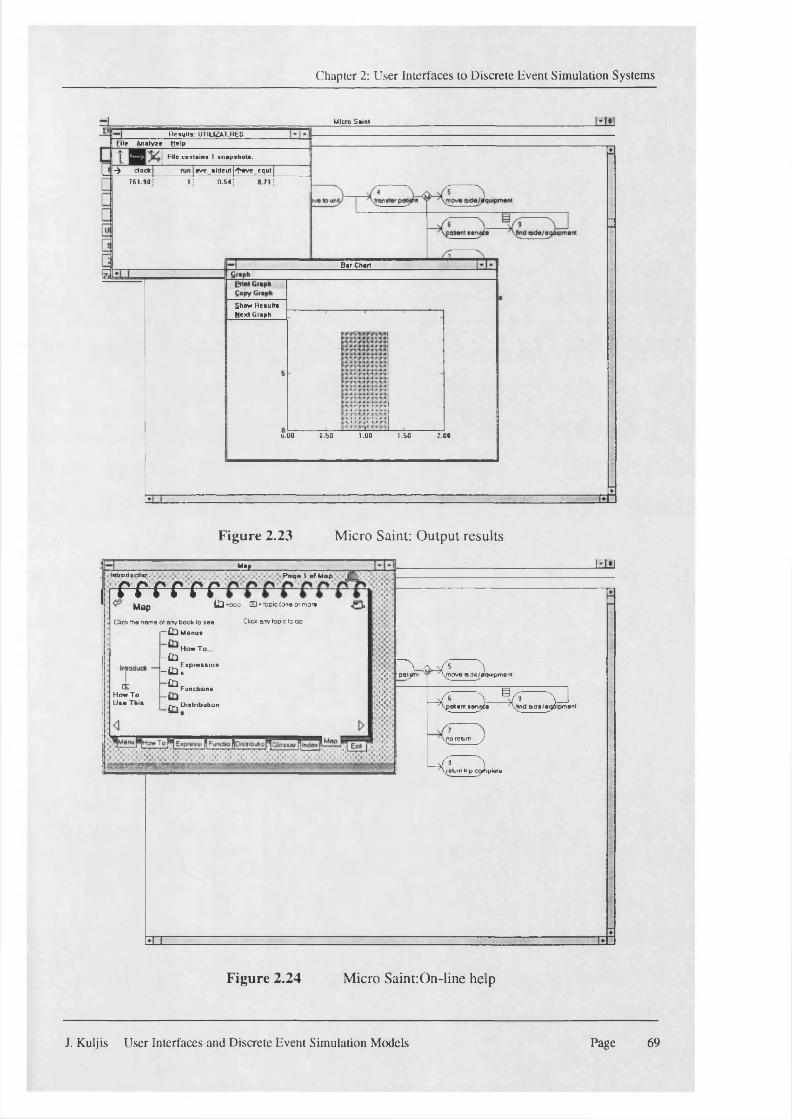
Chapter 2: User Interfaces to Discrete Event Simulation Systems
Micro Saint
R esu lts: UTIUZAT.RESElle A nalyze Help
File contain* 1 sn a p sh o ts .
-> d o ck ave_aldeu t|'T >« v c _ tq u t761.90 0.54
B ar Chart
Show R esu lts Mcxl Grsph
u.00 1.00 1.50 2.000.50
Figure 2.23 Micro Saint: Output results
-MfL,IrrUoductio . P a g e I of Maprrrrrr
Map f i l - b o o GD • topic (one or mors
Click tha nonne ol onv book to see _ £ t l M enus
How T o-£D
oj!CD
F unctions
^ D istribution
Click an v topic to qo
S3 H o w T o U se T h is
E x p re ss io n ~ U J s
;,v.::x-
I
Azlil
~ \ an/5 \p a t y m Y ^ m c i v e aide/yqulipment
Z7‘ v-Sf5 yJ' \p e » sn n seivjes /\h n d aide/egoipment
' \ noreturn J
-J* \A^ietum trip c y ip le te
Figure 2.24 Micro Saint:On-line help
J. Kuljis User Interfaces and Discrete Event Simulation Models Page 69
Chapter 2; User Interfaces to Discrete Event Simulation Systems
menu and the options on the related pull-down menus); How to (explains how to perform the
basic operations on the model, like for example, drawing a diagram); Expressions (explains the
available expressions and their syntax, for example, function); Functions (lists built-in functions
and explains how to develop custom functions); Distributions (lists of probability distributions
available and instructions on how to use some advanced statistical distribution or how to create
custom distributions); Glossary (provides a search facility on an entered word - curiously it
searches through the whole text indiscriminately); Index (an alphabetic list of all relevant terms -
there is a two stage method to display the text related to an index entry); and Map (provides a cut-
down structure of the whole help utility - it does not allow viewing in much depth). There is no
tutorial help.
Overall the help provided is very tedious to use and very very slow. Even though there are
connections between different parts of help options (they are shown on the screen) it is not always
obvious what to look for. There is no provision to go back to the starting page (card) other than
by choosing a related option from the map in the on-line help (see Figure 2.24). The navigation
backwards does not seem to go smoothly, either. It does not backtrack previously visited pages.
The text within the help window is not always clear and fully visible. There is no provision of
context sensitive help. The user has to know exactly what to look for to be able to obtain
information from the help. It is questionable how much the help utility is really a help in designing
a model.
Usability evaluation
The Micro Saint environment enables a relatively fast start in model development. However, the
user would discover fairly quickly that it is rather difficult to complete the model definition. The
user is required to enter programming code into fill-in forms that describe the model behaviour.
Our task to model a small queuing problem suddenly became a complex one, that requires a long
painful learning process which is not supported adequately by the user manual and with on-line
help. Help on error messages is not provided. There is not much flexibility provided in the use of
the system. Micro Saint fails on all four usability criteria. Its effectiveness is impeded with defects
in terminology (the user is required to use programming commands), and in inadequate and
irregular feedback provision. Leamability is seriously affected by the lack of good error
J. Kuljis User Interfaces and Discrete Event Simulation Models Page 70
Chapter 2: User Interfaces to Discrete Event Simulation Systems
messages, inadequate support material, and incompatibility in matching with the user task.
Flexibility is hindered with lack of control over the system. As a consequence the user is often
frustrated and that does not promote a positive attitude towards the system.
2.3.7 WITNESS for Windows
WITNESS is a PC based data-driven VIM manufacturing simulation system that can run under
DOS, Windows, or OS/2. We are here assessing Witness for Windows version 307 (1991).
WITNESS requires at least 4MB of RAM and 6MB hard disk space, Windows 3.0 or later,
30386 based PC, EGA or higher display adapter, a mouse, and a mathematical co-processor is
recommended. The concepts of Witness do not only apply to manufacturing problems, it can be
applied to many areas of business and commerce. Like any typical Windows application
WITNESS is invoked by clicking on its icon in the Main window. On invoking, it takes some
time to load the application, which as a first step displays a modal box containing text stating that
the user is in WITNESS and a button, ‘OK’. To start WITNESS the user has to press ‘Enter’ or
click with the mouse on the ‘OK’ button. This is an unnecessary and pointless additional step.
The main WITNESS screen consists of three windows: ‘Window 1’ (one of the four main
WITNESS windows used to view a virtual WITNESS screen or its part), ‘Interact Box’ (it is the
medium by which transient information may be passed between WITNESS and the user during a
simulation run), and ‘Time’ (used to display simulation time). All WITNESS windows, except
‘Clock’, have a black background.
The main bar menu consists of five pull-down menu choices: File (to open a new or an
existing model, or to save a model and/or its status, or the code, or icons), Edit (to define model
elements, logic, variables, and how the model and its elements are displayed), Windows (for
opening four main WITNESS windows or to toggle the windows ‘Interact Box’, ‘Clock’, and
‘Time’), Info (to open Help, view lists of the current model elements, display reports of the
statistics obtained for simulation elements or their current status, and inspect the WITNESS
internal data concerning the execution of simulation), and Run (to control how the simulation is
run or to interrupt a run).
J. Kuljis User Interfaces and Discrete Event Simulation Models Page 71
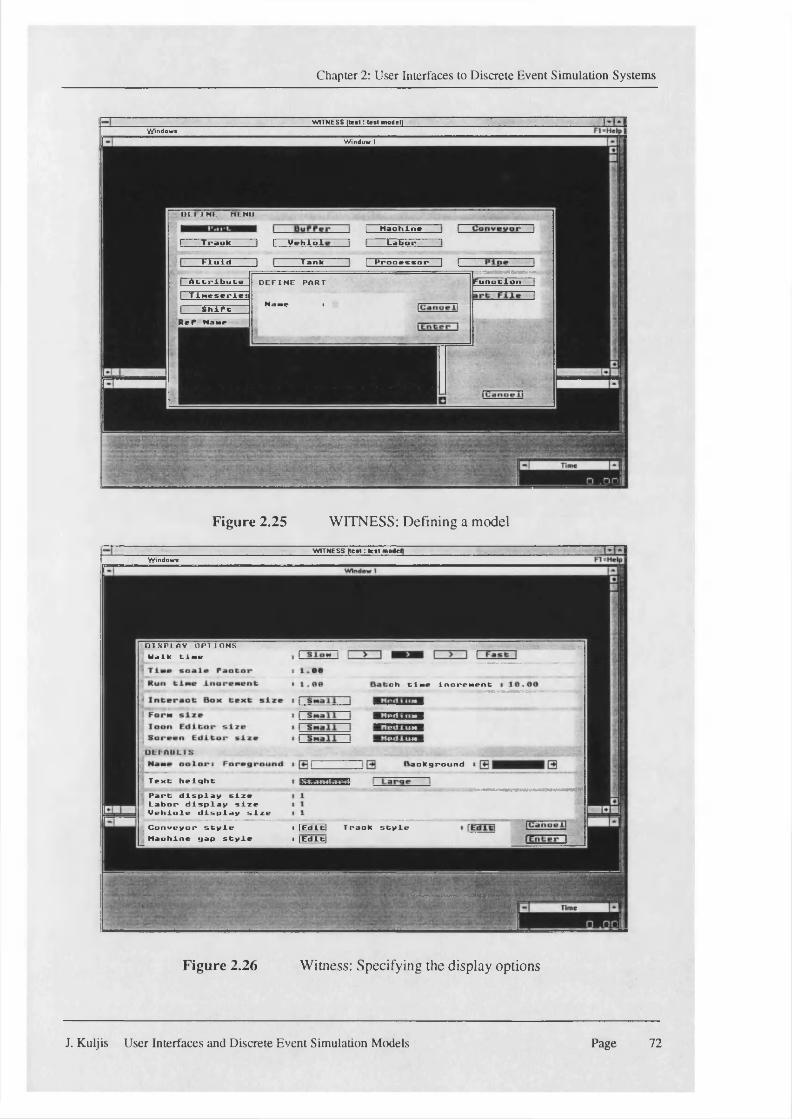
Chapter 2: User Interfaces to Discrete Event Simulation Systems
1 H a ohlKFI Vghloli
I P r n o m o r I
Function
WITNESS [ t e s t : te s t model]W in d o w s
W indow 1
U K I 1 H E H I . N i l
1 r Track--------- Labor
F T u ld Tank
Attribute D E F I N E P A R T
Name iI Tineseries
ShiPtReP Name
W ITNESS [ te s l : le s t model]Windows
O I X P I .A V O P T I O N S Walk time
Text heightPart display size Labor display size Mehiale display sizeConveyor style
’ Maohine gap style• [Editel Traok style i I Edltl
Figure 2.25 WITNESS: Defining a model
Figure 2.26 Witness: Specifying the display options
J. Kuljis User Interfaces and Discrete Event Simulation Models Page 72
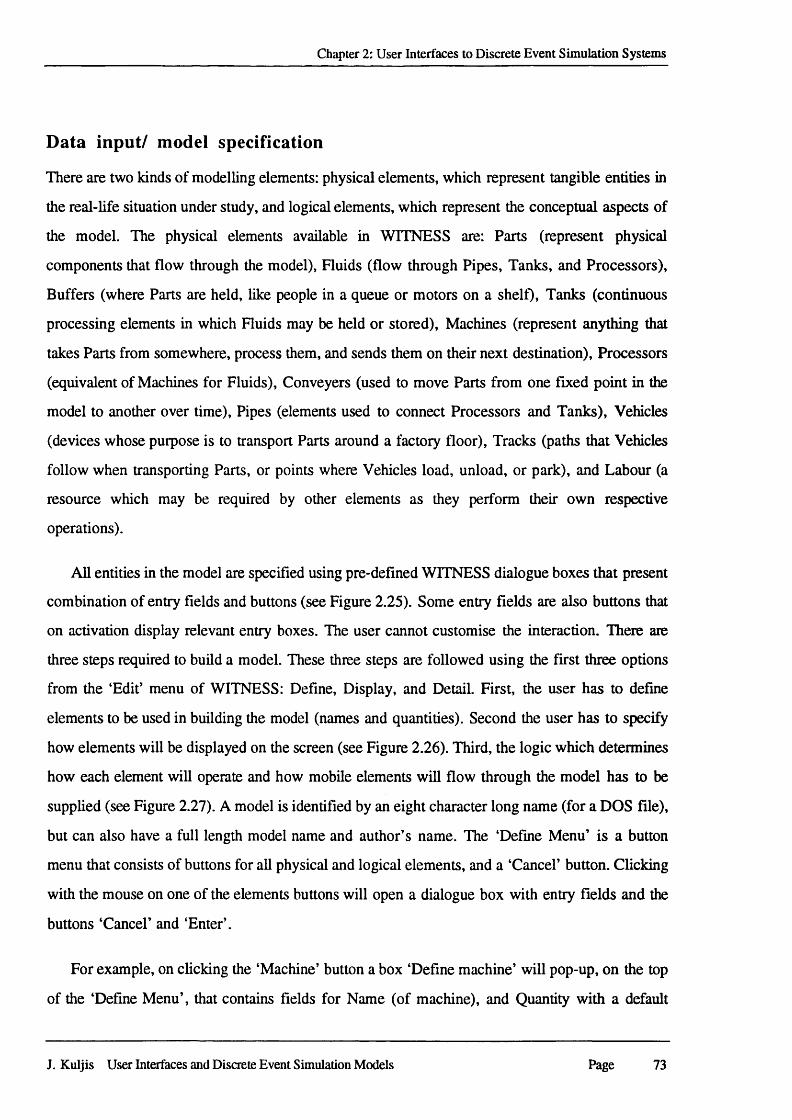
Chapter 2; User Interfaces to Discrete Event Simulation Systems
Data input/ model specification
There are two kinds of modelling elements: physical elements, which represent tangible entities in
the real-life situation under study, and logical elements, which represent the conceptual aspects of
the model. The physical elements available in WITNESS are: Parts (represent physical
components that flow through the model), Fluids (flow through Pipes, Tanks, and Processors),
Buffers (where Parts are held, like people in a queue or motors on a shelf), Tanks (continuous
processing elements in which Fluids may be held or stored), Machines (represent anything that
takes Parts from somewhere, process them, and sends them on their next destination), Processors
(equivalent of Machines for Fluids), Conveyers (used to move Parts from one fixed point in the
model to another over time), Pipes (elements used to connect Processors and Tanks), Vehicles
(devices whose purpose is to transport Parts around a factory floor), Tracks (paths that Vehicles
follow when transporting Parts, or points where Vehicles load, unload, or park), and Labour (a
resource which may be required by other elements as they perform their own respective
operations).
All entities in the model are specified using pre-defined WITNESS dialogue boxes that present
combination of entry fields and buttons (see Figure 2.25). Some entry fields are also buttons that
on activation display relevant entry boxes. The user cannot customise the interaction. There are
three steps required to build a model. These three steps are followed using the first three options
from the ‘Edit’ menu of WITNESS: Define, Display, and Detail. First, the user has to define
elements to be used in building the model (names and quantities). Second the user has to specify
how elements will be displayed on the screen (see Figure 2.26). Third, the logic which determines
how each element will operate and how mobile elements will flow through the model has to be
supplied (see Figure 2.27). A model is identified by an eight character long name (for a DOS file),
but can also have a full length model name and author’s name. The ‘Define Menu’ is a button
menu that consists of buttons for all physical and logical elements, and a ‘Cancel’ button. Clicking
with the mouse on one of the elements buttons will open a dialogue box with entry fields and the
buttons ‘Cancel’ and ‘Enter’.
For example, on clicking the ‘Machine’ button a box ‘Define machine’ will pop-up, on the top
of the ‘Define Menu’, that contains fields for Name (of machine), and Quantity with a default
J. Kuljis User Interfaces and Discrete Event Simulation Models Page 73
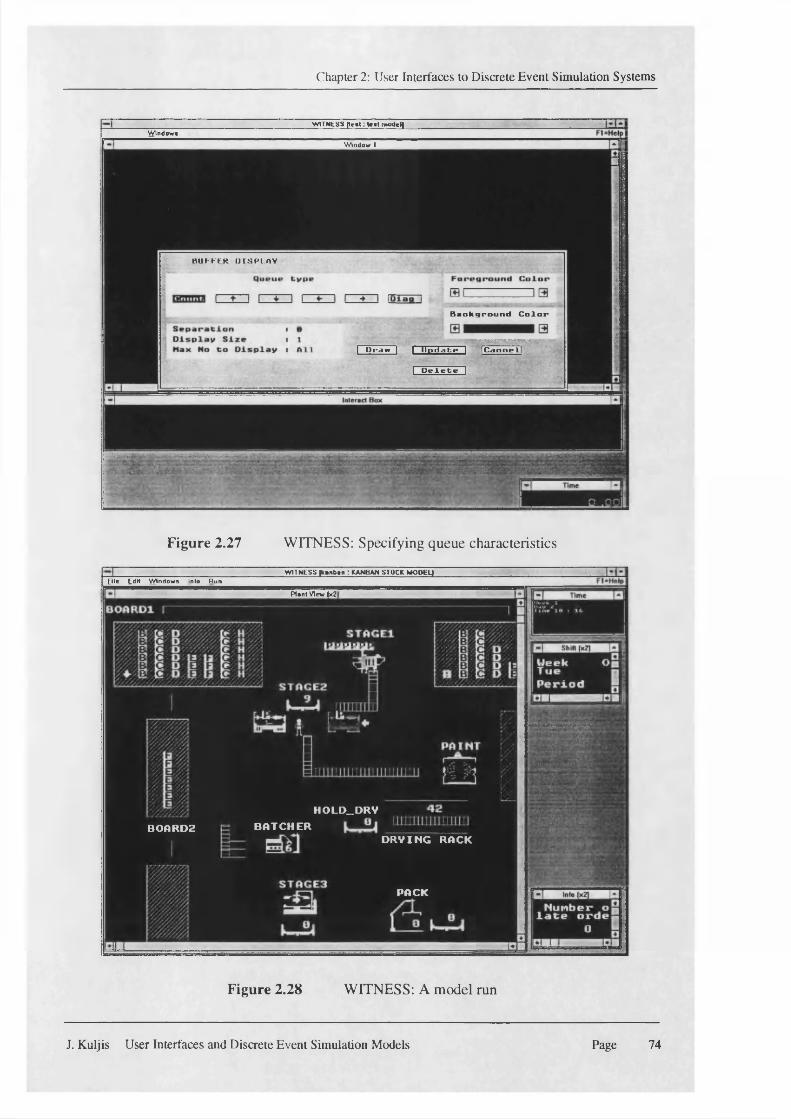
Chapter 2: User Interfaces to Discrete Event Simulation Systems
WITNESS | l e « t : <««» iwodetjWlndowi
Window I
B U FF E R U IS l 'L r tV
Background Color
I Draw 1 [ Update I ICanoefl
I Delete |
HOLD_DRVBATCHERBOARD2
DRYING RACK
PACK
Figure 2.27 WITNESS: Specifying queue characteristics
WITNESS Ikowbow : KANBAN STOCK MOOELI
P lan t View b<2
p i e E d it W in d o w s Into R un
Figure 2.28 WITNESS: A model run
J. Kuljis User Interfaces and Discrete Event Simulation Models Page 74
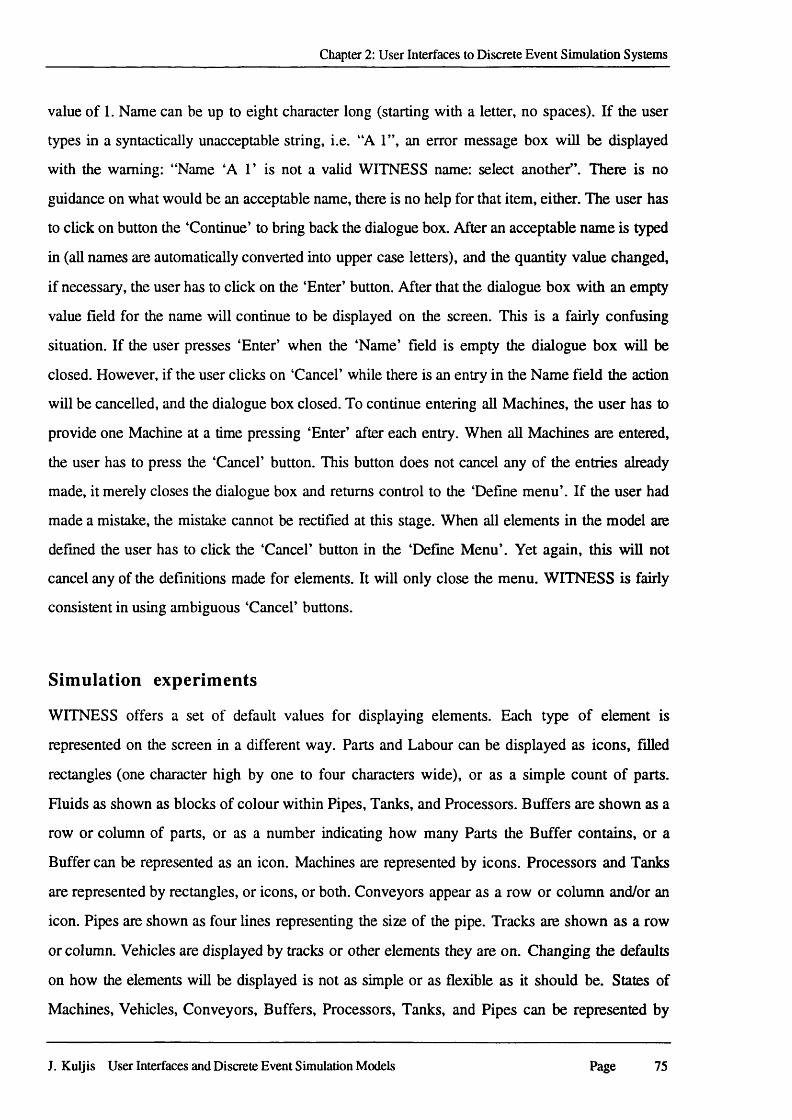
Chapter 2: User Interfaces to Discrete Event Simulation Systems
value of 1. Name can be up to eight character long (starting with a letter, no spaces). If the user
types in a syntactically unacceptable string, i.e. “A 1”, an error message box will be displayed
with the warning: “Name ‘A 1’ is not a valid WITNESS name: select another”. There is no
guidance on what would be an acceptable name, there is no help for that item, either. The user has
to click on button the ‘Continue’ to bring back the dialogue box. After an acceptable name is typed
in (all names are automatically converted into upper case letters), and the quantity value changed,
if necessary, the user has to click on the ‘Enter’ button. After that the dialogue box with an empty
value field for the name will continue to be displayed on the screen. This is a fairly confusing
situation. If the user presses ‘Enter’ when the ‘Name’ field is empty the dialogue box will be
closed. However, if the user clicks on ‘Cancel’ while there is an entry in the Name field the action
will be cancelled, and the dialogue box closed. To continue entering all Machines, the user has to
provide one Machine at a time pressing ‘Enter’ after each entry. When all Machines are entered,
the user has to press the ‘Cancel’ button. This button does not cancel any of the entries already
made, it merely closes the dialogue box and returns control to the ‘Define menu’. If the user had
made a mistake, the mistake cannot be rectified at this stage. When all elements in the model are
defined the user has to click the ‘Cancel’ button in the ‘Define Menu’. Yet again, this will not
cancel any of the definitions made for elements. It will only close the menu. WITNESS is fairly
consistent in using ambiguous ‘Cancel’ buttons.
Simulation experiments
WITNESS offers a set of default values for displaying elements. Each type of element is
represented on the screen in a different way. Parts and Labour can be displayed as icons, filled
rectangles (one character high by one to four characters wide), or as a simple count of parts.
Fluids as shown as blocks of colour within Pipes, Tanks, and Processors. Buffers are shown as a
row or column of parts, or as a number indicating how many Parts the Buffer contains, or a
Buffer can be represented as an icon. Machines are represented by icons. Processors and Tanks
are represented by rectangles, or icons, or both. Conveyors appear as a row or column and/or an
icon. Pipes are shown as four lines representing the size of the pipe. Tracks are shown as a row
or column. Vehicles are displayed by tracks or other elements they are on. Changing the defaults
on how the elements will be displayed is not as simple or as flexible as it should be. States of
Machines, Vehicles, Conveyors, Buffers, Processors, Tanks, and Pipes can be represented by
J. Kuljis User Interfaces and Discrete Event Simulation Models Page 75
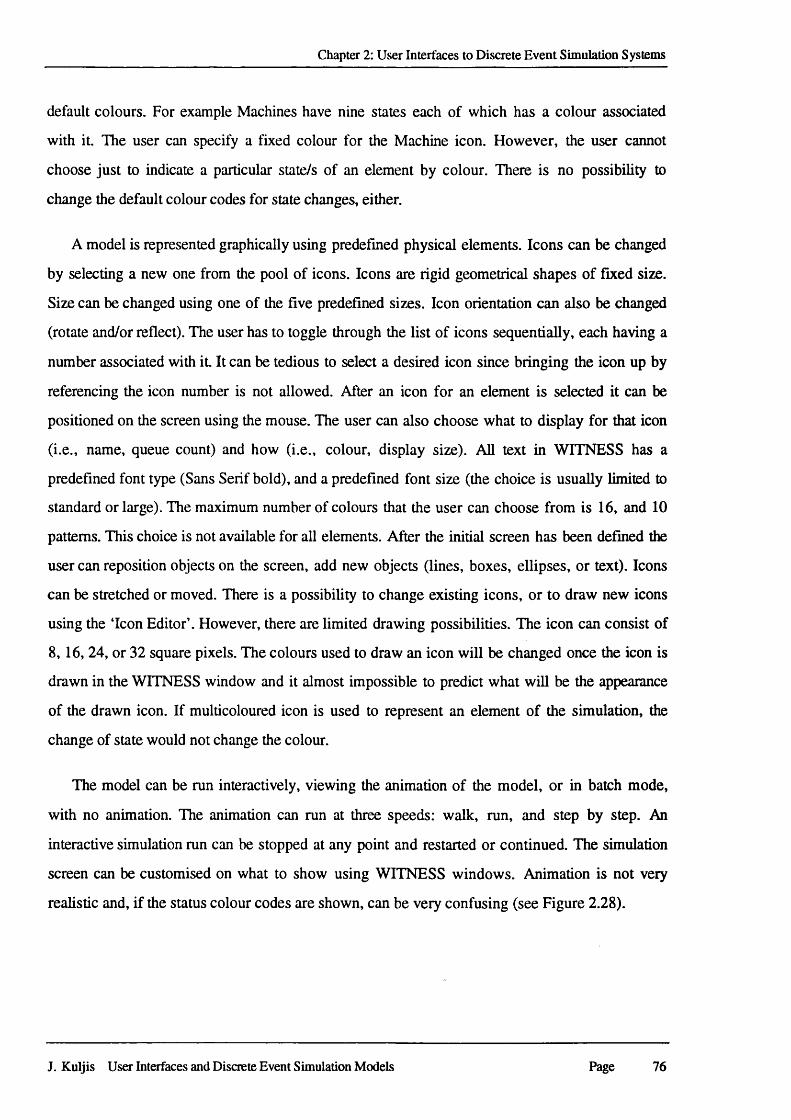
Chapter 2: User Interfaces to Discrete Event Simulation Systems
default colours. For example Machines have nine states each of which has a colour associated
with it. The user can specify a fixed colour for the Machine icon. However, the user cannot
choose just to indicate a particular state/s of an element by colour. There is no possibility to
change the default colour codes for state changes, either.
A model is represented graphically using predefined physical elements. Icons can be changed
by selecting a new one from the pool of icons. Icons are rigid geometrical shapes of fixed size.
Size can be changed using one of the five predefined sizes. Icon orientation can also be changed
(rotate and/or reflect). The user has to toggle through the list of icons sequentially, each having a
number associated with it. It can be tedious to select a desired icon since bringing the icon up by
referencing the icon number is not allowed. After an icon for an element is selected it can be
positioned on the screen using the mouse. The user can also choose what to display for that icon
(i.e., name, queue count) and how (i.e., colour, display size). All text in WITNESS has a
predefined font type (Sans Serif bold), and a predefined font size (the choice is usually limited to
standard or large). The maximum number of colours that the user can choose from is 16, and 10
patterns. This choice is not available for all elements. After the initial screen has been defined the
user can reposition objects on the screen, add new objects (lines, boxes, ellipses, or text). Icons
can be stretched or moved. There is a possibility to change existing icons, or to draw new icons
using the ‘Icon Editor’. However, there are limited drawing possibilities. The icon can consist of
8, 16, 24, or 32 square pixels. The colours used to draw an icon will be changed once the icon is
drawn in the WITNESS window and it almost impossible to predict what will be the appearance
of the drawn icon. If multicoloured icon is used to represent an element of the simulation, the
change of state would not change the colour.
The model can be run interactively, viewing the animation of the model, or in batch mode,
with no animation. The animation can run at three speeds: walk, run, and step by step. An
interactive simulation run can be stopped at any point and restarted or continued. The simulation
screen can be customised on what to show using WITNESS windows. Animation is not very
realistic and, if the status colour codes are shown, can be very confusing (see Figure 2.28).
J. Kuljis User Interfaces and Discrete Event Simulation Models Page 76
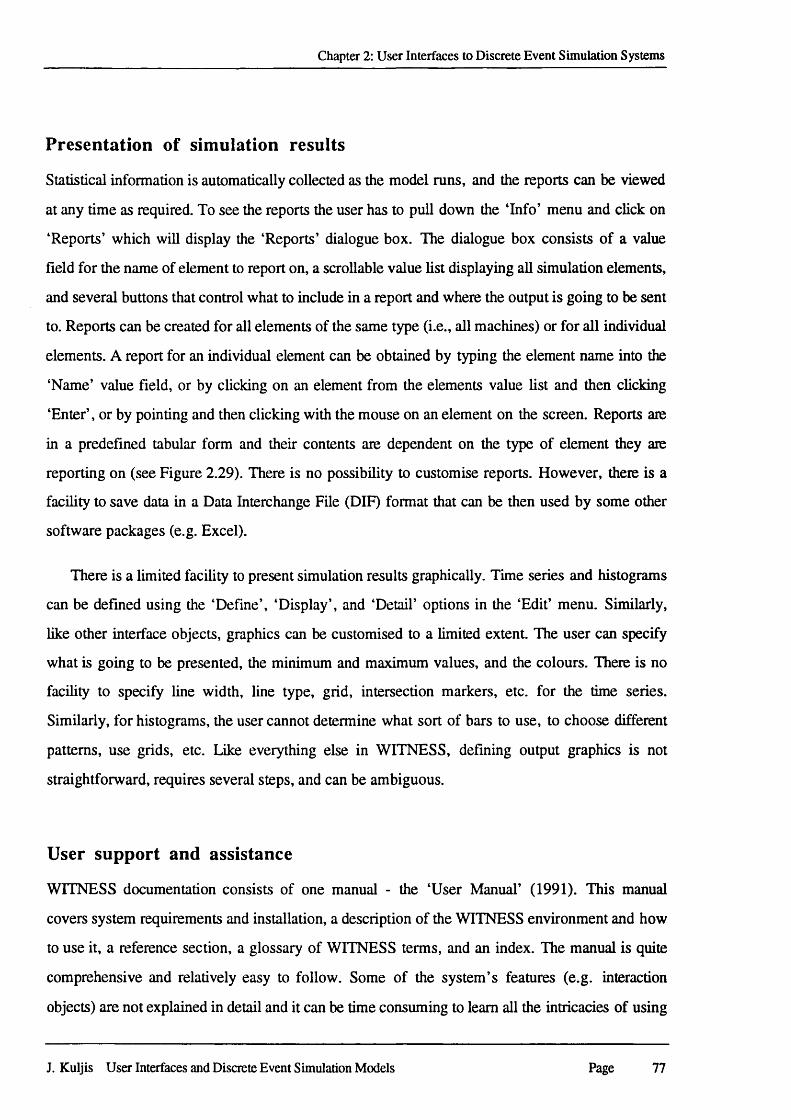
Chapter 2: User Interfaces to Discrete Event Simulation Systems
Presentation of simulation results
Statistical information is automatically collected as the model runs, and the reports can be viewed
at any time as required. To see the reports the user has to pull down the ‘Info’ menu and click on
‘Reports’ which will display the ‘Reports’ dialogue box. The dialogue box consists of a value
field for the name of element to report on, a scrollable value list displaying all simulation elements,
and several buttons that control what to include in a report and where the output is going to be sent
to. Reports can be created for all elements of the same type (i.e., all machines) or for all individual
elements. A report for an individual element can be obtained by typing the element name into the
‘Name’ value field, or by clicking on an element from the elements value list and then clicking
‘Enter’, or by pointing and then clicking with the mouse on an element on the screen. Reports are
in a predefined tabular form and their contents are dependent on the type of element they are
reporting on (see Figure 2.29). There is no possibility to customise reports. However, there is a
facility to save data in a Data Interchange File (DIF) format that can be then used by some other
software packages (e.g. Excel).
There is a limited facility to present simulation results graphically. Time series and histograms
can be defined using the ‘Define’, ‘Display’, and ‘Detail’ options in the ‘Edit’ menu. Similarly,
like other interface objects, graphics can be customised to a limited extent. The user can specify
what is going to be presented, the minimum and maximum values, and the colours. There is no
facility to specify line width, line type, grid, intersection markers, etc. for the time series.
Similarly, for histograms, the user cannot determine what sort of bars to use, to choose different
patterns, use grids, etc. Like everything else in WITNESS, defming output graphics is not
straightforward, requires several steps, and can be ambiguous.
User support and assistance
WITNESS documentation consists of one manual - the ‘User Manual’ (1991). This manual
covers system requirements and installation, a description of the WITNESS environment and how
to use it, a reference section, a glossary of WITNESS terms, and an index. The manual is quite
comprehensive and relatively easy to follow. Some of the system’s features (e.g. interaction
objects) are not explained in detail and it can be time consuming to learn all the intricacies of using
J. Kuljis User Interfaces and Discrete Event Simulation Models Page 77
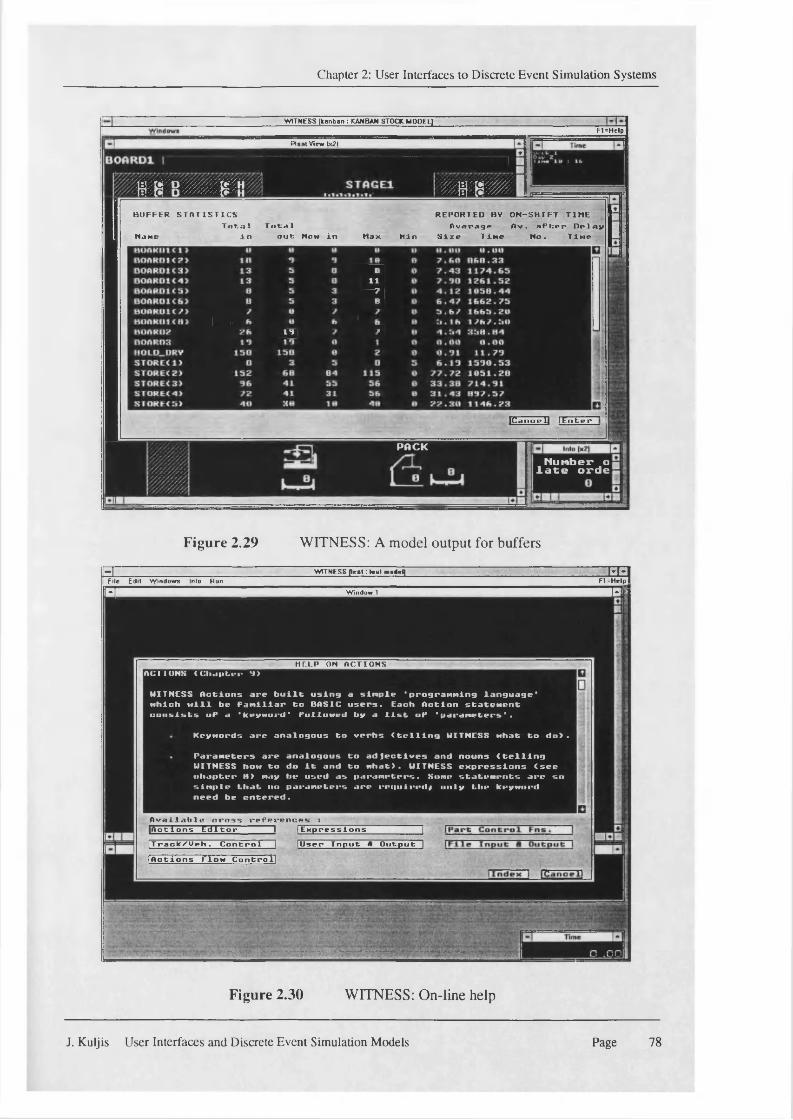
Chapter 2: User Interfaces to Discrete Event Simulation Systems
WITNESS fran b en : KANBAN STOCK MODEL!F l= H e lp
Plant View 1x21
w w w m m ■ m w m
BUFFER STATISTICSTntal T ntn 1
REPORTED BV ON-SHIFT TIME Average Ov. after Delay
Name in out: Now in Max Min Size Time No. Time
M QEHM4E ly . 1
E y S3
ICanoeU lEnter
PACKN u m b e r o ,
l a t e o r d e 1
Figure 2.29 WITNESS: A model output for buffers
A v a i l a b l e c r o s s r e f e r e n c e s t^Actions Editor I lExpresslons IITrack/Veh. Control 1 lUser Input A Output |Iflctions Flow Control)
IH W IT N E S S (lest: l e s t m a d e l) l'T«||| f i l e E d it W in d o w s Into H u n F I =H elp 1
“I_______________________ W in d o w 1 M b
HELP OM ACTIONSA C I I O N S ( C h . i p t . i M * 1 >
WITNESS Actions are built using a simple 'programming language'Hhlch will be Familiar to BASIC users. Each Action statement consists uP a 'keyword' Followed by a list uP 'parameters *.
Keywords are analogous to verbs (telling WITNESS what to d o ) .
Parameters are analogous to adjectives and nouns (telling WITNESS h ow to do it and to what). WITNESS expressions (see o h a pter H > may he used as parameters. Some statements are so simple that no parameters are required* only the keyword need be entered.
Figure 2.30 WITNESS: On-line help
J. Kuljis User Interfaces and Discrete Event Simulation Models Page 78

Chapter 2: User Interfaces to Discrete Event Simulation Systems
them. For example, explanation on how to use the ‘Icon editor’ to create icons is ambiguous and
often not detailed enough. To learn the system the user is expected to cover the whole manual
because the explanation related to one topic can be scattered through several sections. The index
provides coverage of all material and reference to the relevant page number for a topic of interest.
Sometimes it is hard to find under which term the topic is listed. For example, if the user wants to
find out about simulation results under ‘Simulation’ there is an entry “Presenting results o f ’. But
this is just a page long advice on the importance of a demonstration and what to show to an
audience. There is no mention of output data from the simulation. There is no entry for “Output
data”, “Simulation output”, “Results”, etc. Anything related to output results is listed under
“Reports”. The manual has an example on how to build a simple model, but it does not provide a
complete walk through tutorial. The user can easily be lost after several steps in the model
development
WITNESS help facilities are in the ‘Info’ menu, and can be invoked by either pulling down
the menu and clicking on ‘Help’ or pressing the ‘F I’ key. Help is offered in the form of a
dialogue box that contains an alphabetic list of WITNESS terms (‘Index’). The user can scroll
through the list and select a topic or type in a topic name in a value field provided on the dialogue
box. The chosen topic is displayed in a dialogue box that consists of a text box displaying a part
of the text on the topic, and a reference to the relevant chapter in the manual. To see the rest of the
text the user has to scroll through it. The dialogue box also provides buttons that lead to available
cross references, and buttons that will close the dialogue box (‘Cancel’) or return back to the
‘Help’ dialogue box (‘Index’). Choosing one of the cross reference buttons can display a dialogue
box with text and a button to return to the previous dialogue box, or it will provide more cross
references (see Figure 2.30). This cross referencing can go to some depth (1 to a dozen or more).
All dialogue boxes have buttons to quit, or return to the index. However, not all dialogue boxes
have options to return to the previous one. Even if a dialogue box has that option, it is not always
the obvious one because it is not labelled as “Previous”, “Back”, “<=“, etc. It is labelled with the
topic that was the content of the previous box or the initial index term. This can create difficulties
in navigation, since the user does not always recall what was the term that invoked the current
dialogue box. There is no provision for context-sensitive help. Even though help can be invoked
at any point during model specification (key FI), the provided help is always the same list of
J. Kuljis User Interfaces and Discrete Event Simulation Models Page 79
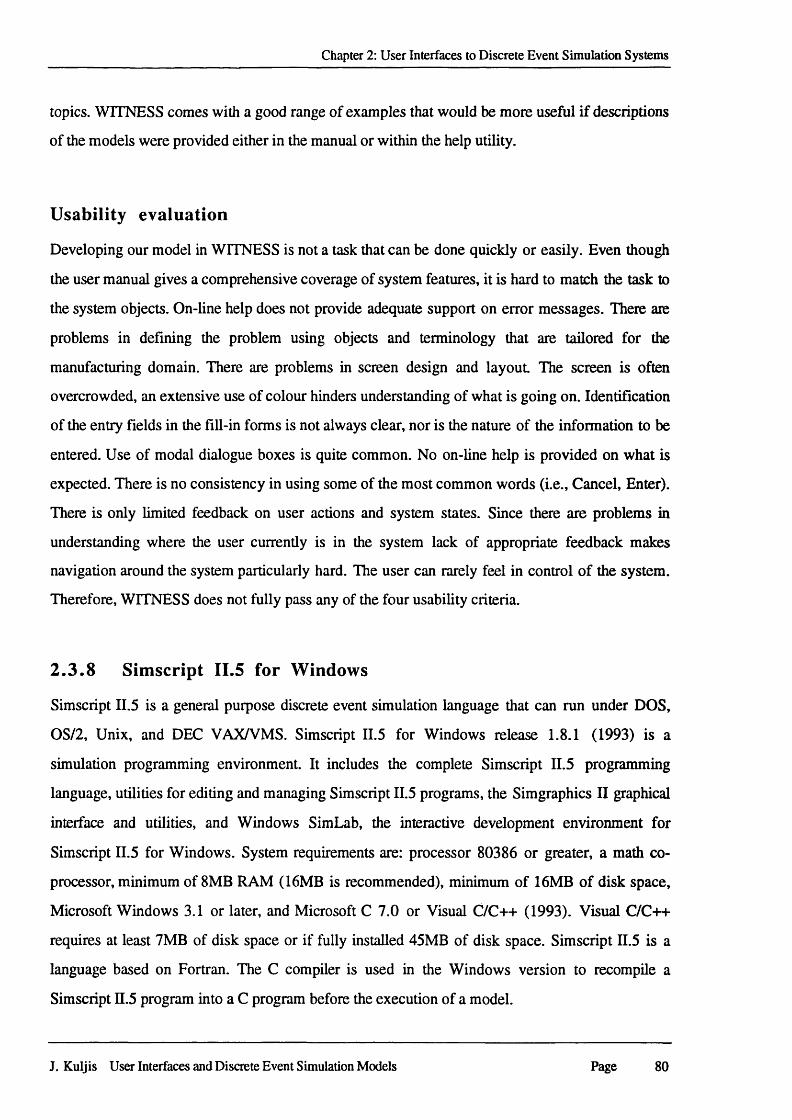
Chapter 2: User Interfaces to Discrete Event Simulation Systems
topics. WITNESS comes with a good range of examples that would be more useful if descriptions
of the models were provided either in the manual or within the help utility.
Usability evaluation
Developing our model in WITNESS is not a task that can be done quickly or easily. Even though
the user manual gives a comprehensive coverage of system features, it is hard to match the task to
the system objects. On-line help does not provide adequate support on error messages. There are
problems in defining the problem using objects and terminology that are tailored for the
manufacturing domain. There are problems in screen design and layout. The screen is often
overcrowded, an extensive use of colour hinders understanding of what is going on. Identification
of the entry fields in the fill-in forms is not always clear, nor is the nature of the information to be
entered. Use of modal dialogue boxes is quite common. No on-line help is provided on what is
expected. There is no consistency in using some of the most common words (i.e., Cancel, Enter).
There is only limited feedback on user actions and system states. Since there are problems in
understanding where the user currently is in the system lack of appropriate feedback makes
navigation around the system particularly hard. The user can rarely feel in control of the system.
Therefore, WITNESS does not fully pass any of the four usability criteria.
2.3.8 Simscript II.5 for Windows
Simscript II.5 is a general purpose discrete event simulation language that can run under DOS,
OS/2, Unix, and DEC VAX/VMS. Simscript II.5 for Windows release 1.8.1 (1993) is a
simulation programming environment. It includes the complete Simscript II.5 programming
language, utilities for editing and managing Simscript II.5 programs, the Simgraphics II graphical
interface and utilities, and Windows SimLab, the interactive development environment for
Simscript II.5 for Windows. System requirements are: processor 80386 or greater, a math co
processor, minimum of 8MB RAM (16MB is recommended), minimum of 16MB of disk space,
Microsoft Windows 3.1 or later, and Microsoft C 7.0 or Visual C/C++ (1993). Visual C/C++
requires at least 7MB of disk space or if fully installed 45MB of disk space. Simscript II.5 is a
language based on Fortran. The C compiler is used in the Windows version to recompile a
Simscript H.5 program into a C program before the execution of a model.
J. Kulj is User Interfaces and Discrete Event S imulation Models Page 80
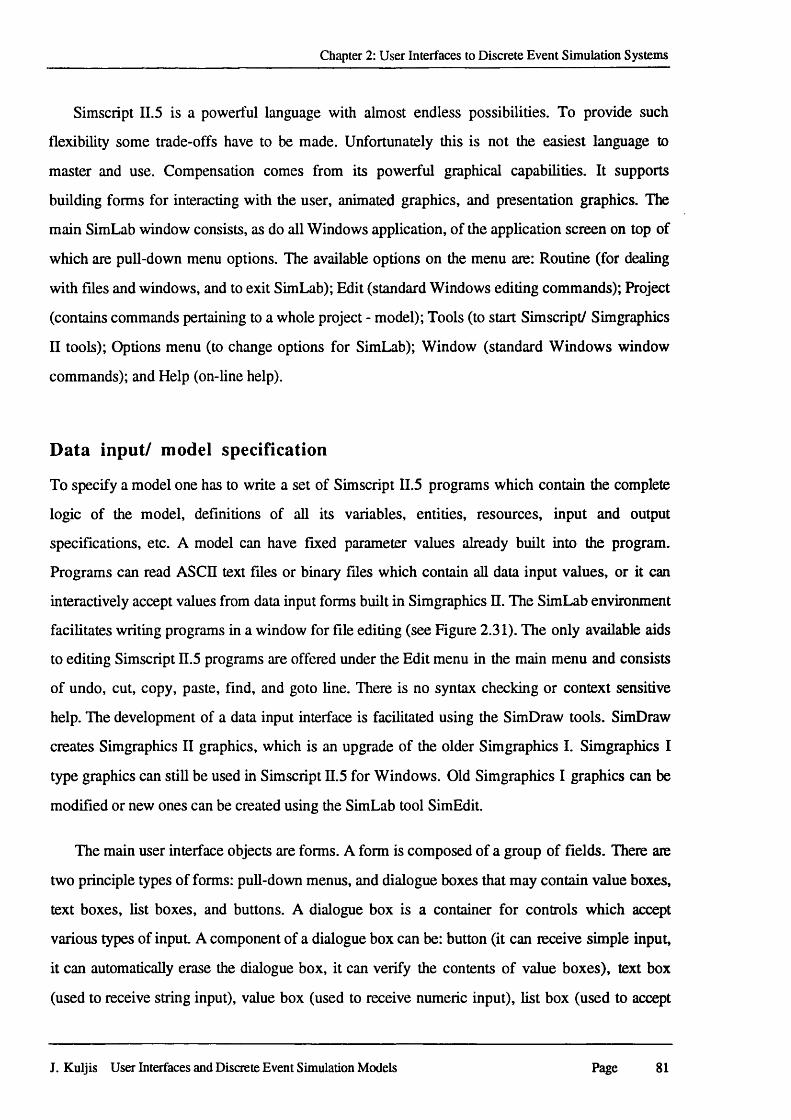
Chapter 2: User Interfaces to Discrete Event Simulation Systems
Simscript II.5 is a powerful language with almost endless possibilities. To provide such
flexibility some trade-offs have to be made. Unfortunately this is not the easiest language to
master and use. Compensation comes from its powerful graphical capabilities. It supports
building forms for interacting with the user, animated graphics, and presentation graphics. The
main SimLab window consists, as do all Windows application, of the application screen on top of
which are pull-down menu options. The available options on the menu are: Routine (for dealing
with files and windows, and to exit SimLab); Edit (standard Windows editing commands); Project
(contains commands pertaining to a whole project - model); Tools (to start Simscript/ Simgraphics
II tools); Options menu (to change options for SimLab); Window (standard Windows window
commands); and Help (on-line help).
Data input/ model specification
To specify a model one has to write a set of Simscript II.5 programs which contain the complete
logic of the model, definitions of all its variables, entities, resources, input and output
specifications, etc. A model can have fixed parameter values already built into the program.
Programs can read ASCII text files or binary files which contain all data input values, or it can
interactively accept values from data input forms built in Simgraphics n. The SimLab environment
facilitates writing programs in a window for file editing (see Figure 2.31). The only available aids
to editing Simscript II.5 programs are offered under the Edit menu in the main menu and consists
of undo, cut, copy, paste, find, and goto line. There is no syntax checking or context sensitive
help. The development of a data input interface is facilitated using the SimDraw tools. SimDraw
creates Simgraphics II graphics, which is an upgrade of the older Simgraphics I. Simgraphics I
type graphics can still be used in Simscript n.5 for Windows. Old Simgraphics I graphics can be
modified or new ones can be created using the SimLab tool SimEdit.
The main user interface objects are forms. A form is composed of a group of fields. There are
two principle types of forms: pull-down menus, and dialogue boxes that may contain value boxes,
text boxes, list boxes, and buttons. A dialogue box is a container for controls which accept
various types of input. A component of a dialogue box can be: button (it can receive simple input,
it can automatically erase the dialogue box, it can verify the contents of value boxes), text box
(used to receive string input), value box (used to receive numeric input), list box (used to accept
J. Kuljis User Interfaces and Discrete Event Simulation Models Page 81
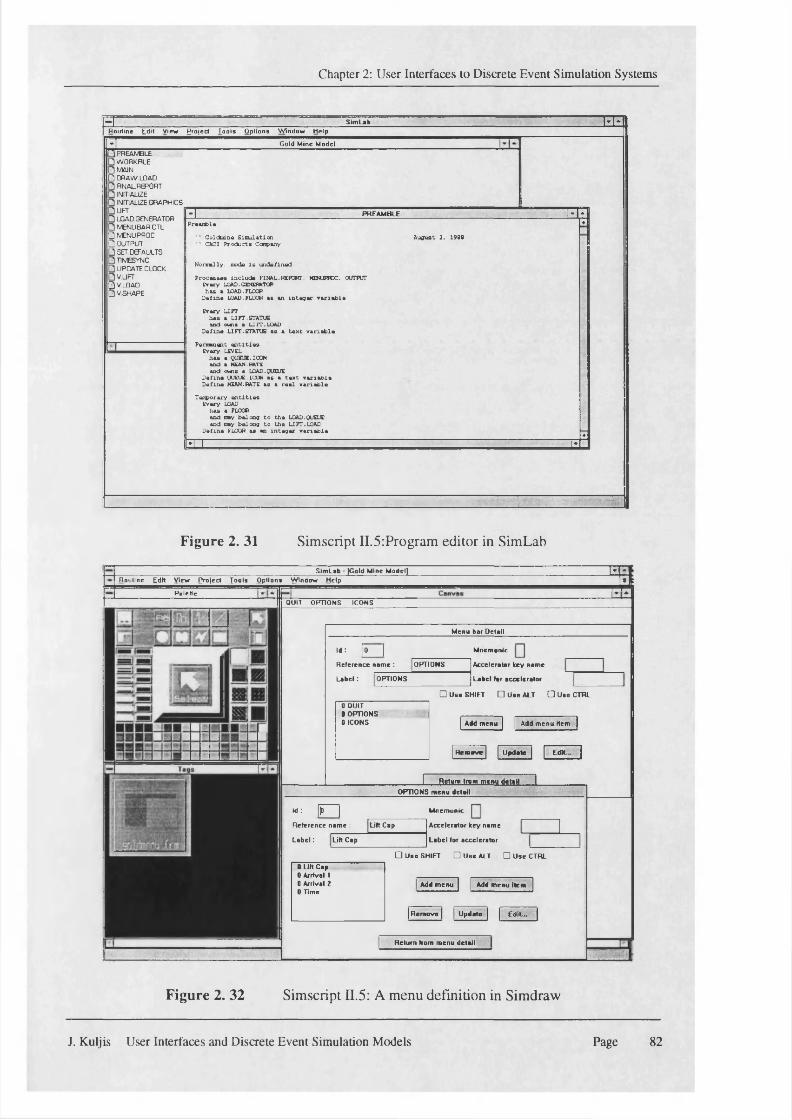
Chapter 2: User Interfaces to Discrete Event Simulation Systems
F SimLab ."....."Tl*j R o u tin e E d it V ie* r P ro je c t T o o ls O p tio n s W in d o w H e lp
3~ Gold Mine ModelPREAMBLE WORKRLE
_ MAIN□ DRAW LOAD
RNALRBPORT INITIALIZE INITIALIZE GRAPHICS LIFTLOAD GENERATOR MENUBAR CTL
□ IVENUPROC□ o u t p u t
SET.Dff AULTS TIME5VNC UPDATE CLOCK VUFT
IQ V LOAD O V SHAPE
- | PREAMBLE 1 ,1 a
P rean fe le ♦
' Colcknioe S i o u l a t i c n A u g u st 2 . 1988 ' CACI P ro d u c ts C a ip an y
N o r m l ly . nrxle i s u n d e f in e d
P ro c e s s e s in c lu d e FINAL.REPORT. HD U TCC. OUTFIT Every L O P D .Q M M N P h a s a LOAD.FLOOR
D e fin e LOAD.FLOOR a s an i n t e g e r v a r i a b l e
E very LIFT h a s a LI FT. STATUS and t w u a LIFT.LOAD
D e f in e LIFT.STATUS a s a t e a t v a r i a b l e
P e r m n a n t a n t i t i e s E very LEVEL
h a s a QUEUE.ICON an d a MEAN.hate and oeais a LOAD.QUEUE
D e f in e QUEUE.ico n a s a t e x t v a r i a b l e N D e f in e MEAN.RATE a s a r e a l v a r i a b l e
T a m w ra iy e n t i t i e s E very LOAD
h a s a FLOORan d m y b e lo n g t o t h e LOAD.QUEUE an d m y b e lo n g to t h e LIFT.LOAD
D e f in e FLOOR a s an i n t e g e r v a r i a b l e♦
k j ----------------------------------------------------------------------- -----------------Li
Figure 2. 31 Simscript II.5:Program editor in SimLab
Routine
R ale Mr
r
mSlm Leb [Gold Mine Model)
Edit View P ro ject Tools O ptions W indow Help
QUIT OPTIONS ICONS
M enu bar Detail
Id : fo |
R efe rence nam e : OPTIONS
L a b e l: OPTIONS
M nem onic
A ccelerator key nam e
Label lo r ac ce le ra to r
OOUIT 8 OPTIONS 0 ICONS
□ U se SHIFT □ U se ALT □ U se CTRL
| Add m enu | | Add m en u Hem |
j R em ove | | U pdate j | E d i t - |
1 .. R dum ‘ram mcmj f rA iLOPTIONS m enu detail
Id : [ T ~ |
R efe rence n am e : Lilt Cap
L ab e l: Lift Cap
M nem onic
A ccelerator k ey nam e
L abel for ac ce le ra to r
□ U se SHIFT □ U se ALT □ U se CTRL0 Lift Cap 0 Arrival 1 0 Arrival 2 0 Time
Add m en u j [ Add m enu Item j
| R em ove | U pda te |1 I.™*,:.1R etu rn from m enu deta il
Figure 2. 32 Simscript EL5: A menu definition in Simdraw
J. Kuljis User Interfaces and Discrete Event Simulation Models Page 82
Chapter 2: User Interfaces to Discrete Event Simulation Systems
input from a list which may vary in length; multiple selections are allowed from the list), radio box
(accepts input from a fixed list of alternatives), check box (used to receive yes/no input),
label(used to place explanatory text or tides in a dialogue box), and combo box (like a text box,
but it displays a drop down list of items that can be selected).
The SimDraw window is divided into three windows: the palette window, the canvas
window, and the tag window. The palette window is an icons menu that contains options for
colours, fill styles, line widths, and modes for constructing objects. It also contains the menu bar
that allows access to additional operations. The canvas window contains objects under
construction. Images, graphs, and forms are built and displayed in the canvas window. The tag
window holds tags which represent groups of objects. Image groups, graphs, menu bars, and
dialogue boxes are represented by tags. The default background colour for the canvas is black.
Even though it can be changed to any other colour (there are 64 colours to choose from) the
default for a project (model) cannot be changed in the SimDraw environment. The basic colour
settings for a model are changed in Simgraphics I using SimEdit from the SimLab tools menu.
Sometimes the three SimDraw windows behave as three completely separate applications.
This becomes apparent if the user uses ‘switch’ (a standard Windows feature) option. The list of
open applications contains, among other open Windows applications, SimLab, Palette, Tags, and
Canvas. If the user then switches to some other Windows application then only one of the three
SimDraw windows can be opened (e.g. Palette). On an attempt to activate another SimDraw
window (e.g. Canvas) using a switch option not belonging an open SimDraw window (Palette),
the requested window will be opened (Canvas) and the previously opened one (Palette) will be
closed. To activate all three SimDraw windows the user has to switch to any of the four Simscript
‘applications’ and then, using that window switch option, switch to each individual SimDraw
window. That way all three windows can be made active. This procedure is not explained
anywhere in the Simgraphics II manual nor is it in the on-line help. The only way to discover this
peculiarity is by the ‘trial and error’ method.
Forms can be created and modified by SimDraw. Whilst creating a form by specifying the
values for its attributes the visual representation of the form is displayed in the Canvas window. If
the form is a dialogue box some visual aspects, like placement of the form, and spacing in
between its components, can be altered. A menu is always displayed as a horizontal bar at the top
J. Kuljis User Interfaces and Discrete Event Simulation Models Page 83
Chapter 2: User Interfaces to Discrete Event Simulation Systems
of the window (see Figure 2.32). Visual representation is actually visible only if the user changes
the background colour from black to some other colour since all text that goes on the form is black
by default (to change the default, Simgraphics I must be used). When the user starts entering the
attributes’ values, part of the labels on the right side of the entered values disappear from the
screen as if covered by spaces. These labels remain hidden from the user for the duration of the
form creation. It makes entering other values rather difficult unless the user knows by heart what
input is required. There is no help available for form creation. If the user tries to select ‘Help’ at
the top of the screen (a menu in SimLab), control will go back to the Windows Program Manager.
To retrieve the form back on screen the user should Switch back to Tags. In any case, to see what
is being done so far, the Canvas window has to be opened as well. After the form is closed a
generic icon representing the form together with its name will be placed in the Tags window. The
form can then be modified using Detail from the Edit menu in the Palette window. This will
display the selected form dialogue box on the screen and the user can change the form attributes.
The SimDraw environment for creating Simgraphics II looks at first to be a big improvement
on the Simgraphics I editors. However, it very soon becomes obvious that all is not well. To start
with, the Simgraphics II manual is very poorly written. There are too many things taken for
granted. Most of the attributes presented on the menu or on the form definition screen are not
explained anywhere. Again the user is left to make his/hers own judgement as to what sort of
input would be suitable. A typical example is the ‘Id’ parameter that is present for both types of
screens. Is it referenced later on in the model, and if it is how and where? Again there is no
mention of ‘Id’ in the manual index and in on-line help. After careful reading of the Simgraphics
II manual it can be found under ‘Editing Detail’ where it says that the user should not modify ‘Id’
value box. So, why is it then present on the form definition screen, and why is modification
allowed? There are too many similar examples to list them all. It seems that the Simscript II.5
developers were more interested in developing the software than in documenting it.
Simulation experiments
Simulation experiments can be performed with or without animation. Creating detailed graphic
shapes for animation is facilitated through SimDraw. Both static and dynamic (moving) icons can
be created using Simgraphics n. These icons are screen images of Simscript II.5 program entities,
J. Kuljis User Interfaces and Discrete Event Simulation Models Page 84
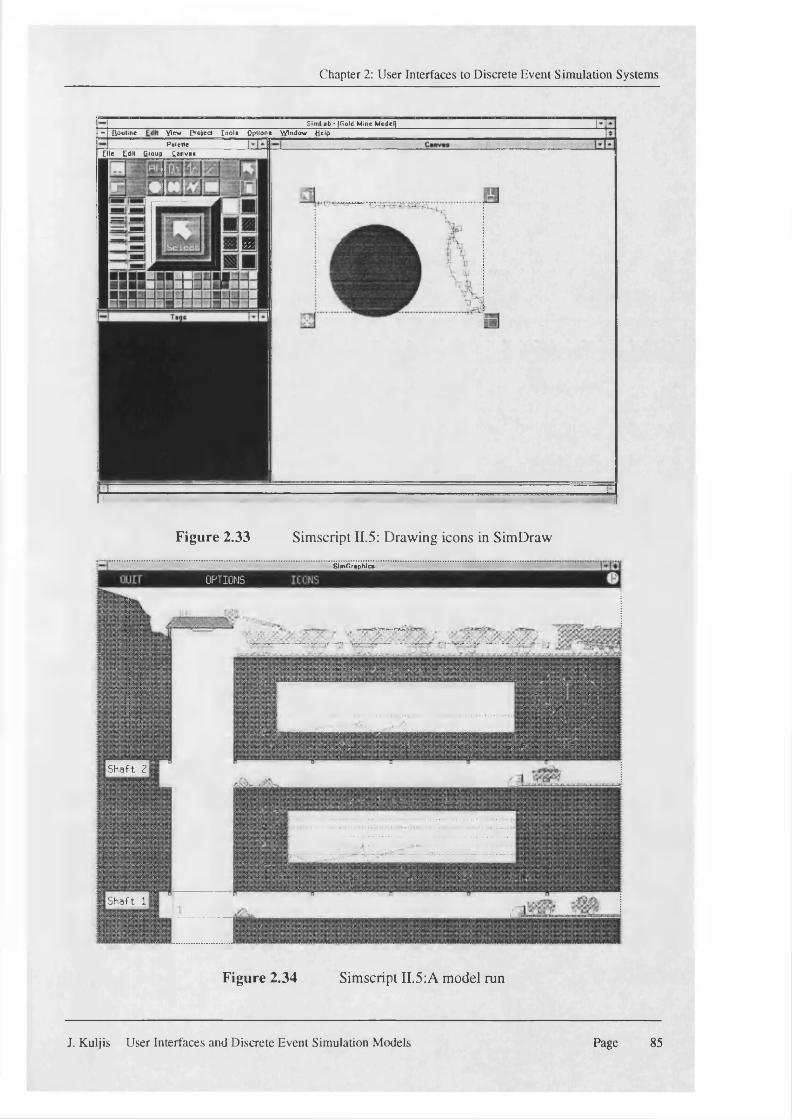
Chapter 2: User Interfaces to Discrete Event Simulation Systems
SimLab - (Gold Mine Model]- Qoutlne View E >o|ed I o o l i Qptlona W indow Help
P a le t tef i l e E d it G roup C a n v a s
m
Figure 2.33 Simscript n.5: Drawing icons in SimDraw
S iin G ra p h ic s
OPTIONS
Shaft 2
Shaft 1
Figure 2.34 Simscript II.5:A model run
J. Kuljis User Interfaces and Discrete Event Simulation Models Page 85
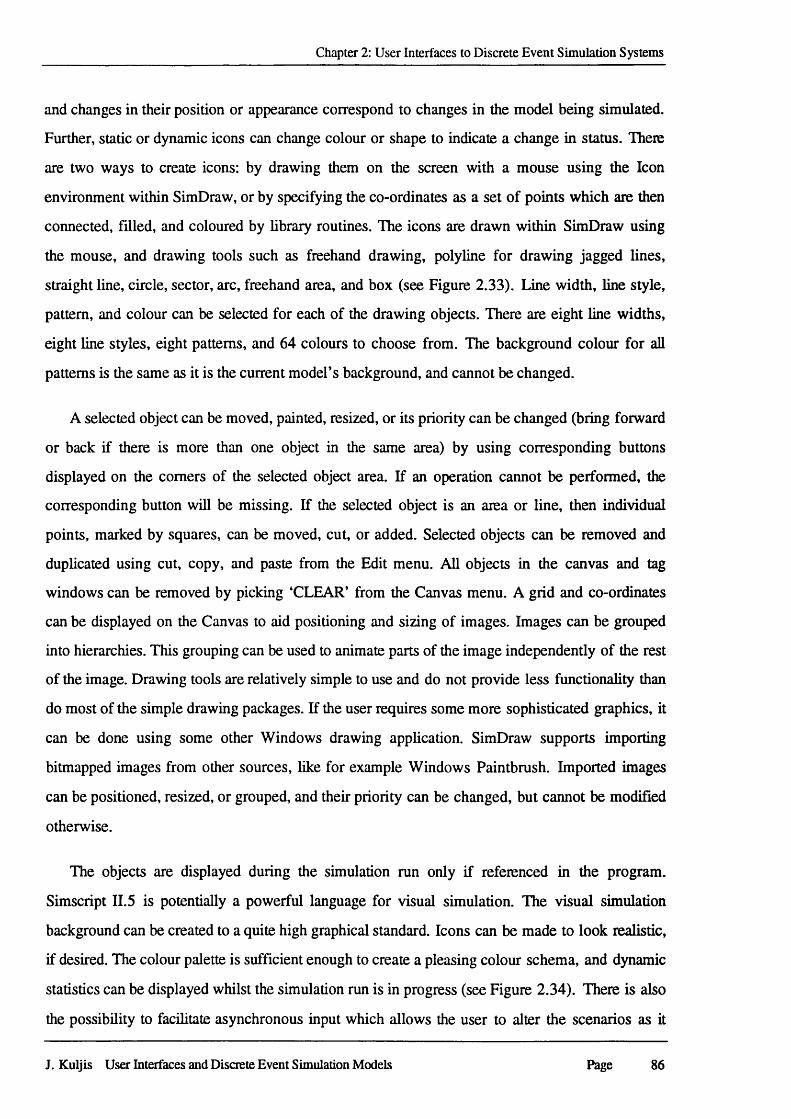
Chapter 2: User Interfaces to Discrete Event Simulation Systems
and changes in their position or appearance correspond to changes in the model being simulated.
Further, static or dynamic icons can change colour or shape to indicate a change in status. There
are two ways to create icons: by drawing them on the screen with a mouse using the Icon
environment within SimDraw, or by specifying the co-ordinates as a set of points which are then
connected, filled, and coloured by library routines. The icons are drawn within SimDraw using
the mouse, and drawing tools such as freehand drawing, polyline for drawing jagged lines,
straight line, circle, sector, arc, freehand area, and box (see Figure 2.33). Line width, line style,
pattern, and colour can be selected for each of the drawing objects. There are eight line widths,
eight line styles, eight patterns, and 64 colours to choose from. The background colour for all
patterns is the same as it is the current model’s background, and cannot be changed.
A selected object can be moved, painted, resized, or its priority can be changed (bring forward
or back if there is more than one object in the same area) by using corresponding buttons
displayed on the comers of the selected object area. If an operation cannot be performed, the
corresponding button will be missing. If the selected object is an area or line, then individual
points, marked by squares, can be moved, cut, or added. Selected objects can be removed and
duplicated using cut, copy, and paste from the Edit menu. All objects in the canvas and tag
windows can be removed by picking ‘CLEAR’ from the Canvas menu. A grid and co-ordinates
can be displayed on the Canvas to aid positioning and sizing of images. Images can be grouped
into hierarchies. This grouping can be used to animate parts of the image independently of the rest
of the image. Drawing tools are relatively simple to use and do not provide less functionality than
do most of the simple drawing packages. If the user requires some more sophisticated graphics, it
can be done using some other Windows drawing application. SimDraw supports importing
bitmapped images from other sources, like for example Windows Paintbrush. Imported images
can be positioned, resized, or grouped, and their priority can be changed, but cannot be modified
otherwise.
The objects are displayed during the simulation run only if referenced in the program.
Simscript II.5 is potentially a powerful language for visual simulation. The visual simulation
background can be created to a quite high graphical standard. Icons can be made to look realistic,
if desired. The colour palette is sufficient enough to create a pleasing colour schema, and dynamic
statistics can be displayed whilst the simulation run is in progress (see Figure 2.34). There is also
the possibility to facilitate asynchronous input which allows the user to alter the scenarios as it
J. Kuljis User Interfaces and Discrete Event Simulation Models Page 86
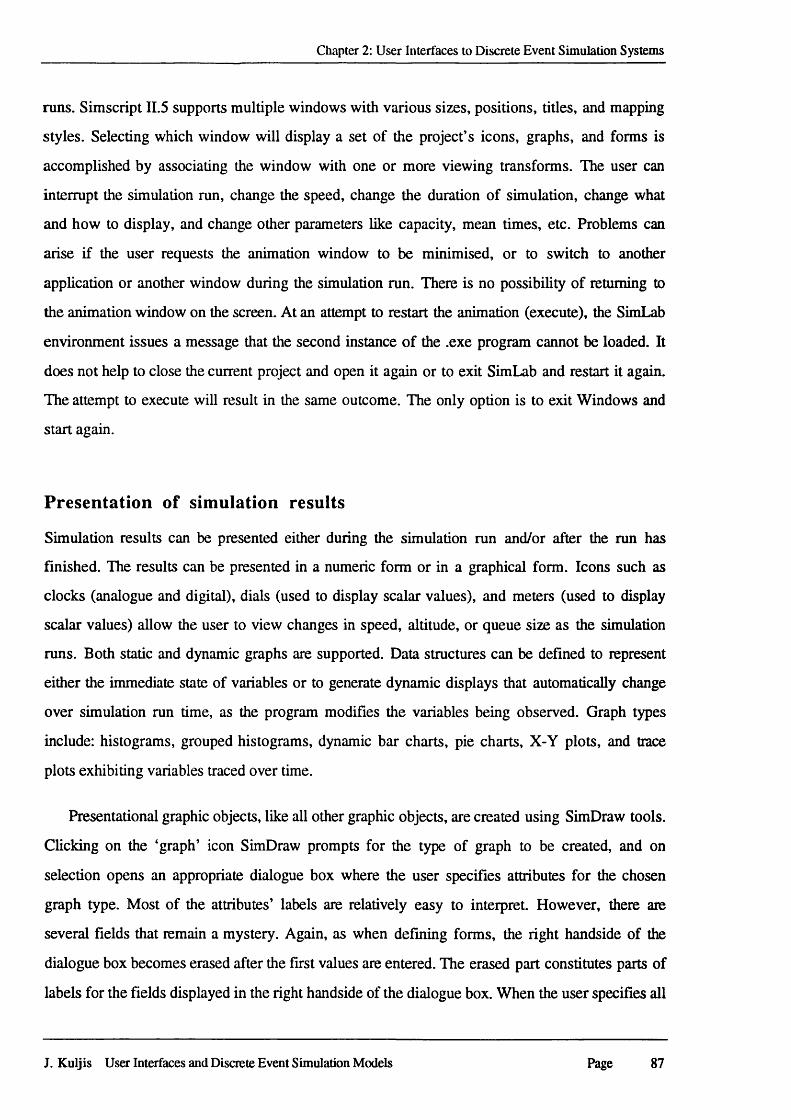
Chapter 2: User Interfaces to Discrete Event Simulation Systems
runs. Simscript II.5 supports multiple windows with various sizes, positions, titles, and mapping
styles. Selecting which window will display a set of the project’s icons, graphs, and forms is
accomplished by associating the window with one or more viewing transforms. The user can
interrupt the simulation run, change the speed, change the duration of simulation, change what
and how to display, and change other parameters like capacity, mean times, etc. Problems can
arise if the user requests the animation window to be minimised, or to switch to another
application or another window during the simulation run. There is no possibility of returning to
the animation window on the screen. At an attempt to restart the animation (execute), the SimLab
environment issues a message that the second instance of the .exe program cannot be loaded. It
does not help to close the current project and open it again or to exit SimLab and restart it again.
The attempt to execute will result in the same outcome. The only option is to exit Windows and
start again.
Presentation of simulation results
Simulation results can be presented either during the simulation run and/or after the run has
finished. The results can be presented in a numeric form or in a graphical form. Icons such as
clocks (analogue and digital), dials (used to display scalar values), and meters (used to display
scalar values) allow the user to view changes in speed, altitude, or queue size as the simulation
runs. Both static and dynamic graphs are supported. Data structures can be defined to represent
either the immediate state of variables or to generate dynamic displays that automatically change
over simulation run time, as the program modifies the variables being observed. Graph types
include: histograms, grouped histograms, dynamic bar charts, pie charts, X-Y plots, and trace
plots exhibiting variables traced over time.
Presentational graphic objects, like all other graphic objects, are created using SimDraw tools.
Clicking on the ‘graph’ icon SimDraw prompts for the type of graph to be created, and on
selection opens an appropriate dialogue box where the user specifies attributes for the chosen
graph type. Most of the attributes’ labels are relatively easy to interpret. However, there are
several fields that remain a mystery. Again, as when defining forms, the right handside of the
dialogue box becomes erased after the first values are entered. The erased part constitutes parts of
labels for the fields displayed in the right handside of the dialogue box. When the user specifies all
J. Kuljis User Interfaces and Discrete Event Simulation Models Page 87
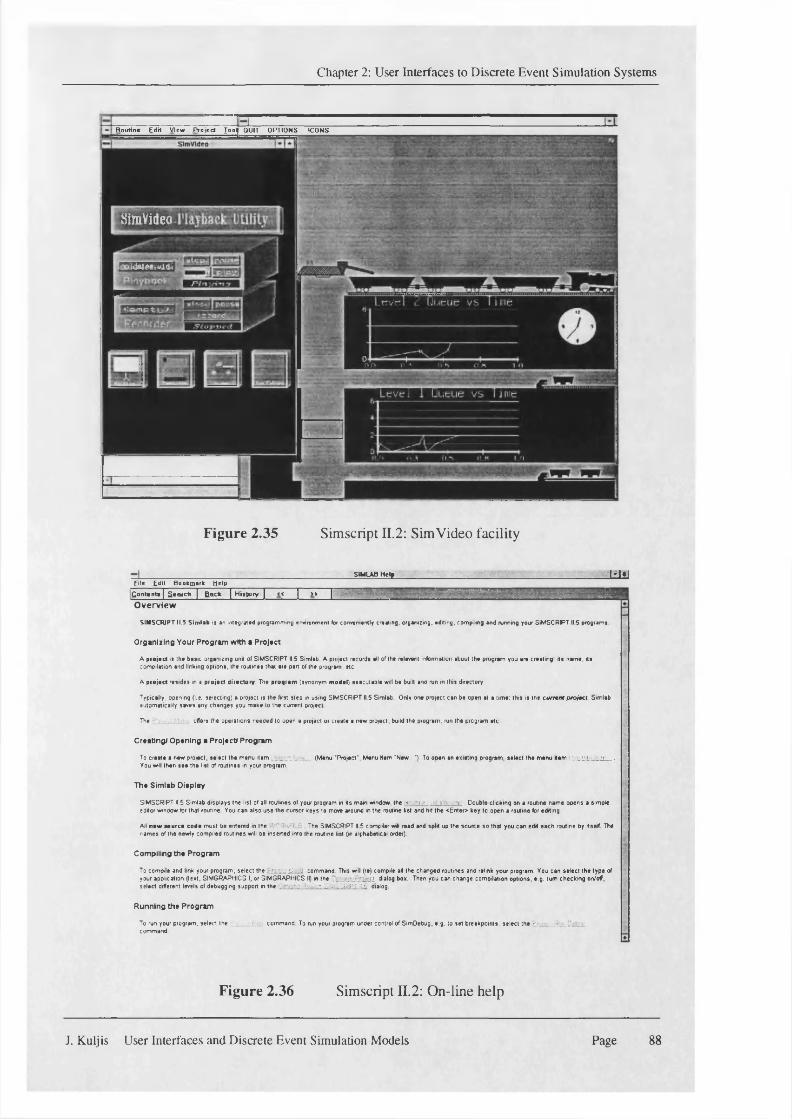
Chapter 2: User Interfaces to Discrete Event Simulation Systems
HimVideo
ldaa*c*«i<Ui
R o u tin e £ d i t View P ro je c t I n o y QUIT O N IO N S ICONS
Figure 2.35 Simscript 13.2: SimVideo facility
____________________________smuuh Hctp__________ ■ ' ' ■ I»tt1file Edit Bookmark tielp
C ontents | S e a rc h | B ack | H istory | << | >> | ^ '
O verview
SIMSCRIPT 11.5 S im lab it an integrated programming environment tor conveniently creating, organizing, editing, compiling and running your SIMSCRIPT IIS programs
Organizing Vour Program wltn a Project
A p ro jec t is the basic organizing unit of SIMSCRIPT II5 Simlab A project records aft of the relevant information about the program you era creating, its nam e, its compilation and linking options, the routines that are part of the program, etc.
A p ro jec t resides in a p ro jec t directo iy . The p ro g ram (synonym m odal] executable will be built and run in (has directory.
Typically, opening (i.e. selecting) a project is the first step in using SIMSCRIPT II5 Simlab Only one project can be open at a time: this is the cu rra n tp ro je c t. Simlab automatically saves any changes you make lo the current project
The offers the operations needed to open a project or create a new project, build the program, run the program etc.
Creating/ Opening a Project* Program
To create a new project, se lect the menu item (Menu ‘Project", Menu Ham "New .1. To ooan an ametinq program select the menu item r r .You will than sa a the list of routinee in your program
T he S im lab Diaplay
SIMSCRIPT II5 Simlab displays the list of all routines of your program m its mam window. Ilia R , Double-clicking on a routine name opens a simpleeditor window tor that routine You can also u sa the cursor keys to move around m the routine kst and hit the <Enter> key to open a routine tor editing.
All n e w so u rc a c o d a m ust be entered in the The SIMSCRIPT II5 compiler will read and spkt up the source so that you can edit each routine by itself. Thenam es of the newly compiled routines will be inserted into the routine kst (in alphabetical order]
Compiling the Program
To compile and link your program, select the • . „ . i c o m m a n d This will (re) compile all Ihe changed routines and relink your program. You can select the type ofyour application (text, SIMGRAPHICS I, or SIMGRAPHICS II) in Ihe !. dialog box. Then you can change compilation options, e.g. turn checking on/off,select different levels of debugging support in the . •■:. - ■ inf: • •••P* II •• dialog.
Running the Program
To run your program, select the command. To run your program under control of SimDebug, e.g. to set breakpoints, select t h e -command
Figure 2.36 Simscript II.2: On-line help
J. Kuljis User Interfaces and Discrete Event Simulation Models Page 88
Chapter 2: User Interfaces to Discrete Event Simulation Systems
attributes and closes the dialogue box there is still the possibility to customise the graph further. It
can be repositioned, resized, its priority can be changed, and colour can be changed for all objects
within the graph including the graph background colour. The number of time series, texts of
labels and legends, X and Y intervals, and graph type can be modified using the Detail command
from the Edit menu. The font type can be changed into one of the eight types provided. Text
positioning and font size are predefined and can be changed only if the graph is resized.
The SimLab environment provides a tool for recording animation whilst the simulation is
being executed. On request the whole simulation run is recorded in a video file. The video file can
then be used to play back the simulation run using the SimVideo utility (see Figure 2.35). The
user can then edit the video file and save an edited version in another file. Unwanted portions can
be cut out, and portions from different videos can be spliced together. Graphics created in
SimDraw can be added to the video to make a presentation. The SimVideo utility can also be used
to convert libraries and screens to PostScript, and to dump the contents of a library to a file. This
can be a convenient way to present runs of a model using a different set of input data and then to
compare the consequences of changed input on model performance and output statistics.
User support and assistance
Simscript II.5 for Windows comes with four user manuals and several release notes that explain
changes, enhancements, and installation procedures for new versions of Simscript. The set of
manuals comprises: Programming Language (1987), Reference Handbook (1985), Simgraphics
II: User Manual for Simscript II.5 (1993), and Windows Simscript II.5 User’s Manual (1993).
Language and Reference manuals have not been changed from DOS versions of Simscript II. 5,
since the language has remained the same. The differences that relate to the Windows version are
described in the last two manuals. All four manuals share something in common. They are badly
written, hard to follow, too technical, and the provided indices are incomplete. Even though there
are several examples listed in the manuals, they are not explained thoroughly enough and do not
cover all of the important language and graphic concepts necessary to learn the language.
On-line help is provided in the SimLab environment under Help (see Figure 2.36). It is a
typical Windows hypertext kind of document that consists of selections for: SimLab (how to use
the SimLab environment), Simdebug (how to use debugging options), and Simscript II.5 (about
J. Kuljis User Interfaces and Discrete Event Simulation Models Page 89
Chapter 2: User Interfaces to Discrete Event Simulation Systems
the language). The help is available only in the main SimLab window. There is no on-line help
provision for SimDraw and SimVideo tools. An attempt to start help whilst in either, will close the
current application window and display help window. On closing help, control will return to the
main SimLab window. There is no context-sensitive help provision. There is no guided tutorial. It
is not likely that the user will try to use on-line help more than a couple of times because it soon
becomes very obvious that the “help” provided is not of much help. However, if a user has any
problems there is a hot-line provided by CACI in the UK. If the problems cannot be sorted out by
them, then the CACI main office in La Jolla, USA is informed and they provide additional help.
Usability evaluation
Developing any model in Simscript II.5 is almost impossible to achieve in any reasonable length
of time. The user has to learn how to program in Simscript II.5. Since learning is based solely on
user manuals and on-line help it is a long term project partially because the language is not easy to
learn (it is an extended version of Fortran) and to a great extent because the support material is of
very little use. We have not succeeded in building a model within the set up framework.
Therefore, we will ignore the programming part of the model building for a moment and
concentrate on a usability evaluation of the Simscript II.5 environment. General usability
principles that we have identified are not followed at all. Usability defects are present in navigation
through the system (e.g., separate Simscript modules behave like separate Windows applications
and moving between them is tedious and not explained). There are problems in screen design
particularly apparent in dialogue boxes. Mandatory and discretionary fields are not distinguished,
the nature of information to be entered is often unknown, parts of field labels are obscured, etc.
The terminology is too technical and more application oriented than task oriented. The feedback
provision is rudimentary and non existent for error messages. The system lacks an acceptable
level of consistency, especially across its modules. There are also problems with modality. It is
not always obvious how to change from one mode to another (e.g., designing a fill-in form and
modifying it). The user often feels that s/he is not in control of the system and that the system
does not match with user tasks. Therefore, Simscript II.5 does not support any of our four
usability criteria. It actually fails badly on all fronts. It does not promote a positive user attitude.
What is particularly frustrating for the user is the awareness of tremendous modelling potential
that cannot be put to use.
J. Kuljis User Interfaces and Discrete Event Simulation Models Page 90
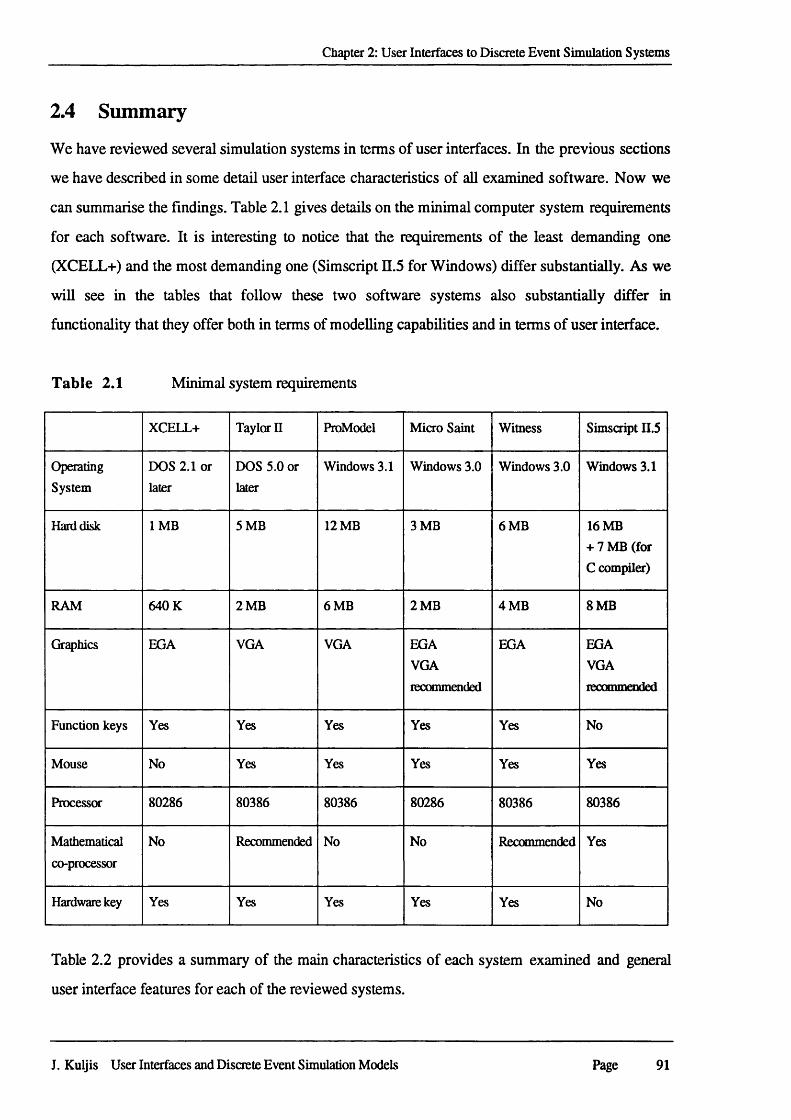
Chapter 2: User Interfaces to Discrete Event Simulation Systems
2.4 Summary
We have reviewed several simulation systems in terms of user interfaces. In the previous sections
we have described in some detail user interface characteristics of all examined software. Now we
can summarise the findings. Table 2.1 gives details on the minimal computer system requirements
for each software. It is interesting to notice that the requirements of the least demanding one
(XCELL+) and the most demanding one (Simscript n.5 for Windows) differ substantially. As we
will see in the tables that follow these two software systems also substantially differ in
functionality that they offer both in terms of modelling capabilities and in terms of user interface.
Table 2.1 Minimal system requirements
XCELL+ Taylor II ProModel Micro Saint Witness Simscript II.5
Operating
System
DOS 2.1 or
laterDOS 5.0 or
laterWindows 3.1 Windows 3.0 Windows 3.0 Windows 3.1
Harddisk 1MB 5 MB 12 MB 3 MB 6 MB 16 MB + 7 MB (for
C compiler)
RAM 640 K 2 MB 6 MB 2 MB 4 MB 8 MB
Graphics EGA VGA VGA EGAVGA
recommended
EGA EGAVGA
recommended
Function keys Yes Yes Yes Yes Yes No
Mouse No Yes Yes Yes Yes Yes
Processor 80286 80386 80386 80286 80386 80386
Mathematical
co-processor
No Recommended No No Recommended Yes
Hardware key Yes Yes Yes Yes Yes No
Table 2.2 provides a summary of the main characteristics of each system examined and general
user interface features for each of the reviewed systems.
J. Kuljis User Interfaces and Discrete Event Simulation Models Page 91
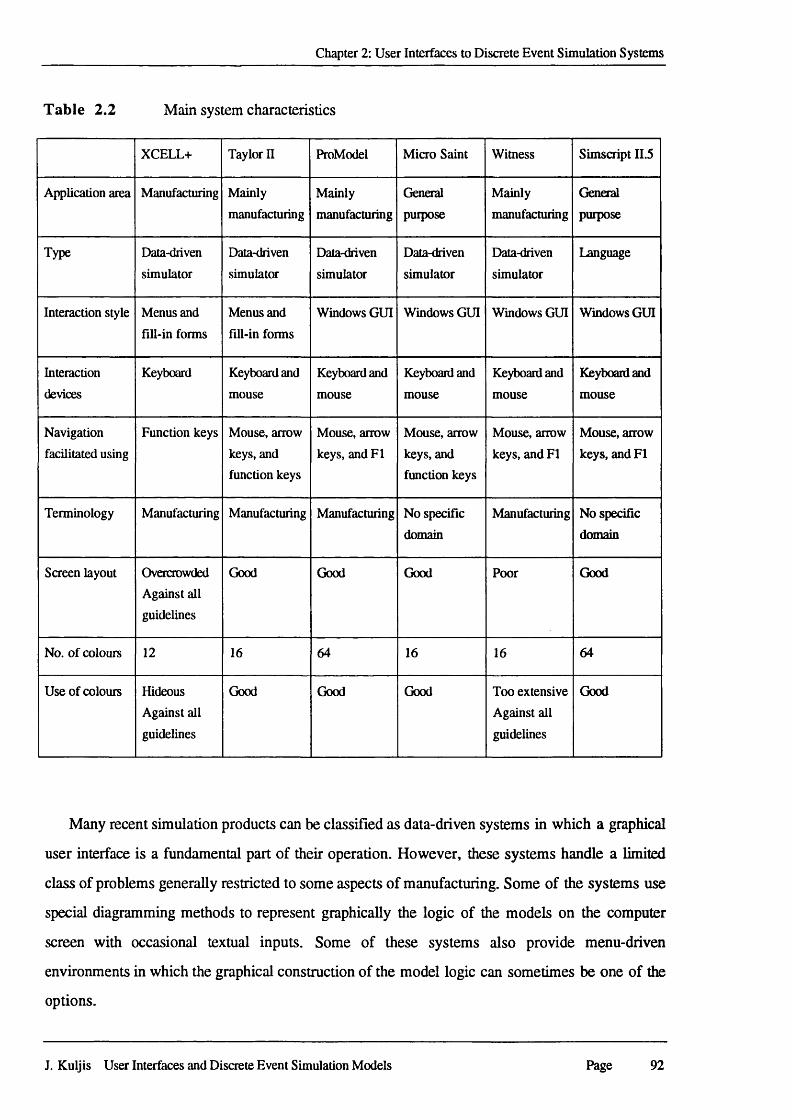
Chapter 2: User Interfaces to Discrete Event Simulation Systems
Table 2.2 Main system characteristics
XCELL+ Taylor II ProModel Micro Saint Witness Simscript II.5
Application area Manufacturing Mainly
manufacturingMainlymanufacturing
General
purpose
Mainly
manufacturing
General
purpose
Type Data-driven
simulator
Data-driven
simulatorData-driven
simulator
Data-driven
simulator
Data-driven
simulator
Language
Interaction style Menus and
fill-in forms
Menus and
fill-in formsWindows GUI Windows GUI Windows GUI Windows GUI
Interaction
devices
Keyboard Keyboard and
mouse
Keyboard and
mouse
Keyboard and
mouse
Keyboard and
mouse
Keyboard and
mouse
Navigation
facilitated using
Function keys Mouse, arrow
keys, and function keys
Mouse, arrow
keys, and FI
Mouse, arrow
keys, and function keys
Mouse, arrow
keys, and FI
Mouse, arrow
keys, and FI
Terminology Manufacturing Manufacturing Manufacturing No specific
domain
Manufacturing No specific
domain
Screen layout Overcrowded Against all
guidelines
Good Good Good Poor Good
No. of colours 12 16 64 16 16 64
Use of colours Hideous Against all
guidelines
Good Good Good Too extensive
Against all
guidelines
Good
Many recent simulation products can be classified as data-driven systems in which a graphical
user interface is a fundamental part of their operation. However, these systems handle a limited
class of problems generally restricted to some aspects of manufacturing. Some of the systems use
special diagramming methods to represent graphically the logic of the models on the computer
screen with occasional textual inputs. Some of these systems also provide menu-driven
environments in which the graphical construction of the model logic can sometimes be one of the
options.
J. Kuljis User Interfaces and Discrete Event Simulation Models Page 92
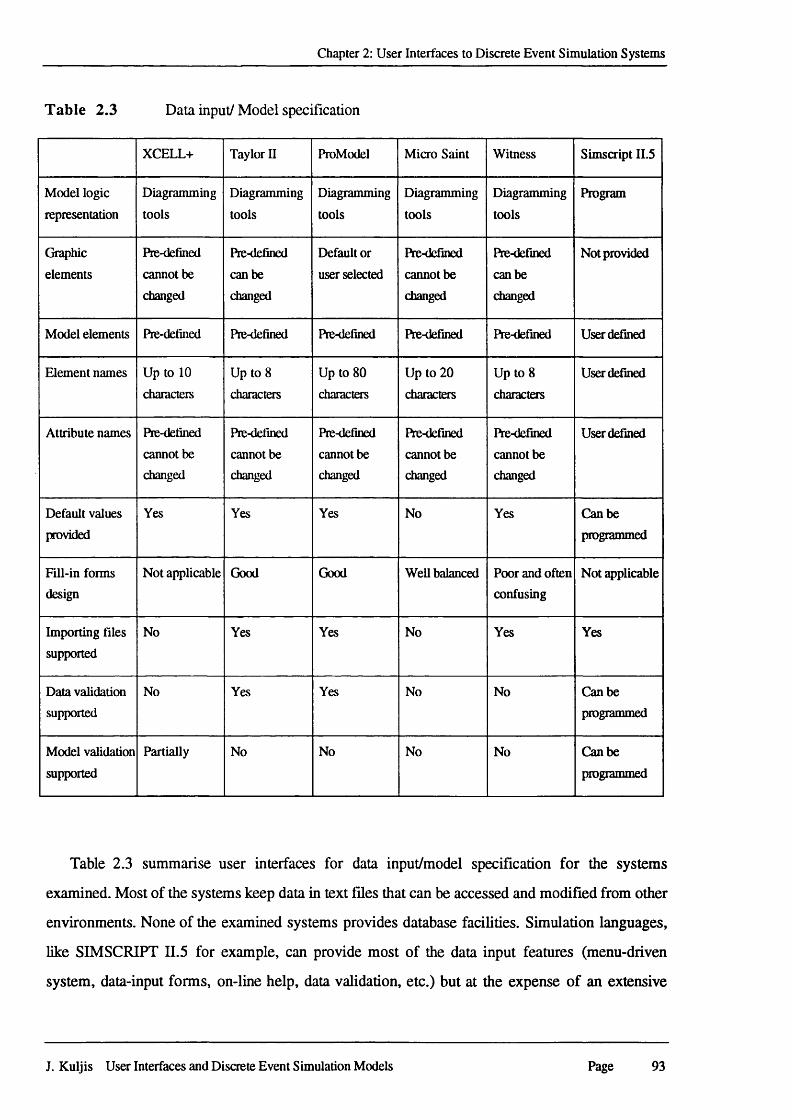
Chapter 2: User Interfaces to Discrete Event Simulation Systems
Table 2.3 Data input/Model specification
XCELL+ Taylor II ProModel Micro Saint Witness Simscript II.5
Model logic
representation
Diagramming
tools
Diagramming
tools
Diagramming
tools
Diagramming
tools
Diagramming
tools
Program
Graphic
elements
Pie-defined
cannot be
changed
Pie-defined
can be
changed
Default or
user selected
Pre-defined
cannot be
changed
Pre-defined
can be
changed
Not provided
Model elements Pie-defined Pre-defined Pre-defined Pre-defined Pre-defined User defined
Element names Up to 10
characters
Up to 8
characters
Up to 80
characters
Up to 20
characters
Up to 8
characters
User defined
Attribute names Pie-defined
cannot be changed
Pre-defined
cannot be
changed
Pre-defined
cannot be
changed
Pre-defined
cannot be
changed
Pre-defined
cannot be
changed
User defined
Default values provided
Yes Yes Yes No Yes Can be
programmed
Fill-in forms
designNot applicable Good Good Well balanced Poor and often
confusingNot applicable
Importing files
supported
No Yes Yes No Yes Yes
Data validation
supportedNo Yes Yes No No Can be
programmed
Model validation
supported
Partially No No No No Can be
programmed
Table 2.3 summarise user interfaces for data input/model specification for the systems
examined. Most of the systems keep data in text files that can be accessed and modified from other
environments. None of the examined systems provides database facilities. Simulation languages,
like SIMSCRIPT II.5 for example, can provide most of the data input features (menu-driven
system, data-input forms, on-line help, data validation, etc.) but at the expense of an extensive
J. Kuljis User Interfaces and Discrete Event Simulation Models Page 93
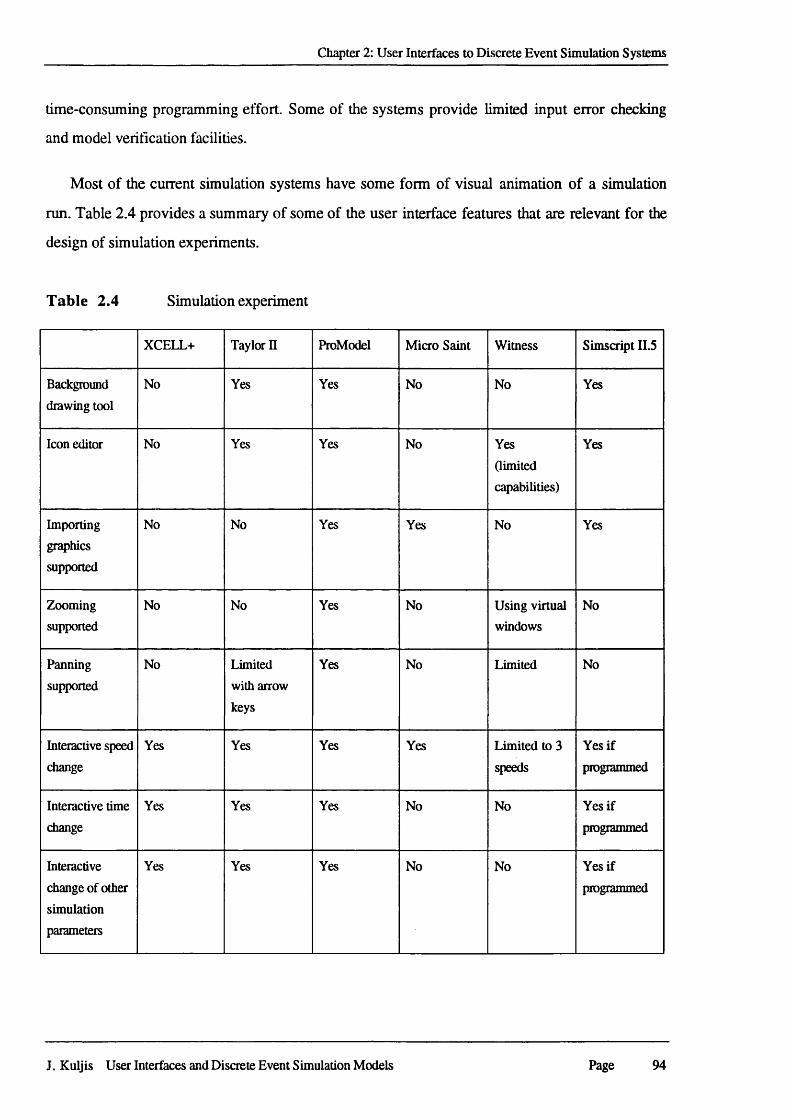
Chapter 2: User Interfaces to Discrete Event Simulation Systems
time-consuming programming effort. Some of the systems provide limited input error checking
and model verification facilities.
Most of the current simulation systems have some form of visual animation of a simulation
run. Table 2.4 provides a summary of some of the user interface features that are relevant for the
design of simulation experiments.
Table 2.4 Simulation experiment
XCELL+ Taylor II ProModel Micro Saint Witness Simscript II.5
Background
drawing tool
No Yes Yes No No Yes
Icon editor No Yes Yes No Yes
(limited
capabilities)
Yes
Importinggraphics
supported
No No Yes Yes No Yes
Zooming
supported
No No Yes No Using virtual
windows
No
Panning
supported
No Limited
with arrow
keys
Yes No Limited No
Interactive speed
change
Yes Yes Yes Yes Limited to 3
speeds
Yes if
programmed
Interactive time
change
Yes Yes Yes No No Yes if
programmed
Interactive
change of other
simulation
parameters
Yes Yes Yes No No Yes if
programmed
J. Kuljis User Interfaces and Discrete Event Simulation Models Page 94
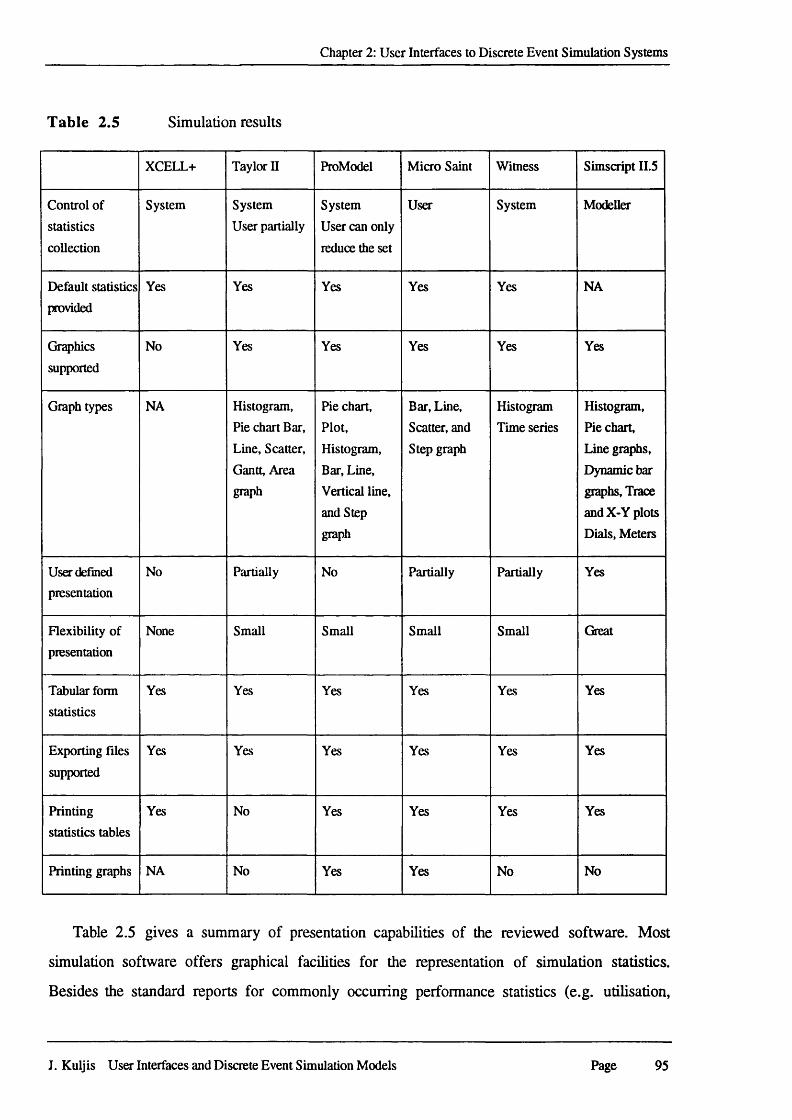
Chapter 2: User Interfaces to Discrete Event Simulation Systems
Table 2.5 Simulation results
XCELL+ Taylor II ProModel Micro Saint Witness Simscript II.5
Control of
statistics
collection
System System
User partially
System
User can only
reduce the set
User System Modeller
Default statistics
provided
Yes Yes Yes Yes Yes NA
Graphics
supported
No Yes Yes Yes Yes Yes
Graph types NA Histogram,
Pie chart Bar, Line, Scatter,
Gantt, Area
graph
Pie chart,
Plot,
Histogram,
Bar, Line, Vertical line,
and Step
graph
Bar, Line,
Scatter, and
Step graph
Histogram
Time series
Histogram,
Pie chart, Line graphs,
Dynamic bar
graphs, Trace
and X-Y plots
Dials, Meters
User defined
presentation
No Partially No Partially Partially Yes
Flexibility of
presentation
None Small Small Small Small Great
Tabular form
statistics
Yes Yes Yes Yes Yes Yes
Exporting files
supported
Yes Yes Yes Yes Yes Yes
Printing
statistics tables
Yes No Yes Yes Yes Yes
Printing graphs NA No Yes Yes No No
Table 2.5 gives a summary of presentation capabilities of the reviewed software. Most
simulation software offers graphical facilities for the representation of simulation statistics.
Besides the standard reports for commonly occurring performance statistics (e.g. utilisation,
J. Kuljis User Interfaces and Discrete Event Simulation Models Page 95
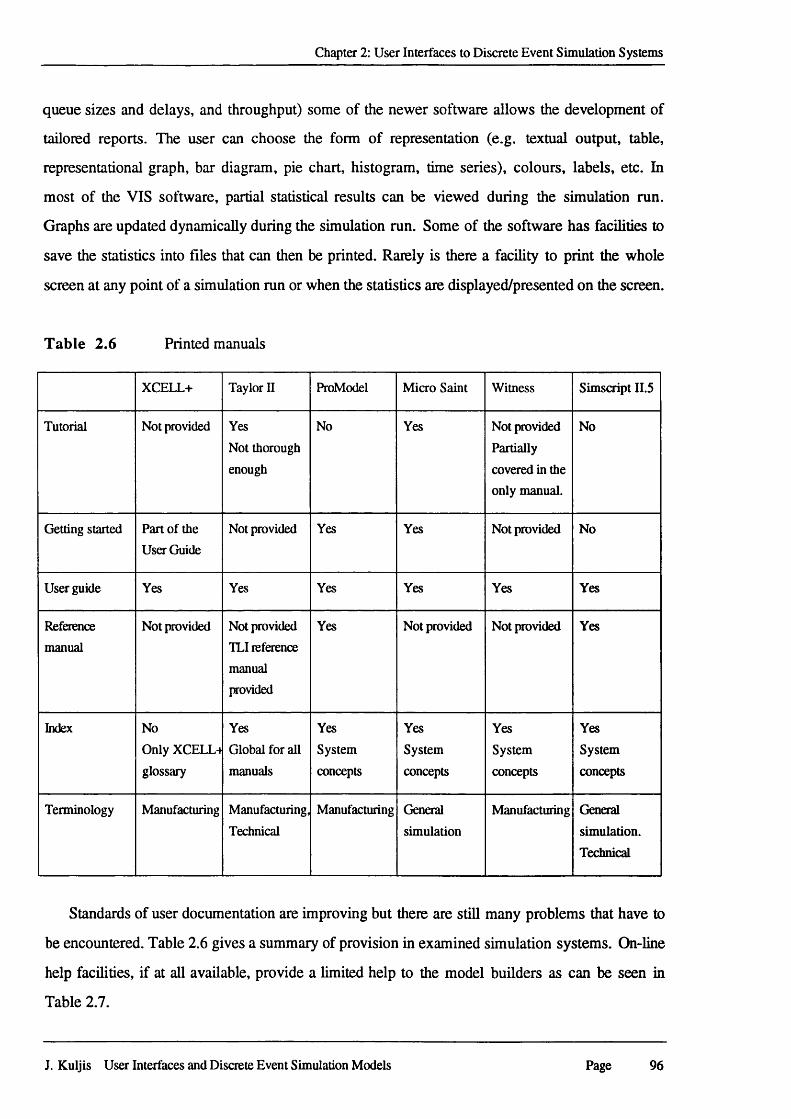
Chapter 2: User Interfaces to Discrete Event Simulation Systems
queue sizes and delays, and throughput) some of the newer software allows the development of
tailored reports. The user can choose the form of representation (e.g. textual output, table,
representational graph, bar diagram, pie chart, histogram, time series), colours, labels, etc. In
most of the VIS software, partial statistical results can be viewed during the simulation run.
Graphs are updated dynamically during the simulation run. Some of the software has facilities to
save the statistics into files that can then be printed. Rarely is there a facility to print the whole
screen at any point of a simulation run or when the statistics are displayed/presented on the screen.
Table 2.6 Printed manuals
XCELL+ Taylor II ProModel Micro Saint Witness Simscript II.5
Tutorial Not provided Yes
Not thorough
enough
No Yes Not provided
Partially
covered in the only manual.
No
Getting started Part of the
User Guide
Not provided Yes Yes Not provided No
User guide Yes Yes Yes Yes Yes Yes
Referencemanual
Not provided Not provided
TLI reference
manual provided
Yes Not provided Not provided Yes
Index No
Only XCELL4
glossary
Yes
Global for all
manuals
Yes
System
concepts
Yes
System
concepts
Yes
System
concepts
Yes
System
concepts
Terminology Manufacturing Manufacturing,
Technical
Manufacturing General
simulation
Manufacturing General
simulation.
Technical
Standards of user documentation are improving but there are still many problems that have to
be encountered. Table 2.6 gives a summary of provision in examined simulation systems. On-line
help facilities, if at all available, provide a limited help to the model builders as can be seen in
Table 2.7.
J. Kuljis User Interfaces and Discrete Event Simulation Models Page 96
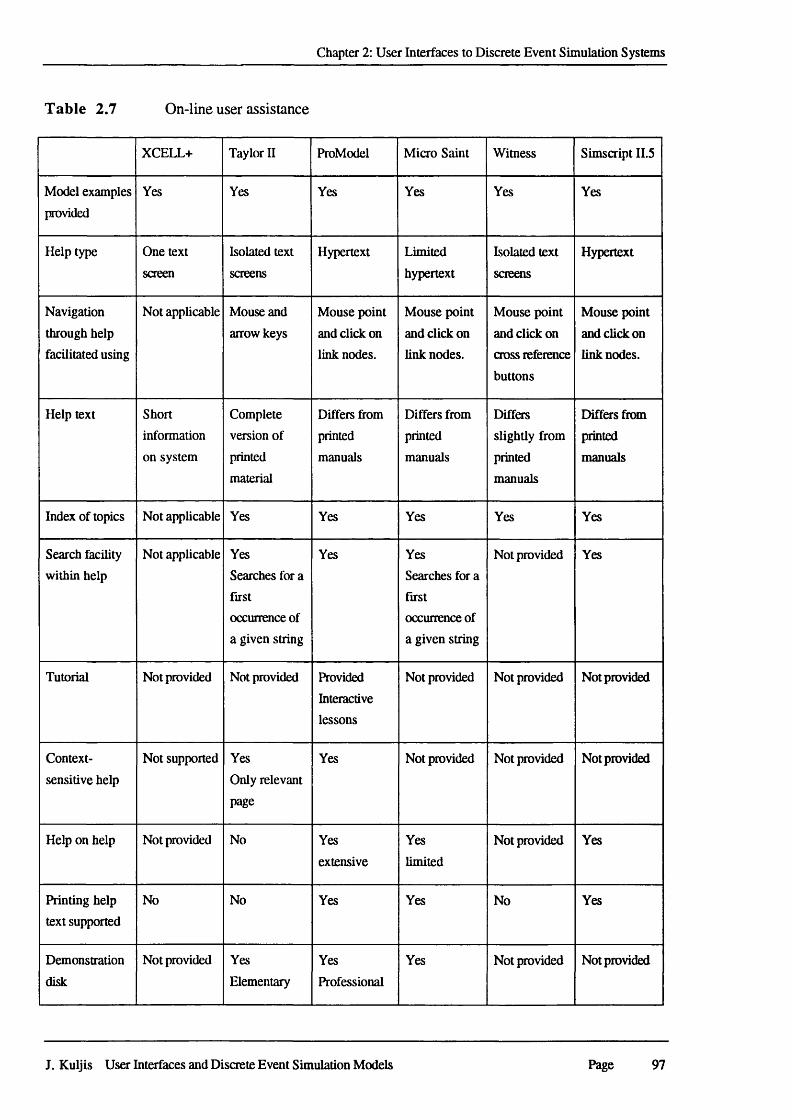
Chapter 2: User Interfaces to Discrete Event Simulation Systems
Table 2.7 On-line user assistance
XCELL+ Taylor II ProModel Micro Saint Witness Simscript II.5
Model examples
provided
Yes Yes Yes Yes Yes Yes
Help type One text
screen
Isolated text
screens
Hypertext Limited
hypertext
Isolated text
screens
Hypertext
Navigation
through help
facilitated using
Not applicable Mouse and
arrow keys
Mouse point
and click on
link nodes.
Mouse point
and click on
link nodes.
Mouse point
and click on
cross reference
buttons
Mouse point
and click on
link nodes.
Help text Shortinformation
on system
Complete version of
printed
material
Differs from
printed
manuals
Differs from
printed
manuals
Differs
slightly from
printed
manuals
Differs from
printed
manuals
Index of topics Not applicable Yes Yes Yes Yes Yes
Search facility
within help
Not applicable Yes
Searches for a
first
occurrence of
a given string
Yes YesSearches for a
firstoccurrence of a given string
Not provided Yes
Tutorial Not provided Not provided Provided
Interactivelessons
Not provided Not provided Not provided
Context-
sensitive help
Not supported Yes
Only relevant
page
Yes Not provided Not provided Not provided
Help on help Not provided No Yes
extensive
Yes
limited
Not provided Yes
Printing help
text supported
No No Yes Yes No Yes
Demonstration
disk
Not provided Yes
ElementaryYes
Professional
Yes Not provided Not provided
J. Kuljis User Interfaces and Discrete Event Simulation Models Page 97
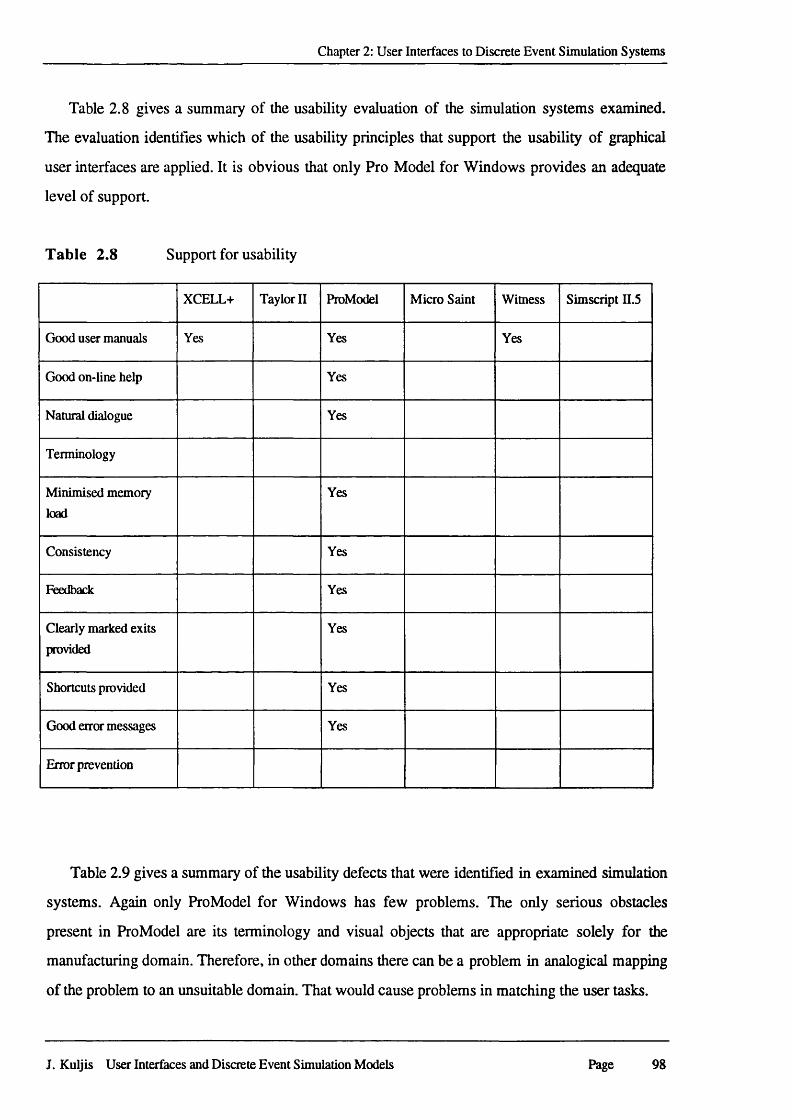
Chapter 2: User Interfaces to Discrete Event Simulation Systems
Table 2.8 gives a summary of the usability evaluation of the simulation systems examined.
The evaluation identifies which of the usability principles that support the usability of graphical
user interfaces are applied. It is obvious that only Pro Model for Windows provides an adequate
level of support.
Table 2.8 Support for usability
XCELL+ Taylor II ProModel Micro Saint Witness Simscript II.5
Good user manuals Yes Yes Yes
Good on-line help Yes
Natural dialogue Yes
Terminology
Minimised memory load
Yes
Consistency Yes
Feedback Yes
Clearly marked exits
providedYes
Shortcuts provided Yes
Good error messages Yes
Error prevention
Table 2.9 gives a summary of the usability defects that were identified in examined simulation
systems. Again only ProModel for Windows has few problems. The only serious obstacles
present in ProModel are its terminology and visual objects that are appropriate solely for the
manufacturing domain. Therefore, in other domains there can be a problem in analogical mapping
of the problem to an unsuitable domain. That would cause problems in matching the user tasks.
J. Kuljis User Interfaces and Discrete Event Simulation Models Page 98
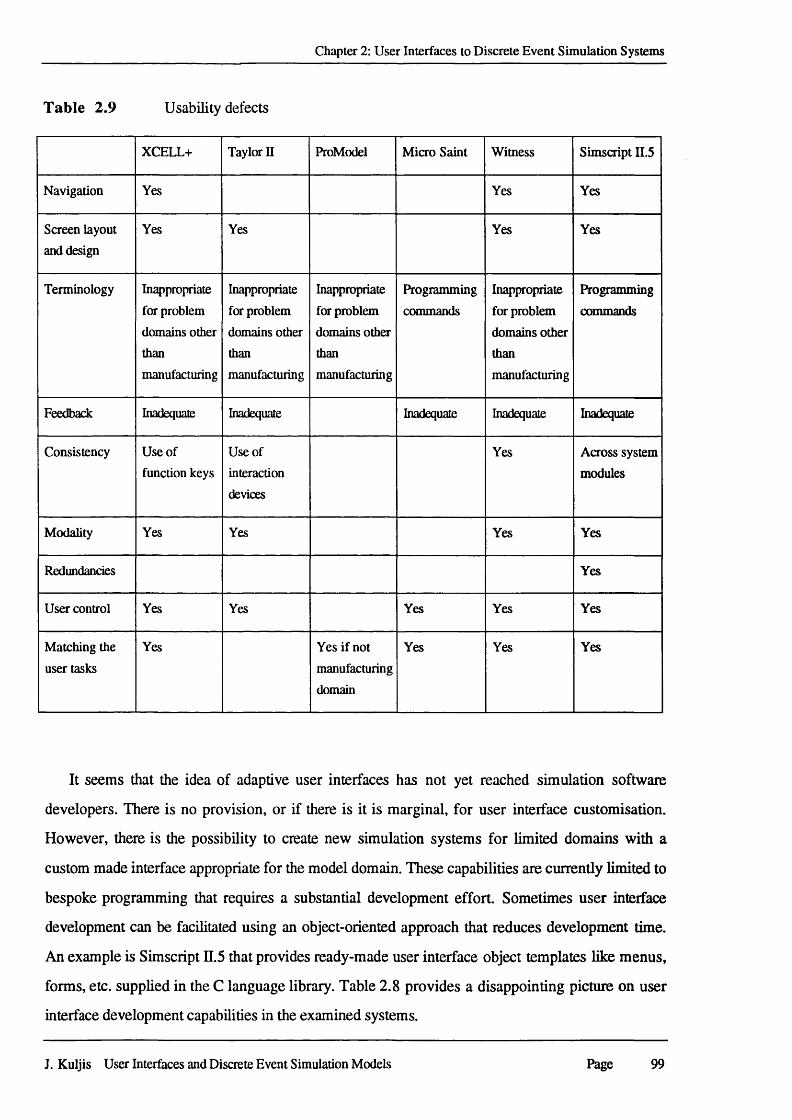
Chapter 2: User Interfaces to Discrete Event Simulation Systems
Table 2.9 Usability defects
XCELL+ Taylor II ProModel Micro Saint Witness Simscript II.5
Navigation Yes Yes Yes
Screen layout and design
Yes Yes Yes Yes
Terminology Inappropriate
for problem
domains other
thanmanufacturing
Inappropriate
for problem
domains other than
manufacturing
Inappropriate
for problem
domains other than
manufacturing
Programming
commands
Inappropriate
for problem
domains other
than
manufacturing
Programming
commands
Feedback Inadequate Inadequate Inadequate Inadequate Inadequate
Consistency Use of function keys
Use ofinteraction
devices
Yes Across system
modules
Modality Yes Yes Yes Yes
Redundancies Yes
User control Yes Yes Yes Yes Yes
Matching the
user tasks
Yes Yes if notmanufacturing
domain
Yes Yes Yes
It seems that the idea of adaptive user interfaces has not yet reached simulation software
developers. There is no provision, or if there is it is marginal, for user interface customisation.
However, there is the possibility to create new simulation systems for limited domains with a
custom made interface appropriate for the model domain. These capabilities are currently limited to
bespoke programming that requires a substantial development effort. Sometimes user interface
development can be facilitated using an object-oriented approach that reduces development time.
An example is Simscript n.5 that provides ready-made user interface object templates like menus,
forms, etc. supplied in the C language library. Table 2.8 provides a disappointing picture on user
interface development capabilities in the examined systems.
J. Kuljis User Interfaces and Discrete Event Simulation Models Page 99
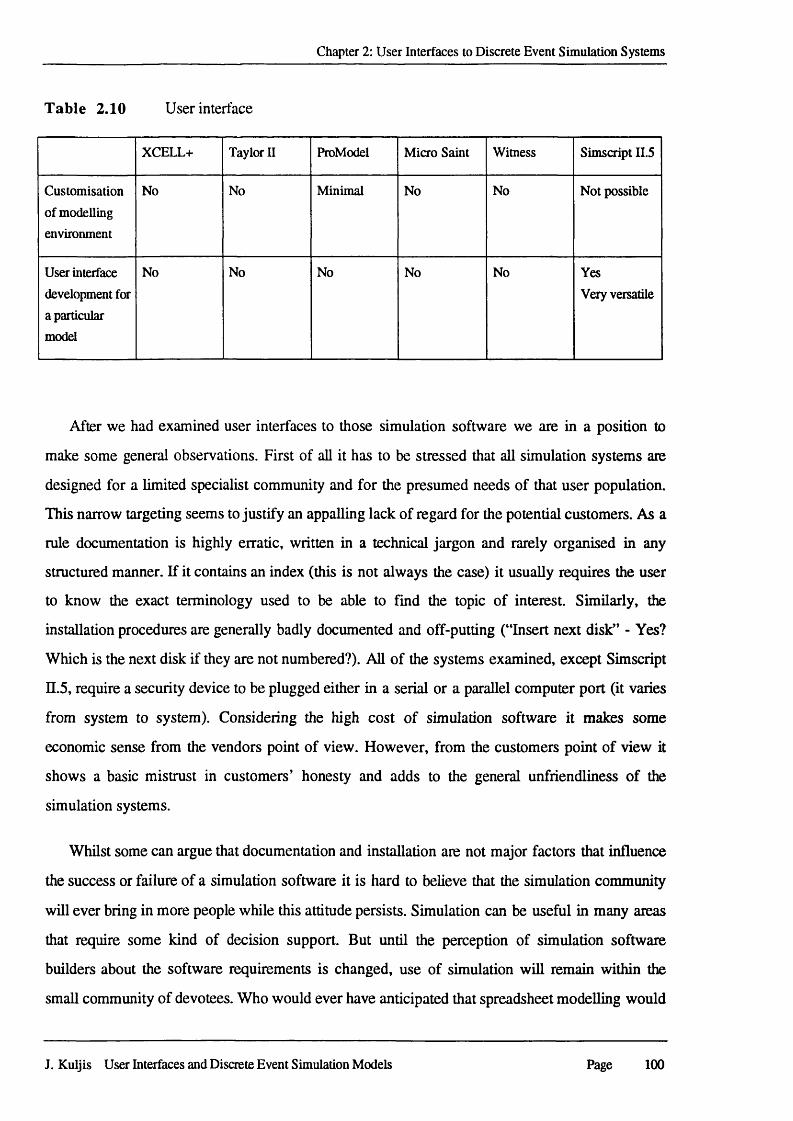
Chapter 2: User Interfaces to Discrete Event Simulation Systems
Table 2.10 User interface
XCELL+ Taylor II ProModel Micro Saint Witness Simscript II.5
Customisation
of modelling
environment
No No Minimal No No Not possible
User interface
development for
a particular
model
No No No No No Yes
Very versatile
After we had examined user interfaces to those simulation software we are in a position to
make some general observations. First of all it has to be stressed that all simulation systems are
designed for a limited specialist community and for the presumed needs of that user population.
This narrow targeting seems to justify an appalling lack of regard for the potential customers. As a
rule documentation is highly erratic, written in a technical jargon and rarely organised in any
structured manner. If it contains an index (this is not always the case) it usually requires the user
to know the exact terminology used to be able to find the topic of interest. Similarly, the
installation procedures are generally badly documented and off-putting (“Insert next disk” - Yes?
Which is the next disk if they are not numbered?). All of the systems examined, except Simscript
n.5, require a security device to be plugged either in a serial or a parallel computer port (it varies
from system to system). Considering the high cost of simulation software it makes some
economic sense from the vendors point of view. However, from the customers point of view it
shows a basic mistrust in customers’ honesty and adds to the general unfriendliness of the
simulation systems.
Whilst some can argue that documentation and installation are not major factors that influence
the success or failure of a simulation software it is hard to believe that the simulation community
will ever bring in more people while this attitude persists. Simulation can be useful in many areas
that require some kind of decision support. But until the perception of simulation software
builders about the software requirements is changed, use of simulation will remain within the
small community of devotees. Who would ever have anticipated that spreadsheet modelling would
J. Kuljis User Interfaces and Discrete Event Simulation Models Page 100

Chapter 2: User Interfaces to Discrete Event Simulation Systems
be used by almost every PC user? When the software became easy and pleasurable to use, the
application areas for spreadsheets suddenly started emerging. The major requirement for the wide
acceptance of any software (simulation software is no exception) is a substantial effort put into
user interfaces and, as a part of that, provision of usable documentation written in a language that
people can understand.
J. Kuljis User Interfaces and Discrete Event Simulation Models Page 101
Chapter 3: A Case Study
3.1 Purpose of the Case Study
In this chapter we introduce the case study used as part of the dissertation research. The case
study exemplifies the ‘classical’ approach that appears to be taken as regards visual simulation
interfaces. In the subsequent chapter we shall critique the case study development on the basis of
both the development experience, and its relationship to any relevant HCI theory. In the next
chapter we also put the case study in context with trends in practical HCI developments, and with
hypotheses drawn from the development itself.
3.2 Introduction to the Case Study
It has long been recognised that patient waiting times in outpatient clinics are infamously long. In
the United Kingdom this has been evident since the birth of the National Health Service in 1947,
although it was undoubtedly a problem long before that. It is probably true to say that patient
waiting time in clinics is a world-wide problem, with perhaps one or two exceptions. The
National Health Service in the United Kingdom recognises this as a recurring problem which has
many political undertones (Thakar and Malin, 1989). It is the sort of problem that is likely to
generate questions by Members of Parliament in the House of Commons.
An Institute of Health Services Management booklet (1985) claimed that in 1984 there were 37
million out-patient attendances. The same document quotes a (then) recent survey which found
that 44% of patients waited more than half an hour to be seen by the doctor and 16% waited more
than an hour. The accepted targets are that clinics should aim to see 75% of patients within half an
hour and that no more than 3% of patients should wait more than an hour, but very few clinics
meet this standard (Institute of Health Services Management, 1985). Waiting time is one of the
most common complaints about out-patient clinics. The problem had become so acute that it has
been addressed by the Government as a matter of concern that has to be resolved. In 1985 the
DHSS Operational Research Service published its so-called green booklet (1985, also included as
an appendix in Thakar and Malin, 1989). In the booklet it is suggested that:
J. Kuljis: User Interfaces and Discrete Event Simulation Models Page 102
Chapter 3: A Case Study
in most clinics, staff just do not realise how long their patients have to wait;
there is rarely any means for monitoring or recording waiting times.. ”
“.. the existing published solutions are by no means easy to implement; they need
special data collection exercises which are demanding o f staff time, and they
require expertise to interpret the results and produce from them a revised
appointment scheme. ”
It is curious that this problem should have had existed for so long, given that firstly there have
been many attempts at trying to solve it, and secondly, a fairly well known theory exists as to how
the problem can be solved. The attempts that have been made to solve this problem consist of
queuing theory, simulation modelling of a blackbox type, statistical analysis, and there have been
many investigative studies of a general nature which by and large have led to the same
conclusions. The conclusions which can be generated by these mathematical techniques or by
common-sense are that if one assumes that doctors’ time is more important than patient waiting
times, then clinics will be loaded with patients to make sure that doctors do not wait. Goitein
(1990) states:
“It is hard to avoid the suspicion that physicians and hospital administrators value a
physician’s time far more than that o f patients and establish schedules ensuring that
physicians will have only a very small chance o f being idle - with the consequence
that their patients are likely to experience substantial delays”..
Using Monte Carlo simulation his analysis shows that a physician needs to pay a rather small
price in terms of idle time to make patients’ waiting times quite acceptable. The analysis also
makes it clear that if the physician overbooks the schedule even quite slightly to ensure that the
idle time will be small, patients will experience very long waits. The second confounding factor is
the assumption made in making these appointment schedules, that doctors will arrive on time in
the clinic. However, historically this has not been proved to be true.
The Operational Research Division of the Department of Health (DOH) have made many
attempts to solve the problem of out-patient waiting times. If one thinks about the structure of a
J. Kuljis User Interfaces and Discrete Event Simulation Models Page 103
Chapter 3: A Case Study
hospital out-patient clinic it is in fact, in queuing or flow terms, fairly simple. Patients arrive, they
check in with the receptionist, they may have some pre-consultation tests, they wait for a doctor,
they have a consultation, they check out again to book their next appointment time, and then they
leave. This does not appear at first sight to be a very difficult problem and therefore the DHSS
gave the problem as a student project to an MSc student at one of the London Colleges. According
to the DHSS, the student discovered that the project was much more complicated than had been
imagined.
In the second attempt at this project the initial specification for the package, to be called
CLINSIM, was drawn up and a contract let to a small software company. The company, who
were Pascal experts and who had some previous experience in writing simulation software,
constructed a model in that language. During the development of CLINSIM, a number of
amendments were made to the specification based on the experience and better understanding
gained during the development. The revised specification is described by Thakar (1990). This
attempt failed again because, whilst it may appear that the problem to be modelled is relatively
straightforward, the complexity of trying to build a general purpose structure inevitably meant that
the development of the model by this company could not handle the changes of understanding that
took place during model development. So several years after the project inception, a third attempt
was made to build this model, and it is this attempt which we describe here. The development of
the new CLINSIM was contracted to RJP Research Associates. Some details of the system design
can be found in Kuljis et al. (1990), Kuljis and Paul (1991), Kuljis (1994), and in Kuljis and Paul
(1994). The contributions to the CLINSIM package that are part of this research are in the design
and implementation of the data input module of the system, and in the design and implementation
of all the user interfaces of the system (i.e. all interaction objects, fill-in forms, menus, icons, and
output graphs). The author of this research was not involved in the development of the simulation
engine for CLINSIM.
33 The Problem Modelled
The model CLINSIM described here is yet another attempt at solving a classical problem to which
to some extent the solution is already known. Because we know the solution, this attempt is based
around a general purpose Visual Simulation Model. The idea behind this approach is that such a
J. Kuljis User Interfaces and Discrete Event Simulation Models Page 104
Chapter 3: A Case Study
model could be used to show consultants and administrators why they have problems with
waiting times, and how these problems might be resolved. In order to make this simulation model
general purpose, so that it can be distributed and shown to as many people in the National Health
Service in the UK as possible, the specification required firstly that the model will run on any
IBM compatible (AT standard) PC, because this was the machine that is most likely to be
available. Secondly, the visual representation was to be an iconic representation, so that non
computer specialists could understand what the simulation modelling is trying to do. Thirdly, the
model should be of a general purpose, data driven construction, so that in theory any hospital
clinic could be modelled by this general purpose model.
It should allow users to explore the consequences of changing the various factors connected
with clinic organisation and doctor/patient behaviour or patient waiting times. The users of the
system will be analysts working in conjunction with administrative and medical personnel in the
health service. Hence the package is not required to be as robust as would be necessary if it were
intended for use by the ‘customer’ on his own, nor does it need to have a high level of self
explanation. It was agreed that CLINSIM will consist of three integral parts:
• An explanatory introduction, including a fixed demonstration
• The data capture module
• The simulation and results module
The data capture module must allow for a complex specification of an outpatient clinic
structure to be input. The simulation and results module requires that the simulation should be
visible so that the customer and the analyst can see that the model is working correctly, and that
the waiting effects caused by the clinic appointments system appears dynamically rather than just
as an output statistic. This visual representation is felt to be more convincing to the customer than
a collection of statistical results.
Before going into details about of the system requirements, the problem specification is given.
The following section covers the description of the clinic model. A ‘model’ is a simplified
representation of reality. A good model will retain the essential features of the real system, and so
behaves like it, whilst remaining clear and manageable. Because outpatient clinics can vary greatly
between specialities and hospitals, the model will not fit all clinics. The entities within a clinic in
J. Kuljis User Interfaces and Discrete Event Simulation Models Page 105

Chapter 3: A Case Study
the model are a ‘firm’ of doctors, patients, receptionists and test rooms. A ‘firm’ is a group of
doctors seeing patients in a given speciality. Doctors within a firm ‘share’ patients from a common
appointment list. One of the features of this model is to ‘simulate’ an appointment time (which is
the time when the doctor is expected to see the patient) for each patient on the list and then
simulate the patient’s ‘actual’ arrival time using parameters specified by the user.
3.3.1 Clinic Structure
Each clinic contains a number of the following, (the actual number of each being specified by the
user):
• Doctors from a firm (i.e. a team of doctors in a given speciality who see patients from
a shared appointment list). The number of doctors that can be specified in the model is
1. . 6 .
• Patien ts, who may be new patients to the clinic or reattenders. Some patients may
arrive at the clinic without an appointment - these are called ‘extras’. Patients with an
appointment may arrive either by hospital transport (HT patient) or by non-hospital
transport (NHT patient).
• R eceptionists, who book patients in and out of the clinic. The number of
receptionists in the model is 1 or 2.
• T estroom s, where any pre-consultation tests are carried out. A ‘testroom’ does not
just mean the room itself, but includes all nursing and other staff needed to carry out the
tests and any equipment that they require. The number of testrooms in the model is
0..3.
The constraints on the number of entities in the system was determined and imposed by the
OR Department of the DOH. Based on the data on DOH clinics they felt that the specified number
of entities will be sufficient to model most of the outpatient clinics. Their decision was also
governed by the consideration of screen space if more permanent entities (doctors, receptionists,
and testrooms) in the system will be allowed. A simplified representation of the model is given in
Figure 3.1.
J. Kuljis User Interfaces and Discrete Event Simulation Models Page 106
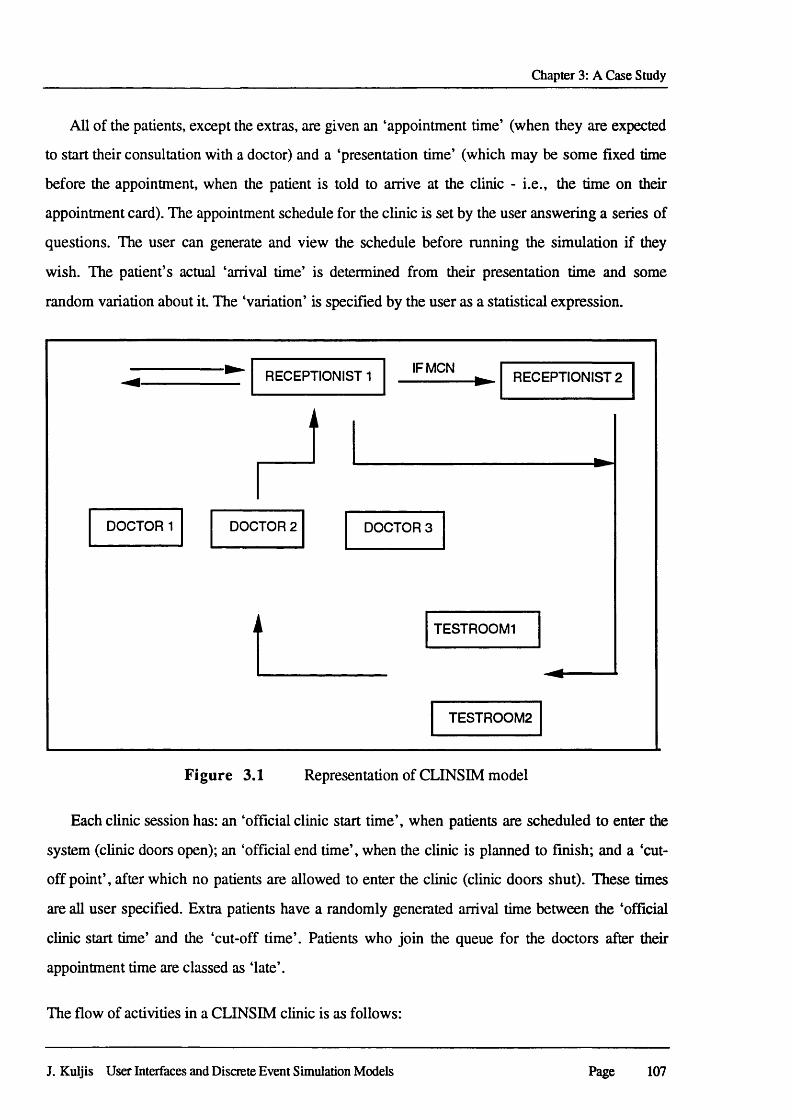
Chapter 3: A Case Study
All of the patients, except the extras, are given an ‘appointment time’ (when they are expected
to start their consultation with a doctor) and a ‘presentation time’ (which may be some fixed time
before the appointment, when the patient is told to arrive at the clinic - i.e., the time on their
appointment card). The appointment schedule for the clinic is set by the user answering a series of
questions. The user can generate and view the schedule before running the simulation if they
wish. The patient’s actual ‘arrival time’ is determined from their presentation time and some
random variation about it. The ‘variation’ is specified by the user as a statistical expression.
RECEPTIONIST 1 IFMCNRECEPTIONIST 2
A
DOCTOR 1 DOCTOR 2 DOCTOR 3
TESTROOM1
TESTROOM2
Figure 3.1 Representation of CLINSIM model
Each clinic session has: an ‘official clinic start time’, when patients are scheduled to enter the
system (clinic doors open); an ‘official end time’, when the clinic is planned to finish; and a ‘cut
off point’, after which no patients are allowed to enter the clinic (clinic doors shut). These times
are all user specified. Extra patients have a randomly generated arrival time between the ‘official
clinic start time’ and the ‘cut-off time’. Patients who join the queue for the doctors after their
appointment time are classed as ‘late’.
The flow of activities in a CLINSIM clinic is as follows:
J. Kuljis User Interfaces and Discrete Event Simulation Models Page 107

Chapter 3: A Case Study
1. On arriving at the clinic each patient must queue to book in with ‘receptionist 1*. As an
option, a second receptionist - ‘receptionist 2’ can be introduced to deal specifically with
those patients with missing case notes (MCN patients) - after seeing the first receptionist,
MCN patients must then queue to book in with the second receptionist. Patients queue
separately for receptionist 1 and receptionist 2 (in two separate queues), and are seen on a
first come first served basis by both. The decision that the ‘Receptionist 2’ is specialised in
dealing only with the MCN patients was decided by the OR Department of the DOH. It
certainly does not accurately reflect reality where there is no specialisation of that kind, or
if there is it is very rare.
2. When they have booked in, patients queue for pre-consultation tests (if appropriate for the
clinic). All pre-consultation tests (such as blood tests, urine tests, and X-rays) are treated
as a single activity. Thus the length of a pre-consultation will reflect the total duration of all
tests and the time a patient would spend waiting between tests. Patients queuing for the
testrooms are seen on a first come first served basis. Again, the OR Department of the
DOH made the decision that there is no need for separate queues for each testroom and that
all patients should join a single queue.
3. Having completed any pre-consultation tests, patients join the consultation queue. The
order in which patients are seen by the doctors is determined by the operating rules
selected. The user may, for example, specify that patients are seen on a first come first
served basis and are seen by any available doctor. Alternatively, patients may be seen
strictly in appointment order, where all new patients are seen by a given doctor. The order
in which the patients are seen may depend on whether they have arrived by hospital
transport or not, or whether they are late or on time, and on whether they have an
appointment.
4. After their consultation, patients join the end of the queue for receptionist 1. When
receptionist 1 becomes available, the patient books out, and leaves the clinic. The
simulation continues until the last patient has left the clinic.
The flow of activities in the clinic is determined by the appointment scheduling rules, queues’
discipline rules, and operating practice rules.
J. Kuljis User Interfaces and Discrete Event Simulation Models Page 108
Chapter 3: A Case Study
3.3 .2 Appointment Scheduling Rules
The user makes a series of choices to determine the nature of the rules for generating the
appointment schedules. The appointment schedules are created for the firm of doctors, since they
share patients from a common appointment schedule. The appointment schedule determines the
times that the patients should turn up at the clinic. The appointment schedule is created separately
for the new patients and for the reattenders.
When generating the appointment schedule, patients are selected from a ‘patient pool’ which
contains all the patients to be given appointments for a given session. The number of patients in
the pool is determined by user specified parameter for the list size. The user gives the constant
numbers of new patients, reattenders and extra patients. These determine the number of patients
who are booked into the clinic. For the new patients and the reattenders the user can specify
distribution parts - statistical expressions to allow for variation in the number of booked patients.
Each patient selected from the patient pool is ‘randomly’ given the attribute of being either a HT or
NHT patient (according to the user specified values for % HT and % NHT). Patients are then
assigned an initial time slot using rules and parameters such as:
• the earliest appointment time
• the end of booking period
• whether all patients are booked at earliest appointment time
• whether to distinguish between HT and NHT patients
• whether to book patients evenly throughout booking period
• whether initial part of booking period is treated as being special
• whether latter part of booking period is treated as being special
• what is the recommended number of patients to be booked per hour
3.3.3 Queue Discipline Rules
There are four queues in the model. The rules on how the patients are placed in each of the queues
are given below:
J. Kuljis User Interfaces and Discrete Event Simulation Models Page 109
Chapter 3: A Case Study
1 . Queue fo r receptionist 1
The patients join this queue either on arriving at the clinic or after seeing a doctor. Patients are
seen on a first come first served basis. Depending on whether a patient is just booking-in, or has
been seen by a doctor and is booking-out, the time that receptionist 1 deals with the patient may
vary. It can be some constant value or a stochastic value chosen from seven possible statistical
distributions (the list is given in section 3.3.5).
2 . Queue fo r receptionist 2
Patients whose case notes are missing (this is discovered after queuing and being seen by
receptionist 1) must join the queue for receptionist 2. Patients are seen on a first come first serve
basis. The time that receptionist 2 deals with the patients can be some constant time or a stochastic
value chosen from the same seven possible statistical distributions.
3 . Queue fo r testrooms
If the clinic administers pre-consultation tests then there is just one queue for the testrooms (1 ,2
or 3). The patients join the end of the queue and the tests are performed on a first come first
served basis. Each of the testrooms has its opening times and the time necessary to perform the
tests. The testing times can be constant or stochastic (again, there is a choice of the same seven
statistical distributions).
4 . Queue fo r doctors
There is a set of options to determine the order in which patients are placed in the consultation
queue. Different queue disciplines are used for the following categories of patients:
i. ‘On-time’ patients - the order in which those patients who arrive at or before their
appointments time are seen. The possible options are:
• first come first served
• appointment order
ii. ‘Late’ patients - the order in which patients who arrive after their appointments time are
seen. The possible options are:
J. Kuljis User Interfaces and Discrete Event Simulation Models Page 110
Chapter 3: A Case Study
• nearest to appointment time
• at end of current queue
• at end of session
• at end of clearance interval
iii. ‘Extras’ - the order in which patients who arrive without an appointment are seen. The
options are:
• at end of current queue
• at end of session
• at end of clearance interval
The clearance interval (in minutes) for HT patients, NHT patients, and extras is the same. The
purpose of this is to provide a mechanism for clearing back-logs. For example, suppose the
official start time is 9.00am, and the clearance interval is 1 hour. Each patient joining the queue
after, say 10.00am and before 11.00am, who is classed as ‘late’, is now considered to have a
‘pseudo’ appointment time of 11.00am and is placed in the queue according to his/her new
(pseudo) appointment time.
3.3 .4 Operating Practice
Operating practice rules determine in which order the patients in the consultation queue are seen by
the doctors. The rules are based on the order of the patients in the queue and the patients’ type -
new or reattender (HT and NHT patients are not distinguished here). For each doctor the user
decides on the types of patient a doctor is going to see (patient types being new only, reattenders
only, or both new and reattenders). If the doctor was allocated a new patient type then the user
provides a percentage of new patients to be seen by the doctor.
When a doctor becomes available, a patient is selected from the consultation queue according
to the operating practice rules. An actual number of the new patients are assigned to each doctor.
Each doctor sees his/her quota of new patients. If the doctor has already seen his or her quota of
new patients, or is only required to see reattenders, then he or she is allocated the first reattender
from the queue. If the doctor has not yet seen his or her quota of new patients, then the queue is
J. Kuljis User Interfaces and Discrete Event Simulation Models Page 111
Chapter 3: A Case Study
scanned. The first x patients are checked (x is the ‘depth factor’ provided by the user) and the
doctor is allocated the first new patient in that group. If all the first x patients are reattenders then
the doctor is allocated the first reattender in the queue (unless the doctor is specified as one seeing
only new patients). The user provides the depth factor that determines how far the consultation
queue is scanned, giving priority to new patients over reattenders within the depth factor.
3.3 .5 Statistical Data
In the clinic set-up data there are 20 statistical expressions that are specified as statistical
distributions. For each of these 20 data items a user can choose one of the following seven
distributions:
• Constant
• Erlang
• Negative Exponential
• Normal
• Poisson
• Uniform
• Data sample
Each distribution, except the Data sample, has either one or two parameters. For the distribution
variables a user may also supply truncation values, i.e. a minimum and a maximum value, in
order to keep it within realistic bounds. If a user chooses ‘Data sample’ then up to 20 pairs of
observations and cumulative frequencies must be supplied. Typically this will be data collected
from survey work.
3.3 .6 Simulation of a Clinic
The simulation of a clinic is based on the given clinic structure and a set of rules for appointments,
queue discipline, and operating practice. The activity flow for a clinic is as follows:
J. Kuljis User Interfaces and Discrete Event Simulation Models Page 112
Chapter 3: A Case Study
• Patients arrive in the clinic randomly. Their sampling is based on the chosen
distribution of actual arrival times for each of four patient types (new, reattenders, HT
new, and HT reattenders) following the appointment scheduling rules for each of these
four patient types. The number of patients generated is influenced by the given numbers
of patients who do not attend their appointments. These numbers are statistical
variances (chosen from the seven distribution types) for each of the four patient types.
Extra patients are generated based on a statistical variance for the number of patients that
arrive at the clinic without having appointments. Random number generation is based
on the seed number provided as a part of the clinic data required for simulation. The
seed number changes for each of the seven distribution types and for each patient type.
• When patients arrive they are seen by receptionist 1 on a first come first served (FIFO)
order. The time spent on each patient by the receptionist 1, ‘booking-in time’, is based
on a value from a statistical distribution. Based on a specified percentage, patients with
‘missing case notes’ are randomly sent to be seen by receptionist 2 who handles only
these cases. The patients are seen by receptionist 2 in a FIFO order. The time spent on
each patient by receptionist 2 is based on a value from a statistical distribution.
• After a patient has been ‘booked in’ the patient joins a queue for test rooms. Depending
on the number of test rooms and their individual start times the patients are seen by
nurses and the tests are performed following a FIFO order. The first patient in the test
rooms queue will go in the first idle test room. The times allocated for tests are
stochastic and can be different for each test room.
• After the tests are performed a patient joins a queue for doctors. The patients are seen
by the doctors following a complex set of ‘operating practice’ rules. How long a patient
has to wait depends on the patient type (new or reattender), the patient’s keeping the
appointment time or coming without an appointment, an availability of a doctor seeing
that type of patient (new or reattender), and the consultation time for each patient. The
consultation time is stochastic and can be different for new patients than for reattenders.
The waiting time is also influenced by the doctors actual start time, a time that is
stochastically determined and can be different from the official start time.
J. Kuljis User Interfaces and Discrete Event Simulation Models Page 113
Chapter 3: A Case Study
• After being seen by a doctor the patient joins the end of the receptionist 1 queue to
‘check-out’. The receptionist 1 queue may consist of patients who just came into the
clinic and the patients that were already seen by the doctors. The time for a patient to
‘check-out’ can be stochastic and different from the time to ‘check-in’.
• After checking out a patient leaves the clinic.
The simulation of a clinic runs as long as there are patients in the clinic regardless of the clinic
closing time ( ‘cut-off time). Once the last patient has left and the time for closing the clinic is
reached, the simulation stops. The simulation of a clinic can be performed as a single experiment
(‘single run’), or as a series of experiments (‘multiple run’). In the case of multiple runs the
sampling is based on a different starting seed number for each run.
3.4 Building CLINSIM
3.4.1 Design Considerations
There are three evident, almost entirely independent parts of the model. These are:
• Data input
• Simulation
• Simulation results
Therefore, the obvious design approach was to preserve this independence in the design of the
system. If the data is kept separately from the actual simulation running, any change in the way
the data handling is done would not influence the simulation engine. If the results of the
simulation run/s (statistical results) are kept separately then the way these data are approached and
displayed is completely independent of the actual simulation. The simulation results can be
viewed, therefore, in a number of different ways and different orders and, if necessary, the
interface to that module can be modified without affecting the simulation process itself or the way
the data input is handled. The design of the whole system can be cut down into three seemingly
independent modules. This reduces the overall complexity of the system and allows for a much
J. Kuljis User Interfaces and Discrete Event Simulation Models Page 114
Chapter 3: A Case Study
cleaner design. Of course, consideration must be given to the compatibility of these modules
allowing for clear and simple integration of the modules into the system.
Serious consideration was given as to how the user will interact with the system. Ideally, the
user of the system should be completely unaware of the software tools used. This interface
requirement applies to the overall system. To accommodate this, CLINSIM needs to provide a
flexible user interface that would hide the real system from the user. Every software project today
has to accommodate new commercially established standards for user interfaces. CLINSIM had to
accommodate these standard to a certain extent.
Before starting the design of the system, a survey of the possible software tools was made. A
system that would fulfil all the requirements was not found. On the other hand, because of the
nature of the modelling process, bespoke programming was not considered as the feasible choice.
The CLINSIM requirement was for a general purpose data driven system, with complex data
specification capabilities, and extensive output statistics represented in a variety of numerical and
graphical forms. As already discussed in Chapter 2, this requirement cannot easily be met by
many available simulation systems. Most general purpose simulation systems are either simulation
languages that require extensive programming, or data driven simulators which have a very rigid
form and do not allow the customisation of user interfaces for a particular domain. Simulation
systems in general do not support complex data structures and database storage facilities.
Therefore the decision was to use two software packages, one for data input, and the other for
both the visual simulation and the simulation results.
Data module
The requirement was to provide a utility for keeping information on an arbitrary number of
different clinic set-ups, so that the user can simulate a clinic of his or her choice. The complexity
and the volume of data required highly structured data capabilities. The data structure that can
provide for it would be extremely hard to define in an ordinary programming language, e.g.
Pascal. Another problem in defining a rigid data structure is that any change in the model data
requires a change in the data structures as well.
J. Kuljis User Interfaces and Discrete Event Simulation Models Page 115
Chapter 3: A Case Study
Taking these constraints into consideration, the obvious pathway is to use a database system
to store the data. Database systems have the advantages of preserving data integrity, providing
data independence, easy data manipulation and maintenance. There is always a price to be paid.
The disadvantage is that even a database system cannot provide an elegant solution for a complex
data structure, but that disadvantage is less problematic than designing a database manager from
scratch.
During a survey of the available software, several packages were examined. For building the
data module interface, software and database management systems were looked a t The possibility
of developing a Windows application was considered because of the attractive user interface and
the claim that any application can be run from Microsoft Windows 3.0. At that time (1990) there
was no proper Windows application builder. There was no Windows simulation software, either.
There were problems in running some DOS applications from Windows 3.0, particularly in
running graphics. The requirement was specifically against using a mouse in the system. The
reason given by the ORD of the DOH was that personal computers with mice are a rare
commodity in NHS hospitals. So, that option was abandoned, which with the benefit of the
hindsight was a wrong decision.
Interface development software examined included the C-scape Interface Management System
(1989) with Look and Feel Screen Designer (1989), and Metawindows (1986). Look and Feel is
a visually oriented screen designer and code generator in the C language. C-scape is a tool for
controlling the user interface of C programs. However, the data module would have to be
assembled by writing C code to combine a number of screens built within Look and Feel.
Metawindows is a library of Pascal graphics drawing routines to which an additional library
graphic-Menu (1989), containing a library of menu building functions, can be added. Data Entry
Module (1989) is further library of data entry forms that can be used to build the complete system
in Pascal using extensive library calls. Whilst the combination of these libraries might make the
data module development relatively straight forward, it still requires substantial programming. In
the light of the constantly changing system requirements it was not clear that this would lead to a
clean programming solution. Microsoft abandoned Metawindows development very soon after
this survey was conducted.
J. Kuljis User Interfaces and Discrete Event Simulation Models Page 116
Chapter 3: A Case Study
Database packages examined were Borland Paradox and Ashton Tate dBase IV (1988).
Paradox (1989) offers most of the capabilities required. It has a database manager for handling the
data and an interface builder for making a customised application. The disadvantage is that the
interface that can be built using Paradox tools was of a poor visual appearance and that it provides
restrictive capabilities of data manipulation. dBase IV has an easy to use data entry form designer,
a report designer and an Application Generator. The Application Generator is an interface builder
in the form of visual programming where a programmer can directly manipulate visual objects on
the screen. Once created, objects can be then transformed into program code using the dBase IV
program generator. The whole data module (menus, forms, reports, etc.) can then be integrated in
runtime code. The attraction of this approach was very fast development, a capability for
prototyping, and relatively little programming. Another plus of opting for dBase was its
widespread use - it was the market leader PC database package. The assumption was that the
user’s support offered by Ashton Tate was at an adequate level. A major considerations was that
any system developed would have a free runtime licence, which dBase provided.
Simulation module
Simulation in general, as already mentioned, consists of two or three basic functional parts: the
simulation engine that handles the algorithmic modelling part of the system; the visual graphic
screen depicting the logic of the simulation model whilst running; and the output results. Some of
the older simulation packages, like GPSS, had only the simulation engine and the output results.
Visual simulation is available in the newer, technically more advanced software products. The
same can be said about graphical presentation of the output results. The older systems provide
only statistics that are very hard to interpret and completely alien to non specialists. The newer
systems provide for graphical representation of the numerical data making it much more acceptable
to the ordinary user.
Since the decision was to keep the data and the processing as separate and as independent as
possible, the presentation of the simulation results appears to be isolated as a separate module.
The simulation engine and the visual representation of the ongoing simulation process cannot be
separated. So, the simulation module contains both.
J. Kuljis User Interfaces and Discrete Event Simulation Models Page 117
Chapter 3: A Case Study
The important part of the CLINSIM requirement is the visual simulation. This is the simplest
way of observing the behaviour of the model. Based on these observations the user can identify
the obvious anomalies in the model and find ways of improving its performance. The requirement
was to create iconic representations of the clinic entities (patients, nurses, receptionists, and
doctors). The requirement was not for graphical animation. The patients’ icons should move on
the screen, jumping from one state to the next state when the change of state occurs.
Before the decision about the most adequate package for simulation development was made, a
survey of the available software was made. Considerable experience has already been obtained in
the development of the eLSE Pascal simulation system (Crookes et al., 1986) which had been
used to develop several real applications (Holder and Gittins, 1989; and Williams et al., 1989).
However, the visual side of these and subsequent systems was not considered adequate. As
summarised in Chapter 2, of the six examined simulation systems, there is none that can fully
fulfil all the necessary requirements. The most crucial problem is the need to develop a problem
specific user interface, that avoids and hides the intricacies of system procedures and jargon from
the intended user. This is a rare commodity in simulation systems. Of the six systems examined in
Chapter 2, only SIMSCRIPT II.5 facilitates user interface development. However, the final
decision was also based on the negotiation of a free run-time licence. Such considerations were
met by SIMSCRIPT II.5 (1989).
Simulation results module
The requirement was that all output results should be represented both in graphical and numerical
form. There are many graphical system that can provide both. Some of them are independent and
some of them work within the software framework for which they were initially developed.
However, since SIMSCRIPT II.5 also provided excellent output options, it was decided to build
this part in SIMSCRIPT II.5 as well. The CLINSIM system was to provide about 80 different
types of graphs, time series and tables, and have the capability of choosing between them through
a set of menus.
J. Kuljis User Interfaces and Discrete Event Simulation Models Page 118
Chapter 3: A Case Study
3.4.2 Design and Implementation
For the data entry module we have chosen dBase IV version 1.1. We used this database package
in a novel way - not only to store and maintain data using the database organisation provided, but
to create an interface to the process of data manipulation. The interface builder was a dBase
program generator in the form of visual programming where a programmer can directly
manipulate visual objects on the screen (dBase IV Developer’s Edition, 1990). The pitfall was the
rigid organisation of dBase, with its old-fashioned concepts and memory-hungry programs. The
resulting application consisted of the original generated code plus almost the same amount of
hacked-in code to provide for flexibility and usability of the system. Within the dBase code,
Pascal routines were called to handle non-dBase features. The interface part visible to the user
consists of a series of stacked menus and data-input forms. The major problem is that the program
uses almost all available DOS memory (almost 500K) whilst running, even though its run-time
program takes only about 330K of memory.
We have developed the visual simulation and graphical presentation of simulation results,
together with menus for output selection, using SIMSCRIPT II.5. The environment provides an
excellent visual programming tool for drawing icons, and for creating the graphs. The available
selection of colours is practically unlimited, but once the palette has been chosen it is limited to 16
colours for an application. The simulation results are available after the simulation run through a
series of menus. Each graph or table can be selected in a menu and presented on the screen as
many times as desired and in any order one wishes. This part of the application was again kept
separate from the processing, i.e. simulation. The interaction between dBase and SIMSCRIPT
H.5 is in the form of a text file exported from the dBase files for the specified clinic.
When using two such disparate packages as SIMSCRIPT II.5, which is basically a graphical
program, and dBase IV which appears to use graphical screens that are really text, smooth
integration is impossible. The above two modules of CLINSIM were linked together using
Automenu, which is another text based menu system that allows for the execution of applications
from its menu screens. The variations in colours and text fonts used in the three packages is
obvious and unacceptable to discerning users. Even so, CLINSIM behaves as one application.
J. Kuljis User Interfaces and Discrete Event Simulation Models Page 119
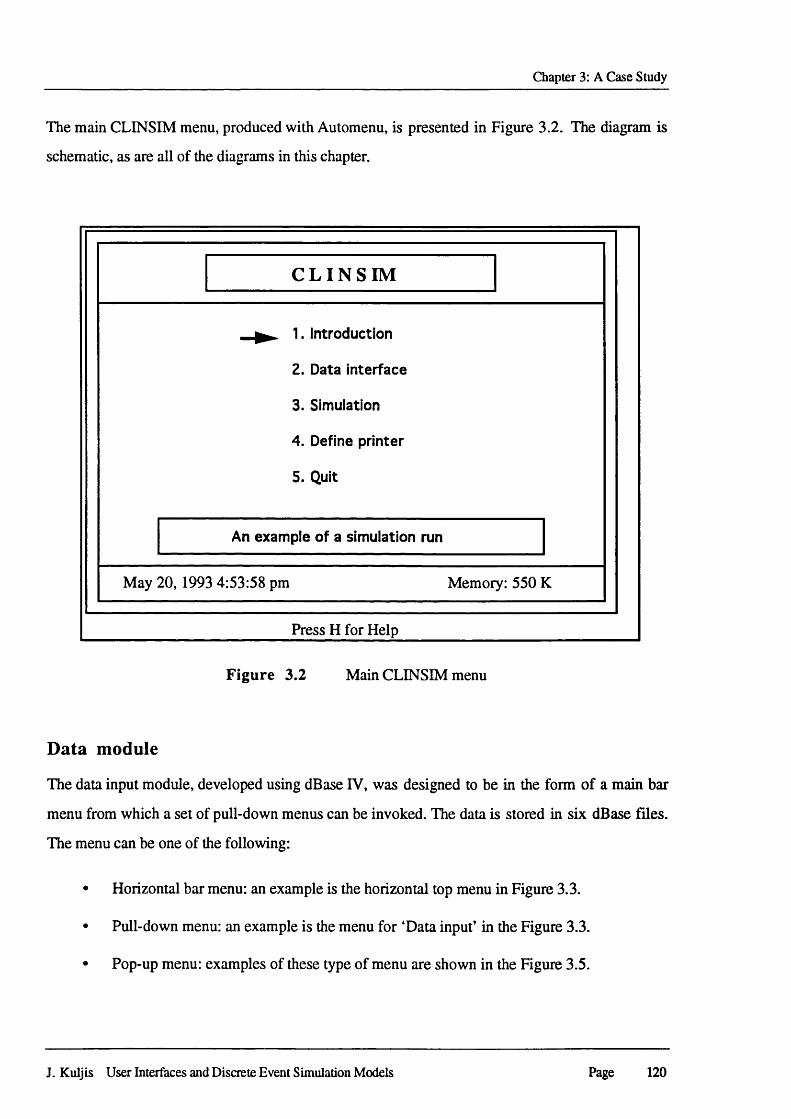
Chapter 3: A Case Study
The main CLINSIM menu, produced with Automenu, is presented in Figure 3.2. The diagram is
schematic, as are all of the diagrams in this chapter.
C L I N S I M
^ 1. Introduction
2. Data interface
3. Simulation
4. Define printer
5. Quit
An example of a simulation run
May 20, 1993 4:53:58 pm Memory: 550 K
___________________________ Press H for Help_______________________________
F ig u re 3.2 Main CLINSIM menu
Data module
The data input module, developed using dBase IV, was designed to be in the form of a main bar
menu from which a set of pull-down menus can be invoked. The data is stored in six dBase files.
The menu can be one of the following:
• Horizontal bar menu: an example is the horizontal top menu in Figure 3.3.
• Pull-down menu: an example is the menu for ‘Data input’ in the Figure 3.3.
• Pop-up menu: examples of these type of menu are shown in the Figure 3.5.
J. Kuljis User Interfaces and Discrete Event Simulation Models Page 120
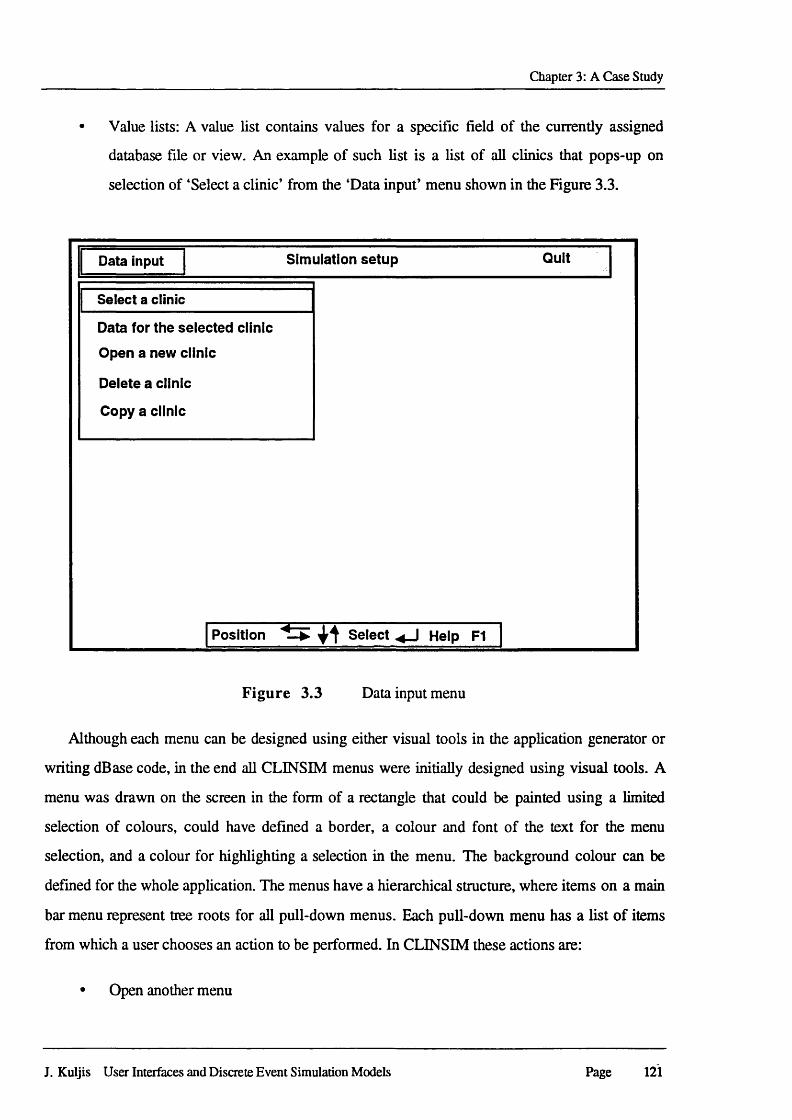
Chapter 3: A Case Study
• Value lists: A value list contains values for a specific field of the currently assigned
database file or view. An example of such list is a list of all clinics that pops-up on
selection of ‘Select a clinic’ from the ‘Data input’ menu shown in the Figure 3.3.
QuitSimulation setup
Select a clinic
Data for the selected clinic
Open a new clinic
Delete a clinic
Copy a clinic
Data input
Position Select Help F1
Figure 3.3 Data input menu
Although each menu can be designed using either visual tools in the application generator or
writing dBase code, in the end all CLINSIM menus were initially designed using visual tools. A
menu was drawn on the screen in the form of a rectangle that could be painted using a limited
selection of colours, could have defined a border, a colour and font of the text for the menu
selection, and a colour for highlighting a selection in the menu. The background colour can be
defined for the whole application. The menus have a hierarchical structure, where items on a main
bar menu represent tree roots for all pull-down menus. Each pull-down menu has a list of items
from which a user chooses an action to be performed. In CLINSIM these actions are:
• Open another menu
J. Kuljis User Interfaces and Discrete Event Simulation Models Page 121
Chapter 3: A Case Study
• Open a data-input form
• Display a pick-up list
• Run a dBase program
• Run a Pascal program
• Produce a report
• Display a report
• Print a report
• Exit from the data input module
As already mentioned, the data input module was created using the Application Generator in Base
IV. The visual tools in the Application Generator support creation of menus and definition of their
attributes (size, colours, borders, menu items and their attributes), and their placement on the
screen. CLINSIM has the following set-up:
• Menus are placed on the blue background
• Each menu is in cyan with a double black border
• Each menu option is in grey unless disabled or is the active one
• All disabled menu options are in black
• The active menu option is highlighted - white text on a red background
Each menu and each item on a menu can have associated actions performed on the selection of a
menu or an action on the menu. On selection of a pull-down menu the following actions can be
performed:
• Change assigned database view
• Attach pull-down menu
• Display messages
On selection of an item in a pull-down menu one of the following actions can be invoked:
J. Kuljis User Interfaces and Discrete Event Simulation Models Page 122
Chapter 3: A Case Study
• Open a menu: This action opens a pre-defined sub-menu of a current one creating a
hierarchical structure of menus. The navigation through the menus is tree traversal
starting at the root. This order can be disturbed by introducing cyclic calls to the menus
higher up in the hierarchy. The CLINSIM system has no such jumps because of
memory problems with the dBase if additional program code was introduced. The other
reason is that it may confuse the user of the system and distract him or her from
providing all the necessary data for a clinic.
• Open a list: This action provides a pick-up list to choose from. For example when a
user chooses the ‘Select a clinic’ option in the ‘Data input’ sub-menu (see Figure 3.3)
the user is presented with a list of all ‘clinics’ defined so far. On selection of one clinic
from the list, that clinic becomes ‘active’ - i.e. it is the current clinic on which the user
can then browse and/or edit. The selection of an item from the list will return the user
back to the menu that invoked that action.
• Open an edit form: This action opens a pre-defined edit data input form. The data can be
either inserted (for a new clinic) or modified (from an existing clinic). After the editing
is done and the form closed (either by saving the changes or abandoning them) the
action returns back to the calling menu.
• Display or print: This action prints or displays information, such as pre-defined reports.
After the action is finished, control goes back to the calling menu.
• Perform file operation: The operations that can be performed are file copy, import a file
into the database, export a file from the database in the pre-defined format. The
exporting of the files is done, for example, when creating an appointment schedule. The
necessary data is exported from the database files in the form of ASCII text file that is
then used by a Pascal program to create an appointment schedule file. That file was then
imported in a database file. After a chosen action is performed, control returns to the
calling menu.
• Run a program: This action runs programs, including dBase or DOS programs, batch
processes etc. CLINSIM uses this type of action to run, for example, the Pascal
program that creates an appointment schedule. After the action is performed the control
returns back to the calling menu.
J. Kuljis User Interfaces and Discrete Event Simulation Models Page 123
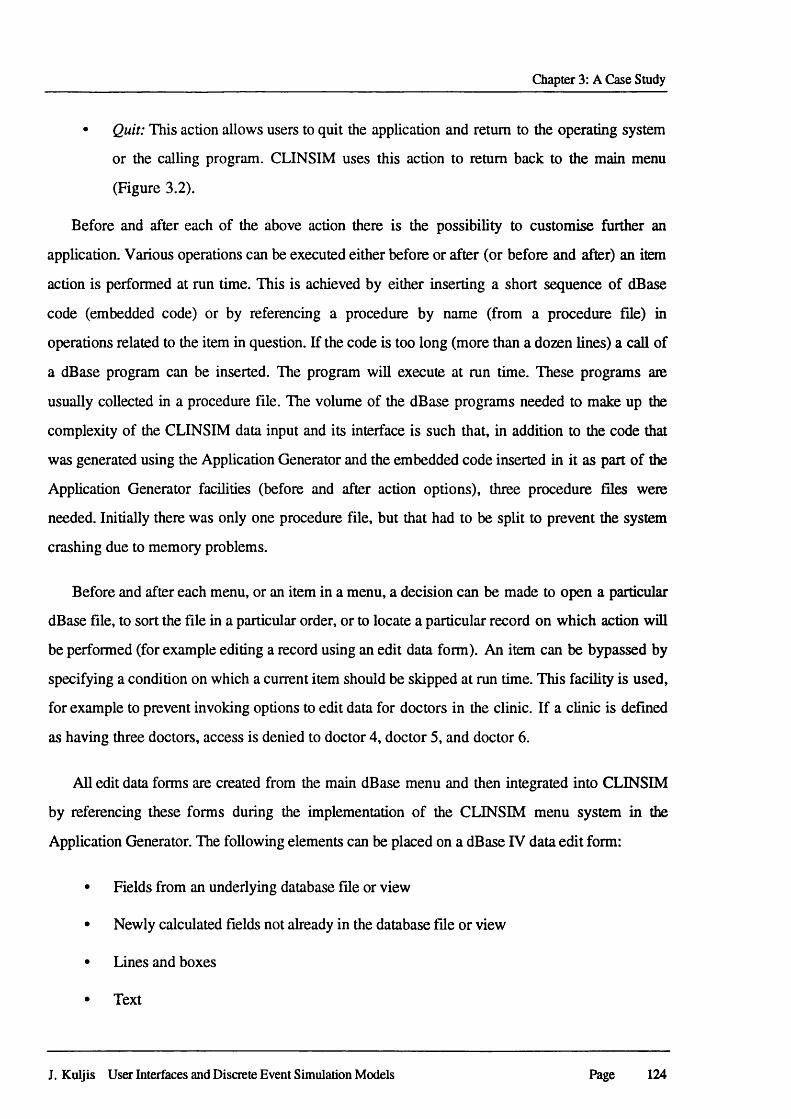
Chapter 3: A Case Study
• Quit: This action allows users to quit the application and return to the operating system
or the calling program. CLINSIM uses this action to return back to the main menu
(Figure 3.2).
Before and after each of the above action there is the possibility to customise further an
application. Various operations can be executed either before or after (or before and after) an item
action is performed at run time. This is achieved by either inserting a short sequence of dBase
code (embedded code) or by referencing a procedure by name (from a procedure file) in
operations related to the item in question. If the code is too long (more than a dozen lines) a call of
a dBase program can be inserted. The program will execute at run time. These programs are
usually collected in a procedure file. The volume of the dBase programs needed to make up the
complexity of the CLINSIM data input and its interface is such that, in addition to the code that
was generated using the Application Generator and the embedded code inserted in it as part of the
Application Generator facilities (before and after action options), three procedure files were
needed. Initially there was only one procedure file, but that had to be split to prevent the system
crashing due to memory problems.
Before and after each menu, or an item in a menu, a decision can be made to open a particular
dBase file, to sort the file in a particular order, or to locate a particular record on which action will
be performed (for example editing a record using an edit data form). An item can be bypassed by
specifying a condition on which a current item should be skipped at run time. This facility is used,
for example to prevent invoking options to edit data for doctors in the clinic. If a clinic is defined
as having three doctors, access is denied to doctor 4, doctor 5, and doctor 6.
All edit data forms are created from the main dBase menu and then integrated into CLINSIM
by referencing these forms during the implementation of the CLINSIM menu system in the
Application Generator. The following elements can be placed on a dBase IV data edit form:
• Fields from an underlying database file or view
• Newly calculated fields not already in the database file or view
• Lines and boxes
• Text
J. Kuljis User Interfaces and Discrete Event Simulation Models Page 124
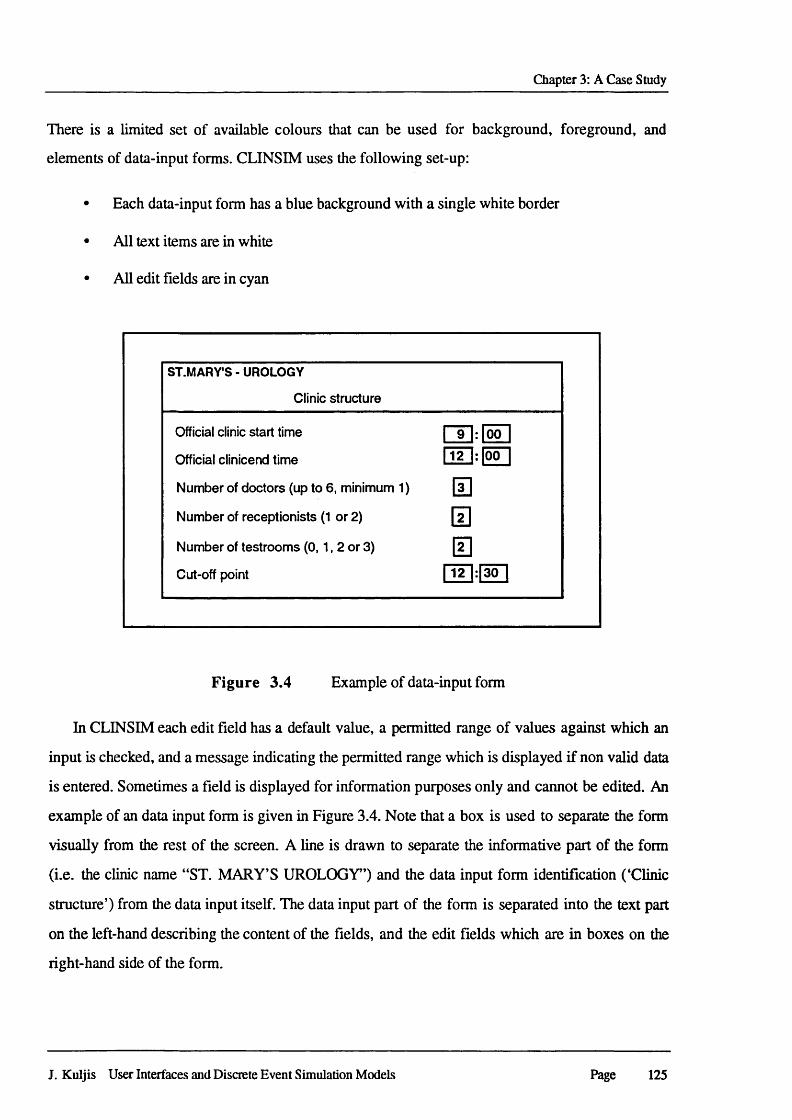
Chapter 3: A Case Study
There is a limited set of available colours that can be used for background, foreground, and
elements of data-input forms. CLINSIM uses the following set-up:
• Each data-input form has a blue background with a single white border
• All text items are in white
• All edit fields are in cyan
ST.MARY'S - UROLOGY
Clinic structure
Official clinic start time I foo~lOfficial clinicend time fT2~|: |00~|
Number of doctors (up to 6, minimum 1) mNumber of receptionists (1 or 2) 0Number of testroom s (0 ,1 , 2 or 3) GOCut-off point n2~l:f30~l
Figure 3.4 Example of data-input form
In CLINSIM each edit field has a default value, a permitted range of values against which an
input is checked, and a message indicating the permitted range which is displayed if non valid data
is entered. Sometimes a field is displayed for information purposes only and cannot be edited. An
example of an data input form is given in Figure 3.4. Note that a box is used to separate the form
visually from the rest of the screen. A line is drawn to separate the informative part of the form
(i.e. the clinic name “ST. MARY’S UROLOGY”) and the data input form identification (‘Clinic
structure’) from the data input itself. The data input part of the form is separated into the text part
on the left-hand describing the content of the fields, and the edit fields which are in boxes on the
right-hand side of the form.
J. Kuljis User Interfaces and Discrete Event Simulation Models Page 125
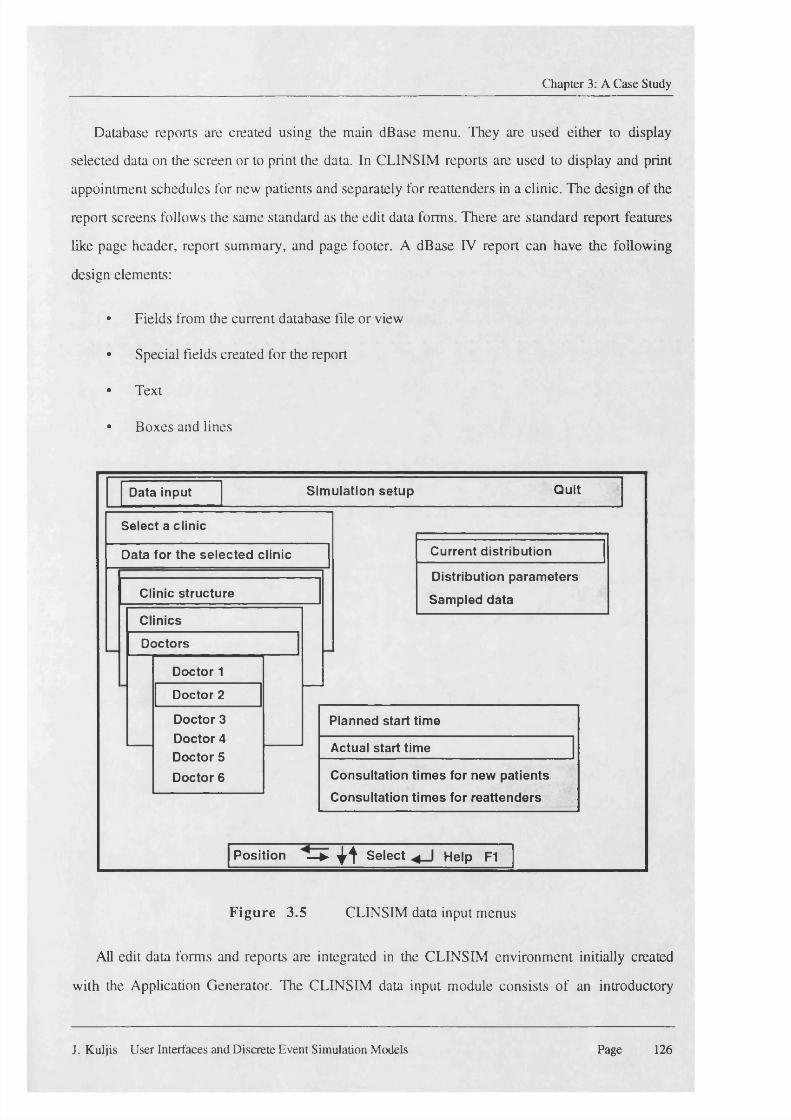
Chapter 3: A Case Study
Database reports are created using the main dBase menu. They are used either to display
selected data on the screen or to print the data. In CLINSIM reports are used to display and print
appointment schedules for new patients and separately for reattenders in a clinic. The design of the
report screens follows the same standard as the edit data forms. There are standard report features
like page header, report summary, and page footer. A dBase IV report can have the following
design elements:
• Fields from the current database file or view
• Special fields created for the report
• Text
• Boxes and lines
Data input Sim ulation se tu p Q uit
Select a clinic
Data for th e s e le c te d clinic
Clinic struc tu re
Clinics
D octors
Doctor 1
Doctor 2
Doctor 3 Doctor 4 D octor 5 D octor 6
C urrent d istribution
D istribution param eters
Sam pled data
Planned start time
Actual start time
C onsultation tim es for new patien ts
C onsultation tim es for rea tten d ers
P osition —► ^ S elect Help F1
Figure 3.5 CLINSIM data input menus
All edit data forms and reports are integrated in the CLINSIM environment initially created
with the Application Generator. The CLINSIM data input module consists of an introductory
J. Kuljis User Interfaces and Discrete Event Simulation Models Page 126
Chapter 3: A Case Study
screen, one bar-menu, 25 pull-down or pop-up menus, 46 data edit forms, 2 reports, 50 dBase
programs (split into three procedure files), and 4 Pascal programs. There are 6 dBase files for
storing clinics data.
ST. MARY’S - UROLOGY
Sampled data: SAMPLE 1
ObservationsCumulativeFrequencies Observations
Cumulativefrequencies
1 -10.00 0 2 -5.00 11
3 0.00 15 4 5.00 22
5 10.00 29 6 15.00 35
7 20.00 43 8 25.00 52
9 30.00 61 10 35.00 67
11 40.00 72 12 45.00 100
13 0.00 0 14 0.00 0
15 0.00 0 16 0.00 0
17 0.00 0 18 0.00 0
19 0.00 0 20 0.00 0
Figure 3.6 Example of Data sample entry screen
The statistical parameters, like for example the ‘Actual start time’ for doctors as in the Figure
3.5, can be one of seven distribution types. A distinction is made if the chosen distribution is
‘Sampled data’. In that case a user can choose an existing file or create a new one. In the case of a
new sample, or modification of an existing one, the user is presented with the edit form like the
one in Figure 3.6.
Simulation module
The visual simulation was developed using SIMSCRIPT II.5 under DOS, a simulation language
based on the Fortran language. This means that the whole simulation experiment must be
programmed. SIMSCRIPT II.5 programs are built and run within the SIMLAB environment.
J. Kuljis User Interfaces and Discrete Event Simulation Models Page 127
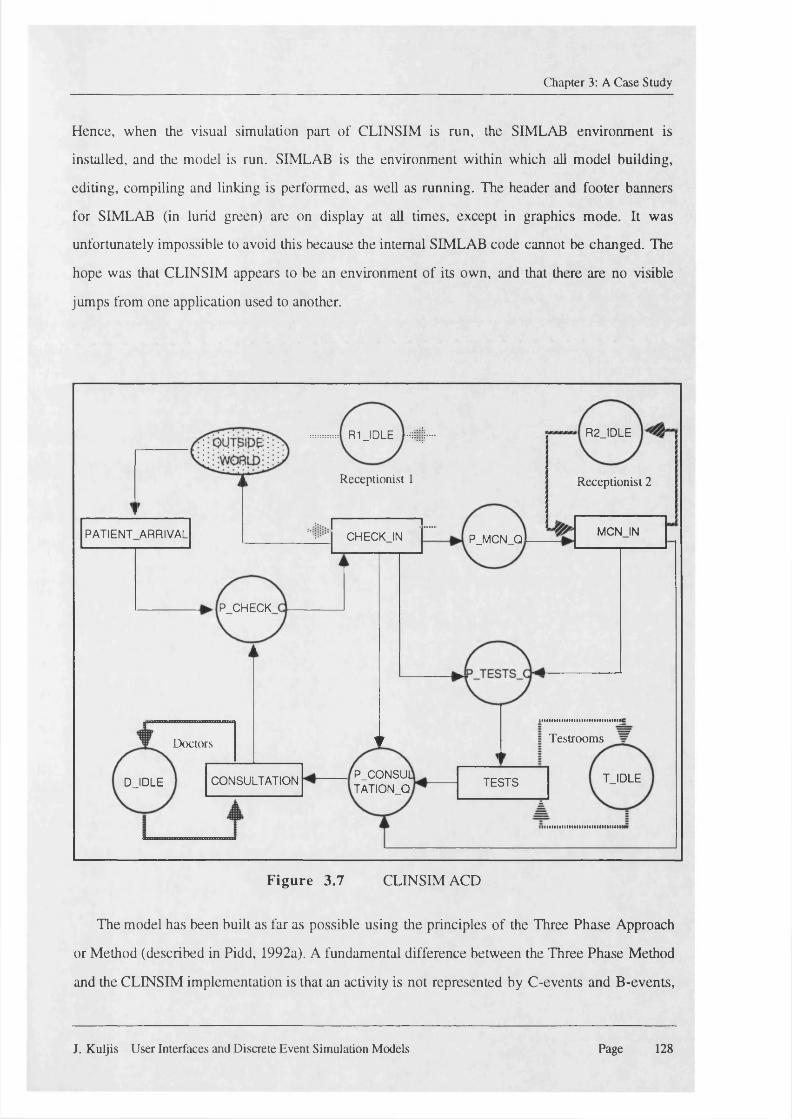
Chapter 3: A Case Study
Hence, when the visual simulation part of CLINSIM is run, the SIMLAB environment is
installed, and the model is run. SIMLAB is the environment within which all model building,
editing, compiling and linking is performed, as well as running. The header and footer banners
for SIMLAB (in lurid green) are on display at all times, except in graphics mode. It was
unfortunately impossible to avoid this because the internal SIMLAB code cannot be changed. The
hope was that CLINSIM appears to be an environment of its own, and that there are no visible
jumps from one application used to another.
R2JDLER1JDLE
Receptionist 1 Receptionist 2
MCNJNPATIENTARRIVAL CHECKJN P_MCN_Q
P CHECK
TestroomsVDoctors
P_CONSULTATION_Q,
TJDLECONSULTATIONDJDLE TESTS
Figure 3.7 CLINSIM ACD
The model has been built as far as possible using the principles of the Three Phase Approach
or Method (described in Pidd, 1992a). A fundamental difference between the Three Phase Method
and the CLINSIM implementation is that an activity is not represented by C-events and B-events,
J. Kuljis User Interfaces and Discrete Event Simulation Models Page 128
Chapter 3: A Case Study
but by C-event condition routines, and by processes. So, for example, the activity CHECK_IN in
the ACD (see Figure 3.7) is represented by the routine CHK.R1_IDLE, which looks to see if the
conditions for starting the activity (i.e. that receptionist 1 and a patient are both in the preceding
queues, waiting to start the activity), and by the process CHECK_IN. The routine
CHK.R1_IDLE, if the conditions are satisfied, activates the process CHECK_IN. The process
then establishes the identity of the activity participants, carries out any necessary housekeeping for
results purposes, and then goes into passive mode whilst the activity is in progress. When the
activity duration has elapsed, the process is reactivated, and the participants are moved on to their
next queues in the ACD.
Hence the ‘process’ in SIMSCRIPT II.5 is used to emulate the active part of the C-event, plus
all of its constituent B-events. Every activity (rectangle) in the ACD has an equivalent process in
the SIMSCRIPT II.5 code, as well as a routine that checks whether the conditions for starting the
activity/process are true.
The interaction between dBase IV and SIMSCRIPT II.5 is in the form of a text file that is
exported from the dBase IV files for a specified clinic. On a request from the main CLINSIM
menu to run the simulation, the SIMLAB environment appears on the screen. From there onwards
that screens disappears and the simulation of the selected clinic starts.
To simulate a particular clinic a clinic is selected from the ‘Data input’ part of CLINSIM. Then
a request is made from the ‘Simulation set-up’ of the ‘Data input’ main menu (see Figure 3.5) to
‘Prepare for simulation’. When such a request is issued all the necessary files are exported from
dBase and then processed by Pascal programs. One Pascal program produces a text file with all
clinic data for the use of the program. Another Pascal program creates patients appointment
schedule files which are used in the program to generate patients at the appropriate times.
Simulation results module
The simulation results are available after the simulation run, through a series of menus. Each
graph or table can be selected in a menu and presented on the screen as many times as desired and
in any order we wish. The presentation of the simulation results was again kept separate from the
processing, i.e. the simulation. Even though the user can view about 80 different outputs in any
J. Kuljis User Interfaces and Discrete Event Simulation Models Page 129
Chapter 3: A Case Study
desired ordered, the user has to make sense of it himself or herself. There is no explanation
facility for the meaning of the results in their particular context. There is also no inter-connectivity
of the various statistics and therefore they cannot be interpreted easily.
Integration
When using two such disparate packages as SIMSCRIPT II.5, which is basically a graphical
program, and dBase IV which appears to use graphical screens that are really text, smooth
integration is impossible. The above two modules of CLINSIM were linked together using
Automenu, which is another text based menu system that allows for the execution of applications
from its menu screens. The variations in colours and text fonts used in the three packages are
discernible. Even so, CLINSIM behaves as one application.
3.5 Conclusions
In this chapter we have described the CLINSIM case study, its motivation, design and
implementation. CLINSIM was built within a number of severe constraints, such as target
machine, cost, free run-time licensing, software availability and constraints, Department of Health
requirements, and limitations of the expertise of the developers. In the next chapters, we critique
the case study from a ‘utopian’ perspective of the world, having examined the practical pragmatic
perspective. This research postulates that such a compromise might lead to better building tools
and hence better modelling interfaces.
J. Kuljis User Interfaces and Discrete Event Simulation Models Page 130
Chapter 4: An Analysis of the Case Study
4.1 Introduction
The case study is an appropriate one to use as it is as representative as any model of the problems
to which simulation is applied. A discrete event simulation is one which employs a next-event
technique to control the behaviour of the model. Many applications of discrete event simulation
involve queuing systems of one kind or another (Pidd, 1992a; Law and Kelton, 1991). The whole
reason for building a simulation model is to carry out some experiments on it. CLINSIM is a
stochastic system (i.e. one whose behaviour cannot be entirely predicted) and requires
implementation that supports a complex experiment in which samples from various distributions
are combined as the model runs. In chapter 3 we have given a detailed description of the case
study. It shows that the problem can be reduced to a typical queuing problem as shown in Figure
3.7.
The model is generic in the sense that any clinic, within the design constraints, can be
specified. The data input part makes the model generic. As real material, the case study is
sufficient to enhance the understanding of general model problems, but is not sufficient to
generalise the findings. In this chapter we shall look at the case study from the user interface
perspective and draw conclusions on strengths and weaknesses of the CLINSIM user interface
with regard to a generic simulation model. In order to make more general conclusions and an
acceptable paradigm about the appropriate user interface characteristics/ features, in the next
chapter the dissertation will expand the examination to include materials and findings from the
literature.
CLINSIM has a custom-made user interface. We will evaluate the usability of the CLINSIM
user interface using the same usability criteria as we have used throughout chapter 2 to evaluate
the usability of several simulation systems. Even when a system is built with no pre-set usability
goals, nevertheless the system’s usability will eventually be evaluated by its users using common
sense. Its success will to a great extent depend on user satisfaction in performing the required task
using the system. CLINSIM was designed and built with no generally agreed usability goals
J. Kuljis: User Interfaces and Discrete Event Simulation Models Page 131
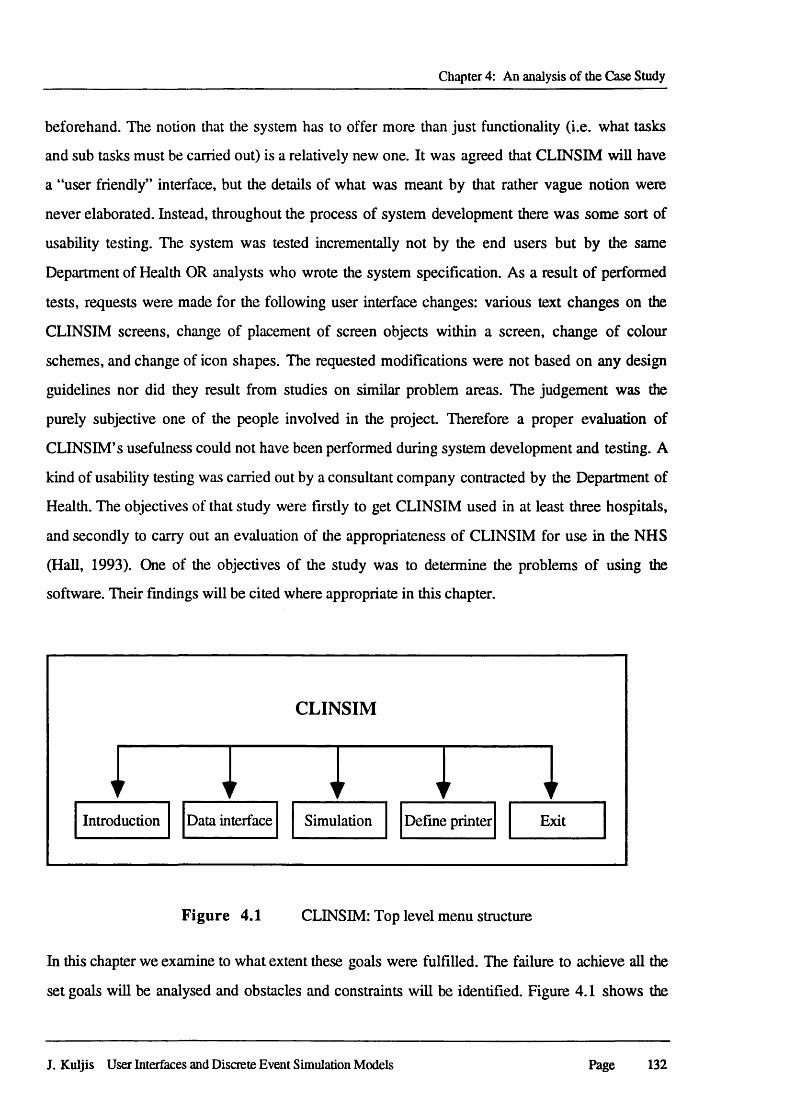
Chapter 4: An analysis of the Case Study
beforehand. The notion that the system has to offer more than just functionality (i.e. what tasks
and sub tasks must be carried out) is a relatively new one. It was agreed that CLINSIM will have
a “user friendly” interface, but the details of what was meant by that rather vague notion were
never elaborated. Instead, throughout the process of system development there was some sort of
usability testing. The system was tested incrementally not by the end users but by the same
Department of Health OR analysts who wrote the system specification. As a result of performed
tests, requests were made for the following user interface changes: various text changes on the
CLINSIM screens, change of placement of screen objects within a screen, change of colour
schemes, and change of icon shapes. The requested modifications were not based on any design
guidelines nor did they result from studies on similar problem areas. The judgement was the
purely subjective one of the people involved in the project. Therefore a proper evaluation of
CLINSIM’s usefulness could not have been performed during system development and testing. A
kind of usability testing was carried out by a consultant company contracted by the Department of
Health. The objectives of that study were firstly to get CLINSIM used in at least three hospitals,
and secondly to carry out an evaluation of the appropriateness of CLINSIM for use in the NHS
(Hall, 1993). One of the objectives of the study was to determine the problems of using the
software. Their findings will be cited where appropriate in this chapter.
CLINSIM
i j j i iIntroduction Data interface Simulation Define printer Exit
F igure 4.1 CLINSIM: Top level menu structure
In this chapter we examine to what extent these goals were fulfilled. The failure to achieve all the
set goals will be analysed and obstacles and constraints will be identified. Figure 4.1 shows the
J. Kuljis User Interfaces and Discrete Event Simulation Models Page 132
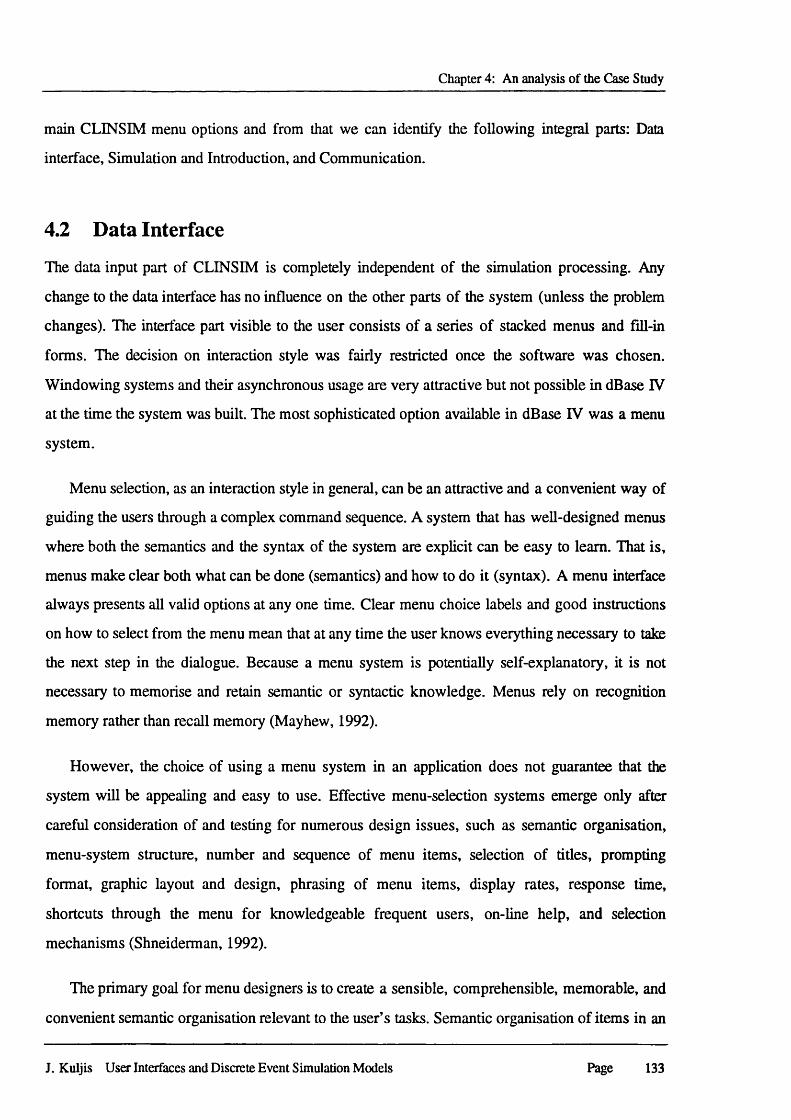
Chapter 4: An analysis of the Case Study
main CLINSIM menu options and from that we can identify the following integral parts: Data
interface, Simulation and Introduction, and Communication.
4.2 Data Interface
The data input part of CLINSIM is completely independent of the simulation processing. Any
change to the data interface has no influence on the other parts of the system (unless the problem
changes). The interface part visible to the user consists of a series of stacked menus and fill-in
forms. The decision on interaction style was fairly restricted once the software was chosen.
Windowing systems and their asynchronous usage are very attractive but not possible in dBase IV
at the time the system was built. The most sophisticated option available in dBase IV was a menu
system.
Menu selection, as an interaction style in general, can be an attractive and a convenient way of
guiding the users through a complex command sequence. A system that has well-designed menus
where both the semantics and the syntax of the system are explicit can be easy to learn. That is,
menus make clear both what can be done (semantics) and how to do it (syntax). A menu interface
always presents all valid options at any one time. Clear menu choice labels and good instructions
on how to select from the menu mean that at any time the user knows everything necessary to take
the next step in the dialogue. Because a menu system is potentially self-explanatory, it is not
necessary to memorise and retain semantic or syntactic knowledge. Menus rely on recognition
memory rather than recall memory (Mayhew, 1992).
However, the choice of using a menu system in an application does not guarantee that the
system will be appealing and easy to use. Effective menu-selection systems emerge only after
careful consideration of and testing for numerous design issues, such as semantic organisation,
menu-system structure, number and sequence of menu items, selection of titles, prompting
format, graphic layout and design, phrasing of menu items, display rates, response time,
shortcuts through the menu for knowledgeable frequent users, on-line help, and selection
mechanisms (Shneiderman, 1992).
The primary goal for menu designers is to create a sensible, comprehensible, memorable, and
convenient semantic organisation relevant to the user’s tasks. Semantic organisation of items in an
J. Kuljis User Interfaces and Discrete Event Simulation Models Page 133
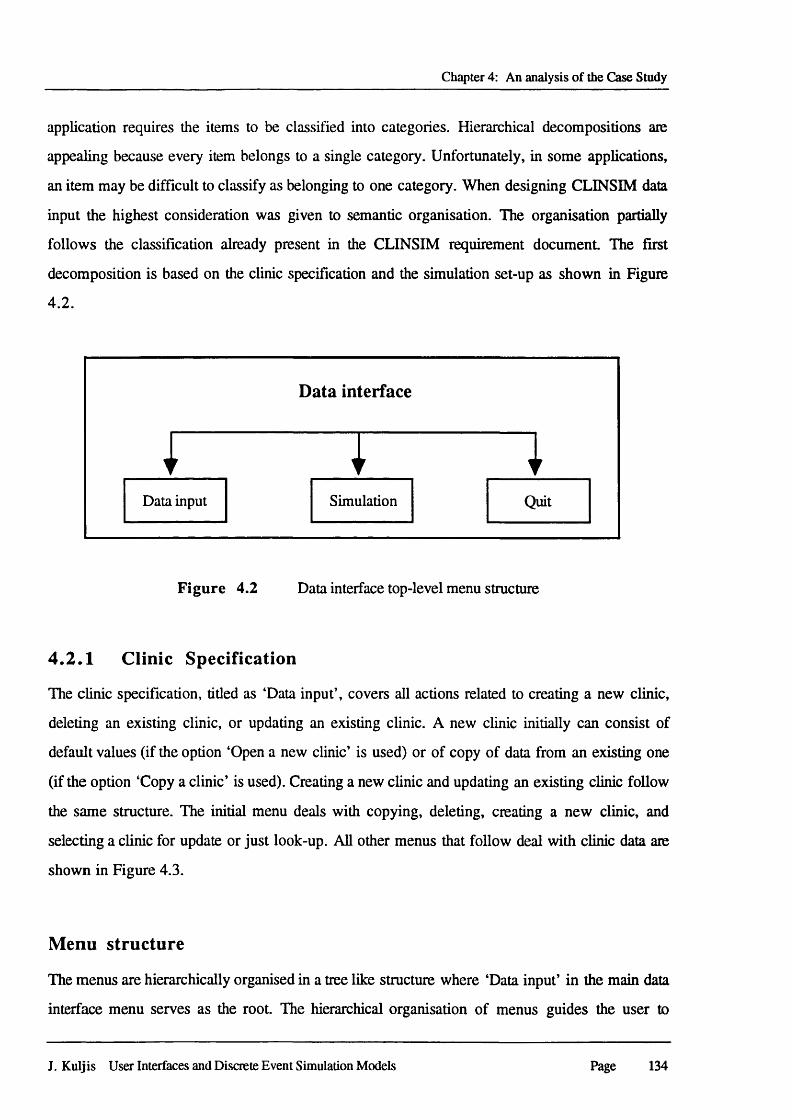
Chapter 4: An analysis of the Case Study
application requires the items to be classified into categories. Hierarchical decompositions arc
appealing because every item belongs to a single category. Unfortunately, in some applications,
an item may be difficult to classify as belonging to one category. When designing CLINSIM data
input the highest consideration was given to semantic organisation. The organisation partially
follows the classification already present in the CLINSIM requirement document. The first
decomposition is based on the clinic specification and the simulation set-up as shown in Figure
4.2.
Data interface
Data input Simulation Quit
F igure 4.2 Data interface top-level menu structure
4.2.1 Clinic Specification
The clinic specification, titled as ‘Data input’, covers all actions related to creating a new clinic,
deleting an existing clinic, or updating an existing clinic. A new clinic initially can consist of
default values (if the option ‘Open a new clinic’ is used) or of copy of data from an existing one
(if the option ‘Copy a clinic’ is used). Creating a new clinic and updating an existing clinic follow
the same structure. The initial menu deals with copying, deleting, creating a new clinic, and
selecting a clinic for update or just look-up. All other menus that follow deal with clinic data are
shown in Figure 4.3.
Menu structure
The menus are hierarchically organised in a tree like structure where ‘Data input’ in the main data
interface menu serves as the root. The hierarchical organisation of menus guides the user to
J. Kuljis User Interfaces and Discrete Event Simulation Models Page 134
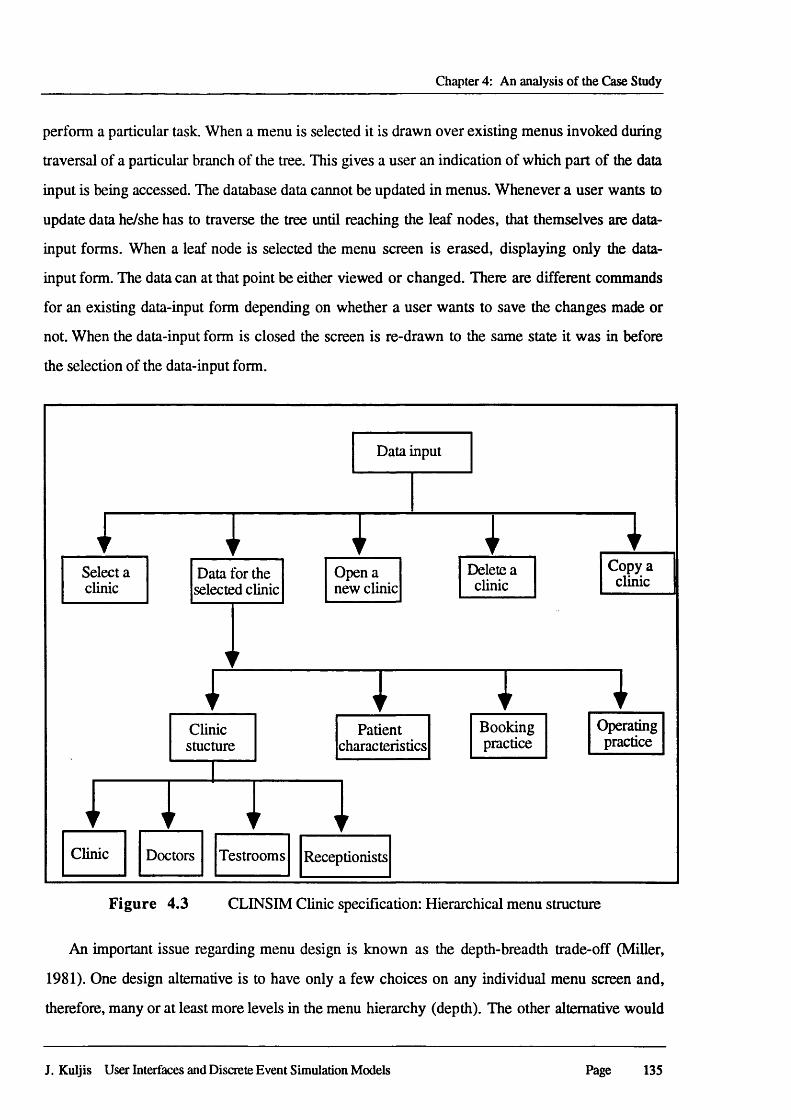
Chapter 4: An analysis of the Case Study
perform a particular task. When a menu is selected it is drawn over existing menus invoked during
traversal of a particular branch of the tree. This gives a user an indication of which part of the data
input is being accessed. The database data cannot be updated in menus. Whenever a user wants to
update data he/she has to traverse the tree until reaching the leaf nodes, that themselves are data-
input forms. When a leaf node is selected the menu screen is erased, displaying only the data-
input form. The data can at that point be either viewed or changed. There are different commands
for an existing data-input form depending on whether a user wants to save the changes made or
not. When the data-input form is closed the screen is re-drawn to the same state it was in before
the selection of the data-input form.
Clinic Doctors Testrooms
Copy a clinic
Delete a clinic
Operatingpractice
Bookingpractice
Open a new clinic
Receptionists
Select a clinic
Clinicstucture
Data for the selected clinic
Patientcharacteristics
Data input
Figure 4.3 CLINSIM Clinic specification: Hierarchical menu structure
An important issue regarding menu design is known as the depth-breadth trade-off (Miller,
1981). One design alternative is to have only a few choices on any individual menu screen and,
therefore, many or at least more levels in the menu hierarchy (depth). The other alternative would
J. Kuljis User Interfaces and Discrete Event Simulation Models Page 135
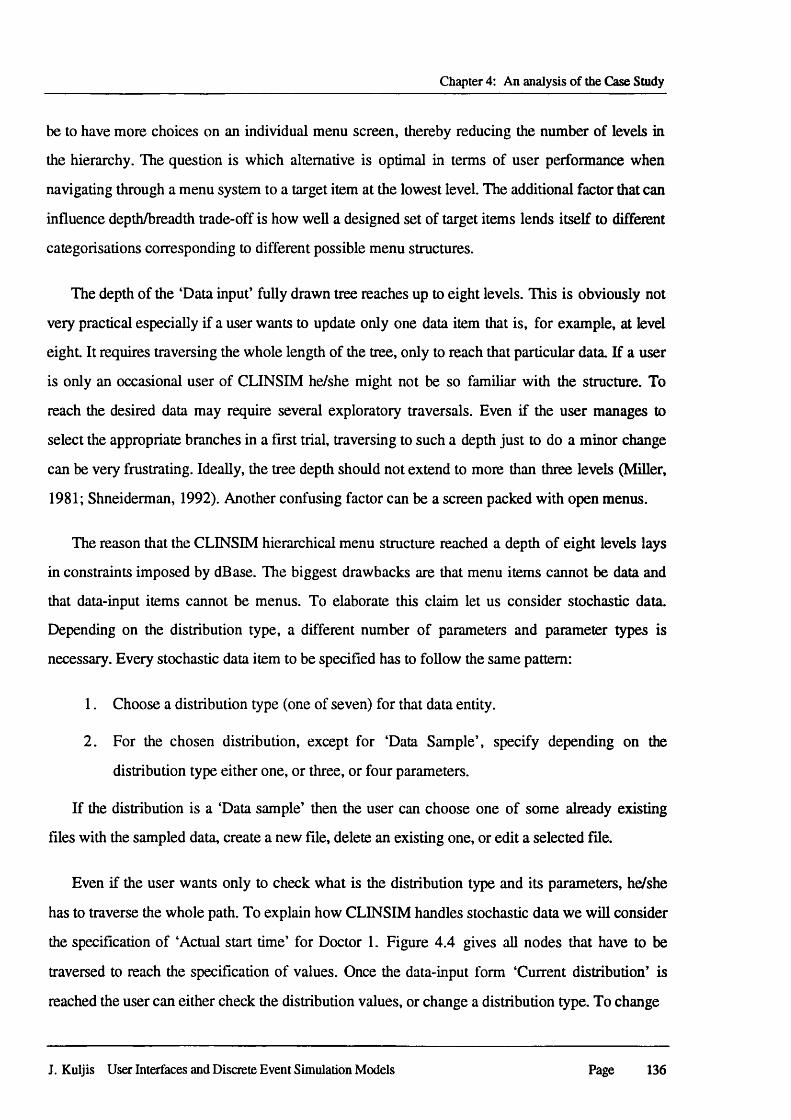
Chapter 4: An analysis of the Case Study
be to have more choices on an individual menu screen, thereby reducing the number of levels in
the hierarchy. The question is which alternative is optimal in terms of user performance when
navigating through a menu system to a target item at the lowest level. The additional factor that can
influence depth/breadth trade-off is how well a designed set of target items lends itself to different
categorisations corresponding to different possible menu structures.
The depth of the ‘Data input’ fully drawn tree reaches up to eight levels. This is obviously not
very practical especially if a user wants to update only one data item that is, for example, at level
eight It requires traversing the whole length of the tree, only to reach that particular data. If a user
is only an occasional user of CLINSIM he/she might not be so familiar with the structure. To
reach the desired data may require several exploratory traversals. Even if the user manages to
select the appropriate branches in a first trial, traversing to such a depth just to do a minor change
can be very frustrating. Ideally, the tree depth should not extend to more than three levels (Miller,
1981; Shneiderman, 1992). Another confusing factor can be a screen packed with open menus.
The reason that the CLINSIM hierarchical menu structure reached a depth of eight levels lays
in constraints imposed by dBase. The biggest drawbacks are that menu items cannot be data and
that data-input items cannot be menus. To elaborate this claim let us consider stochastic data.
Depending on the distribution type, a different number of parameters and parameter types is
necessary. Every stochastic data item to be specified has to follow the same pattern:
1. Choose a distribution type (one of seven) for that data entity.
2. For the chosen distribution, except for ‘Data Sample’, specify depending on the
distribution type either one, or three, or four parameters.
If the distribution is a ‘Data sample’ then the user can choose one of some already existing
files with the sampled data, create a new file, delete an existing one, or edit a selected file.
Even if the user wants only to check what is the distribution type and its parameters, he/she
has to traverse the whole path. To explain how CLINSIM handles stochastic data we will consider
the specification of ‘Actual start time’ for Doctor 1. Figure 4.4 gives all nodes that have to be
traversed to reach the specification of values. Once the data-input form ‘Current distribution’ is
reached the user can either check the distribution values, or change a distribution type. To change
J. Kuljis User Interfaces and Discrete Event Simulation Models Page 136
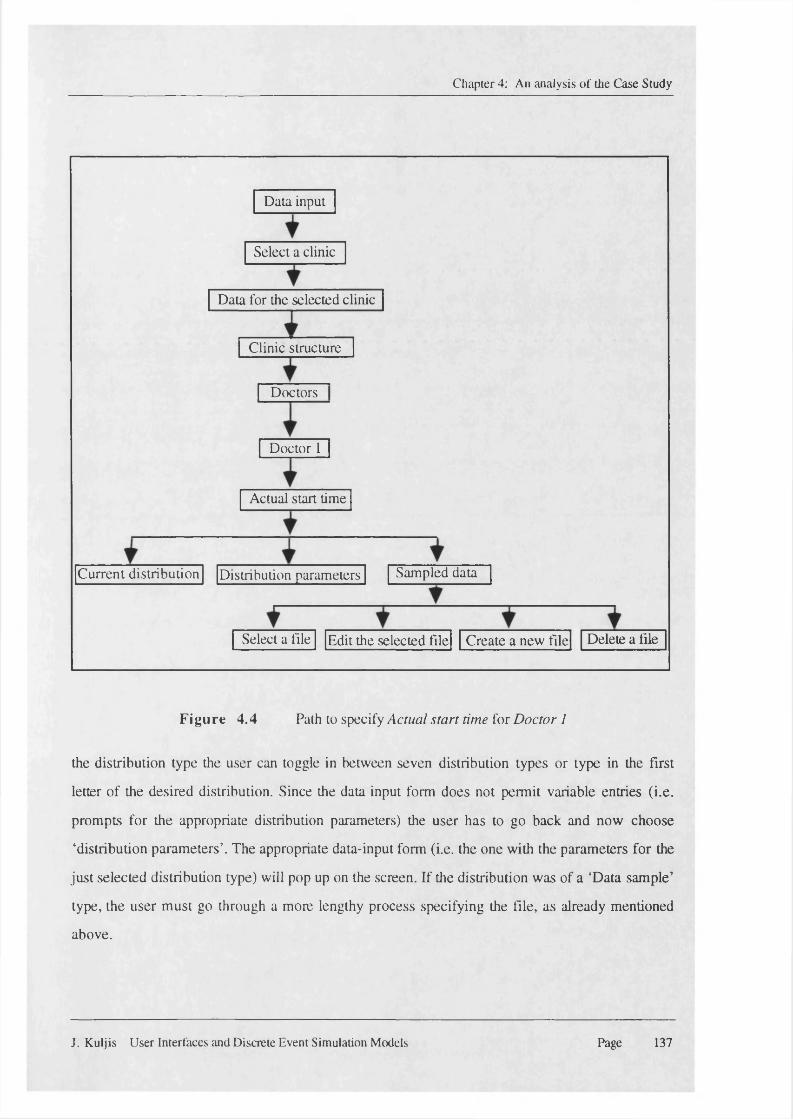
Chapter 4: An analysis of the Case Study
Doctors
Doctor 1
Select a file Delete a file
Data input
Sampled data
Create a new file
Select a clinic
Clinic structure
Actual start time
Current distribution
Edit the selected file
Distribution parameters
Data for the selected clinic
Figure 4.4 Path to specify Actual start time for Doctor 1
the distribution type the user can toggle in between seven distribution types or type in the first
letter of the desired distribution. Since the data input form does not permit variable entries (i.e.
prompts for the appropriate distribution parameters) the user has to go back and now choose
‘distribution parameters’. The appropriate data-input form (i.e. the one with the parameters for the
just selected distribution type) will pop up on the screen. If the distribution was of a ‘Data sample’
type, the user must go through a more lengthy process specifying the file, as already mentioned
above.
J. Kuljis User Interfaces and Discrete Event Simulation Models Page 137
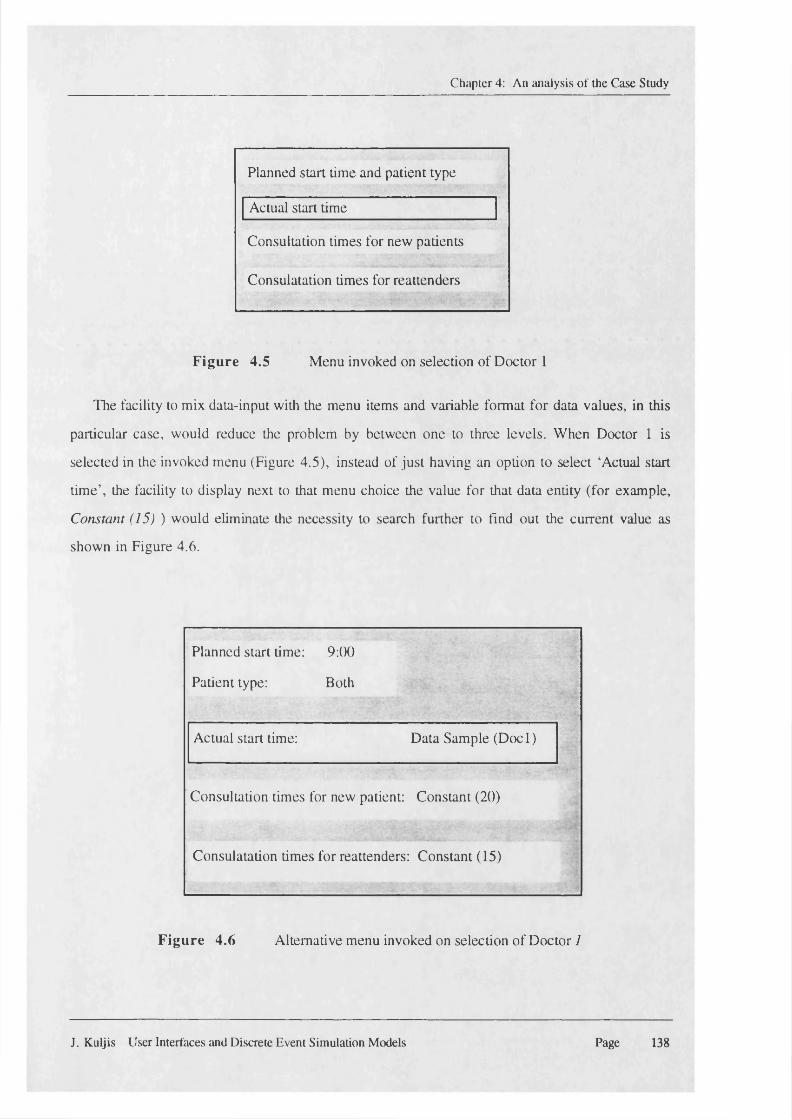
Chapter 4: An analysis of the Case Study
Planned start time and patient type
Actual start time
Consultation times for new patients
Consulatation times for reattenders
Figure 4.5 Menu invoked on selection of Doctor 1
The facility to mix data-input with the menu items and variable format for data values, in this
particular case, would reduce the problem by between one to three levels. When Doctor 1 is
selected in the invoked menu (Figure 4.5), instead of just having an option to select ‘Actual start
time’, the facility to display next to that menu choice the value for that data entity (for example,
Constant (15) ) would eliminate the necessity to search further to find out the current value as
shown in Figure 4.6.
Planned start time: 9:00
Patient type: Both
Actual start time: Data Sample (Docl)
Consultation times for new patient: Constant (20)
.Consulatation times for reattenders: Constant (15)
Figure 4.6 Alternative menu invoked on selection of Doctor 1
J. Kuljis User Interfaces and Discrete Event Simulation Models Page 138
Chapter 4: An analysis of the Case Study
If the user wants to change the values the following alternatives can reduce the tree depth.
Firstly, the facility to change the distribution type from Constant to Normal by allowing the user
to toggle for different distribution types in the menu that displays it until the desired one is
reached. After a new distribution type is selected the pop-up menu or fill-in form can be invoked
prompting the input of appropriate parameters for the chosen distribution. Secondly, the selection
of ‘Actual start time’ could invoke a data-input form that would allow both the specification of
distribution type, and depending on the new distribution type, handle the specification of the
appropriate distribution parameters. The same principles can be applied throughout the data input
interface reducing the menu tree depth to a manageable number. Unfortunately, mixing menus and
data input is not supported by dBase IV and thus the depth of the menu tree could not be reduced
if the semantic organisation of items was to be preserved.
Choice ordering
Once a menu hierarchy or structure has been decided on and the choice items that will actually
appear on each menu screen have been determined, then one is faced with the question of how to
order those items. The ordering can be based on: some common conventional order, expected
frequency of use, expected sequence of use, semantic categories, and alphabetical order. If no
other ordering scheme lends itself well to the menu choices, then alphabetic is better than arbitrary
ordering. In CLINSIM the choice ordering is not consistent. It is generally dependent on the
semantic categories. Often the specification of parameters that are dependent on some other data
would be meaningless prior to the definition of that data. For example the choice ‘Patient
characteristics’ appears in a menu before the choice ‘Booking practice’. The reason for that is that
selection of ‘Patient characteristics’ leads to a data-input form in which the specification of values
for patient types, characteristics of each patient type, etc. are carried out. These values should be
defined prior to the ‘Booking practice’ choice, which leads to specification of criteria for creating
appointment schedules for each patient type in a clinic. Where the data is independent of the other
input the menu choices are listed alphabetically.
Choice selection
Generally there can be a variety of selection mechanisms available, like single letter or number
selection codes, cursor control keys, or a pointing device pointing directly at the screen. The Data
J. Kuljis User Interfaces and Discrete Event Simulation Models Page 139
Chapter 4: An analysis of the Case Study
Input part of CLINSIM is constrained by dBase IV, and thus uses cursor control keys for
selection. In the later version 2.0 of dBase IV (Borland, 1993) mouse pointing is made available.
A menu without a pointing device selection mechanism should come up with a default selection to
save keystrokes according to most of the design guidelines (Shneiderman, 1992; Mayhew, 1992).
Defaults might be the last item selected from the menu or the most frequently used item, if these
are appropriate. Since in CLINSIM no logical default can be determined, the first choice in the list
is set to be the default.
All menus present mutually exclusive choices, and the user can only select one at a time.
Visual feedback is provided indicating which options are selectable, which option the cursor is
currently pointing to, and which options are currently selected. In CLINSIM these are achieved
using different colours for background and for the text of menu items depending on their status. If
an item is selectable its text is grey on a normal menu colour background (cyan). If an item is not
selectable, that is if it is disabled, its text will appear as black on a normal menu background. In
the case of an attempt to point to an unselectable item, the cursor key will skip the item and will
point to the next selectable option if available, otherwise it will remain at the last selectable item. If
an item is selected then it will be highlighted, changing the background colour of the selected item
to red with the text of the menu item changing to white.
Menu invocation
In most menu systems, the user is always presented with a menu at the appropriate time, or the
top-level menu is permanently visible in some reserved area of the screen. In the ‘permanent’
menu system, the top-level menu is permanently displayed across the top of the screen. The
second-level pull-down menu only appears when a selection from the top-level menu is made. In
the CLINSIM data interface the top-level menu is always displayed on the top of the screen. It
disappears only if and when a data-input form is invoked but is re-drawn again after the data-input
form is closed. The second level is a pull-down menu that appears after selection from the top-
level menu is made. All consequent menus are pull-down menus that appear on selection from a
menu one level above. In CLINSIM all open menus in the menu hierarchy are displayed on the
screen and each of the open menus keeps the selected item highlighted. CLINSIM has no facility
for user-invoked menus, where the normal state of affairs is the display screen with no menus
J. Kuljis User Interfaces and Discrete Event Simulation Models Page 140
Chapter 4: An analysis of the Case Study
visible, and where the user must press a key on the keyboard or alternative input device to bring
up the top-level menu that is appropriate given the current state of the dialogue. Given that menus
are intended to support novice and casual users in the first place, it should be kept in mind that
user-invoked menus detract from the potential benefit of menus of making semantics and syntax
obvious in the interface. Thus it is recommended that user-invoked menus should be used only
when screen space is at a premium and when most users can be expected to use the system fairly
frequently.
Navigation
Navigating through a menu system can be facilitated by a number of design considerations,
including good screen layout and design, the presence of context information to remind the users
where they are, menu bypass, and an efficient selection mechanism. Generally, it is a good idea to
design and document a set of screen design standards, guidelines, and conventions and then apply
them to all screens for a given system. The CLINSIM data interface applies a uniform design
standards to all menus. These standards include menu choice selection, menu invocation, and
colour schemes. Within-application consistency is always important because it will facilitate
learning and also result in an easier to use system. When menu systems are very deep and
complex, novice and casual users can easily get lost and have difficulty remembering how to get
somewhere from their current location, or what they have and have not already done. One way to
assist users in navigating complex menu systems is to provide plenty of context information on
each screen, including clear titles and reminders of choices made in previous menus. High-
frequency, expert users will become frustrated by tedious navigation through complex menu
hierarchies. Even though it is desirable to provide a menu bypass for these users, CLINSIM does
not offer this facility due to the restrictions on memory in dBase IV.
Data input forms
As already mentioned, the CLINSIM data interface consists of menus and data input forms. Menu
selection is effective for choosing an item from a list, but some tasks are cumbersome with menus
and also impossible to implement in dBase IV. All leaf nodes in the CLINSIM menu tree on
selection will invoke a data input form. In general, when many fields of data are necessary the
J. Kuljis User Interfaces and Discrete Event Simulation Models Page 141
Chapter 4: An analysis of the Case Study
appropriate interaction style might be a fill-in form (or data input form, or data entry form). Fill-in
fields can be particularly effective when input is required from the user that may take on any of a
large number of values. The form fill-in approach is attractive because the full complement of
information is visible, giving the user the feeling of being in control of the dialogue
(Shneiderman, 1992). Few instructions are necessary, since this approach resembles familiar
paper forms. Because there are usually several or many fill-in fields on a single screen, users can
get broader context information than they would on a menu, or question and answer interface.
CLINSIM data input forms usually have a small number of fields that generally would not justify
this approach and they would not exploit the possible advantages of context information. Again,
the restriction on the number of fields is a consequence of constraints imposed by the chosen
software. dBase IV allows any data input form length (even using more than one screen) and in
theory the system could make do with a substantially fewer number of input forms. But in practice
many data fields have mutually dependent values. If the data fields are part of the same data input
form, then the entered values are not acknowledged until the form is closed and the data saved. It
means that during the data entry process on an entry form, the checks for values of its fields
cannot be performed.
As compared with a menu system, fill-in forms make efficient use of space on the screen.
Well-designed fill-in forms make a system relatively easy to learn because they make both the
semantics and syntax of the system explicit. For the same reason, fill-in forms are also easy to
remember. Fill-in forms rely mostly on recognition memory rather than recall memory.
Recognition memory is faster and more accurate than recall memory, and fill-in forms exploit that
fact (Mayhew, 1992).
There are serious trade-offs, however. Although good labels (captions) and simple brief
prompts help users to know what type of input is required and how to format it, for many fields
users may not know what the valid inputs are. To make up for this disadvantage, an on-line help
system can, and often should, provide menus of valid input options. Most fill-in forms make it
difficult to fill in fields in any order other than the order in which the fields appear. The other
disadvantage can be the need for typing skill. Users with low typing skill, low computer literacy,
and/or low semantic knowledge of the problem domain will be slowed down on a fill-in form
interface relative to a menu or question and answer interface. Because fill-in forms are a relatively
J. Kuljis User Interfaces and Discrete Event Simulation Models Page 142
Chapter 4: An analysis of the Case Study
rigid, structured dialogue style, they are best suited to tasks that are themselves highly structured,
that is, tasks in which a set sequence of steps is always or usually followed (Mayhew, 1992).
There is not a great deal of empirical work on form fill-in, but a number of design guidelines have
emerged from practitioners. Many companies offer form fill-in creation tools, one of which was
Ashton Tate’s dBase IV. Software tools simplify design, help to ensure consistency, ease
maintenance, and speed implementation.
Organisation and layout
It is always important to consider the way a user will be using an on-line fill-in form. The form
should be designed and organised to support the task. Semantically related items should be
organised into groups by sequence of use, by frequency of use, by common patterns, and/or by
relative importance. According to Tullis (1988) the search time to find a single data item on a
computer screen is affected by the number of groups and their size, so they should be kept to a
minimum. Many authors (Tullis, 1988; Shneiderman, 1992; Mayhew, 1992) agree that the logical
groups should be separated by spaces, colour, or other visual cues. In the CLINSIM data
interface all data input forms are designed using a limited number of visual cues. The number of
items on any form is relatively small and the number of logical groups never exceeds three. The
distinction between logical groups is achieved with spacing and horizontal lines.
Labels and fie ld design
There are several design guidelines concerning labels and fields of input forms. To start with a
form should have a meaningful title that identifies the topic. Each CLINSIM data input form has a
title that indicates which clinic is being edited and a reminder as to which logical part of the system
the form refers. Other design guidelines are about placement, alignment, and visual appearance of
labels and data fields. Usually labels are left justified unless they vary too much in length, when
they may be right justified. Alphanumeric fields should be left justified and numeric fields right
justified with decimal alignment when appropriate. Leading zeros should be avoided. Labels and
fields should not be too far apart. Labels and fields should be distinguished using a visual cue.
Labels should be brief, familiar, and distinctive. The number of character spaces available in a
field should be somehow indicated. Disabled fields should be made apparent and distinctive. Most
of these guidelines are followed in CLINSIM. Labels are always placed on the left hand side and
J. Kuljis User Interfaces and Discrete Event Simulation Models Page 143
Chapter 4: An analysis of the Case Study
value fields on the right hand size. Labels are left justified and the fields are mostly vertically
aligned (unless the labels are exceptionally long) and placed on the right hand side in the same line
with the corresponding label. The background colour of the form is blue, the text of the labels is
white on the form background. All data value fields are black on a cyan background. The cyan
background indicates the maximal length of fields. If a field is disabled it is displayed in the same
colours as the labels (white on a blue background).
Format
When use is casual, users are inexperienced, the number of valid inputs is large, and/or inputs are
difficult to spell or remember, the provision of pop-up or pull-down menus within fields can be a
convenient way to present entry options. The CLINSIM alternative to the presentation of valid
data inputs is in the form of a toggle field where a user pressing the space bar can have a view of
all possible inputs. It is recommended that complex rules for entering data in the various fields of
a form should be avoided (for example, entry in some fields depends on values entered in other
fields). This is not possible in dBase input forms anyway even though, as mentioned in the
pervious section, this sort of facility would reduce the menu depth and the necessity for numerous
short data input forms. Long input formats should be broken up into meaningful and commonly
used groupings (for example, telephone numbers split into area code and the number). This
recommendation is generally followed. Whenever there is a most likely or most commonly entered
value for an input field, this value should be used to prefill the field as the default. Every newly
created clinic in CLINSIM has default values prefilled where appropriate and where such values
would not misguide the user. The input data should be short if possible. Abbreviated input can be
used when it can be unambiguously interpreted. Frequent shifts between upper and lower case
characters should be avoided, and when possible, the system should not be case sensitive. Very
often CLINSIM has field values presented to the user in terms that are understandable for the
specific task and not their internal representation. Also data input is not case sensitive since all
alphanumeric fields have conversion to upper case.
Prompts and instructions
The users, especially non frequent ones, benefit from unambiguous prompts instructing them and
reminding them of the proper input syntax and, when appropriate and possible, of ranges of
J. Kuljis User Interfaces and Discrete Event Simulation Models Page 144
Chapter 4: An analysis of the Case Study
possible values. CLINSIM offers a prompt for valid input only if the user inputs a value out of
range. Some fields have an explanation as to what the input should be. It is desirable that every
fill-in form includes a minimal set of general instructions on how to navigate between fields,
cancel out of the screen, and accept the filled in screen. In CLINSIM these instructions are given
for some types of input fields. There is no consistency of such prompts and instructions for the
solely pragmatic reason of restriction of memory available (dBase IV version 1.1 could use only
the memory remaining from 640K after DOS is loaded). All graphics are very heavy on memory.
For the same reason HELP is not provided even though it is possible.
N avigation
Mechanisms must be designed on fill-in forms to allow users to move from field to field, to accept
a filled screen, to cancel a screen, and to move forward and backward between screens.
CLINSIM provides for accepting a filled screen and cancelling a screen but not for moving
backwards between screens. This deficiency is not a serious one since there are only two data
entry forms that consist of more than one screen. When a form is first entered, the cursor is
positioned in the most likely default position - the first field on a form. The field groups are
arranged consistently with default cursor movement that is vertical from top down. When cursor
movement by fields can be programmed by default to movement up and down, it is preferable to
do so and to arrange groups accordingly, as there is some evidence that vertical groups are easier
to search than horizontal groups (Tullis, 1988).
Three aspects of group orientation must be consistent: the default direction of cursor
movement (left and right or up and down), the logical order of fields within groups (left and right
or up and down), and the spatial arrangement of groups (as rows or columns). Any inconsistency
among these factors will confuse users and slow them down. In keyboard-driven fill-in forms,
users should be allowed to move the cursor forward and backward within each field by character
to facilitate editing. Users should also be able to move both forward and backward by fields.
CLINSIM allows such cursor movement either using TAB key, arrow keys, or ENTER key. No
keys on the keyboard should move the cursor into non editable areas. In the CLINSIM data entry
forms in the case of non editable fields, the cursor is automatically placed on the first editable field
when the form is opened, or on attempt to move the cursor to that field skips the field, or if it was
J. Kuljis User Interfaces and Discrete Event Simulation Models Page 145
Chapter 4: An analysis of the Case Study
the last field on a form, the form closes. Entering a value in the last field in a form will not close
the form (auto tab). The form will be closed correctly using either keys for saving or cancelling
the input, and wrongly (since it is constant source of possible mistakes) using any of the possible
navigation keys beyond the last field.
Error handling
When users make simple typing errors, they are able to edit character by character, rather than
having to erase and retype the entire field. The system should provide semantic and syntactic
information in error messages depending on user knowledge. CLINSIM has no semantic nor
syntactic information about error messages which are generated by dBase. If fields are unrelated
to one another, that is, if correct input to one does not depend on the input in another, then the
user should control when error checking will occur. CLINSIM has no facility for such error
checking. The recurring problem in CLINSIM is the limited inter-connectivity of the data, and a
lack of information to the user of what the consequences to the validity of the system are of
entering or changing the data (Hall, 1993). Data validation is limited to validation of a single input
against a permitted range of values. There is no provision for validation of the overall consistency
of the data and the logic of the system. All these features could have been supported but at a
considerable cost. The development time and the memory needed for such additions to the system
were not available.
4.2.2 Simulation Set-up
In the CLINSIM data interface, the ‘Simulation set-up’ menu item leads to defining the parameters
directly related to the simulation of a clinic. It consists of pull-down menus, data input forms,
reports, and in the background the running of non-dBase programs. The menus and the forms
follow the same design standards as do the other parts of the CLINSIM data interface. Reports are
generated on request from files created by Pascal programs that run prior to the creation of the
reports. Once created, a report can be either displayed or printed. A displayed report has a similar
appearance to a data input form. The report text is displayed in white on a blue background. Since
a report can be longer than one screen, the user can view it screen by screen by pressing the
SPACE bar.
J. Kuljis User Interfaces and Discrete Event Simulation Models Page 146
Chapter 4: An analysis of the Case Study
4.3 Simulation
The simulation part of CLINSIM consists of a visual simulation, if the request in the data input
was for a single run, and of the presentation of the simulation results. The visual simulation
graphics display is in ‘bit-mapped’ graphics and the simulation results part is a combination of a
“character'’ graphic menu system and textual screens, and ‘bit-mapped’ graphs. The simulation
starts by displaying a standard SIMLAB screen, thus revealing the application software used. This
particularly ugly sudden change of screen colours from some relatively pleasing colours to a black
background with white text and bright green borders cannot be avoided due to the SIMLAB
internal structure. This display remains for some time on the screen while the simulation program
loads all files necessary to run the visual simulation or to perform multiple simulation runs.
Similarly, whenever a ‘textual screen’ is displayed, the identification of the SIMLAB environment
is displayed at the top and the bottom of the screen. These are the only situations in the whole
CLINSIM system that the disclosure of the software used occurs. After the files are processed
there are two possible scenarios. In the case of a single simulation run, the graphical
representation of the model is drawn on the screen and the visual simulation starts. After the visual
simulation has finished, the user can activate a menu with simulation results to appear. In the case
of a multiple run the visual simulation of a clinic is omitted. The simulation processing is
performed in a ‘silent’ mode, collecting the statistics into files to be used for presenting simulation
results. Immediately after the processing has finished a menu with simulation results will appear
offering a variety of simulation results.
4.3.1 Visual Simulation
The design of the visual interface to computer systems has perhaps received more attention in
human-computer interaction guidelines than any other aspect of the interface. While there have
been quite a few relevant studies, many screen design issues remain to be addressed empirically,
especially those related to visual interfaces with bit-mapped graphics. Tullis (1988) gives a set of
guidelines that emerged from his study of numerous sources on design guidelines and empirical
evidence. All studies suggest that human performance tends to deteriorate with increasing display
density. The optimum amount of information to present is to include only information essential to
decision making and to include all information essential to decision making. Knowing how much
J. Kuljis User Interfaces and Discrete Event Simulation Models Page 147
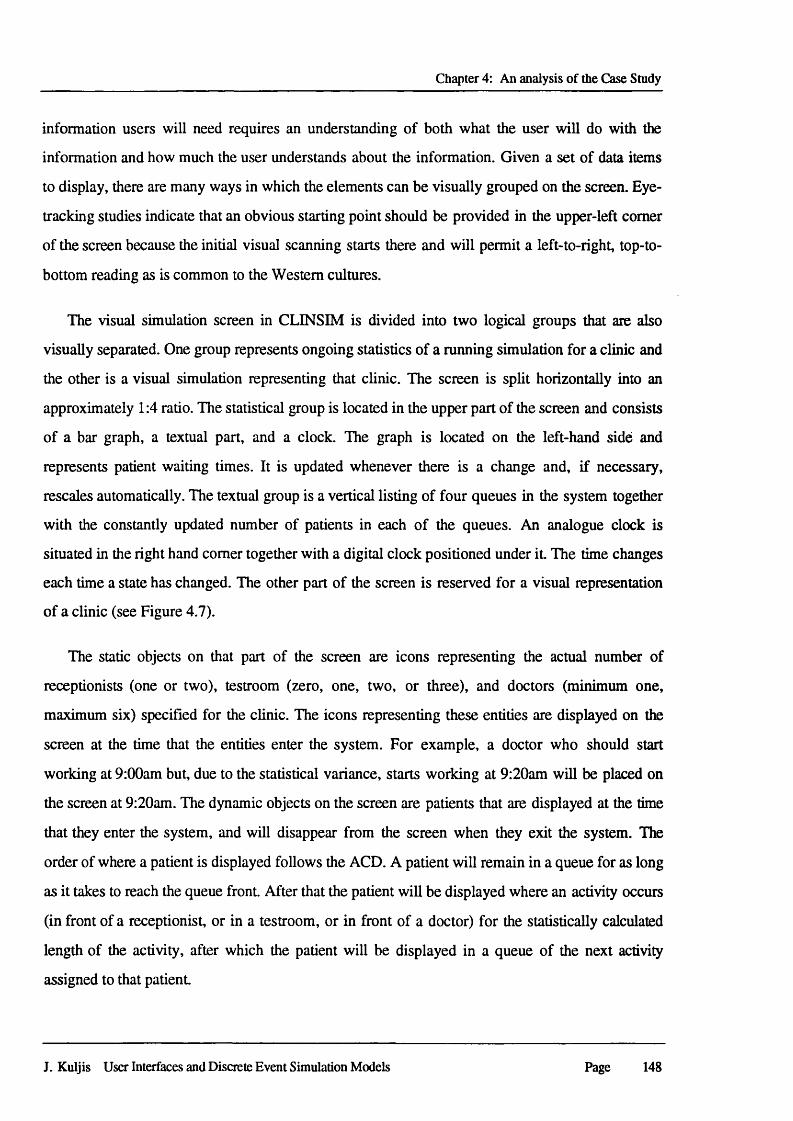
Chapter 4: An analysis of the Case Study
information users will need requires an understanding of both what the user will do with the
information and how much the user understands about the information. Given a set of data items
to display, there are many ways in which the elements can be visually grouped on the screen. Eye-
tracking studies indicate that an obvious starting point should be provided in the upper-left comer
of the screen because the initial visual scanning starts there and will permit a left-to-right, top-to-
bottom reading as is common to the Western cultures.
The visual simulation screen in CLINSIM is divided into two logical groups that are also
visually separated. One group represents ongoing statistics of a running simulation for a clinic and
the other is a visual simulation representing that clinic. The screen is split horizontally into an
approximately 1:4 ratio. The statistical group is located in the upper part of the screen and consists
of a bar graph, a textual part, and a clock. The graph is located on the left-hand side and
represents patient waiting times. It is updated whenever there is a change and, if necessary,
rescales automatically. The textual group is a vertical listing of four queues in the system together
with the constantly updated number of patients in each of the queues. An analogue clock is
situated in the right hand comer together with a digital clock positioned under it. The time changes
each time a state has changed. The other part of the screen is reserved for a visual representation
of a clinic (see Figure 4.7).
The static objects on that part of the screen are icons representing the actual number of
receptionists (one or two), testroom (zero, one, two, or three), and doctors (minimum one,
maximum six) specified for the clinic. The icons representing these entities are displayed on the
screen at the time that the entities enter the system. For example, a doctor who should start
working at 9:00am but, due to the statistical variance, starts working at 9:20am will be placed on
the screen at 9:20am. The dynamic objects on the screen are patients that are displayed at the time
that they enter the system, and will disappear from the screen when they exit the system. The
order of where a patient is displayed follows the ACD. A patient will remain in a queue for as long
as it takes to reach the queue front. After that the patient will be displayed where an activity occurs
(in front of a receptionist, or in a testroom, or in front of a doctor) for the statistically calculated
length of the activity, after which the patient will be displayed in a queue of the next activity
assigned to that patient.
J. Kuljis User Interfaces and Discrete Event Simulation Models Page 148
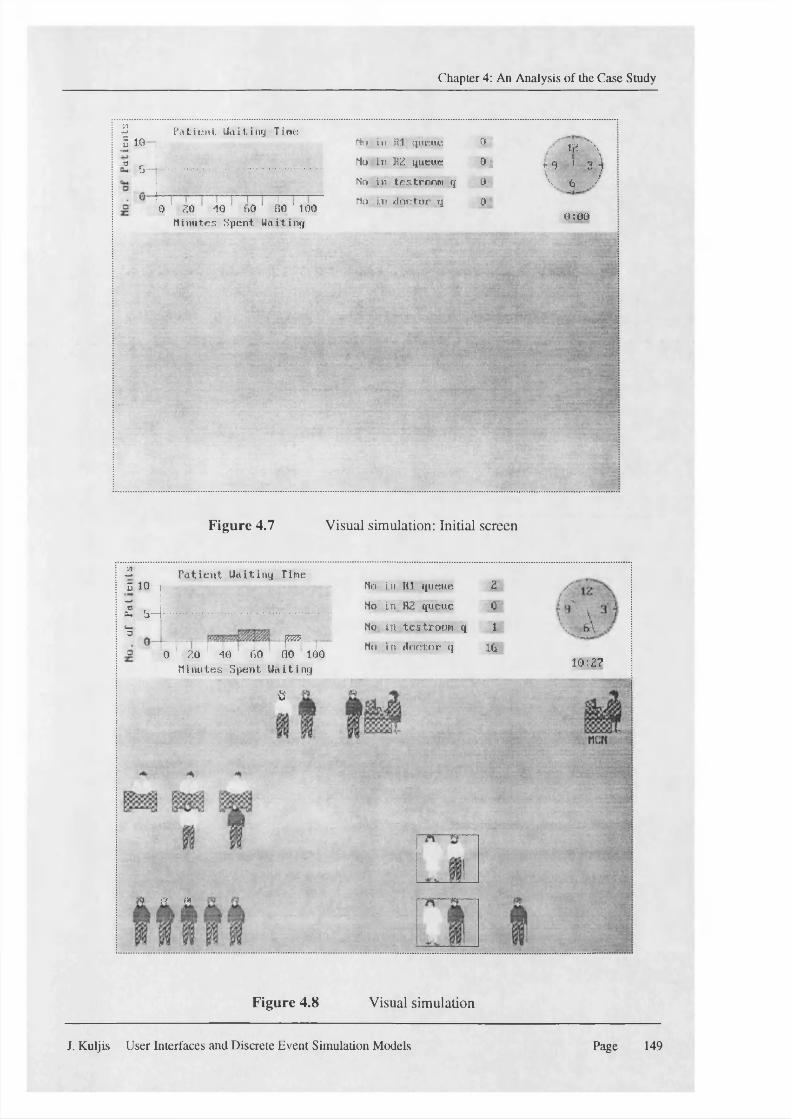
Chapter 4: An Analysis of the Case Study
w 1 10a _ 5
Patient Waiting Tine
0 1 20 40 60 80 ' 1.00Minutes Spent Uaitiny
No. in HI. queue 0 m \No In H2 queue m t:9 . ' 3. \Ho in testrnow q 0 \ 6 /Mo in doctor q 0
0500
Figure 4.7 Visual simulation: Initial screen
*2 P atient Uaitiny Time5 10— ]
2 5-1..................... ........«-*□ ....psffi.
0 20 40 1 60 no tooMinutes Spent Uaitiny
e
ft f*
Mo in HI. queue 2
Ho in R2 queue 0
Ho in testroom q 1
Mo in doctor q 1610:27
j
Figure 4.8 Visual simulation
J. Kuljis User Interfaces and Discrete Event Simulation Models Page 149
Chapter 4: An analysis of the Case Study
The spatial organisation of icons accommodates a clockwise direction starting at the top left-
hand side of the visual simulation screen. The patients entering the system will be displayed first
at the end of the receptionist 1 queue placed in the top of the left-hand side and will exit the system
at the same place (see Figure 4.8). The number of patients on the screen does not always represent
the actual number of patients in the system. If the length of a patients’ queue exceeds five then
only the front five patients of the queue will be displayed. That is one of the reasons why lengths
of all queues are given on the top part of the screen. The other reason is that is easier to check all
numbers grouped together than count the patients in queues that are constantly changing.
Colour can be a powerful information tool. Used properly, it can enhance the effectiveness of
graphics-terminal displays tremendously. However, improper use can also seriously impair
information displays. The lens of the human eye is not colour corrected. This causes
chromostereopsis, an effect that causes pure colours at the same distance to appear to be at
different distances. For most people, reds appear closer and blues more distant. Colours are also
subject to contextual effects, in which adjacent colours influence one another. For example, a
colour on a dark background appears lighter and brighter than the same colour on a light
background. The size of a coloured area also influences its perceptual properties. In general, small
areas become desaturated and can show a shift in hue. Also, small areas of colour can mix; red
and green in smaller and smaller areas are eventually integrated by the visual system into yellow.
The colour perception changes over time. We adapt to colour with prolonged viewing which
results in an apparent softening of colours (Murch, 1987).
Basically, effective colour usage depends upon matching the psychological, perceptual, and
cognitive aspects of the human visual systems. There is a great deal of variation in colour
sensitivities between individuals. About 9% of the population has the colour deficiencies
characterised as “colour blindness” (Marcus, 1992). Each of us has our own perceptual
idiosyncrasies that affect how we use colour on display.
There are generally agreed guidelines for colour usage (Murch, 1987; Shneiderman, 1992;
Mayhew, 1992). These are the following: colour should be used conservatively, i.e., the number
and amount of colours should be limited; the power of colour to speed or slow tasks should be
recognised; colour coding should support the task; colour coding should appear with minimal user
J. Kuljis User Interfaces and Discrete Event Simulation Models Page 150
Chapter 4: An analysis of the Case Study
effort; colour coding should be placed under user control; design should be made for monochrome
first; colour should be used to help in formatting; there should be consistency in colour coding;
common expectations about colour codes should be obeyed; colour changes should indicate status
changes; colour should be used in graphic displays for greater information density; symbol and
background colour combinations should be chosen carefully; to express contrast or difference,
high-contrast colours should be used; to express similarity, low-contrast colours should be used.
Marcus (1992) in his ‘Ten Commandments” for colour use recommends use of a maximum of
five plus or minus two colours where central and peripheral colours are appropriately applied.
The colours used for the CLINSIM visual simulation screen are mostly in pastel tones for
static objects and background, and in the brighter colours for the dynamic objects, i.e. patients. A
similar pattern is applied for the statistical part of the screen. It is visually distinguished from the
visual simulation part of the screen by having a different background colour. It has a white
background whereas the visual representation of the clinic has a light greyish-blue background.
Graph legends are in dark purple text on the same background colour as is the background of the
visual representation. The labels are presented in neutral colours and all changeable values in red.
The graph bars have red angled stripes within red borders. Information on queue lengths has the
same background as the graph legends, with text displayed in black whereas the changing values
of each queue is displayed in red. Both clocks are in the same colour as the background of the
graph legends. The analogue clock has black hands, the digital clock has time displayed in red.
The graphical representation of constructs for different applications should give definite
information about the type of model component it represents, such as waiting queues, customers
or servers in queuing systems. To provide a flexible application, problem oriented icons should be
substituted by application oriented ones (Kamper, 1993). Icons communicate by virtue of their
inherent physical characteristics that make them look like the objects to which they refer (Marcus,
1993). It is less easy to recognise icons if the degree of abstraction increases. All entities in
CLINSIM are represented by corresponding icons that resemble actors in a real clinic. A
receptionist is represented by an icon of a person sitting at the desk in front of a computer. The
colours are non obstructive - greyish brown desk, grey computer, the person wears a blue top and
has a black seat. A testroom is represented by an icon of a box with a nurse in a white coat in it. A
doctor is represented by an icon of a person in a white coat sitting behind a grey desk. A patient is
J. Kuljis User Interfaces and Discrete Event Simulation Models Page 151
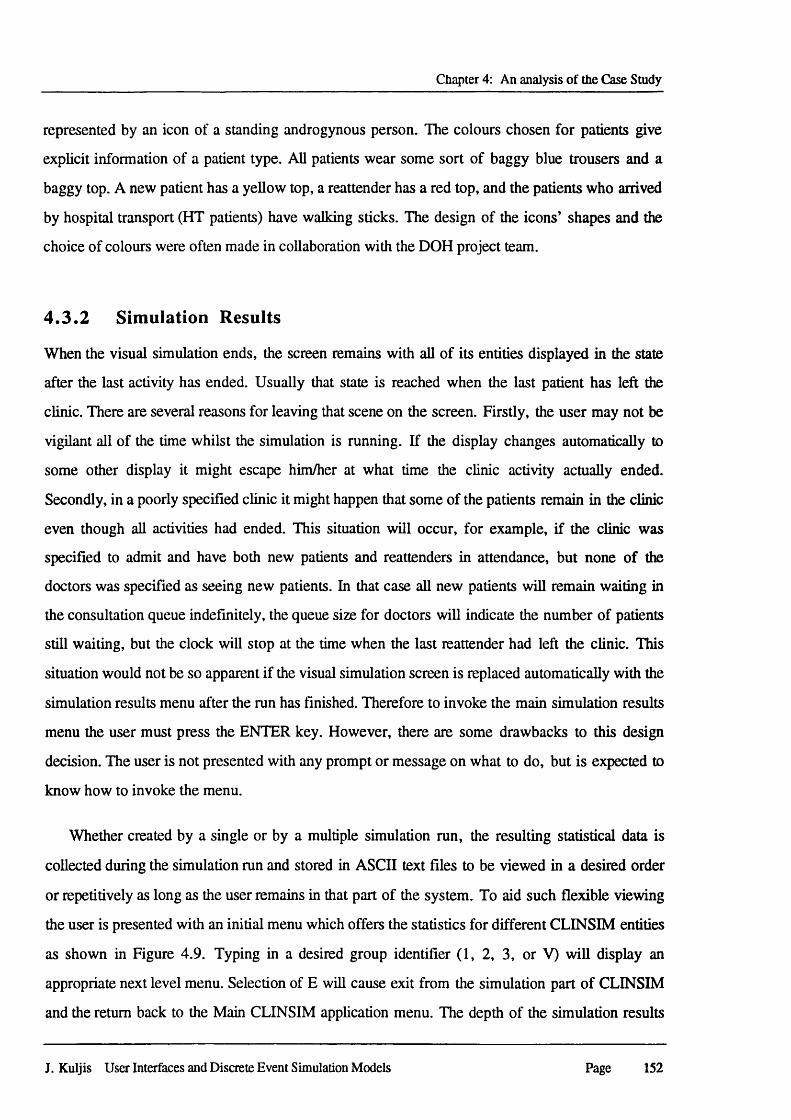
Chapter 4: An analysis of the Case Study
represented by an icon of a standing androgynous person. The colours chosen for patients give
explicit information of a patient type. All patients wear some sort of baggy blue trousers and a
baggy top. A new patient has a yellow top, a reattender has a red top, and the patients who arrived
by hospital transport (HT patients) have walking sticks. The design of the icons’ shapes and the
choice of colours were often made in collaboration with the DOH project team.
4.3 .2 Simulation Results
When the visual simulation ends, the screen remains with all of its entities displayed in the state
after the last activity has ended. Usually that state is reached when the last patient has left the
clinic. There are several reasons for leaving that scene on the screen. Firstly, the user may not be
vigilant all of the time whilst the simulation is running. If the display changes automatically to
some other display it might escape him/her at what time the clinic activity actually ended.
Secondly, in a poorly specified clinic it might happen that some of the patients remain in the clinic
even though all activities had ended. This situation will occur, for example, if the clinic was
specified to admit and have both new patients and reattenders in attendance, but none of the
doctors was specified as seeing new patients. In that case all new patients will remain waiting in
the consultation queue indefinitely, the queue size for doctors will indicate the number of patients
still waiting, but the clock will stop at the time when the last reattender had left the clinic. This
situation would not be so apparent if the visual simulation screen is replaced automatically with the
simulation results menu after the run has finished. Therefore to invoke the main simulation results
menu the user must press the ENTER key. However, there are some drawbacks to this design
decision. The user is not presented with any prompt or message on what to do, but is expected to
know how to invoke the menu.
Whether created by a single or by a multiple simulation run, the resulting statistical data is
collected during the simulation run and stored in ASCII text files to be viewed in a desired order
or repetitively as long as the user remains in that part of the system. To aid such flexible viewing
the user is presented with an initial menu which offers the statistics for different CLINSIM entities
as shown in Figure 4.9. Typing in a desired group identifier (1, 2, 3, or V) will display an
appropriate next level menu. Selection of E will cause exit from the simulation part of CLINSIM
and the return back to the Main CLINSIM application menu. The depth of the simulation results
J. Kulj is User Interfaces and Discrete Event S imulation Models Page 152
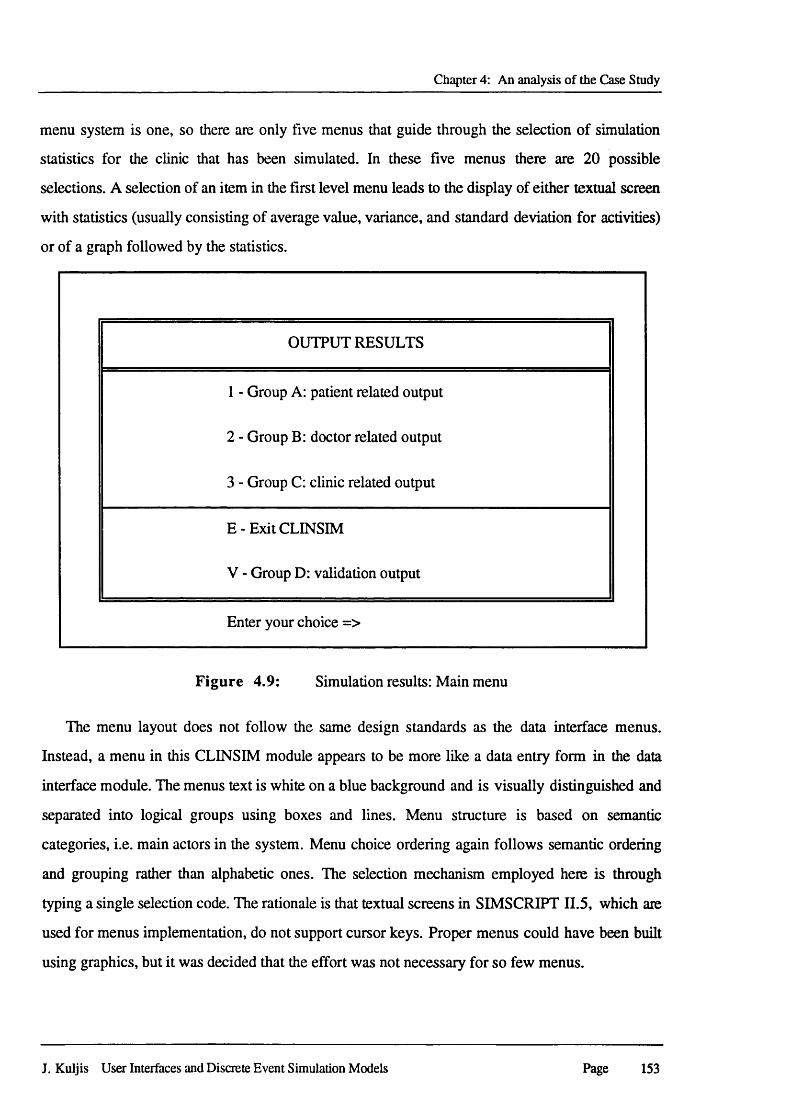
Chapter 4: An analysis of the Case Study
menu system is one, so there are only five menus that guide through the selection of simulation
statistics for the clinic that has been simulated. In these five menus there are 20 possible
selections. A selection of an item in the first level menu leads to the display of either textual screen
with statistics (usually consisting of average value, variance, and standard deviation for activities)
or of a graph followed by the statistics.
OUTPUT RESULTS
1 - Group A: patient related output
2 - Group B: doctor related output
3 - Group C: clinic related output
E -E xit CLINSIM
V - Group D: validation output
Enter your choice =>
Figure 4.9: Simulation results: Main menu
The menu layout does not follow the same design standards as the data interface menus.
Instead, a menu in this CLINSIM module appears to be more like a data entry form in the data
interface module. The menus text is white on a blue background and is visually distinguished and
separated into logical groups using boxes and lines. Menu structure is based on semantic
categories, i.e. main actors in the system. Menu choice ordering again follows semantic ordering
and grouping rather than alphabetic ones. The selection mechanism employed here is through
typing a single selection code. The rationale is that textual screens in SIMSCRIPT II.5, which are
used for menus implementation, do not support cursor keys. Proper menus could have been built
using graphics, but it was decided that the effort was not necessary for so few menus.
J. Kuljis User Interfaces and Discrete Event Simulation Models Page 153

Chapter 4: An analysis of the Case Study
These menus lack some of the other features present in the data interface part like, for
example, highlighting of a selected item in a menu or disabling a non feasible/existing option. The
highlighting is not always necessary since immediately after selection the menu will disappear
from the screen and will be replaced with a new screen (a menu, statistics, or a graph). But
sometimes after viewing a desired choice it would be convenient to be reminded which item on a
menu triggered the selection. In the case of non existing actors in the system, the menus will still
have the options available and selectable for viewing graphs and the statistics belonging to it. For
example if receptionist 2 was not specified in a clinic, the output result for it will still be available.
After selection of ‘Patient queuing times for receptionist 2’, the corresponding empty graph will
be displayed, followed by the numerical statistical screen filled with zeros. Navigation through the
menu system is not an issue here since there is just one level in a menu tree structure and every
menu on the first-level has a choice provided for returning back to the top level menu.
Representational graphics are commonly used to depict the end of a simulation run in the form
of graphs, bar diagrams, pie charts, histograms, and time series. In order for graphical
representations to work, we must relate data to graphics (Morse and Reynolds, 1993). As the
number of data and graphical elements increases, the possible relationships increase as the product
of the number of elements. The primary function of graphical representation is to make clearer
these relationships. The CLINSIM choice of representational charts are in the form of histograms,
stack bars, and time series.
Histograms are used to represent waiting times (see Figure 4.10) whereas time series are used
to represent queues sizes (see Figure 4.11). Again all design consideration mentioned earlier about
use of screen space, colour schemes, legends, and messages are applied to the graphs as well. All
charts have the same pastel background as does the visual simulation display. The choice of
colours and patterns used for the bars in histograms was guided more by the consideration of how
these histograms would look like when printed on a black and white printer than by its screen
appearance. The requirement that all charts are equally presentable displayed and printed, means
that some sacrifices are made for both representations to work. Chart presentations do not use the
full potential of colour to present data and consistency very often. All charts have legends that
indicate which patterns are used for each entity bar in a chart. Chart titles that indicate what is
presented were chosen by the DOH analysts. Often the titles are not informative enough, not for
J. Kuljis User Interfaces and Discrete Event Simulation Models Page 154
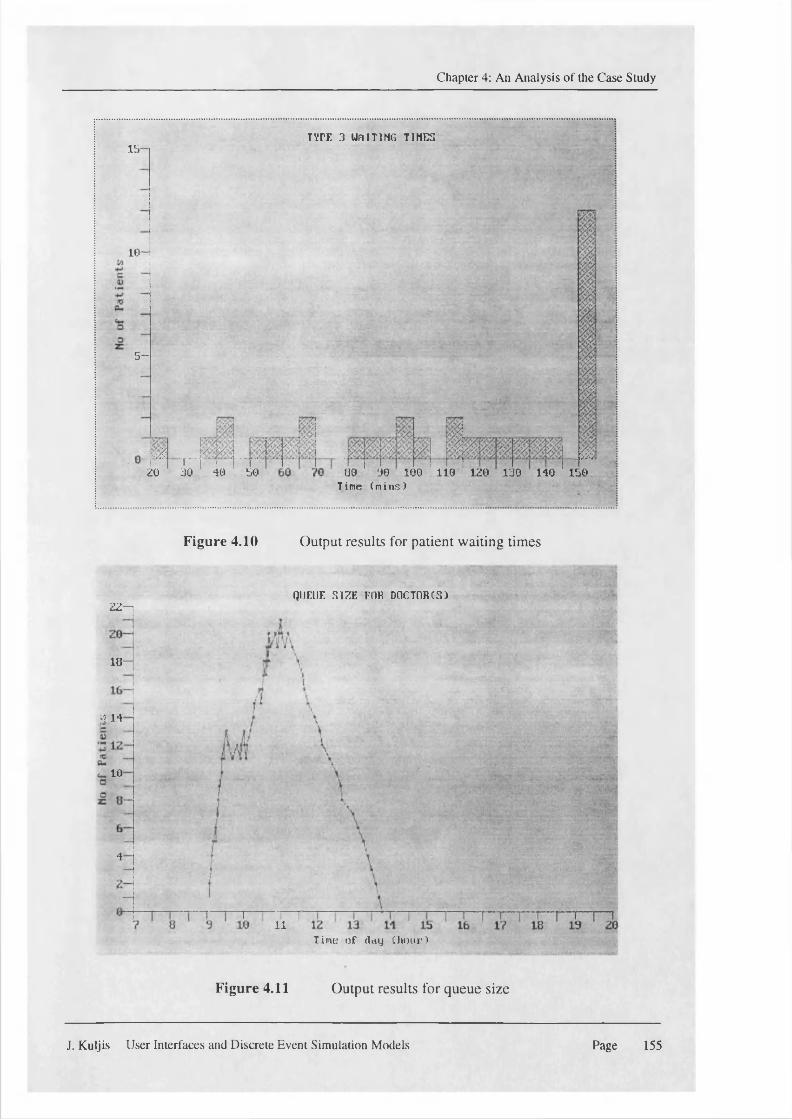
Chapter 4: An Analysis of the Case Study
TVPE 3 UNITING TIMES15-
10-
5 -
.'V?20
... „ .JP?80 1 00 100 110 120 130 140 150
Time (mins)
i i i r30 40 50
Figure 4.10 Output results for patient waiting times
QUEUE SIZE FOR DOCTOR(S)2 2 - i
18— I
iU*t
1.0
4
T11
Tine of day thour)
Figure 4.11 Output results for queue size
J. Kuljis User Interfaces and Discrete Event Simulation Models Page 155
Chapter 4: An analysis of the Case Study
the lack of trying, but because of the constraint on title length imposed by the software. Texts and
the increment sizes on axes in histograms are decided based on a model default case and possible
margins. Time series are rescaled and redrawn automatically during their presentation.
Textual screens representing statistics of particular entity/entities in the system are invoked
either directly from a menu or after a chart is displayed. To display a textual screen the user has to
press the ENTER key. Yet again there is no message telling the user what to do. All textual
screens have the same design as do the menus. Text is in a white on blue background enclosed in
a white box. The layout of the text is in the form of a table with labels in each row and column.
There is no help or explanation facility provided. To return to the calling menu the user has to
press the ENTER key.
4.4 Communication
The decision on which CLINSIM module (Data Interface or Simulation) to run is handled in the
main application menu (see Figure 3.2). As explained in section 3.4.2 this menu that integrates all
CLINSIM modules is built using Automenu. Inevitably therefore the menu appearance, navigation
through it, and selection of menu items differs from other parts of the system. When the
application starts the main menu is displayed occupying the whole screen. The colours used are
different from those in the Data Interface part and in the Simulation part The menu background is
in a greyish-blue colour framed in a yellow box. Under the box there is a message ‘Press H for
Help’. The help provided is not help for CLINSIM but help for Automenu. It can be useful
though, since it gives information on how to navigate through the menu and how to select a menu
item. Yellow lines split the menu horizontally into three parts. The top part is just the application
name, i.e. “CLINSIM”, displayed in black on a turquoise background. The bottom part gives
information on date, time, and the memory size available for the application. This text is discretely
displayed in white on the menu background. The middle part occupies the majority of the screen
space and lists the menu options. The menu items are numbered 1 to 5. All menu items, except the
selected one, are displayed in white. The selected item is highlighted by changing text colour into
yellow and with a yellow arrow pointing to it. The first item in the menu is highlighted as the
default option. At the bottom of this part of the screen a message is displayed with an explanation
of what the selected item will perform. For example if item 3 (‘Simulation’) is selected the
J. Kuljis User Interfaces and Discrete Event Simulation Models Page 156
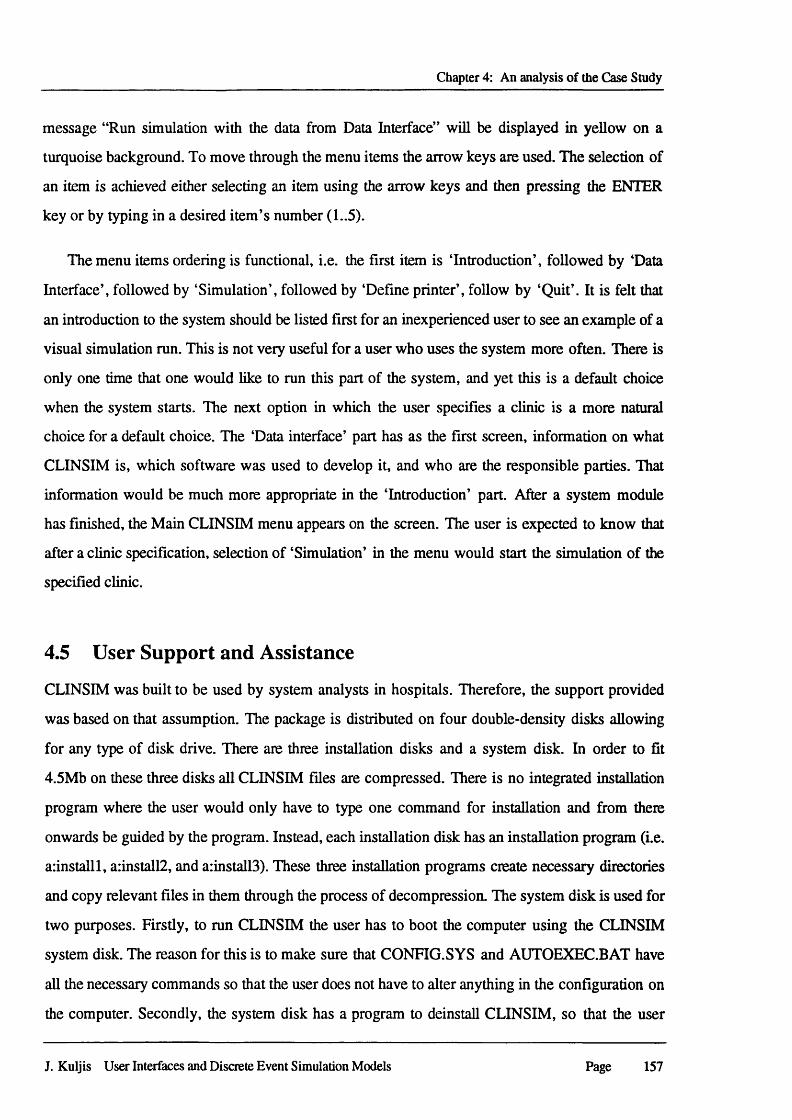
Chapter 4: An analysis of the Case Study
message “Run simulation with the data from Data Interface” will be displayed in yellow on a
turquoise background. To move through the menu items the arrow keys are used. The selection of
an item is achieved either selecting an item using the arrow keys and then pressing the ENTER
key or by typing in a desired item’s number (1..5).
The menu items ordering is functional, i.e. the first item is ‘Introduction’, followed by ‘Data
Interface’, followed by ‘Simulation’, followed by ‘Define printer’, follow by ‘Quit’. It is felt that
an introduction to the system should be listed first for an inexperienced user to see an example of a
visual simulation run. This is not very useful for a user who uses the system more often. There is
only one time that one would like to run this part of the system, and yet this is a default choice
when the system starts. The next option in which the user specifies a clinic is a more natural
choice for a default choice. The ‘Data interface’ part has as the first screen, information on what
CLINSIM is, which software was used to develop it, and who are the responsible parties. That
information would be much more appropriate in the ‘Introduction’ part. After a system module
has finished, the Main CLINSIM menu appears on the screen. The user is expected to know that
after a clinic specification, selection of ‘Simulation’ in the menu would start the simulation of the
specified clinic.
4.5 User Support and Assistance
CLINSIM was built to be used by system analysts in hospitals. Therefore, the support provided
was based on that assumption. The package is distributed on four double-density disks allowing
for any type of disk drive. There are three installation disks and a system disk. In order to fit
4.5Mb on these three disks all CLINSIM files are compressed. There is no integrated installation
program where the user would only have to type one command for installation and from there
onwards be guided by the program. Instead, each installation disk has an installation program (i.e.
a:installl, a:install2, and a:install3). These three installation programs create necessary directories
and copy relevant files in them through the process of decompression. The system disk is used for
two purposes. Firstly, to ran CLINSIM the user has to boot the computer using the CLINSIM
system disk. The reason for this is to make sure that CONFIG.SYS and AUTOEXEC.BAT have
all the necessary commands so that the user does not have to alter anything in the configuration on
the computer. Secondly, the system disk has a program to deinstall CLINSIM, so that the user
J. Kuljis User Interfaces and Discrete Event Simulation Models Page 157
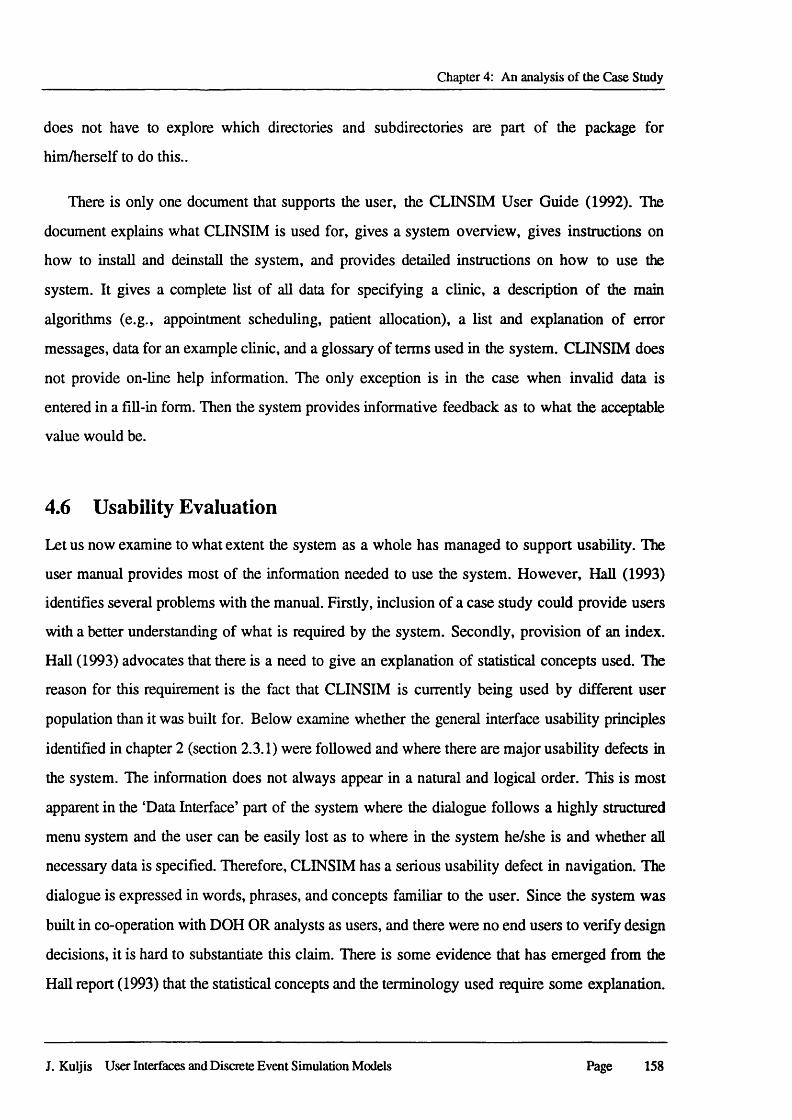
Chapter 4: An analysis of the Case Study
does not have to explore which directories and subdirectories are part of the package for
him/herself to do this..
There is only one document that supports the user, the CLINSIM User Guide (1992). The
document explains what CLINSIM is used for, gives a system overview, gives instructions on
how to install and deinstall the system, and provides detailed instructions on how to use the
system. It gives a complete list of all data for specifying a clinic, a description of the main
algorithms (e.g., appointment scheduling, patient allocation), a list and explanation of error
messages, data for an example clinic, and a glossary of terms used in the system. CLINSIM does
not provide on-line help information. The only exception is in the case when invalid data is
entered in a fill-in form. Then the system provides informative feedback as to what the acceptable
value would be.
4.6 Usability Evaluation
Let us now examine to what extent the system as a whole has managed to support usability. The
user manual provides most of the information needed to use the system. However, Hall (1993)
identifies several problems with the manual. Firstly, inclusion of a case study could provide users
with a better understanding of what is required by the system. Secondly, provision of an index.
Hall (1993) advocates that there is a need to give an explanation of statistical concepts used. The
reason for this requirement is the fact that CLINSIM is currently being used by different user
population than it was built for. Below examine whether the general interface usability principles
identified in chapter 2 (section 2.3.1) were followed and where there are major usability defects in
the system. The information does not always appear in a natural and logical order. This is most
apparent in the ‘Data Interface’ part of the system where the dialogue follows a highly structured
menu system and the user can be easily lost as to where in the system he/she is and whether all
necessary data is specified. Therefore, CLINSIM has a serious usability defect in navigation. The
dialogue is expressed in words, phrases, and concepts familiar to the user. Since the system was
built in co-operation with DOH OR analysts as users, and there were no end users to verify design
decisions, it is hard to substantiate this claim. There is some evidence that has emerged from the
Hall report (1993) that the statistical concepts and the terminology used require some explanation.
J. Kuljis User Interfaces and Discrete Event Simulation Models Page 158
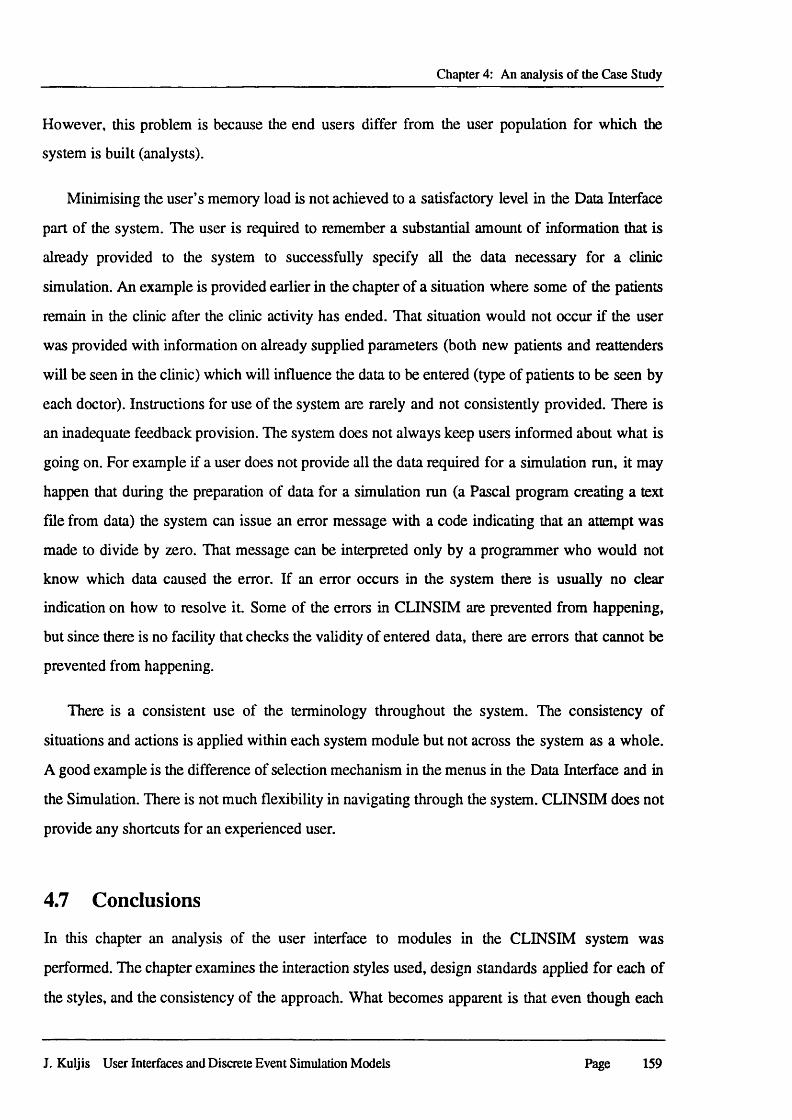
Chapter 4: An analysis of the Case Study
However, this problem is because the end users differ from the user population for which the
system is built (analysts).
Minimising the user’s memory load is not achieved to a satisfactory level in the Data Interface
part of the system. The user is required to remember a substantial amount of information that is
already provided to the system to successfully specify all the data necessary for a clinic
simulation. An example is provided earlier in the chapter of a situation where some of the patients
remain in the clinic after the clinic activity has ended. That situation would not occur if the user
was provided with information on already supplied parameters (both new patients and reattenders
will be seen in the clinic) which will influence the data to be entered (type of patients to be seen by
each doctor). Instructions for use of the system are rarely and not consistently provided. There is
an inadequate feedback provision. The system does not always keep users informed about what is
going on. For example if a user does not provide all the data required for a simulation run, it may
happen that during the preparation of data for a simulation run (a Pascal program creating a text
file from data) the system can issue an error message with a code indicating that an attempt was
made to divide by zero. That message can be interpreted only by a programmer who would not
know which data caused the error. If an error occurs in the system there is usually no clear
indication on how to resolve it. Some of the errors in CLINSIM are prevented from happening,
but since there is no facility that checks the validity of entered data, there are errors that cannot be
prevented from happening.
There is a consistent use of the terminology throughout the system. The consistency of
situations and actions is applied within each system module but not across the system as a whole.
A good example is the difference of selection mechanism in the menus in the Data Interface and in
the Simulation. There is not much flexibility in navigating through the system. CLINSIM does not
provide any shortcuts for an experienced user.
4.7 Conclusions
In this chapter an analysis of the user interface to modules in the CLINSIM system was
performed. The chapter examines the interaction styles used, design standards applied for each of
the styles, and the consistency of the approach. What becomes apparent is that even though each
J. Kuljis User Interfaces and Discrete Event Simulation Models Page 159
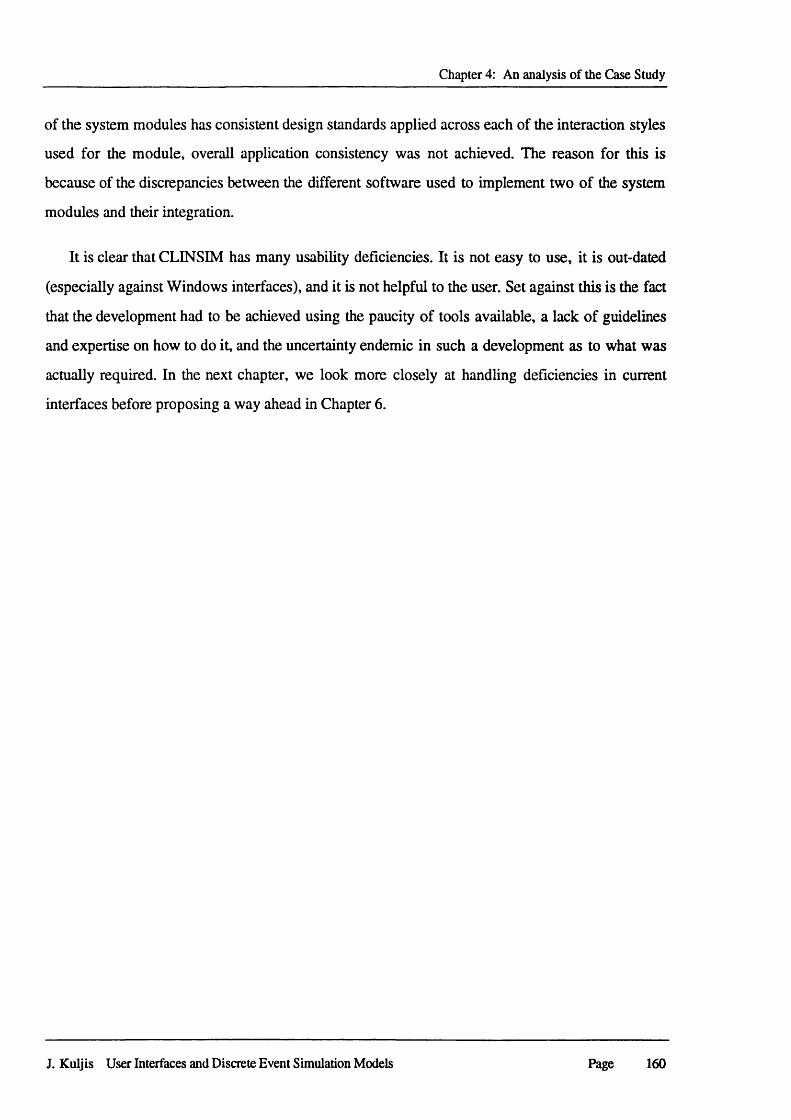
Chapter 4: An analysis of the Case Study
of the system modules has consistent design standards applied across each of the interaction styles
used for the module, overall application consistency was not achieved. The reason for this is
because of the discrepancies between the different software used to implement two of the system
modules and their integration.
It is clear that CLINSIM has many usability deficiencies. It is not easy to use, it is out-dated
(especially against Windows interfaces), and it is not helpful to the user. Set against this is the fact
that the development had to be achieved using the paucity of tools available, a lack of guidelines
and expertise on how to do it, and the uncertainty endemic in such a development as to what was
actually required. In the next chapter, we look more closely at handling deficiencies in current
interfaces before proposing a way ahead in Chapter 6.
J. Kuljis User Interfaces and Discrete Event Simulation Models Page 160
Chapter 5: HCI Relevance to Simulation Systems
5.1 Introduction
In the previous chapters we have reviewed interactions employed in current discrete event
simulation systems. We have identified major features of user interfaces and the flexibility of
interaction that they provide to their users. Furthermore, in a case study we have examined what
are the possibilities and obstacles for bespoke development of user interfaces for models in new
domains. We have made an analysis of user interfaces based on some of the recommendations
from the HCI literature. However, we have not yet examined whether HCI research can help to
develop better simulation systems, and if so how. Reviewing the HCI literature shows that the
research spans in many directions and across many disciplines. The most common areas of
concern are:
1) Human aspects: Most research until now focused on the cognitive aspects of HCI. The
reason is that the dominant framework in HCI has been based on the needs of a single
user interacting with a single interface. Recent developments in system and software
design, however, have begun to provide much more scope for supporting group
working and multitasking. HCI research has since widened to cover these concerns by
looking at social and organisational aspects.
2) Technology aspects: Cover input and output computer devices, interaction styles, and
user support and assistance.
3) User interface design: Deals with both software and hardware issues. Many authors
consider issues in designing interface objects (i.e. menus), screen layout, and design of
graphics. Some authors adapt software engineering approaches to interactive system
development. They put more emphasis on the elaboration of a life cycle that seriously
considers user interface design within the overall system design framework.
4) Support for designers: Covers stand alone software tools (i.e. graphics tools, modelling
and diagramming tools, visualisation tools, user interface toolkits) which provide
J. Kuljis: User Interfaces and Discrete Event Simulation Models Page 161
Chapter 5: HCI Relevance to Simulation Systems
general support and integrated environments (i.e. user interface management tools,
computer-aided software engineering tools).
5) Evaluation: Covers common methods and tools for evaluation and the role of evaluation
in the system life cycle.
The above issues are interlinked and the HCI researchers often discuss them under headings
different from these. The human aspects and technology aspects provide the basic knowledge that
is needed for interaction design (i.e. design methods, design support, and evaluation).
Researchers in HCI disagree how the field should develop. Proponents of theory-driven
approaches (Card et al., 1983; Poison and Lewis, 1990) aim to model users, tasks, the
knowledge required for users to complete their tasks, their task performance, or the understanding
the users might have of their tasks and of the system with which they interact. Theoretical models,
it is hoped, will eventually have powerful predictive and analytic capabilities which ideally should
enable designers to compare different systems or possible solutions before a particular design path
is taken. This may well be so ambitious as to prove an unattainable ideal. The very best current
theoretical models provide only a first, rough approximation of what will be needed to accomplish
the level of understanding required to fulfil theoreticians’ ambitions. Other researchers argue that
HCI is far too complex for any theory to be helpful, that scientific theory is largely irrelevant to
progress (Carroll et al., 1991), or that progress comes from case studies based on observations of
what users actually do (Holtzblatt and Jones, 1992). The researchers also disagree with respect to
what should be studied, how it should be studied, and how HCI might contribute to producing
better computer systems. Regardless of all disagreements, Lindgaard (1994) argues that HCI can
contribute to improved computer systems in two important ways: first it can guide a systematic,
careful analysis of what information, tools and capabilities people need to achieve their goals, and
second, it can provide tools and techniques with which to evaluate usability in an effort to remove
flaws that hinder smooth interaction between people and computers.
In this chapter we give an overview of the major concerns in HCI research. We have already
discussed technological aspects of HCI in section 2.2. In this research we are mainly interested in
designing better user interfaces for simulation systems. The actual methods in achieving this
concentrate on design and the development life cycle and the methods that can be adopted in
J. Kuljis User Interfaces and Discrete Event Simulation Models Page 162
Chapter 5: HCI Relevance to Simulation Systems
interactive system design together with support for designers. Software engineering methods are
too broad an area to be discussed here. We examine the characteristics of the major participants in
human-computer interaction and the characteristics of the interaction itself. The major participant is
the human, the user, the one whom computer systems are designed to assist. We will restrict our
study to those aspects of human capabilities and behaviour which are relevant to HCI. We then
discuss the user interface design issues for ensuring the system’s usability. After that we give an
overview of the most influential theories in HCI and their contribution to the design of more
usable computer systems. A section on user interface evaluation follows. Evaluation is crucial in
identifying flaws in interaction design and in determining the usability of a computer system. We
conclude this chapter with a discussion on the relevance of HCI research to the design of more
usable simulation systems. In the chapter that follows we try to see how the accumulated
knowledge and theories in HCI, together with the experience we have gained through the case
study, and the analyses of the user interface characteristics of some simulation software, can help
in our particular problem - the design of user interfaces to discrete event simulation systems.
5.2 Human Issues
Reisner (1987) justly points out that the area of study in the field of human-computer interaction is
not the interaction of humans and computers; the name is misleading. The principle object of study
is human. But the object of practical interest is the computer. We already know what the computer
will do. It will do whatever it has been programmed to do. The behaviour of the human is our
chief concern. A major emphasis in this field is, according to Reisner (1987), the focus on
cognition as an important factor in the ease of use of the human-computer interface. To do so will
require knowledge not only of human weaknesses but also of human abilities, and of human
behaviour, in using computers.
5.2 .1 . The Human
We will simplify the study of the human to the aspects relevant to the study of human-computer
interaction by considering the user of the computer system as an information processing system
himself/herself. The notion of information processing has played a fundamental role in HCI by
providing a theoretical basis for cognitive models of users (it is described in more detail in the
J. Kuljis User Interfaces and Discrete Event Simulation Models Page 163
Chapter 5: HCI Relevance to Simulation Systems
section on the Cognitive approach in 5.4.2). In general, cognition refers to the processes by
which we become acquainted with things or, in other words, how we gain knowledge. These
include understanding, remembering, reasoning, attending, being aware, acquiring skills, and
creating new ideas. The main objective in HCI has been to understand and represent how humans
interact with computers in terms of how knowledge is transmitted between the two (Preece et al.,
1994). The theoretical grounding for this approach stems from cognitive psychology: it is to
explain how human beings achieve the goals they set. Such goal-oriented activity is comprised of
performing cognitive tasks that involve processing information. Information comes in, is stored
and processed, and information is passed-out. We will therefore discuss three components of this
system: input-output, memory, and processing.
Input-output
A person’s interaction with the outside world occurs through information being received and sent:
input and output. In an interaction with a computer the user receives information that is output by
the computer, and responds by providing input to the computer - the user’s output becomes the
computer’s input and vice versa. Input in the human occurs mainly through senses and output is
through the motor control of the effectors. There are five major senses: sight, hearing, touch,
taste, and smell. Of these, the first three are the most important to HCI (Dix et al., 1993).
Similarly there are a number of effectors, including the limbs, fingers, eyes, head, and vocal
system. In the interaction with the computer, the fingers play the primary role, through typing or
mouse control, with lesser use of speech, and eye and head positions. In the interaction with the
computer systems we receive information primarily by sight, from what appears on the screen.
However, we may also receive information by ear. Touch plays a part in that we feel a key
depressing or the orientation of the mouse, which provides vital feedback about what we have
done. Most of the research on perception and interface design has been in terms of what we can
see at the interface. With the emergence of multimedia and virtual reality the notion of the interface
as a screen is beginning to change. Other perceptual modalities of sound and touch are being
incorporated into the newly emerging technologies.
Perception is fundamental to interacting with computers. To be able to use a computer, we
need to perceive the information that is presented at and through the interface. Human vision is a
J. Kuljis User Interfaces and Discrete Event Simulation Models Page 164
Chapter 5: HCI Relevance to Simulation Systems
highly complex activity with a range of physical and perceptual limitations, yet it is a primary
source of information for the average person. Visual perception can roughly be divided into two
stages: the physical reception of the stimulus from the outside world, and the processing and
interpretation of that stimulus. The physical properties of the eye and the visual system mean that
there are certain things that cannot be seen by the human, yet the interpretative capabilities of
visual processing allow images to be constructed from incomplete information. We need to
understand both physical and processing capabilities and limitations which both influence and
affect the way that we design computer systems. There are several theories that have attempted to
explain the way we see. Preece et al. (1994) categorise them into two classes: constructivist and
ecological approaches. Both ecological and constructivist approaches argue that we are active
perceivers. The constructivists suggest that we actively perceive in the sense of embellishing and
elaborating retinal images. The ecologists propose that we actively explore the objects in our
environments (by seeing, smelling, listening to, tasting, and touching).
Constructivist theorists believe that the process of seeing is an active one in which our view of
the world is constructed both from information in the environment and from previously stored
knowledge. The main assumption behind the constructivist approach is that perception involves
the intervention of representations and memories. What we see is not a replica or copy of the
world such as the image that a camera would produce. Instead the visual system constructs a
model of the world by transforming, enhancing, distorting, and discarding information. Similarly,
our ability to perceive objects on a screen (e.g., text, graphics, two-dimensional or three-
dimensional representations) is a result of our prior knowledge and expectations as to what should
appear and the images that fall on our retinas. When presented with ambiguous stimuli, our prior
knowledge of the world helps us to make sense of it. The same is true of ambiguous information
displayed on computer screens. Another aspect of the constructive process involves decomposing
or partitioning images into separate entities that are readily recognisable. The object (the figure) is
distinguished from the rest of the information (the background). Psychologists, who believed that
our ability to interpret the meaning of scenes and objects was based on us having innate laws of
organisation, were first to identify a number of general principles that underlie this process. The
organising principles which enable us to perceive the patterns of stimuli as meaningful wholes are
defined as: proximity (similar close objects appear as groups rather than a random cluster of
J. Kuljis User Interfaces and Discrete Event Simulation Models Page 165
Chapter 5: HCI Relevance to Simulation Systems
elements); similarity (there is a tendency for elements of the same shape or colour to be seen as
belonging together); closure (missing parts of a figure are filled in to complete it); continuity; and
symmetry (regions bounded by symmetrical borders tend to be perceived as coherent figures).
Ecological theorists believe that perception involves the process of ‘picking up* information
from the environment and does not require any processes of construction and elaboration. Rather
than trying to understand how we can make sense of a scene or how we recognise an object, the
ecological approach is concerned with how we deal with continuous events over time. It asks
what we need to know about our environment to carry out our activities (for example, finding a
file in a cluttered screen of windows) and how it might be known. Users will actively engage in
activities that provide the necessary information. What we see as the behaviour of a system,
object, or event is that which is afforded or permitted by the system, object, or event When the
affordances of an object are perceptually obvious, it is easy for us to know how to interact with it.
Conversely, when the affordances are less obvious or ambiguous, it is easy for us to make
mistakes when trying to interact with the object. The ecological approach has been highly
influential in developing theoretical accounts of interface design.
The sense of hearing is viewed as secondary to that of sight. The auditory system has a
tremendous capacity for conveying information about our environment. The human ear can hear
frequencies from about 20 Hz to 15 kHz. It can distinguish frequency changes of less than 1.5 Hz
at low frequencies but is less accurate at high frequencies. The auditory system performs some
filtering of the sounds received, allowing us to ignore background noise and concentrate on
important information. The ear can differentiate quite subtle sound changes and can recognise
familiar sounds without concentrating attention on the sound source. However, sound is rarely
used to its potential in interface design, usually being confined to alerting and feedback purposes.
Until recently few computers could generate deliberately designed sounds other than beeps.
Different kinds of sound, each of which can be either synthesised or sampled, include speech,
musical sound, and natural sound. Some researchers have suggested that sound can be used in
more information-rich ways to show what is happening in a system. In particular, it can be used
as a coding method for augmenting graphical representations. Sound is of particular value when
the eyes are engaged in some other task, or where a complete situation of interest cannot be
visually scanned at one time.
J. Kuljis User Interfaces and Discrete Event Simulation Models Page 166
Chapter 5: HCI Relevance to Simulation Systems
The third sense which is important in interface design is touch or haptic perception. Touch is
an important means of feedback, and this is no less so in using computer systems. An important
part of the task of pressing the button is the feeling of the button being depressed. Also, we
should be aware that, although for the average person haptic perception is a secondary source of
information, for those whose other senses are impaired it may be vitally important (for such users,
interfaces such as Braille may be the primary source of information in the interaction). Speed and
accuracy of movement are important considerations in the design of interactive systems, primarily
in terms of the time taken to move to a particular target on a screen. The target may be a button, a
menu item, or an icon, for example. The time taken to hit a target is a function of the size of the
target and the distance that has to be moved. Since users will find it difficult to manipulate small
objects, targets should generally be as large as possible and the distance to be moved as small as
possible (Dix et al., 1993). This has led to suggestions that pie chart shaped menus are preferable
to lists since all options are equidistant. However, if lists are used, the most frequently used
options can be placed closest to the user’s start point (for example, at the top of the menu).
Memory
It is generally agreed that there are three types of human memory or memory functions: sensory
buffers, short-term memory or working memory, and long-term memory. There is some
disagreement as whether there are three separate systems or different functions of the same
system, but for our purposes it is sufficient to note the three separate types of memory. These
memories interact with information being processed and passed between memory stores. The
sensory memories act as buffers for stimuli received through the senses. A sensory memory exists
for each sensory channel: iconic memory for visual stimuli, echoic memory for aural stimuli, and
haptic memory for touch. These memories are constantly overwritten by new information coming
in on these channels. Information remains in iconic memory very briefly, of the order of 0.5
seconds. Sound information is received at different times, so we must store the stimulus in the
mean time. Echoic memory allows brief ‘play-back’ of information.
Short-term memory or working memory acts as a ‘scratch-pad’ for the temporary recall of
information. It is the working area in which information is held temporarily for another processing
activity such as handling inputs, selecting, retrieving, storing, planning, and preparing outputs.
J. Kuljis User Interfaces and Discrete Event Simulation Models Page 167
Chapter 5: HCI Relevance to Simulation Systems
Two main characteristics of working memory are that its capacity to hold information is limited in
amount and time. At most, the number of items or ‘chunks’ we can remember at any one time, be
they digits, names, letters, or any type of complex concept for which we have a label of any kind
is about seven. This phenomenon, now classically known as ‘the magic number 7 ± 2’, was
identified by Miller (1956).
Information is passed from sensory memory into short-term memory by attention, thereby
filtering the stimuli to only those which are of interest at a given time. Attention is the
concentration of the mind on one out of a number of competing stimuli or thoughts. It is clear that
we are able to focus our attention selectively, choosing to attend to one thing rather than another.
This is due to the limited capacity of our sensory and mental processes. Information received by
sensory memories is quickly passed into a more permanent memory store, or overwritten and lost.
The manner in which we deploy our attention has a tremendous bearing on how effectively we can
interact with a system.
The understanding of attentional phenomena is significant for interface design in a number of
issues such as: how to get people’s attention again on the task they were performing if they are
distracted; how to focus people’s attention on what they need to be looking at or listening to for
any given stage of a task; and how to guide their attention to the relevant information on a display.
One way in which interfaces can be designed to help users find the information is to structure the
interface so that it is easy to navigate through. This requires presenting not too much and not too
little information on a screen in an organised and meaningfully structured way (e.g., grouping,
ordering). Other techniques for presenting information at the interface to guide attention include
use of: spatial and temporal cues; colour; and alerting techniques such as flashing, reverse video,
and auditory warnings. Ideally, systems should be designed to provide information systematically
about the status of an activity in terms of what has been done and what currently needs to be
carried out. If users are distracted from the activity at hand, the system should then be able to
inform them of where they were in that activity when they return to it. In addition, routine
background tasks that are prone to being forgotten, especially when users are distracted, such as
saving files, should be brought to the user’s attention by displaying reminder prompts at the
interface.
J. Kuljis User Interfaces and Discrete Event Simulation Models Page 168
Chapter 5: HCI Relevance to Simulation Systems
Long-term memory stores factual information, experimental knowledge, procedural rules of
behaviour, and everything we ‘know’. It differs from short-term memory in a number of
significant ways. It has a huge, if not unlimited, capacity. It has a relatively slow access time of
approximately a tenth of a second. Forgetting occurs more slowly in long-term memory, if at all.
Long-term memory is intended for the long-term storage of information. Information is placed
there from working memory after a few seconds. There are two types of long-term memory:
episodic and semantic memory. Episodic memory represents our memory of events and
experiences in a serial form. It is from this memory that we can reconstruct the actual events that
took place at a given point in our lives. Semantic memory, on the other hand, is a structured
record of facts, concepts, and skills that we have acquired. The information in semantic memory
is derived from that in our episodic memory, such that we can learn new facts or concepts from
our experiences. Semantic memory is structured in some way to allow access of information,
representation of relationships between pieces of information, and inference.
There are three main activities related to long-term memory: storage or remembering of
information, forgetting, and information retrieval. Information from short-term memory is stored
in long-term memory by rehearsal. However, repetition is not enough to learn information well. If
information is not meaningful it is more difficult to remember. If information is meaningful and
familiar, it can be related to existing structures and more easily incorporated into memory. There
are two main theories of forgetting: decay and interference (Dix et al., 1993). The first theory
suggests that the information held in long-term memory may eventually be forgotten. The second
theory is that information is lost from memory through interference - if we acquire new
information it causes the loss of old information. It is debatable whether we ever actually forget
anything or whether it becomes increasingly difficult to access certain items from memory. There
are two types of information retrieval: recall, and recognition. In recall the information is
reproduced from the memory. Recall can be assisted by the provision of retrieval cues which
enable the subject to quickly access the information in memory. In recognition, the presentation of
the information provides the knowledge that the information has been seen before.
Unlike working memory there is little decay: long-term recall after minutes is the same as that
after hours or days. Human memory, however, is by no means infallible. It seems we find some
things relatively easy to remember, while others are very difficult to remember. When we interact
J. Kuljis User Interfaces and Discrete Event Simulation Models Page 169
Chapter 5: HCI Relevance to Simulation Systems
with a computer system we find some operations are straightforward and take minimal effort to
memorise, while others take forever to learn and often are forgotten soon after they have been
used. The extent to which new material can be remembered depends on its meaningfulness.
Within psychological research a number of factors have been found to contribute towards the
meaningfulness of a stimulus such as the familiarity of an item and its associated imagery (the
ability with which the stimulus can elicit images in one’s mind).
The fact that certain items are more meaningful than others and thus more memorable has
obvious implications for interface design. Interface design should comply with this notion, with
the goal of making the interface as meaningful as possible. There are some problems, however.
For example, how do we determine what is a meaningful name or icon, or how to use familiar and
meaningful items in a less familiar computing domain. There are many recommendations and
guidelines on how we can select meaningful command names or icons. A general guideline for the
selection of command names is to consider the contextual, cultural, and user characteristics. The
meaningfulness of icons is determined by the context in which the icon is being used, the task for
which it is being used, the surface form of representation, and the nature of the underlying
concept that is being represented (Preece et al., 1994).
One of the most well-established findings in memory research is that we can recognise
material far more easily than we can recall it from memory. This phenomenon has been employed
in designing user interfaces during the last decade. There has been a shift towards designing
interfaces where the amount of information users are required to recall has been reduced in favour
of requiring them to recognise the information that is needed to perform a task. The use of
graphical interfaces has resulted in a substantial reduction in the amount of mental effort that is
required to interact with systems (Preece et al., 1994). In many situations the intuitive direct feel
of the interface means that users do not have to think about what they are doing or remember
sequences of commands. Instead users need primarily to learn how to interact with the simulated
world of objects. Much of the information of the system’s structure and functionality is available
at the interface, meaning that the users do not have to remember much. Instead they can let the
interface do the remembering for them.
J. Kuljis User Interfaces and Discrete Event Simulation Models Page 170
Chapter 5: HCI Relevance to Simulation Systems
Processing
Humans are able to use information to reason and solve problems, and indeed do these activities
when the information is partial or unavailable. We are able to think about things of which we have
no experience, and solve problems which we have never seen before. We can distinguish two
categories of thinking: reasoning and problem-solving. In practice these are not distinct since the
activity of solving a problem may well involve reasoning and vice versa. Reasoning is the process
by which we use knowledge we have to draw conclusions or infer something new about the
domain of interest There are a number of different types of reasoning that we use in everyday life:
deductive, inductive, and abductive. Deductive reasoning derives the logically necessary
conclusion from the given premises. Induction is generalising from cases we have seen, to infer
information about cases we have not seen. In spite of its unreliability, induction is a useful
process, which we use constantly in learning about our environment. Abduction reasons from a
fact to the action or state that might have caused it. This is the method we use to derive
explanations for the events we observe. In spite of its unreliability, it is clear that people do infer
explanations in this way, and hold onto them until they have evidence to support an alternative
theory or explanation. This can lead to problems in using interactive systems (Dix et al., 1993). If
an event always follows an action, the user will infer that the event is caused by the action unless
evidence to the contrary is made available. If, in fact, the event and the action are unrelated,
confusion and even error often results.
If reasoning is the means of inferring new information from what is already known, problem
solving is the process of finding a solution to an unfamiliar task, using the knowledge we have.
Human problem-solving is characterised by the ability to adapt the information we have to deal
with new situations. There are two main theories of how people solve problems. The earliest one
is the Gestalt view that problem solving is both productive and reproductive. Reproductive
problem-solving draws on previous experience whereas productive problem-solving involves
insight and restructuring of the problem. A second major theory, proposed by Newell and Simon
(1972), was problem space theory, which takes the view that the mind is a limited information
processor. The problem space comprises problem states, and problem-solving involves generating
these states using legal state transition operators. The problem has an initial state and a goal state
and people use the operators to move from the former to the latter. However, such problem spaces
J. Kuljis User Interfaces and Discrete Event Simulation Models Page 171
Chapter 5: HCI Relevance to Simulation Systems
may be huge, and so heuristics are employed to select appropriate operators to reach the goal. One
such heuristic is means-ends analysis where the initial state is compared to the goal state and an
operator chosen to reduce the difference between the two. An important feature of Newell and
Simon’s model is that it operates within the constraints of the human processing system, and so
searching the problem space is limited by the capacity of short-term memory, and the speed at
which information can be retrieved (Dix et al., 1993). A third theory is the consideration of
analogy in problem-solving. Novel problems are solved by mapping knowledge relating to a
similar known domain to the new problem - called analogical mapping. Similarities between the
known domain and the new one are noted and operators from the known domain are transferred to
the new one. However, it seems that people often miss analogous information, unless it is
semantically close to the problem domain.
Not all problem solving deals with unfamiliar problems. Much of the time the problems that
we face are not completely new, instead we gradually acquire skill in a particular domain area.
One model of skill acquisition is Anderson’s (1983) ACT (Architecture Cognition Theory) model
which identifies three levels of skill:
1. The learner uses general-purpose rules which interpret facts about a problem.
2. The learner develops rules specific to the task.
3. The rules are tuned to speed up performance.
The first stage uses knowledge extensively. The second stage relies upon known procedures.
The third stage represents skilled behaviour, that may in fact become automatic and as such be
difficult to explain. Such skilled behaviour is efficient but may cause errors when the context of
the activity changes. If a pattern of behaviour has become automatic and we change some aspect
of it, the more familiar pattern may break through and cause an error.
The psychological principles and properties that we have discussed in this section apply to the
majority of people. However, we should be aware that, although we share processes in common,
humans, and therefore users, are not the same and that we have to account for these individual
differences as far as possible within our interface design. These differences may be long term,
such as sex, physical capabilities, and intellectual capabilities, or short term such as effect of
J. Kuljis User Interfaces and Discrete Event Simulation Models Page 172
Chapter 5: HCI Relevance to Simulation Systems
stress or fatigue on the user. Interface design should be designed for the target group who will be
adversely affected by our decision.
5.2.2 The Interaction
Human-computer interaction tasks have often been described as problem-solving tasks. Possibly
the most influential model of interaction is Norman’s execution-evaluation cycle. The user
formulates a plan of action which is then executed at the computer interface. When the plan, or
part of the plan, has been executed, the user observes the computer interface to evaluate the result
of the executed plan, and to determine further actions. Norman (1986) identifies the following
seven stages through which the user would pass in order to solve the problem (say, some word
processing of a memo) posed by a human-computer interaction task (the stages are not necessarily
performed sequentially):
• Establishing the goal (to reorder the paragraphs in the memo to make it more readable).
• Forming the intention (the user may intend to move paragraph 1 behind paragraph 3).
• Specifying the action sequence (e.g., highlight paragraph 1, use a menu to ‘cut’ the
paragraph, move the cursor behind paragraph 3, and use the menu to ‘paste’ paragraph
1).
• Executing the action sequence (execute the above steps).
• Perceiving the system state (user perceives the changes shown on the screen).
• Interpreting the state (the user determines the consequences of changes).
• Evaluating the system state with respect to the goals and intentions (the user evaluates
whether the recorded memo makes it more readable).
In contrast, Suchman (1987) holds the view that however planned, purposeful actions are
inevitably “situated actions” (actions taken in the context of particular, concrete circumstances).
She argues that our actions, while systematic, are never planned in the strong sense and that plans
are best viewed as a weak resource for what is primarily ad hoc activity. It is only when we are
pressed to account for the rationality of our actions, given the biases of European culture, that we
invoke the guidance of a plan. Stated in advance, plans are necessarily vague, insofar as they must
J. Kuljis User Interfaces and Discrete Event Simulation Models Page 173
Chapter 5: HCI Relevance to Simulation Systems
accommodate the unforeseeable contingencies of particular situations. Reconstructed in retrospect,
plans systematically filter out precisely the particularity of detail that characterised situated actions,
in favour of those aspects of the actions that can be seen to accord with the plan. However,
Norman makes a contribution by placing his stages in the context of ‘cycles of action’ and
‘evaluation’. The seven-stages model leads naturally to identification of the mismatch between the
user’s intention and allowable actions, and the mismatch between the system’s representation and
the user’s expectations (Shneiderman, 1992).
The seven-stages model leads Norman (1986) to suggest four principles of good design.
First, the state and the action alternatives should be visible. Second, there should be a good
conceptual model with a consistent system image. Third, the interface should include good
mappings that reveal the relationships between stages. Fourth, the user should receive continuous
feedback. Norman places heavy emphases on studying errors. He describes how errors often
occur in moving from goals to intentions to actions and to execution. Norman’s model is a useful
means of understanding the interaction, in a way which is clear and intuitive. It considers the
system as far as the interface and concentrates wholly on the user’s view of the interaction,
ignoring how to deal with the system’s communication through the interface.
This problem is addressed by Abowd and Beale (1991) in their interaction framework. The
interaction framework describes the interaction in terms of its four main components: the system,
the user, the input, and the output. Each component has its own language. As the interface sits
between the user and the system, there are four steps in the interactive cycle, each corresponding
to a translation from one component to another. The user begins the interactive cycle with the
formulation of a goal and task to achieve that goal. The only way the user can manipulate the
machine is through the input, and so the task must be articulated within the input language. The
input language is translated into the system’s core language as operations to be performed by the
system. The system then transforms itself as described by the operation translated from the input;
the execution phase of the cycle is complete and the evaluation phase now begins. The system is
in a new state, which must now be communicated to the user. The current values of system
attributes are rendered as concepts or features of the output. It is then up to the user to observe the
output and assess the results of the interaction relative to the original goal, ending the evaluation
phase and, hence, the interactive cycle. There are four main translations involved in the
J. Kuljis User Interfaces and Discrete Event Simulation Models Page 174
Chapter 5: HCI Relevance to Simulation Systems
interaction: articulation, performance, presentation, and observation. The interaction framework is
presented as a means to judge the overall usability of an entire interactive system. In reality, all of
the analysis that is suggested by the framework is dependent on the current task (or set of tasks) in
which the user is engaged.
S 3 Some Design Issues
The prevailing concern of HCI researchers is to ensure the usability of interactive computer
systems. All design issues basically deal with system usability. Like software engineers, many
HCI authors think that we shall get it ‘right’ if we follow some prescribed set of procedures or
rules. Consequently a large volume of HCI literature is dedicated to design guidelines. Therefore,
in this section we first examine which processes for ensuring usability are proposed by HCI.
After that follows some discussion on design guidelines.
5.3.1 The Process of Ensuring Usability
The primary objective of an interactive system is to allow the user to achieve particular goals in
some application domain. This means that the interactive system must be usable. In this section
we therefore concentrate on how design practice addresses this critical feature of an interactive
system from the human perspective. According to Dix et al. (1993) the designer of an interactive
system is posed with two open questions:
• How can an interactive system be developed to ensure its usability?
• How can the usability of an interactive system be demonstrated or measured?
and argue that there are two approaches to answering these questions. The first is by means of
example, in which successful interactive systems are commonly believed to enhance usability and,
therefore, serve as paradigms for the development of future products. The second approach is
more theoretically driven, deriving abstract principles for effective interaction from knowledge of
the psychological, computational, and sociological aspects of the problem domains. In order to
promote the usability of interactive systems Dix et al. (1993) identify the following groupings of
general principles which can be applied to the design of an interactive system:
J. Kuljis User Interfaces and Discrete Event Simulation Models Page 175
Chapter 5: HCI Relevance to Simulation Systems
• Leamability: the ease with which new users can begin effective interaction and achieve
maximal performance. The specific principles which support leamability are:
predictability (the user’s knowledge of the interaction history is sufficient to determine
the result of his future interaction with the system); synthesisability (the ability of the
user to assess the effect of past operations on the current state); familiarity (the extent to
which a user’s knowledge and experience in other real-world or computer-based
domains can be applied when interacting with a new system); generalisibility (the
support for the user to extend knowledge of specific interaction within and across
applications to other similar situations); and consistency (likeness in input/output
behaviour arising from similar situations to other similar situations).
• Flexibility: the multiplicity of ways the user and system exchange information. The
following principles contribute to the flexibility of interaction: dialogue initiative
(allowing the user freedom from artificial constraints on the input dialogue imposed by
the system); multi-threading (ability of the system to support user interaction pertaining
to more than one task at a time); task migratibility (the ability to transfer control for
execution of tasks between system and user); substitutivity (allowing equivalent values
of input and output to be arbitrarily substituted for each other); and customisability
(allowing the user or the system to modify the user interface).
• Robustness: the level of support provided to the user in determining successful
achievement and assessment goals. The following principles support robustness of
interaction: observability (allowing the user to evaluate the internal state of the system
by means of its perceivable representation at the interface); recoverability (ability of the
user to take corrective action once an error has been recognised); responsiveness (how
the user perceives the rate of communication with the system); and task conformance
(the degree to which the system services support all of the tasks the user wishes to
perform and in the way that the user understands them).
Bearing in mind that interactive systems have to be usable the question that arises is, then,
what design approach the systems designers should adopt to ensure usability? Producing a usable
interface is an extremely complex and difficult task. It is usually filled with conflicts, trade-offs,
and situational interpretations. Over the years several kinds of user interaction design guidance
J. Kuljis User Interfaces and Discrete Event Simulation Models Page 176
Chapter 5: HCI Relevance to Simulation Systems
have evolved. Guidelines and rules for interaction design can be found in some of the more recent
books (Shneiderman, 1992; Marcus, 1992; Mayhew, 1992; Apple Computer, 1992; Cox and
Walker, 1993; Lindgaard, 1994). Hix and Hartson (1993) claim that knowing the guidelines or
having a style guide is not sufficient and that a poor understanding of the user interface
development process accounts for many of the usability problems found in interactive systems.
They justly emphasise that ensuring usability in an interface requires attention to two main
components: the product and the process. In this context the product is the user interface itself: its
content, plus human factors issues, design guidelines, and interaction styles represented in the
content. The process involves the life cycle, methods, techniques, and tools that are used in
developing a user interface. In this research we are interested mainly in the product. The idea
behind this is that we first have to establish what kind of interaction paradigms may provide
simulation model developers with more affective and efficient simulation modelling environments.
The process of the system development deals with issues often studied in software engineering
with a special emphasis on ensuring system usability through its user interface. Therefore, the
design of interface interaction is placed within the existing life cycles or new ‘more appropriate’
ones are proposed. Expanding our research in that direction would require much more time and
effort than is available and would distract us from our main research goal.
5.3 .2 Design Guidelines
At least four kinds of information related to human factors heavily influence the product (Hix and
Hartson, 1993): standards, design guidelines, commercial style guides, and customised style
guides. In this context standards are official, publicly available documents that give requirements
for user interaction design. Standards must be very general and simple to offer effective guidance
and, therefore, require much interpretation and tailoring to be useful in user interaction design.
Standards must be followed when designing the user interaction, as they are enforceable by
contract or by law.
Guidelines, often called the common sense part of user interaction design, are published in
books, reports, and articles that are publicly available. Guidelines are general in their applicability
and require a fair amount of interpretation to be useful. Their main advantage is to offer flexible
J. Kuljis User Interfaces and Discrete Event Simulation Models Page 177
Chapter 5: HCI Relevance to Simulation Systems
guidance and to help establish design goals and decisions, but they must be tailored in order to
produce specific design goals (Hix and Hartson, 1993).
Commercial style guides are documents that are typically produced by one organisation or
vendor and are made commercially available. A style guide typically includes the following: a
description of a specific style or object, including its “look” (appearance) and “feel” (behaviour),
and guidance on when and how to use a particular interaction style or object. A style guide can
provide the basic conventions for a specific product or for a family of products (e.g. Apple
Computer, Inc. “Macintosh human interface guidelines”, 1992). Commercial style guides are very
specific and if well written will not require too much interpretation. Their main advantage is to
improve consistency of the user interaction design.
A customised style guide is very specific to a particular application or set of applications
within an organisation or group. Its main advantage is providing consistent, explicit,
unambiguous information for design, but it lacks the general broad applicability that can be needed
to deal with contingencies where specific design rules may cause conflicts. Some customised style
guides are beginning to be primarily graphic design standards that provide a corporate look while
maintaining a generic feel (Hix and Hartson, 1993).
Hardware design standards are both widespread and useful in the sense that they give a clear
indication of design requirements and constraints to be met, either via contracts or through
legislation. Hardware standards tend to be related to human physiology (e.g. optimal size of
characters on the screen is determined by the limits to human vision). By contrast, software
standards relate almost exclusively to psychology. Much more is known about physiology than
about psychology, where it is very hard to translate what we know into something useful. Also,
little is known about the limitations or boundaries of existing knowledge. This makes it very
difficult to generate good, reliable standards for the design of software (Lindgaard, 1994).
Consequently, hardware design standards are clear and specific whereas software standards are
vague and general.
Design guidelines are generally stated recommendations with examples, added explanations,
and other commentary selected and perhaps modified, for any particular system application, and
adopted by agreement among people concerned with interface design. Like principles, guidelines
J. Kuljis User Interfaces and Discrete Event Simulation Models Page 178
Chapter 5: HCI Relevance to Simulation Systems
must be translated in the process of describing specific design rules, which would then be
reviewed and approved to constitute detailed design specifications for a particular application. It is
still better to rely on the informed judgement contained in guidelines, incomplete, vague, and often
contradictory as they are, than on the less informed intuition of individual designers for achieving
good usable computer systems. Even though guidelines are general in nature, they cover many
different facets that must be taken into consideration when designing user interaction. Developing
and/ or using a style guide, with specific rules, is not sufficient to ensure usability in an interface.
The process by which that information is used, and the way in which the resulting interfaces are
evaluated, constitutes a major portion of the effort involved in ensuring usability in an interface.
Shneiderman’s (1992) ‘eight golden rules’ of dialogue design are a good starting point for any
user interface design, including simulation systems: strive for consistency; enable frequent users
to use shortcuts; offer informative feedback; design dialogues that yield closure; offer simple error
handling; permit easy reversal of actions; support internal locus of control; and reduce short term
memory load. These underlying principles of interface design that are applicable to most systems,
including simulation systems, must be interpreted, refined, and extended for each environment.
Other similar general interface principles provided by Molich and Nielsen (1990) were discussed
in chapter 4 in the context of the case study. If we analyse current simulation systems we can find
that many of these rules are not obeyed, particularly user interface consistency, informative
feedback provision, easy reversal of actions, and keeping the short memory load to a minimum.
Other rules can help software designers in screen layout design, on-line help design, form fill-in
design, use of colour, use of interaction devices, navigation through the interface, provision of
feedback, error messages, and so on. Most of the issues were already discussed in the previous
chapters and were placed into the context of user interface design in chapter 4.
User interaction guidelines are not enforceable in a user interface but serve more as common-
sense suggestions on how to produce a good interface. The most influential compilation of
guidelines was given by Smith and Mosier (1986). It is organised around several major headings,
such as Data Entry, Data Display, Sequence Control, User Guidance, Data Transmission, and
Data Protection. These guidelines are quite thorough but most of them are strongly oriented
toward non windowed, alphanumeric terminal interaction, without much attention given to
graphical windowing interfaces. Since the publication of their guidelines, windowed systems and
J. Kuljis User Interfaces and Discrete Event Simulation Models Page 179
Chapter 5: HCI Relevance to Simulation Systems
graphical interfaces have become more or less standard in most interactive computer systems.
Today, most of the books agree that guidelines must emphasise the following: practice of user-
centred design; developing a good system model; need for consistency and simplicity; taking into
account human memory issues and cognitive issues; provision of system feedback; usable system
messages; modality; provision of reversible actions; methods for getting the user’s attention;
display issues; and individual user differences. These are discussed in more detail in turn below.
User-centred design
User-centred design (Norman and Draper, 1986) is a design of the interaction from the view of
the user, rather than the view of the system. Producing effective user interaction requires focusing
on what is best for the user, rather than what is quickest and easiest to implement. Unfortunately,
what is best for the user is rarely easiest for the interaction designer to design or for the
programmer to implement. Therefore, the design should be tailored to facilitate the use that a user
will make of the system. To accomplish user-centred design the first and most important condition
is to “know the user” (Shneiderman, 1992). It means to know and understand the characteristics
of the classes of users that will be using a particular interface. To achieve this there are such
techniques as user analysis, task analysis, information flow analysis, etc.
It is now widely recognised that involving the user in interaction development (“participatory
design”) is a key to improved usability of the interface (Galer et al., 1992; Shneiderman, 1992;
Hix and Hartson, 1993). Users can help designers understand the nature of the tasks they perform
and give opinions and suggestions on the proposed interaction design. An important issue in user-
centred design is the prevention of user errors. The design should be made to anticipate potential
problem areas and help the user avoid mistakes. Many graphical user interfaces help the user
avoid errors by making erroneous choices unavailable (e.g., greying out menu choices or buttons
when they are not available). The design should help the user to optimise required operations in
achieving a task. This often means more flexible interaction design that makes provisions for new
as well as for sophisticated users. Another important guideline in user-centred design is the
provision of help for users to start the system, and keeping the locus of control with the user.
J. Kuljis User Interfaces and Discrete Event Simulation Models Page 180
Chapter 5: HCI Relevance to Simulation Systems
System model
A user interface has to give the user a mental model of the system, based on user tasks. A system
model sets the architectural framework for a system. It typically is device-, data-, and operation-
oriented and represents flow of data and operations performed on those data (Hix and Hartson,
1993). This maps into a conceptual model, which is the view of the typical sequencing and
functionality being offered to a user by a system. This, in turn, translates into a user’s mental
model, which is how a user perceives a system. The mental model governs how a user
understands a system and interacts with it. A consistent user mental model, based on the tasks a
user performs, will guide a user in accomplishing tasks in a general way. Visual cues can be
especially effective in helping a user understand the system model and thereby formulate a mental
model. Eberts (1994) suggests that the use of graphics for representing physical systems can be
placed into the context of stimulus-central processing-response (S-C-R) compatibility.
S-C-R compatibility theory emphasises the role of cognitive mediators, between the stimulus
and response, in human information processing. An important part of the S-C-R theory is that
different tasks have different representation codes associated with them. The theory has shown
that the code of representation of a task is important for theoretical explanations of human
performance in complex situations. If the system being represented on an interface has a simple
physical reference, as would occur for any physical system such as a manufacturing facility or an
outpatient hospital clinic, then the central processing code is spatial. For the stimulus, or the
display representation, to be compatible with central processing, the display must use graphics or
an analogue picture. To continue the compatibility to the response stage, the response must be a
manual response (Eberts, 1994). The best kind of response would be to point to the graphical
object on the display with a pointing device such as a mouse. If text is used for spatial
information, the S-C-R compatibility theory shows that this can cause problems because the
stimulus will be incompatible with the central processing (Eberts, 1994). Correcting this
incompatibility is then left to the user who would have to perform mental transformations on the
data to get it into a form which is compatible with central processing. Mental transformation can
be a source of errors if the transformation is performed incorrectly. S-C-R compatibility theory
can be directly applied to most simulation systems that represent physical systems and therefore
require spatial representations.
J. Kuljis User Interfaces and Discrete Event Simulation Models Page 181
Chapter 5: HCI Relevance to Simulation Systems
Consistency
It is agreed by many researchers (Shneiderman, 1992; Hix and Hartson, 1993; Dix et al., 1993;
Eberts, 1994) that consistency is one of the most significant factors affecting usability. Users
expect certain aspects of an interface to behave in certain ways, and when that does not happen, it
can be very confusing. For similar semantics in an interface, similar syntax should be used, and
vice versa. Consistency can have many different interpretations. Consistency by one criterion can
conflict with consistency by another. Some of the newer simulation software that are developed
for Windows or Macintosh environments have to follow conventions and guidelines imposed by
the host environment. This usually means some sort of consistency within an application.
Standard features like windows and menu systems comply with these standards. That is not
always the case when it comes to fill-in forms, feedback, error messages, and on-line help
provision. However, it has to be recognised that across application consistency is not always
possible or even desirable.
Grudin (1989) distinguishes three types of consistency: the internal consistency of design with
itself; the external consistency of a design with other interface designs familiar to a user; and an
external analogic or metaphoric correspondence of design to features in the world beyond the
computer domain. He argues that interface objects must be designed and placed in accordance
with user’s tasks. When a user interface becomes our primary concern, our attention is directed
away from its proper focus: users and their work. Grudin (1989) thinks that focusing on
consistency may encourage the false hope that good design can be found in properties of the
interface. We also think that the famous maxim “strive for consistency” (Shneiderman, 1992)
should be used as a guideline when and if appropriate, but that it should not be forced on the
designers. There is little doubt that some form of consistency has to be enforced like, for example,
consistent use of terminology, abbreviations, consistent use of function keys or mouse buttons,
consistent use of buttons for CANCEL, ENTER, HELP etc. These guidelines are not often
followed in current simulation systems as was demonstrated by the example of the use of
CANCEL in WITNESS (section 2.3.7).
J. Kuljis User Interfaces and Discrete Event Simulation Models Page 182
Chapter 5: HCI Relevance to Simulation Systems
Capacity of short-term memory
The capacity and duration of a human’s short-term or working memory must be taken into account
when designing user interaction (Olson, 1987; Shneiderman, 1992). An interaction design should
limit the number of items a user has to deal with at any particular moment. Information on screens
should be organised so that a user does not have to buffer information from one screen to the next
by remembering it or writing it down. An important consideration in interaction design should be
given to how humans should handle interruptions while they are performing a task. Large tasks
should be decomposed into smaller tasks for the user. Short linear sequences of actions by the
user will facilitate task closures and should not require a user to mentally transfer much
information from one sequence to another. A good design can guide the user through tasks with
mileposts (e.g., short messages) indicating closure while maintaining status and presenting what
may be done next (Hix and Hartson, 1993). Human memory limitations can also be overcome in
interaction design by using recognition, rather than recall.
Cognitive directness involves minimising mental transformations that a user must make.
Minimisation of mental transformations by a user can be accomplished by the use of appropriate
mnemonics, or memory aids. Appropriate visual cues, such as the layout of arrow keys and
carefully designed graphical icons, also contribute to cognitive directness. By using situations,
words, pictures, and metaphors that are natural and known to most users, a user’s expectations
about an interface are supported, and cognitive directness is increased. In the case of simulation
systems this recommendation implies that the visual representation of the ‘real’ system being
modelled should as much as possible mimic reality, i.e. icons should be recognisable objects from
the real world and the model layout should preserve real world spatial relationships.
Feedback
Effective feedback is a part of the interaction that has a significant impact on the user. When users
perform actions, they want to know what happened. Barfield (1993) categorises feedback
supplied by an interactive system according to its relationship in time to:
J. Kuljis User Interfaces and Discrete Event Simulation Models Page 183
Chapter 5: HCI Relevance to Simulation Systems
• Future feedback: this is feedback about an interaction that is supplied to the user before
the interaction is carried out. Basically it tells the user what will happen if they do a
particular thing.
• Present feedback: This is feedback about an interaction supplied during the interaction.
This tells the user what is happening.
• Past feedback. Past feedback is supplied after the interaction and it gives the user
information about what has happened; how the system has changed or is changing as a
result of this interaction.
These three types of feedback are useful in all sorts of situations. There are strong links
between the presentation of information, user models, and feedback. The user builds up mental
models based upon the presentation of information. Presentation of information relating to the
behaviour of the system is the feedback, and it is the feedback part of the presentation that helps
the user build up a good user model. Hix and Hartson (1993) point out that a user often needs
both articulatory feedback and semantic feedback. Articulatory feedback tells users that their hands
worked correctly, while semantic feedback tells them that their heads worked correctly. Visual
cues, either textual or graphical, are most commonly used for feedback. Mayhew (1992) points
out that the system should also provide appropriate status indicators. Whenever the system is
performing a potentially lengthy process, a user should be given feedback that the system is
working, especially if the user cannot interact with the system while a system process is in
progress. The status indicator should disappear automatically, on completion of the process.
When displaying system messages user-centred wording should be used. Shneiderman (1992)
forewarns that users should be protected from system-related jargon, especially information
presented in a way that is confusing or threatening. The communication with the user should be in
terms of their task and in words that are familiar to them. Error messages should use positive, non
threatening wording and be as specific as possible. Error messages should give to the user
constructive, helpful messages, but be brief and concise. They should not make users feel guilty.
Instead, the system should take the blame for errors.
J. Kuljis User Interfaces and Discrete Event Simulation Models Page 184
Chapter 5: HCI Relevance to Simulation Systems
Modality
A mode is an interface state in which a user action has a different meaning (and result) than it has
in some other state (Cox and Walker, 1993). Modality is virtually impossible to avoid in
interaction designs. When it is used, the designer should be careful to distinguish different
interaction modes for the user, so that the user clearly knows at all times which mode is active.
Visual cues are often a good approach to distinguish such modes. For example, in a modal
graphical editor, the shape of the cursor might change to indicate whether the editor is in the mode
for creating circles or lines. A pre-emptive mode is one in which a user must complete one task
before going to another. There are modal (pre-emptive) and modeless dialogue boxes, for
example. Most of the time, pre-emptive modes are to be avoided, except when a user must commit
to a response before a task can proceed. This guideline is the one that is often violated in
simulation systems. The examples include fill-in forms in WITNESS and in Taylor n.
Reversible actions
User actions should be made easily reversible. This could be ‘undo’ commands, usually available
in direct manipulation interfaces. Such ‘undo’ commands allow users to reverse undesirable or
accidental actions they may make. Reversibility also applies to actions for navigating through the
system. Users should be able to return to at least the previous screen they came from, to cancel a
task without having to complete it, or exit or quit from the application from any point in the
system. Such mechanisms for allowing users easily to reverse actions will encourage exploration
of a system.
Methods for getting the user’s attention
Guidelines for getting the user’s attention advocate applying a sensible judgement. There are many
ways to get a user’s attention while working with an interface. These techniques are among the
easiest to overuse and misuse. For text, the general rule is to use only two levels of intensity on a
single screen and to use underlining, bold, inverse video, and other forms of marking sparingly.
For predominantly text screens, generally no more than three different fonts should be used on a
J. Kuljis User Interfaces and Discrete Event Simulation Models Page 185
Chapter 5: HCI Relevance to Simulation Systems
single screen, and no more than four different font sizes on a single screen. Upper and lower case
letters should be used as in a normal sentence (Mayhew, 1992). All uppercase letters slow down
reading speed by more than 10% (Hix and Hartson, 1993). Blinking should be used sparingly
and only for very important items. Audio can be used as a cue for important events and is often
effective as a redundant output channel when one channel might not be enough, as when the user
might not see an important message that appears on a rather busy screen.
Colour is perhaps the single most overused feature in user interaction designs. It is often a
good idea to design for monochrome screens first (Cox and Walker, 1993). The point is that the
layout and content of the user interaction should make sense independently of colour. Generally,
no more than four different colours should be used on a single screen, especially if it is mostly
text, and no more than seven different colours throughout a single application (Cox and Walker,
1993). Colour can be used effectively as a coding technique, but it should be used conservatively.
Colour will also effectively call attention to important or changing information. A familiar colour
conventions coding should be considered. If colour has not been used significantly in the design,
then it is usually acceptable to give users control over their own colour choices. Most of the above
colour guidelines are broken by most simulation systems!
Display issues
General guidelines on designing information at the interface are given in Preece et al. (1994):
• important information which needs immediate attention should always be displayed in a
prominent place to catch the user’s eye (e.g. alarm and warning messages);
• less urgent information should be allocated to less prominent but specific areas of the
screen so that the user will know where to look when this information is required (e.g.
reports and reference material);
• information that is not needed very often (e.g. help facilities) should not be displayed
but should be made available on request.
A good interaction design changes as little as possible from one screen to the next (Mayhew,
1992). Static objects such as buttons, words, and icons that appear on many screens should
J. Kuljis User Interfaces and Discrete Event Simulation Models Page 186

Chapter 5: HCI Relevance to Simulation Systems
always appear in exactly the same location on all screens, for consistency. Display inertia is
important primarily in location, shape, and size of objects, but not necessarily in the labels, default
indicators, and so on. Elimination of unnecessary information can greatly simplify a screen
design. Using concise wording of instructions, messages, and other text, or easy-to-recognise
icons can help with this. Minimising the overall density of the screen, especially for text, is
important, as is minimising the local density in subareas of the screen. A balanced layout of the
display should avoid having too much information at the top or bottom, left or right of the screen.
Plenty of white (empty) space should be used, especially around blocks of text (Tullis, 1988).
Related information should be grouped logically on the screen, using wording and icons that are
familiar to the user. Organisation and layout of a screen display can have a dramatic affect on user
performance.
Use o f animation
Computer animation has been an important topic of study in the computer graphics field for over
20 years. The application of animation to user interfaces, however, is just now receiving attention
by researchers and developers. Baecker and Small (1990) detail the motivation for using
animation in interfaces, listing eight significant uses of animation:
• Identification. Animation can help focus attention on an item of interest or help identify
what an application does.
• Transition. Animation can help orient users to state changes within an application or
system.
• Choice. Animation can be used to cycle through and enumerate a set of actions or
options within an application.
• Demonstration. Animation can help illustrate the actions and results of dynamic
operations in a more direct manner than a static depiction.
• Explanation. Animation can be used to build dynamic tutorials that depict sequencing
scenarios within user interfaces.
• Feedback. Animation can help convey the changing status of an activity within an
application.
J. Kuljis User Interfaces and Discrete Event Simulation Models Page 187
Chapter S: HCI Relevance to Simulation Systems
• History. Animation can be used to present the sequence of steps or operations that were
carried out to arrive at the current condition.
• Guidance. Animation can be used to illustrate the series of actions necessary to achieve
the user’s goal within an interface.
Relatively little research on assessing the effectiveness and appropriateness of animation in
interfaces has been conducted. It is still unknown what types of processes, tasks, states, etc., can
be well represented using animation, and exacdy which styles of animation best convey the
pertinent information. Stasko (1993) claims that, based on his research experience and intuition,
animation is best applied when portraying or illustrating the state of time-varying processes. That
is exactly how animation is used in visual simulation systems. Animation in the HCI literature is
often defined in different terms than in computer graphics and in simulation. For example, scroll
bars that move, dialogue boxes that pop up, and menus that pull-down have been characterised as
the presence of animation in interfaces. More rigorous definitions include examples such as an
analogue clock with a second hand that continually moves, or opening an application or a window
in window-based interface systems. When a new application is opened, it does not
instantaneously appear. Rather, a series of rectangular window outlines grow out of the chosen
application to the eventual target window destination. Deciding precisely when an interface
transforms from a static display into animation is debatable. Some people will only consider a
long sequence of gradually changing scenes to be animation. Others will deem a few appropriate
colour changes or cursor flashes to be animation. In any case, animation at its essence involves
smoothly changing positions or attributes of objects so that a viewer can observe the relationship
between time t and time t + At (Stasko, 1993).
In order to make an animation effectively convey the information intended, the animation must
be developed with certain key design principles in mind. Like any interface design, be it static or
dynamic, it must pay close attention to layout, use of colour and fonts, ease-of-use, naturalness
and so on. The dynamic nature of animation requires a new set of design principles. The
animation should provide a sense of context, locality, and the relationship between before and
after states. Stasko (1993) has identified four design principles for animation in user interfaces:
appropriateness, smoothness, duration/control, and moderation. The end users of the interface
will have their own mental model of the application and the operations involved. The objects
J. Kuljis User Interfaces and Discrete Event Simulation Models Page 188
Chapter 5: HCI Relevance to Simulation Systems
involved in an animation should depict application entities, and the animation actions should
appropriately represent the user’s mental model. This principle of appropriateness is directly
applicable to simulation models. When designing the model layout and the simulation entities one
should as much as possible use representations of the ‘real world’ problem being modelled. To
avoid the danger of forcing a software developer mental model, the user should have a facility to
exercise their own choice of icons and to design the model layout.
For an animation to be effective, a viewer must be able to perceive its actions and motions in a
clear manner. Smooth, continuous animation scenarios that preserve the context of the animation
as its motion occurs are easiest to follow. The principle of smoothness is more appropriate for
continuous simulation than it is for discrete event simulation. Different animation purposes dictate
the design of different animation duration and control models. For principles concerning duration
and control Stasko (1993) advocates that the user can set the animation’s speed, can pause the
animation when desired, and can even replay important sequences of the animation to reinforce the
material being conveyed. These principles are applicable to simulation and have been implemented
for some time in many simulation systems and are an integral part of any VIS. However, a replay
facility is not so widely available.
Use o f Data Graphics
Data graphics visually display measured quantities by means of the combined use of points, lines,
a co-ordinate system, numbers, symbols, words, shading, and colour. Modem data graphics can
do much more than simply substitute for small statistical tables. At their best, graphics are
instruments for reasoning about quantitative information (Tufte, 1983). Of all methods for
analysing and communicating statistical information, well designed data graphics are usually the
simplest and at the same time the most powerful. The use of graphics to represent quantitative
information is becoming increasingly popular. Some of the popular graphical techniques for
representing numeric data are: Scatter Plots; Line Graphs or Curves; Area, Band, Strata, or
Surface Charts; Bar Graphs, Column Charts, or Histograms; Stacked or Segmented Bar or
Columns; Pie Charts; Simulated Meters; and Start, Circular, or Pattern Charts. Tullis (1988) gives
a good overview of situations in which these techniques are commonly used (see Table 5.1).
J. Kuljis User Interfaces and Discrete Event Simulation Models Page 189
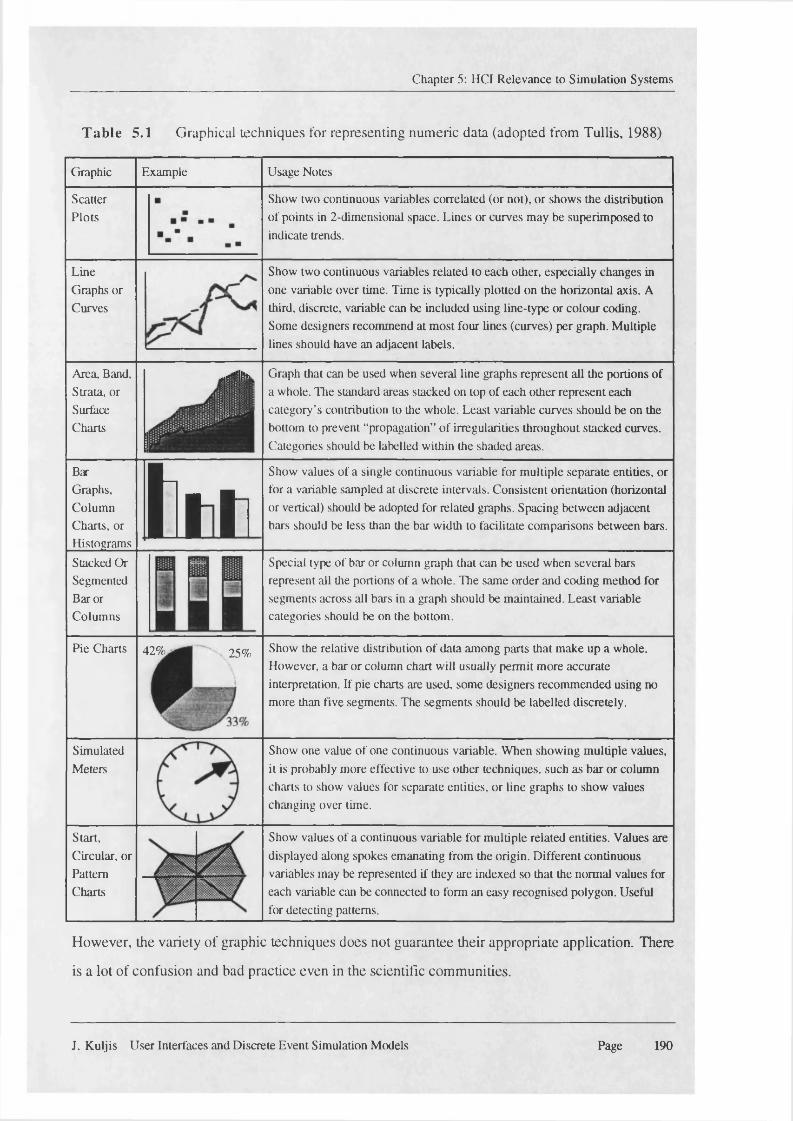
Chapter 5: HCI Relevance to Simulation Systems
Table 5.1 Graphical techniques for representing numeric data (adopted from Tullis, 1988)
Graphic Example Usage Notes
ScatterPlots
Show two continuous variables correlated (or not), or shows the distribution of points in 2-dimensional space. Lines or curves may be superimposed to indicate trends.
LineGraphs or Curves
Show two continuous variables related to each other, especially changes in one variable over time. Time is typically plotted on the horizontal axis. A third, discrete, variable can be included using line-type or colour coding. Some designers recommend at most four lines (curves) per graph. Multiple lines should have an adjacent labels.
Area, Band, Strata, or Surface Charts
Graph that can be used when several line graphs represent all the portions of a whole. The standard areas stacked on top of each other represent each category’s contribution to the whole. Least variable curves should be on the bottom to prevent “propagation” of irregularities throughout stacked curves. Categories should be labelled within the shaded areas.
BarGraphs, Column Charts, or Histograms
hiShow values of a single continuous variable for multiple separate entities, or for a variable sampled at discrete intervals. Consistent orientation (horizontal or vertical) should be adopted for related graphs. Spacing between adjacent bars should be less than the bar width to facilitate comparisons between bars.
Stacked Or Segmented Bar or Columns
Special type of bar or column graph that can be used when several bars represent all the portions of a whole. The same order and coding method for segments across all bars in a graph should be maintained. Least variable categories should be on the bottom.
Pie Charts 42% 25% Show the relative distribution of data among parts that make up a whole. However, a bar or column chart will usually permit more accurate interpretation. If pie charts are used, some designers recommended using no more than five segments. The segments should be labelled discretely.
SimulatedMeters
Show one value of one continuous variable. When showing multiple values, it is probably more effective to use other techniques, such as bar or column charts to show values for separate entities, or line graphs to show values changing over time.
Start,Circular, orPatternCharts
Show values of a continuous variable for multiple related entities. Values are displayed along spokes emanating from the origin. Different continuous variables may be represented if they are indexed so that the normal values for each variable can be connected to form an easy recognised polygon. Useful for detecting patterns.
However, the variety of graphic techniques does not guarantee their appropriate application. There
is a lot of confusion and bad practice even in the scientific communities.
J. Kuljis User Interfaces and Discrete Event Simulation Models Page 190
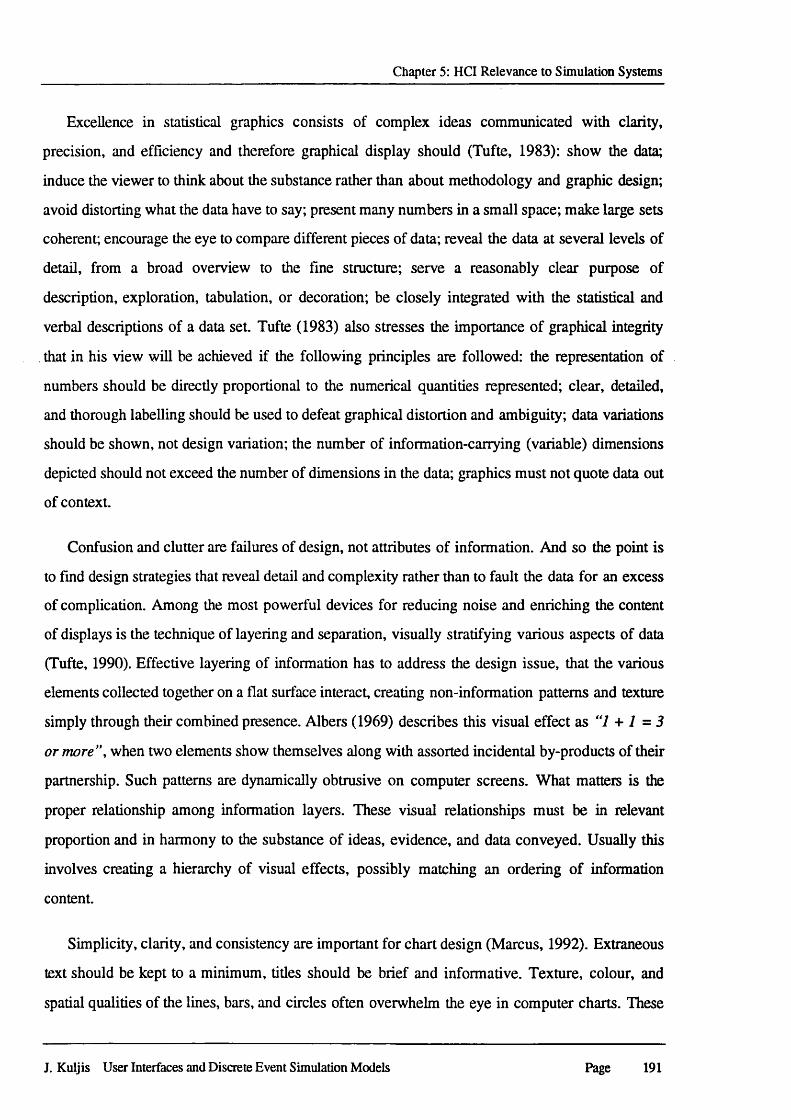
Chapter 5: HCI Relevance to Simulation Systems
Excellence in statistical graphics consists of complex ideas communicated with clarity,
precision, and efficiency and therefore graphical display should (Tufte, 1983): show the data;
induce the viewer to think about the substance rather than about methodology and graphic design;
avoid distorting what the data have to say; present many numbers in a small space; make large sets
coherent; encourage the eye to compare different pieces of data; reveal the data at several levels of
detail, from a broad overview to the fine structure; serve a reasonably clear purpose of
description, exploration, tabulation, or decoration; be closely integrated with the statistical and
verbal descriptions of a data set. Tufte (1983) also stresses the importance of graphical integrity
that in his view will be achieved if the following principles are followed: the representation of
numbers should be directly proportional to the numerical quantities represented; clear, detailed,
and thorough labelling should be used to defeat graphical distortion and ambiguity; data variations
should be shown, not design variation; the number of information-carrying (variable) dimensions
depicted should not exceed the number of dimensions in the data; graphics must not quote data out
of context.
Confusion and clutter are failures of design, not attributes of information. And so the point is
to find design strategies that reveal detail and complexity rather than to fault the data for an excess
of complication. Among the most powerful devices for reducing noise and enriching the content
of displays is the technique of layering and separation, visually stratifying various aspects of data
(Tufte, 1990). Effective layering of information has to address the design issue, that the various
elements collected together on a flat surface interact, creating non-information patterns and texture
simply through their combined presence. Albers (1969) describes this visual effect as ‘7 + 1 = 3
or more ”, when two elements show themselves along with assorted incidental by-products of their
partnership. Such patterns are dynamically obtrusive on computer screens. What matters is the
proper relationship among information layers. These visual relationships must be in relevant
proportion and in harmony to the substance of ideas, evidence, and data conveyed. Usually this
involves creating a hierarchy of visual effects, possibly matching an ordering of information
content.
Simplicity, clarity, and consistency are important for chart design (Marcus, 1992). Extraneous
text should be kept to a minimum, titles should be brief and informative. Texture, colour, and
spatial qualities of the lines, bars, and circles often overwhelm the eye in computer charts. These
J. Kuljis User Interfaces and Discrete Event Simulation Models Page 191
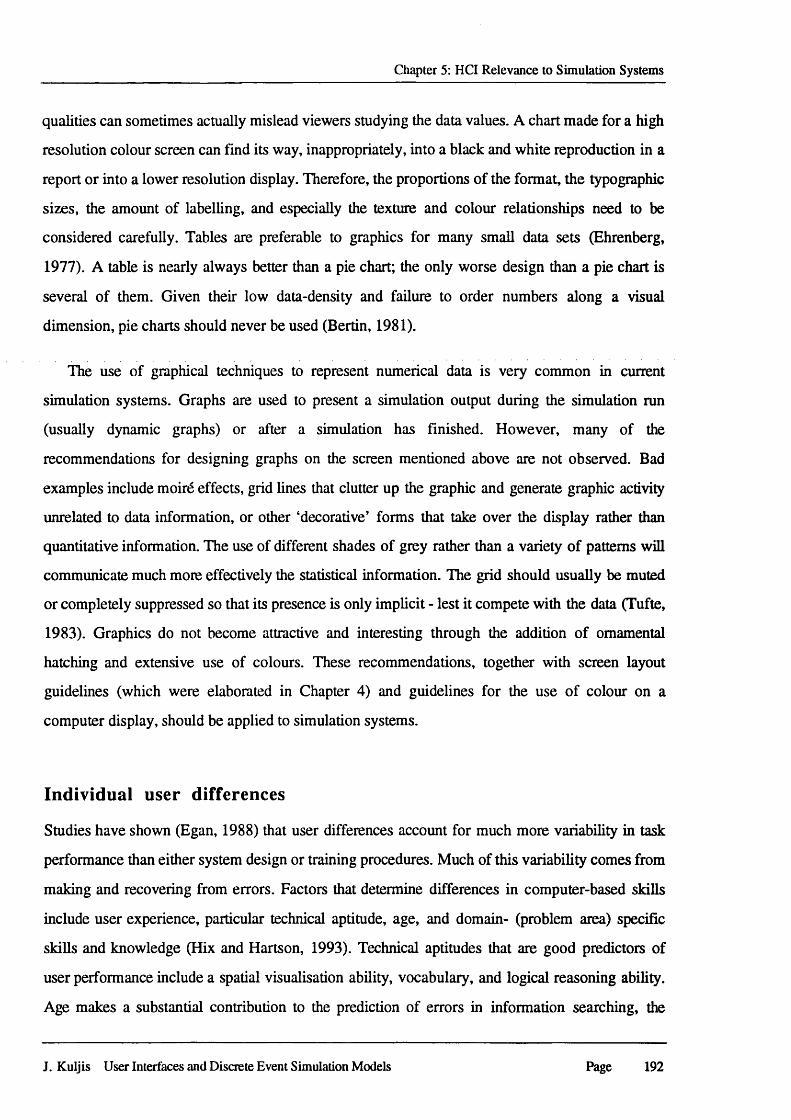
Chapter 5: HCI Relevance to Simulation Systems
qualities can sometimes actually mislead viewers studying the data values. A chart made for a high
resolution colour screen can find its way, inappropriately, into a black and white reproduction in a
report or into a lower resolution display. Therefore, the proportions of the format, the typographic
sizes, the amount of labelling, and especially the texture and colour relationships need to be
considered carefully. Tables are preferable to graphics for many small data sets (Ehrenberg,
1977). A table is nearly always better than a pie chart; the only worse design than a pie chart is
several of them. Given their low data-density and failure to order numbers along a visual
dimension, pie charts should never be used (Bertin, 1981).
The use of graphical techniques to represent numerical data is very common in current
simulation systems. Graphs are used to present a simulation output during the simulation run
(usually dynamic graphs) or after a simulation has finished. However, many of the
recommendations for designing graphs on the screen mentioned above are not observed. Bad
examples include moird effects, grid lines that clutter up the graphic and generate graphic activity
unrelated to data information, or other ‘decorative’ forms that take over the display rather than
quantitative information. The use of different shades of grey rather than a variety of patterns will
communicate much more effectively the statistical information. The grid should usually be muted
or completely suppressed so that its presence is only implicit - lest it compete with the data (Tufte,
1983). Graphics do not become attractive and interesting through the addition of ornamental
hatching and extensive use of colours. These recommendations, together with screen layout
guidelines (which were elaborated in Chapter 4) and guidelines for the use of colour on a
computer display, should be applied to simulation systems.
Individual user differences
Studies have shown (Egan, 1988) that user differences account for much more variability in task
performance than either system design or training procedures. Much of this variability comes from
making and recovering from errors. Factors that determine differences in computer-based skills
include user experience, particular technical aptitude, age, and domain- (problem area) specific
skills and knowledge (Hix and Hartson, 1993). Technical aptitudes that are good predictors of
user performance include a spatial visualisation ability, vocabulary, and logical reasoning ability.
Age makes a substantial contribution to the prediction of errors in information searching, the
J. Kuljis User Interfaces and Discrete Event Simulation Models Page 192
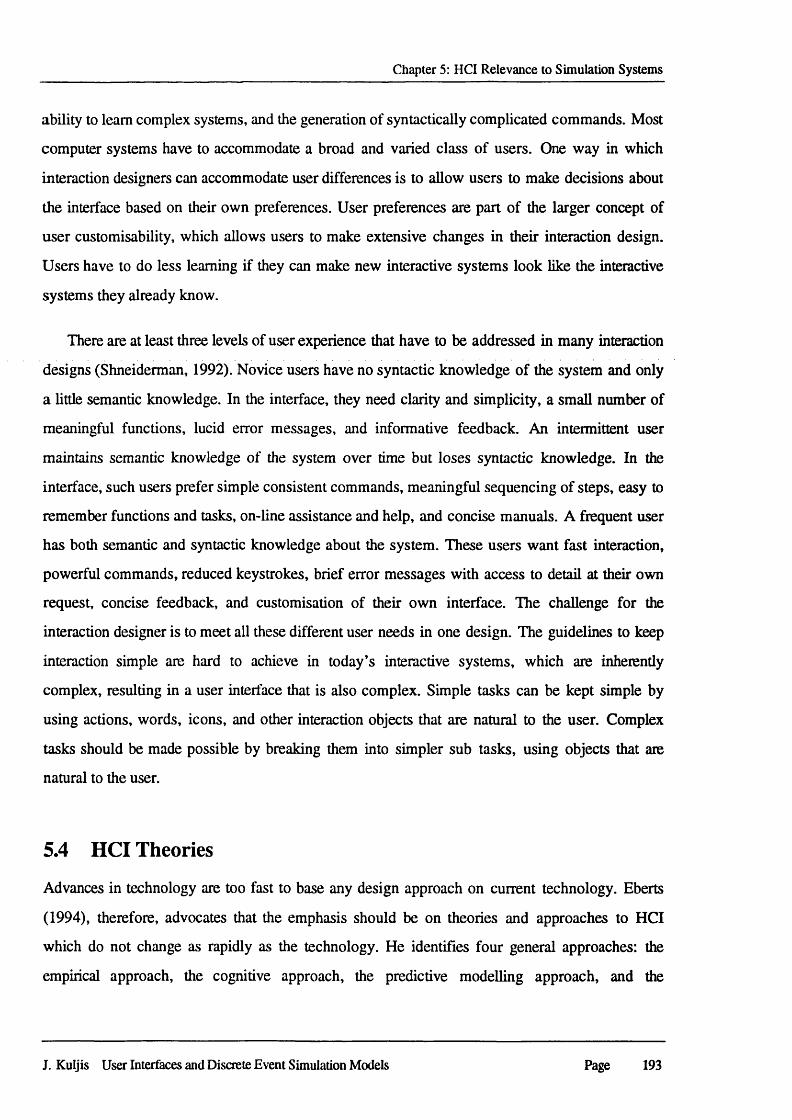
Chapter 5: HCI Relevance to Simulation Systems
ability to learn complex systems, and the generation of syntactically complicated commands. Most
computer systems have to accommodate a broad and varied class of users. One way in which
interaction designers can accommodate user differences is to allow users to make decisions about
the interface based on their own preferences. User preferences are part of the larger concept of
user customisability, which allows users to make extensive changes in their interaction design.
Users have to do less learning if they can make new interactive systems look like the interactive
systems they already know.
There are at least three levels of user experience that have to be addressed in many interaction
designs (Shneiderman, 1992). Novice users have no syntactic knowledge of the system and only
a little semantic knowledge. In the interface, they need clarity and simplicity, a small number of
meaningful functions, lucid error messages, and informative feedback. An intermittent user
maintains semantic knowledge of the system over time but loses syntactic knowledge. In the
interface, such users prefer simple consistent commands, meaningful sequencing of steps, easy to
remember functions and tasks, on-line assistance and help, and concise manuals. A frequent user
has both semantic and syntactic knowledge about the system. These users want fast interaction,
powerful commands, reduced keystrokes, brief error messages with access to detail at their own
request, concise feedback, and customisation of their own interface. The challenge for the
interaction designer is to meet all these different user needs in one design. The guidelines to keep
interaction simple are hard to achieve in today’s interactive systems, which are inherently
complex, resulting in a user interface that is also complex. Simple tasks can be kept simple by
using actions, words, icons, and other interaction objects that are natural to the user. Complex
tasks should be made possible by breaking them into simpler sub tasks, using objects that are
natural to the user.
5.4 HCI Theories
Advances in technology are too fast to base any design approach on current technology. Eberts
(1994), therefore, advocates that the emphasis should be on theories and approaches to HCI
which do not change as rapidly as the technology. He identifies four general approaches: the
empirical approach, the cognitive approach, the predictive modelling approach, and the
J. Kuljis User Interfaces and Discrete Event Simulation Models Page 193
Chapter 5: HCI Relevance to Simulation Systems
anthropomorphic approach. These four approaches provide a structure on how to approach the
problem of designing a user interface.
5.4.1 The Empirical Approach
In the empirical approach the various potential interactive methods are evaluated by testing them.
First, the items to be tested are identified. Next, a task which corresponds closely to the real-
world task but is controllable in a laboratory situation is identified. Finally, the experiment is
carried out in a well controlled environment so that factors other than the independent variable do
not vary from condition to condition. The results are then analysed to determine the statistical
significance of the results. Under the empirical approach, the interface designer would be required
to design, implement, and analyse the results from empirical studies. As an experimenter, the
designer must ensure that the experimental variables are not confounded and that the results can be
interpreted and generalisations applied to other situations.
The experimental techniques used in interface design are varied and can range from very
rigorous technique to informal techniques. Academic research is often focused on rigorous
techniques using the experimental method in controlled environments. This method is good
because cause-and-effect relationships between features of the interface design and usability can
be determined (Eberts, 1994). On the other hand, informal techniques (e.g., questionnaires,
transcripts, videotapes) can provide important observational and descriptive information about the
interface design, but the results may be unstable and not generalisable to other users and
environments. The advantage of this approach is that it offers an alternative to intuition in
determining the best design, even though intuition was many times confirmed through empirical
studies. The disadvantages are the danger of improperly designed experiments, generalising the
findings based on insufficient evidence, and the lack of theoretical guidance.
Several components are involved in designing an experiment. The experimenter must
formulate a research question, design the experiment so that the results are interpretable, choose
the independent variables, and choose the dependent variables. The process of formulating a
research question, choosing an experimental design, and interpreting the results are more difficult
issues requiring decisions based upon prior knowledge, experience, and research. The analysis of
J. Kuljis User Interfaces and Discrete Event Simulation Models Page 194
Chapter 5: HCI Relevance to Simulation Systems
results plays a central role in this whole process. The research question should be addressed, and
the experimental design should be chosen, to facilitate the analysis of results. Finally, the
experimenter must be able to interpret the results correctly and generalise the results to the correct
situations. Only through a clear conceptualisation of the result analysis process, and through an
understanding of the underlying statistics, can experimenters interpret the results correctly.
5.4.2 The Cognitive Approach
In the cognitive approach to human-computer interaction, theories in cognitive science and
cognitive psychology are applied to the human-computer interface to make the processing of
information by the human easier and more efficient. Interacting with a computer through the
interface is a cognitive activity on the part of the user. The user must remember many things and
then be able to implement and execute the appropriate commands. The user must also know how
to interact with computer systems in general by having a cognitive model of how computers
behave, and knowing how to decompose a task into workable units cognitively.
Shneiderman (1992) makes distinctions between syntactic knowledge about device-dependent
details, and semantic knowledge about concepts. This syntactic-semantic object-action (SSOA)
model of user behaviour was originated to describe programming (Shneiderman, 1980). When
using a computer system, a user must maintain a profusion of device dependent details in their
human memory (e.g., the knowledge of which action erases a character). Syntactic knowledge is
arbitrary, system dependent, and ill structured. It must be acquired by rote memorisation and
repetition. Unless it is used regularly it fades from memory. Semantic knowledge has a
hierarchical structure ranging from low-level actions to middle-level strategies to high-level goals
(Shneiderman, 1980; Card, Moran, and Newell, 1983). This representation enhances the earlier
SSOA model and other models by decoupling computer concepts from task concepts. Computer
concepts include objects and actions at high and low levels. According to the SSOA model, users
must acquire semantic knowledge about computer concepts. These concepts are organised
hierarchically, are acquired by meaningful learning or analogy, are independent of the syntactic
details, should be transferable across different computer systems, and are relatively stable in
memory.
J. Kuljis User Interfaces and Discrete Event Simulation Models Page 195
Chapter 5: HCI Relevance to Simulation Systems
The model that the user forms of how the computer system or program works and which
guides the user in structuring the interaction task is called the mental model (Norman, 1986, later
referred to this as the User Model). Predictions and expectations will be based upon the model.
Therefore, in designing an interactive system, a great deal of care and work should go into making
the user model as clear and obvious as possible to the user. The mental model is built up through
interactions with the display representation which provides the user, along with off-line
documentation, the only view of the conceptual model. The conceptual model is a design model
maintained by the designer of the computer system or the interactive program, in engineering or
programming terms, so that it is accurate, consistent, and complete (Norman, 1986, later referred
to this as the Design Model). The goal of an interface designer is to try to choose the information
to represent on the display so that the mental model can, like the conceptual model, be accurate,
consistent, and complete. A test of the success of an interface is a comparison of the user’s mental
model with the conceptual model. A general rule is that the more specialised the application, the
better the conceptual model. Software such as spreadsheets, some database programs, and
drawing programs are relatively easy to convey to the user if the design is considered carefully.
The mental model formation is the key to understanding methods that can be used to design
effective interfaces for computer users.
Norman (1987) points out that in the consideration of mental models we need really consider
four things: the target system, the conceptual model of that target system, the user’s mental model
of the target system, and the scientist’s conceptualisation of that mental model. The system that the
person is learning or using is, by definition, the target system. A conceptual model is invented to
provide an appropriate representation of the target system, appropriate in the sense of being
accurate, consistent and complete. Conceptual models are invented by teachers, designers,
scientists, and engineers. Mental models are naturally evolving models. That is, through
interaction with a target system, people formulate mental models of that system. These models
need not be technically accurate (and usually are not), but they must be functional. A person,
through interaction with the system, will continue to modify the mental model in order to get to a
workable result. Mental models will be constrained by such things as the user’s technical
background, previous experience with similar systems, and the structure of the human
information processing system. In an ideal world, when a system is constructed, the design will
J. Kuljis User Interfaces and Discrete Event Simulation Models Page 196
Chapter 5: HCI Relevance to Simulation Systems
be based around a conceptual model. This conceptual model should govern the entire human
interface with the system, so that the image of that system seen by the user is consistent, cohesive,
and intelligible. Norman (1987) calls this image “the system image” to distinguish it from the
conceptual model upon which it is based, and the mental model one hopes that the user will form
of the system. The instruction manuals and all operation and teaching of the system should then be
consistent with this system image. Thus, the instructors of the system would teach the underlying
conceptual model to the user and, if the system image is consistent with that model, the user’s
mental model will also be consistent For this to happen, the conceptual model that is taught to the
user must fulfil three criteria (Norman, 1987): learnability, functionality, and usability.
Eberts (1994) finds the mental model important to human-computer interaction in two ways.
First, methods have been researched to enhance the development of an accurate mental model of
the computer system. Second, determining the form of mental model can be important in interface
design. Techniques have been developed to acquire knowledge from people about their mental
models of the task. If knowledge acquisition is performed on experts, then interfaces can be
designed that are compatible with these mental models. When novices use the interface, then they
should develop mental models similar to those of the experts. The methods to enhance the
development of accurate mental models through the proper display of information include:
designing the interface so that users can interact actively with it; using metaphors and analogies to
explain concepts; and using spatial relationships so that users can develop capabilities for mental
simulations. Many of the most effective and accurate mental models seem to be spatial in nature
(Eberts, 1994). Through the acknowledgement of the existence of visualisation, the mental picture
in the mental model, the implication is that an accurate mental model can be developed if novices
use an interface incorporating graphics. Another related method to help develop an accurate mental
model is to show clearly the cause and effect relationships between the input and the output.
Active control of the system is important so that computer users can hypothesise and test those
hypotheses on how the system works. The interface should be designed to enhance this activity.
In particular, the interface should be designed so that the user can explore how the system works
and to encourage him/her to explore other possible ways to perform a task. Another method for
developing an accurate mental model is to provide the subjects with an analogy or metaphor about
how the system works. The general approach taken is to specify how knowledge of a familiar
J. Kuljis User Interfaces and Discrete Event Simulation Models Page 197
Chapter 5: HCI Relevance to Simulation Systems
situation can be applied to a new situation. To those familiar with the Apple Macintosh user
interface and its many look alikes, the best example of the use of a familiar metaphor as a
conceptual model is the desktop-office metaphor. The screen looks like an office or desktop, with
familiar objects such as folders, documents, an in-box and out-box for mail, a trash can, a clock,
an appointment book, and so on. These familiar objects also behave in familiar ways. Documents
can be stacked and shuffled, objects can be deposited in and retrieved from the trash can,
documents can be stored in and retrieved from folders, and the “pages” in the appointment book
are laid out just as in a hard copy appointment book. The use of the mouse and other pointing
devices also draws on an already familiar model: the manipulation of physical objects in space. To
move an object from one location to another, we simply “pick up” the object with the pointer and
literally “drag” it to the desired location.
There are, of course, new things to learn, such as how to scroll a document in its window and
how exactly to use the mouse to select and drag objects. But much is analogous to a world that is
already familiar to the user. By presenting already familiar objects, relationships between objects,
and operations on objects, we greatly facilitate the process of learning to use the system because
we exploit a mental model and a set of expectations that the user already has (Mayhew, 1992).
The user only has to add some refinements and perhaps some new actions to learn to use the
system. It is always easier to build on current models than to develop totally new models. The use
of metaphors and analogies has been a very important method for helping computer users develop
an accurate mental model of the system. The long-term usefulness of metaphors is not known.
The main use of the metaphor seems to be to get novices used to the system so that they can use it,
interact with it, and leam more about how it works along the way (Eberts, 1994). When
exploiting mental models from the manual world Mayhew (1992) recognises two potential
problems: under utilisation of the potential computer power, and incomplete metaphors that
mislead the user.
In the cognitive approach the interaction with the computer should be designed so that it
assists human problem-solving instead of impeding it. Theories in cognitive science and cognitive
psychology are applied to the human-computer interface to make the processing of information by
both the human and the computer easier and more efficient. The cognitive theories state how
humans perceive, store, and retrieve information from short- and long-term memory, manipulate
J. Kuljis User Interfaces and Discrete Event Simulation Models Page 198
Chapter 5: HCI Relevance to Simulation Systems
that information to make decisions and solve problems, and carry out responses. The cognitive
approach views the human as being adaptive, flexible, and actively involved in interacting with the
environment to try to solve problems or make decisions. This approach has been concerned with
applying specific theories to the human-computer interaction. Theories which have been applied
include those on analogical reasoning and metaphors, spatial reasoning, problem solving,
attentional models, and connectionist or neural network models. The success of the cognitive
approach has been realised in the interface for the Xerox Star, which was the predecessor of the
popular Apple Macintosh.
5.4.3 The Predictive Modelling Approach
The purpose of the predictive modelling approach is to try to predict the performance of humans
interacting with computers. In the predictive modelling approach, tools must be developed to
predict which of the interactive methods will be best before they are prototyped and developed.
There are four general classes of predictive modelling techniques (Eberts, 1994): information
processing models, GOMS and NGOMSL models, rule-based production systems, and
grammars. Different researchers may analyse the task differendy, resulting in a different
parametrisation of the same task. The assumptions, such as the skill level of the operators, are
very important considerations which also may result in a very different analysis.
Information Processing Models
The Model Human Processor, developed by Card, Moran, and Newell (1983), was designed to
parametrise aspects of human information processing theories. It consists of a set of memories
and processors together with a set of principles, called the “principles of operation”. The Model
Human Processor is divided into three interacting systems: the perceptual system, the motor
system, and the cognitive system, each with its own memories and processors. The perceptual
system consists of sensors and associated buffer memories, the most important buffer memories
being a Visual Image Store and an Auditory Image Store to hold the output of the sensory system
while it is being symbolically coded. The cognitive system receives symbolically coded
information from the stores of sensory image in its Working memory and uses previously stored
J. Kuljis User Interfaces and Discrete Event Simulation Models Page 199
Chapter 5: HCI Relevance to Simulation Systems
information in Long-Term Memory to make decisions about how to respond. The motor system
carries out the response.
The user of this model must accept the assumptions that processing occurs in stages, that
processing in a stage is completed before information is passed to the next stage, and that
information flows in a sequential manner from one stage to the next. If these assumptions are
accepted, then the model can be used. In particular, if we know the stages that the information
must pass through and we know the timing characteristics of these individual stages, then we can
add together the timing values to determine an estimate for the total task time. One of the important
parameters for determining the timing characteristics of a task is the cycle time for the three
systems. This is the time taken for the information to be processed through the stages. While a
stage is processing the information, it cannot process any other information. The other parameters
of the Model Human Processor are those associated with the memories of the perceptual and
cognitive systems.
The Model Human Processor is very accurate at making estimates, especially for simple tasks.
The model is good at determining the qualitative relationships (which one is better than the other),
even though the actual quantitative time predictions may not be totally accurate.
GOMS and NGOMSL
An important determinant of the success of any particular design is the procedural knowledge
possessed by users - their how-to-do-it knowledge (Preece et al, 1994). The best known
representation of this knowledge is the GOMS model (which stands for goals, operators,
methods, and selection rules) developed by Card, Moran, and Newell in 1983. In the GOMS
model the user’s cognitive structure consists of four components (Card, Moran, and Newell,
1983):
(1) a set of Goals,
(2) a set of Operators,
(3) a set of Methods for achieving the goals,
(4) a set of Selection rules for choosing among competing methods for goals
J. Kuljis User Interfaces and Discrete Event Simulation Models Page 200
Chapter 5: HCI Relevance to Simulation Systems
Goals are representation of a user’s intention to perform a task, a sub component of a task, or
a single cognitive or physical operation (e.g., edit manuscript, locate next edit, delete word). The
dynamic function of a goal is to provide a memory point to which the system can return on failure
or error and from which information can be obtained about what is desired, what methods are
available, and what has been already tried. Operations are a user’s representation of elementary
physical actions (e.g., pressing a single key or typing a string of characters) and various cognitive
operations (e.g., storing the name of a file in working memory). A GOMS model does not deal
with any fine structure of concurrent operators. Behaviour is assumed to consist of the serial
execution of operators. An operator is defined by a specific effect (output) and by a specific
duration. The operator may take inputs, and its outputs and the duration may be a function of its
inputs.
A method describes a procedure for accomplishing a goal. It is one of the ways in which a
user represents his/her knowledge of a task. In a GOMS model a method is a conditional sequence
of goals and operators, with conditional tests on the contents of the user’s immediate memory and
on the state of the task environment. Methods are learned procedures that the user already has at
performance time; they are not plans that are created during a task performance. The particular
methods that the user builds up from prior experience, analysis, and instruction reflect the detailed
structure of the task environment. When a goal is attempted, there may be more than one method
available to the user to accomplish the goal. The selection of which method is to be used need not
be an extended decision process, for it may be that task environment features dictate that only one
method is appropriate. On the other hand a genuine decision may be required. The essence of
skilled behaviour is that these selections proceed smoothly and quickly, without the eruption and
puzzlement and search that characterises problem-solving behaviour.
In a GOMS model, method selection is handled by a set of selection rules. Each selection rule
is in the form “if such-and-such is true in the current task situation, then use method M”. Such
rules allows us to predict from knowledge of the task environment which of several possible
methods will be selected by the user in a particular instance. GOMS has been applied extensively
to the use of text-editors. For instance, a model of manuscript editing with the line-oriented POET
editor would be (Card, Moran, and Newell, 1983):
J. Kuljis User Interfaces and Discrete Event Simulation Models Page 201
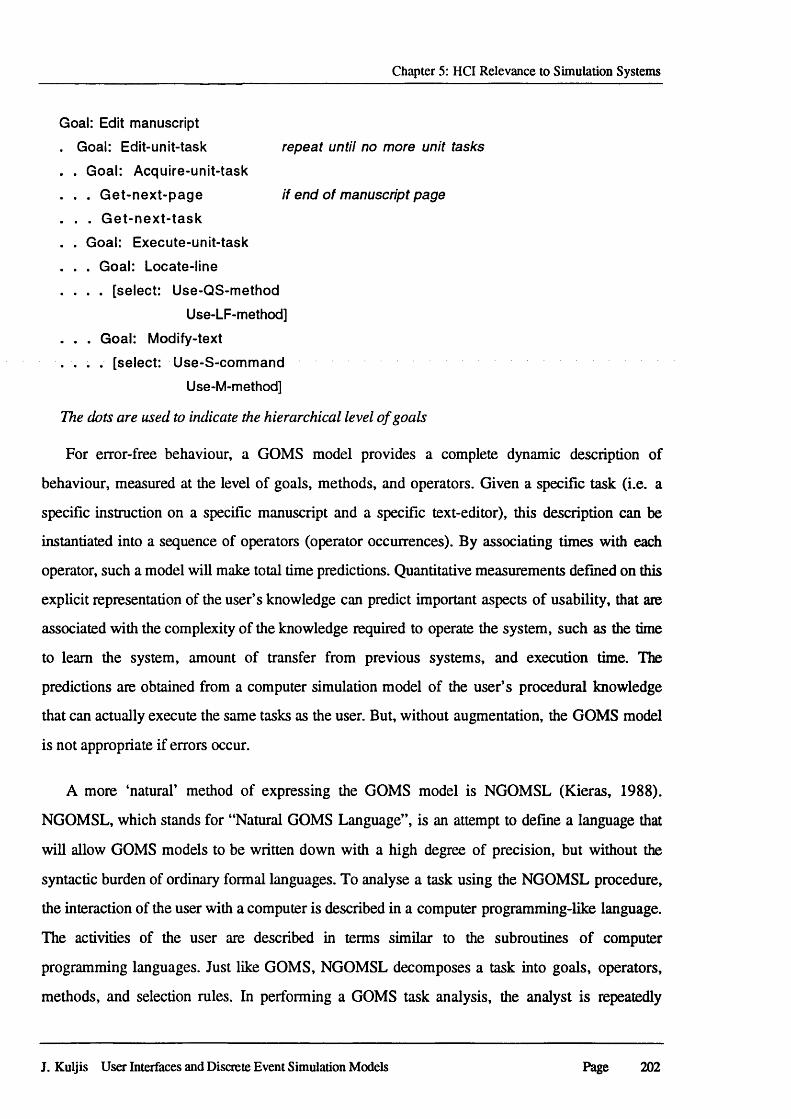
Chapter 5: HCI Relevance to Simulation Systems
Goal: Edit manuscript. Goal: Edit-unit-task repeat until no more unit tasks
. . Goal: Acquire-unit-task
. . . Get-next-page if end of manuscript page
. . . Get-next-task
. . Goal: Execute-unit-task
. . . Goal: Locate-line
. . . . [select: Use-QS-method Use-LF-method]
. . . Goal: Modify-text
. . . . [select: Use-S-command Use-M-method]
The dots are used to indicate the hierarchical level o f goals
For error-free behaviour, a GOMS model provides a complete dynamic description of
behaviour, measured at the level of goals, methods, and operators. Given a specific task (i.e. a
specific instruction on a specific manuscript and a specific text-editor), this description can be
instantiated into a sequence of operators (operator occurrences). By associating times with each
operator, such a model will make total time predictions. Quantitative measurements defined on this
explicit representation of the user’s knowledge can predict important aspects of usability, that are
associated with the complexity of the knowledge required to operate the system, such as the time
to learn the system, amount of transfer from previous systems, and execution time. The
predictions are obtained from a computer simulation model of the user’s procedural knowledge
that can actually execute the same tasks as the user. But, without augmentation, the GOMS model
is not appropriate if errors occur.
A more ‘natural’ method of expressing the GOMS model is NGOMSL (Kieras, 1988).
NGOMSL, which stands for “Natural GOMS Language”, is an attempt to define a language that
will allow GOMS models to be written down with a high degree of precision, but without the
syntactic burden of ordinary formal languages. To analyse a task using the NGOMSL procedure,
the interaction of the user with a computer is described in a computer programming-like language.
The activities of the user are described in terms similar to the subroutines of computer
programming languages. Just like GOMS, NGOMSL decomposes a task into goals, operators,
methods, and selection rules. In performing a GOMS task analysis, the analyst is repeatedly
J. Kuljis User Interfaces and Discrete Event Simulation Models Page 202
Chapter 5: HCI Relevance to Simulation Systems
making decisions about how users view the task in terms of their natural goals and how they
decompose the task into sub tasks, and what the natural steps are in the user’s methods. The
technique should be applied top-down by first describing the top-level goals. The top-level goal is
accomplished by a method which will include a series of steps of high-level operators (these could
be goals themselves). Each step, or operator, in the high-level goal needs a method by which to
accomplish it. The method for accomplishing each step or operator is then specified. The process
is continued in this manner until the operators are composed of primitives. A primitive is usually
some elementary process such as a keystroke or a cognitive process. The primitive level can
change depending on the needs for the task analysis.
NGOMSL goes beyond the GOMS analysis by combining several of the GOMS models into
one integrated model. It places a significance on the cycles needed to complete a task, using these
cycles as a part of the time estimation equation. NGOMSL has a clear mechanism, through the
time estimate of the cycles, to determine exact estimates for the M (mental) operator. The
experimentation associated with the NGOMSL analysis allows many different kinds of
estimations not easily possible with the GOMS models. In particular, using NGOMSL one can
determine estimates for learning time and gains due to consistency. Another difference between
the two is that GOMS is only applicable to expert users, while NGOMSL has some techniques to
specify different models for expert users and novice users. A problem with these models is that
different task analysers may develop different task analyses for the same task.
Production systems
Production systems (also known as rule-based systems) have been used to describe how people
process and store information. The purpose of production systems was to determine how people
solve problems and to specify these steps in a system resembling computer programming
languages. If the steps could be specified enough, then only a short jump is needed to specify the
steps for machine problem solving. The rule-based systems paradigm is the one that is most
popular in knowledge engineering, the part of Artificial Intelligence specialised for building expert
systems. Some rule-based expert systems do synthesis. XCON (McDermott, 1982) configures
computers, for example. Other rule-based expert systems do analysis. MYCIN (Buchanan and
Shortliffe, 1984) diagnoses infectious diseases. Rule-based systems use collections of rules to
J. Kuljis User Interfaces and Discrete Event Simulation Models Page 203
Chapter 5: HCI Relevance to Simulation Systems
solve problems. The rules consist of condition and action parts or antecedent and consequent parts
(Winston, 1984). Several computer languages, such as LISP, have been developed to simplify the
programming tasks of production systems. A production system contains declarative knowledge
(the facts) and procedural knowledge (how to process the facts). The declarative knowledge is
contained in the production rules which have the form of
IF <condition> THEN <action>
Recently, production systems have been used to model how humans interact with a computer
system. Kieras and Poison (1985) developed a production system model for human-computer
interaction tasks. This was based upon the GOMS model and was a predecessor to Kieras’
NGOMSL model. The basic structure of a rule in their model is
<name> IF <condition> THEN <action>
The name is not functional and is used to assist the programmer in reading the code. The condition
is a list of clauses that must all be matched for the rule to be true. The actions are sequences of
operators similar to that for the NGOMSL model. Since NGOMSL and production systems
provide equivalent representations of a task, in slightly different terms, then the same estimations
and predictions can be used for production systems. Eberts (1994) identifies two advantages of
the production system approach over the NGOMSL approach. The production system approach
has a good theoretical basis and could easily be used in a computerised simulation. The production
system is a computer program that could be run easily in a simulation to obtain measurements and
to test the completeness of the analysis.
Grammars
Grammars were one of the earliest methods used to model human-computer interaction languages,
often borrowing their concepts from linguistics. Since the user’s interaction with a computer is
often viewed in terms of a language, it is not surprising that several modelling formalisms have
developed centred around this concept. Representative of the “linguistic approach” (Dix et al.,
1993) is Reisner’s (1981) use of Backus-Naur Form (BNF) rules to describe the dialogue
grammar. This views the dialogue at a purely syntactic level, ignoring the semantics of the
language. BNF has been used widely to specify the syntax of computer programming languages,
J. Kuljis User Interfaces and Discrete Event Simulation Models Page 204
Chapter 5: HCI Relevance to Simulation Systems
and many system dialogues can be described easily using BNF rules. Reisner has developed
extensions to the basic BNF’s descriptions which attempt to deal with this by adding ‘information
seeking actions’ to the grammar. She used her formal grammar, named ‘action grammar’, for the
interaction language to test two interactive drawing programs to predict which one would be easier
to use. This grammar has been used specifically to determine the consistency of the design.
Empirical studies on the two alternative drawing programs showed that the predictions of the
model were accurate; the users found it easier to select the correct actions for the program
predicted to be simpler, and the users found it easier to learn and remember the program which
was predicted to be consistent.
Payne and Green (1986) expanded Reisner’s work by addressing the multiple levels of
consistency (lexical, syntactic, and semantic) through a notational structure they call Task-Action
grammar (TAG). They also address some aspects of completeness of a language by trying to
characterise a complete set of tasks. The most important aspect of TAG is that it can determine
well defined categories of tasks. The tasks with the categories that are well defined are those with
the most structural consistency. Arbitrary collections of tasks have poorly defined categories.
Grammars have many characteristics of the production systems. They may be useful for analysing
the usability of programs before the programs are prototyped.
5.4.4 The Anthropomorphic Approach
In the anthropomorphic approach ways must be found to make computers as easy to interact with
as humans. The designer uses the process of human-human communication as a model for
human-computer interaction. The belief is that if the computer is provided with the right human
like qualities, the interaction can be more effective. Several qualities can be applied to the
computer: natural language, voice communication, help messages, tutoring, and friendliness.
User-friendliness is attributed to so many computer products that it has lost much of its meaning.
In the context of the anthropomorphic approach, the term means that the computer will interact
with the user in much the same way as one human would interact with another human. In
particular, the interaction will be easy, communication will occur naturally, mistakes and errors
will be accepted and mutually fixed, and assistance will be given when the user is in trouble. The
importance of these characteristics can be demonstrated by examples of systems which failed to
J. Kuljis User Interfaces and Discrete Event Simulation Models Page 205
Chapter 5: HCI Relevance to Simulation Systems
incorporate them. A system is user-unfriendly if it requires responses or utilises commands that
are unusual in normal human communication (Eberts, 1994).
Human-computer interaction can be enhanced by analysing the mismatches between human-
human communication and interacting with the computer. Voice recognition, hand gestures, and
facial expressions, for example, are important modes of communication for people. Technology is
advancing to the point where these could be important modes when communicating with
computers. These modes can be used as inputs or they can be used to augment communication.
The computer interface can also be made more natural by attributing the computer with some
cognitive abilities which we assume will be present when communicating with another human.
The computer should be able to have some communication skills. The computer has information
which can be conveyed to the user, about how to use and communicate with the computer, and the
computer should be able to provide some intelligent assistance with the task. The computer should
also be able to adapt to the user by understanding what the user needs or knows in order to fulfil
those needs. One important aspect of researching into making interfaces more natural and user-
friendly is the search for methods to make the computer more “intelligent” which has been the goal
of Artificial Intelligence for a long time.
The full application of the human-human communication analogy to human-computer
interaction is impossible at this time, if ever. Many of the important human-human interaction cues
cannot be perceived by computers. The computer only “knows” what it receives from the user
through input devices; it has very limited perceptual properties if it has any at all. The
anthropomorphic approach is overly dependent on technology advances. Some advances in
natural language processing and voice recognition have been made, but these features are difficult
to implement in most computer systems. Another problem is that natural and friendly may not
always be the best design. The experimental evidence has not always been supportive of
naturalness in computer systems. The anthropomorphic approach is most often used in the task
analysis stage to determine the important communication stumbling blocks. These specifications
can then be used in the design of the system.
J. Kuljis User Interfaces and Discrete Event Simulation Models Page 206
Chapter 5: HCI Relevance to Simulation Systems
5.5 Evaluation of User Interfaces
Designs of software products must be validated through prototyping, usability, and acceptance
tests, which can also provide a finer understanding of user performance and capabilities. Many
systems have been developed that are considered to be functionally excellent, but perform badly in
the real world. It was noted by many researchers in the field that angry and frustrated users are the
norm rather than the exception. Bertino (1985) points out that “Users o f advanced hardware
machines are often disappointed by the cumbersome data entry procedures, obscure error
messages, intolerant error handling arid confusing sequences o f clustering screens’*. Booth (1989)
lists examples of what sometimes provides difficulties:
• Designers do not properly understand the user, the user’s needs and the user’s working
environment.
• Computer systems require users to remember too much information.
• Computer systems are intolerant of minor errors.
• Interaction techniques are sometimes used for inappropriate tasks.
As a result a variety of undesirable effects are produced:
• Computer systems often do not provide the information that is needed, or produce
information in a form which is undesirable as far as the user is concerned.
Alternatively, systems may provide information that is not required.
• Computer systems sometimes do not provide all of the functions the user requires, and
more often provide functions that the user does not need.
• Computer systems force users to perform tasks in undesirable ways.
• Computer systems can cause unacceptable changes in the structure and practices of
organisations, creating dissatisfaction and conflict.
• Computer systems can seem confusing to new users.
Setting explicit goals helps designers to achieve them. In getting beyond the vague quest for
user-friendly systems, managers and designers can focus on specific goals that include well-
J. Kuljis User Interfaces and Discrete Event Simulation Models Page 207
Chapter 5: HCI Relevance to Simulation Systems
defined system-engineering issues and measurable human-factor issues. The most common form
of analysis of user’s activities is called task analysis. Task analysis is the process of analysing the
functional requirements of a system to ascertain and describe the tasks that people perform. It
focuses both on how the system fits within the global task the user is trying to perform and what
the user has to do to use the system.
Once a determination has been made of the user community and of the benchmark set of tasks,
then the human-factors goals can be examined. For each user and each task, precise measurable
objectives guide the designer, evaluator, purchaser, or manager. These five measurable human
factors are central to evaluation (Shneiderman, 1992):
1. Time to learn: How long does it take for typical members of the user community to
learn how to use the commands relevant to a set of tasks?
2. Speed o f performance: How long does it take to carry out the benchmark set of tasks?
3. Rate o f errors by users: How many and what kinds of errors are made in carrying out
the benchmark set of tasks?
4. Retention over time: How well do users maintain their knowledge after an hour, a day,
or a week?
5. Subjective satisfaction: How much did users like using various aspects of the system?
How do we measure these factors? Human behaviour is observable; human performance is
measurable. Measuring the performance of humans, using an interactive system, for example,
requires empirical testing. This involves several phases, including the formation of a hypothesis,
the design of a study with appropriate human participants, the collection of performance data
based on observations of those participants performing tasks, analysis of data (usually via
statistical methods), and finally, confirmation or refutation of the hypothesis (Hix and Hartson,
1993). Usability is a combination of the following user-oriented characteristics: ease of learning,
high speed of user task performance, low user error rate, subjective user satisfaction, and user
retention over time. That is, usability is related to the effectiveness and efficiency of the user
interface and to the user’s reaction to that interface. It is not always possible to succeed in every
category. There are often forced trade-offs that usually depend on the nature of a particular
application. Project managers and designers must be aware of the trade-offs, and must make their
J. Kuljis User Interfaces and Discrete Event Simulation Models Page 208
Chapter 5: HCI Relevance to Simulation Systems
choices explicit and public. There is a growing awareness among user interface designers that the
user should not have to adapt to the interface, but rather that the interface should be designed so
that it is intuitive and natural for the user to learn and to use.
So, what is user interface evaluation and how do we evaluate user interfaces? In Preece et al.
(1994) evaluation is concerned with the gathering of data about usability of a design or a product
by a specialised group of users for a particular activity within a specified environment or work
context. Evaluation has three main goals according to Dix et al. (1993): to assess the extent of the
system’s functionality, to assess the effect of the interface on the user, and to identify any specific
problems with the system. The system’s functionality is important in that it must accord with the
user’s task requirements. In other words, the design of the system should enable the user to
perform the required task more easily. Evaluation at this level may include measuring the user’s
performance with the system, to assess the effectiveness of the system in supporting the task. It is
important to be able to measure the impact of the design on the user. This includes considering
aspects such as how easy the system is to learn, its usability and the user’s attitude to it. In
addition, it is important to identify areas of the design which overload the user in some way,
perhaps by requiring an excessive amount of information to be remembered, for example. The
final goal of evaluation is to identify specific problems with the design. These may be aspects of
the design which, when used in their intended context, cause unexpected results, or confusion
amongst users. This is of course related to both the functionality and usability of the design.
There are basically two kinds of evaluation of an interaction design. These are formative
evaluation and summative evaluation (Hix and Hartson, 1993). The former is evaluation of the
interaction design as it is being developed, early and continually throughout the interface
development process. The later is evaluation of the interaction design after it is complete, or nearly
so. Summative evaluation is often used during field or beta testing, or to compare one product to
another. In practice, summative evaluation is rarely used for usability testing. It is usually
performed only once, near the end of the user interface development process. Formative
evaluation is begun as early in the development cycle as possible, in order to discover usability
problems while there is still plenty of time for modifications to be made to the design. Formative
evaluation is performed several times throughout the process. The distinction between formative
and summative evaluation is in the goal of each approach.
J. Kuljis User Interfaces and Discrete Event Simulation Models Page 209
Chapter 5: HCI Relevance to Simulation Systems
There is almost a consensus among HCI researchers that evaluation should not be thought of
as a single phase in the design process (still less as an activity tacked on the end of the process, if
time permits). Ideally, they agree, evaluation should occur throughout the design life cycle, with
the results of the evaluation feeding back into modifications to the design. According to Preece et
al. (1994) evaluation during the early design stages tends to be done in order to: predict the
usability of the product or an aspect of it; check the design team’s understanding of users’
requirements by seeing how an already existing system is being used in the field; and test out
ideas quickly and informally (as part of envisioning a possible design). Later in the design process
the focus shifts to (Preece et al., 1994): identifying user difficulties so that the product can be
more finely tuned to meet their needs; and improving an upgrade of the product. As a general rule,
any kind of user testing is better than none. One can learn something valuable from even the most
informal evaluation.
Most kinds of evaluations can be described as one of the following (Preece et al., 1994):
observing and monitoring users’ interactions, collecting users’ opinions, experiments or
benchmark tests, interpreting naturally-occurring interactions, or predicting the usability of a
product. Several different kinds of evaluation depend on some form of monitoring of the way that
users interact with a product or prototype. Observation or monitoring may take place informally in
the field or in a laboratory as part of more formal usability testing. There are a number of
techniques for collecting and analysing data. Data may be collected using direct observation, with
the observer making notes or using some other form of recording such as video. Keystroke
logging and interaction logging can also be done and often they are synchronised with video
recording.
As well as examining users’ performance, it is important to find out what they think about
using the technology. Surveys using questionnaires and interviews provide ways of collecting
users’ attitudes to the system. Experiments are used to test hypotheses. All but the variables of
interest need to be controlled. A knowledge of statistics is also necessary to validate results.
Controlling all of the variables in complex interactions involving humans can be difficult and its
value is often debatable. Consequently, HCI has developed an engineering approach to testing in
which benchmark tests are given to users in semi-scientific conditions. The experimental set-up
and procedure roughly follows the scientific paradigm in that the experimenter attempts to control
J. Kuljis User Interfaces and Discrete Event Simulation Models Page 210
Chapter 5: HCI Relevance to Simulation Systems
certain variables while examining others. Although some of the same techniques are used to
collect data (e.g., video recording, audio recording, keystroke logging and interaction logging), as
when just observing or monitoring usage the evaluation is usually more rigorously controlled
because the data that is collected will be analysed qualitatively to produce metrics to guide the
design.
The purpose of interpretative evaluation is to enable designers to understand better how users
use systems in their natural environments and how the use of these systems integrates with other
activities. The data is collected in informal and naturalistic ways, with the aim of causing as little
disturbance to users as possible. Furthermore, some form of user participation in collecting,
analysing and interpreting the data is quite common. The aim of predictive evaluation is to predict
the kind of problems that users will encounter when using a system without actually testing the
system with the users. As the term suggests, some kind of prediction is involved. This may be
made by employing a psychological modelling technique such as keystroke analysis, or by getting
experts to review the design to predict the problems that typical users of the system would be
likely to experience.
Selecting appropriate methods and planning evaluation are not trivial. Many factors need to be
taken into account. Some are concerned with the stage of system development at which feedback
is required, the purpose of evaluation and the kind of information that is needed; others are
concerned with the practicalities of doing the actual evaluation such as time, the availability and
involvement of users, specialist equipment, the expertise of the evaluators and so on.
5.6 Conclusions
In this chapter we have given an overview of HCI research that deals with user interaction. We
were mainly interested in those issues that relate to the design of better user interfaces. In section
5.2 we examined the characteristics of the major participants in human-computer interaction and
the characteristics of the interaction itself. In section 5.3 we discussed the user interface design
issues for ensuring the system’s usability. System life cycle and methods that can be adopted in
the interactive system design together with the support for designers were not discussed. In
section 5.4 we gave an overview of the most influential theories in HCI and their contribution to
J. Kuljis User Interfaces and Discrete Event Simulation Models Page 211
Chapter 5: HCI Relevance to Simulation Systems
the design of more usable computer systems. In section 5.5 we discussed the role of evaluation in
ensuring the usability of computer system.
We have described the human and what we know about human capabilities and limitations that
can influence human-computer interaction. We have discussed mental models that are believed to
guide behaviour at the interface, helping people to predict and explain system behaviour from
what they observe, from what they know or think they have learned. Mental models are
apparendy simpler than the entities they represent, and because they are incomplete, they tend to
change over time as people’s understanding of the entities evolves. The term mental model is used
interchangeably with conceptual model and user model in the literature, and opinions differ as to
what exactly these terms mean. The most common use of the notion of user model covers the
designer’s model of the user, the user’s model of the task, the user’s model of the system, and the
system’s model of the user. User modelling can be useful in HCI in matching system features to
user needs, suggesting metaphors to improve user learning, guiding design decisions and making
system assumptions and choices explicit, providing predictive evaluation of proposed designs,
identifying different user populations, and guiding the design of experiments and the interpretation
of the results.
We have also examined some of the most influential techniques which have been used to
represent the interaction. Modelling techniques provide means for quantifying certain aspects of
HCI. Some models are performance oriented, others seek to map the functionality of user
interfaces to assess the form of formal grammars for describing user tasks at the interface, in the
sense that they describe the interface using symbols, rules and conventions characteristic of a
grammar. The number of rules needed to describe a given interactive task is taken to reflect the
cognitive complexity associated with completing the task. The aim of HCI is both to develop
interaction techniques and to suggest where and in what situations these technologies and
techniques might be put to best use. It is concerned with providing theories and tools for
modelling the knowledge a user possesses and brings to bear on a task. Its purpose is to enable
designers to build more usable systems by making explicit the user’s model of the task and
system. At a task level the concerns are with the means by which the user’s needs and a system’s
functions and information provision might be matched. The purpose of HCI is to develop
methods for determining users’ needs, thus ensuring that systems provide users with the
J. Kuljis User Interfaces and Discrete Event Simulation Models Page 212
Chapter 5: HCI Relevance to Simulation Systems
functions they need and the information they require (in the form they desire) without excessive
effort on their part.
There are problems related to the way in which the presumed benefits of HCI are
communicated to designers. On the one hand designers are being told to follow a set of general
procedures and prescriptions of ‘good practice’, which although they may be based on occasion
upon empirical evidence, in practice are expensive to use and are little different from what many
designers think they do anyway. At the same time designers are being presented with a range of
theories and methods at a level of formal complexity that works against the very principles they
are promoting, i.e. usability (Forrester and Reason, 1990). In other words, the process of theory
building and the practice of verification (of HCI models) becomes hopelessly intertwined with
prescriptions for design practice. The gap between theoretical orientation and daily practice is
considerable and designers may simply not see how or why it might be of use. Forrester and
Reason (1990) argue that part of the problem is that using computers is a form of activity that
offers new ways to carry out previously paper oriented activities, and at the same time offers
opportunities for what appears to be a new context and new forms of behaviour.
The current prevalent HCI conception is that the interface is the representational ‘window’
through which the user addresses, manipulates, and is informed about a software system.
Forrester and Reason (1990) argue that this is inadequate in that it decouples the user and the
system, giving each a spurious autonomy and therefore advocate the following definition as a first
step towards an “improved” concept of an interface.
An interface is a dynamic relationship between a user, an interest, (e.g., problem
specification, task solution, browsing activity), and an ensemble o f representations
(via screen, notepad, user's memory, and so on) and tools (e.g., software
manipulation, pencil, user tactics and techniques).
A representation always presupposes and orients a user towards some interest and not others,
some knowledge and not others. Representations provide the scenario and implicit parameters
within which users conceive and act, and therefore, they impose constraints. Tools are designed
for explicit uses on specific objects with known ends in view, although tools may be used in ways
J. Kuljis User Interfaces and Discrete Event Simulation Models Page 213
Chapter 5: HCI Relevance to Simulation Systems
which were not intended by their inventors. Representations are always problematic to the degree
that they must ‘stand for’ something else, and the direct mapping between what is being indicated
and what is ‘meant’ by the indicating representation cannot be easily guaranteed. Dynamic user-
interface solutions are essentially concerned with, and based upon, a history of use (which treats
as significant certain memorable tasks, and forgets others); sets of expectations about procedures
and task possibilities based upon both the current system being used and other systems; and the
distinctiveness of use arising out of perceived predictions or projectability of actions and system
responses which can both constrain and enhance use (Forrester and Reason, 1990). The software
design practice is much more of a “hands-on” dynamic activity than is generally recognised in
HCI (Bellotti, 1988).
It is noticeably easier to see the direct relevance and applicability of design guidelines to
simulation than HCI theories. The problem is maybe more to do with HCI theories and their
general applicability to the design of interaction systems, than it is in a particular relevance to
simulation systems. The other possible problem is that simulation systems are not as simple as,
for example, text editors. Nevertheless, the importance of HCI theories lies in the raising of some
very important issues when designing user interfaces. An empirical approach to design of user
interfaces stresses the importance of evaluation of user interfaces. A cognitive approach promotes
the importance of designing effective interfaces which help users to create the accurate, consistent,
and complete mental models. A cognitive approach also identifies the use of metaphors and
analogies at the interface to explain concepts. A predictive modelling approach stresses the
importance of quantitative time predictions to accomplish a task. The major contribution of an
anthropomorphic approach is stressing the importance of assistance to users, particularly when
errors occur. Therefore, examining a complex task domain may require entirely different
approaches. The current simulation systems are typically visual interactive simulation systems that
provide an integrated simulation environment. This type of environment includes a collection of
tools for designing, implementing, and validating models; verifying the implementation; preparing
the input data; analysing the output results; designing experiments; and interacting with the
simulation as it runs. Such systems are inherendy complex and inevitably employ a broad
selection of interaction styles and often use technology in a novel way. It is pity that HCI
researchers have not yet recognised this goldmine of empirical research and development, and
J. Kuljis User Interfaces and Discrete Event Simulation Models Page 214
Chapter 5: HCI Relevance to Simulation Systems
tried to research into the special needs and methods of these kinds of interactive computer
systems.
To summarise, the following issues discussed in this chapter are relevant to simulation
systems and if methods to apply them can be found, may increase the usability of simulation
systems:
• Recognising the limitation of short-term memory, and designing simulation systems
with that in mind. This especially applies to: design of on-line help that keeps users
informed whereabouts in the help system they currently are; a continuous feedback
provision (especially on errors); methods for getting a users’ attention onto the task
being performed.
• Exploiting the knowledge that we can recognise material far easier than recall it.
Methods that can be used in simulation systems can be: making analogical mapping
more explicit by choosing visual objects on the screen that are familiar objects from the
problem domain and therefore enable users to use their prior knowledge and
expectations; making interaction objects perceptually obvious; making available much of
the information of system structure and functionality.
• Promoting a good conceptual model that will ensure a good and consistent user mental
model. A representation of a physical system in simulation models should have a spatial
representation. Simulation systems should also keep a consistent analogic or metaphoric
correspondence to features in the problem domain.
• Providing flexibile interaction. Simulation systems should provide users with freedom
to choose how to interact with the system and give them control over interaction.
Systems should also be designed so that they cater for new inexperienced users as well
as expert and experienced users.
• Providing robust systems. Reversible actions are rarely employed in simulation
systems. Good on-line help systems are another rare commodity in simulation systems.
Recovering from errors is rarely supported by simulation systems.
J. Kuljis User Interfaces and Discrete Event Simulation Models Page 215
Chapter 5: HCI Relevance to Simulation Systems
• Applying guidelines on display design. These guidelines are common sense that are not
specific to simulation, but relate to simulation as well as to any other interactive
computer system. In particular colour, screen clutter, message positioning, and font
varieties and sizes are of obvious direct relevance.
• Recognising the importance of evaluation as stressed in an empirical approach.
Interaction employed in simulation systems appears to be rarely evaluated, and both
rigorous and informal evaluation techniques should be applied more often to give
credibility to often unsubstantiated claims on the presumed benefits of visual
simulation.
• Providing assistance for users. A good on-line help system, on-line tutorial,
demonstration programs, and user documentation are fairly rare practices in simulation
systems, and should be promoted.
J. Kuljis User Interfaces and Discrete Event Simulation Models Page 216
Chapter 6: Proposed Enhancements
6.1 Introduction
The process of designing and constructing user interfaces is critical to building systems that
satisfy customers’ needs, both current and future. This process includes the original design of the
interface, implementation of the system, and modifications of the operational system. The user
interface mediates between two main participants: the operator of the interactive system (a human
being) and the computer hardware and software that implement the interactive system. Each
participant imposes requirements on the final product. The operator is the judge of usability and
appropriateness of the interface; the computer hardware and software are the tools with which the
interface is constructed. Consequently, an interface that is useful and appropriate to the operator
must be constructed with the hardware and software tools available.
There is very little published material on usability of simulation systems or models. It seems
that the simulation community is not particularly interested in evaluating user interfaces of
simulation systems, and to examine what changes would enhance the usability of such systems
and thus widen the user group. That is rather strange since simulation systems probably include a
much wider scope for interaction paradigms than most other computer software. Advances in
computer technology, especially in computer graphics, are much more readily incorporated into
simulation systems than in others. It is not a surprise that, for example, the simulation community
was the first to introduce object-oriented programming (in the Simula language), or that the
simulation community uses animation in a novel and unique way, opening a horizon to the wider
community of what can be achieved.
Whilst conducting research on the case study we gained experience in the practicalities of
simulation model development using bespoke programming. We have made some general
conclusions in chapter 4 on the success of the case study user interface. A summary of the
findings is that it is still fairly hard to develop user interface using bespoke programming, because
of the lack of appropriate user interface development tools and tools for software integration.
Since the case study was conducted the situation has improved. User interface development tools
J. Kuljis: User Interfaces and Discrete Event Simulation Models Page 217
Chapter 6: Proposed Enhancements
are becoming more sophisticated and more widely available. The tools are predominately oriented
for Windows GUI interface development (e.g. Visual Basic). However, these tools do not save
the developer from programming. And there is still a question of integration when more than one
software application is used. In the case of simulation model developments it is more than
apparent. There is evidently a need for more general development tools for building user interfaces
to broad application areas. Hartson and Hix (1989) suggest some desirable requirements for
interface development tools which apply to simulation too. These are:
• Functionality: the ability to produce a complex interface;
• Usability;
• Completeness;
• Extendibility: since the specific tools cannot address every need, the tools can be easily
modified or the interface representation produced by the tools can be easily modified;
• Escapability: it should be possible to escape from the tool and use ordinary
programming to produce an interface feature;
• Direct manipulation: visual programming - the dialogue developer works directly with a
visual representation of the end-user’s task-oriented objects and the results are
immediately visible and easily reversible;
• Integration: a set of tools should have a single integrated interface for accessing all the
tools and a uniform interface style across all tools;
• Locality of definition: the ability to give localised definitions that apply to large parts, or
all, of an interface - using shells or object-oriented implementation environments;
• Structured guidance: help from the tools in organising the interface development
process - built-in tutorials, computer-aided instruction, on-line help.
The extra requirements for simulation relate to the complexity of the problem being modelled,
so that the interfaces have to handle this complexity in what is typically a unique application.
We have analysed user interfaces employed in several simulation systems and summarised the
findings. We have recognised good practice and also identified areas where improvements would
J. Kuljis User Interfaces and Discrete Event Simulation Models Page 218
Chapter 6: Proposed Enhancements
be beneficial. We have conducted a literature search in HCI and tried to identify findings that can
be applicable to simulation systems. The objective of this chapter is to combine the practical
experience gained in conjunction with relevant HCI frameworks. In this chapter we try to make
some general observations about user interfaces to simulation systems and make some
recommendations on possible improvements. The proposed improvements are meant to improve
usability and not the modelling capabilities of these systems. There is no doubt that the proposed
enhancements are based on subjective argumentation even though they are set against the available
HCI theory. There is also no doubt that these recommendations have evolved mostly from
empirical evidence. We argue here that most current software development, including simulation,
has always been based on empirical evidence. Theory often follows practice in order to attempt to
generalise the accumulated practical experience, or to make ‘rational* explanations as to why the
implemented solutions are good or bad. Nevertheless, new developments are still practice driven,
and not theory driven. The evidence is present everywhere. The most obvious ones are the
Windows and Macintosh based interfaces that were influenced by Xerox Star, where computer
graphics programmers have emphasised the multiwindowed desktop spatial metaphor as a basis
for appearance and interaction. More than ten years on, the same metaphor is still a dominant one
regardless of the variety of application domains and the inappropriateness of the desktop metaphor
in many of these domains.
It is certainly easier to use well known, established interface conventions than to invent and
develop new ones. Most of the user interface guidelines as we know now are based on a GUI
kind of interface. HCI theory can help us analyse the usefulness of an interface, it can help us to
design better screens, but it is doubtful whether it can help to start a completely new framework. It
is not our intention to dive into muddy waters either. Instead, we will, like most practitioners,
start from what we already have and try to see where can we got from there. In other words, we
are looking at possible enhancements of user interfaces for simulation systems, and therefore
attempting to improve the usability of such systems. We will not attempt to examine user interface
tools. This would take this research in an entirely different direction. It can be left as a future
research project. We examine simulation environments, data input/model specification, simulation
experiments, simulation results, and user support and assistance. We treat them in isolation even
though we are aware that these aspects of simulation systems are highly intertwined, and that
J. Kuljis User Interfaces and Discrete Event Simulation Models Page 219
Chapter 6: Proposed Enhancements
changes in one part of a system inevitably mean change in another part/s. Where appropriate,
connecting material will be outlined.
6.2 Simulation Environments
Simulation systems provide unusually rich environments that support many diverse tools. Visual
programming tools are standard features in all VIS systems, and drawing tools are very common.
Dynamic icons and animation are supported by most visual simulation systems. The interactive
change of the simulation parameters and of the speed of animation whilst the simulation is being
executed, are also often provided. Panning and zooming is another quite common facility.
Regardless of whether the simulation systems are data-driven simulators or simulation languages,
it is becoming common to provide some sort of integrated model building environment. The
provision of completely self-sufficient simulation environments is important for the following
reasons:
• it reduces the development time,
• it supports application consistency,
• it can aid the developers throughout the development cycle,
• it can support model completeness,
• it can provide checks of model validation.
The users of simulation software are often experts in special application fields. Kamper (1993)
points out that these users, being laymen in information science, should be supported as much as
possible by the simulation tool. The areas of concern are: validation, the development of simple
models, and the development of complex models which contain, for example, non-typical
phenomena in a special problem class. She advocates that the simulation tools should support the
model builder in the first phases of becoming familiar with the tool, and in further work to model
more complex phenomena without being forced to learn new concepts of model building. She
sees the development of task specific user interfaces which relate to the respective knowledge as
an aid to modelling. Bright and Johnston (1991) point out the necessity of ‘ease of use’ of
simulation software. They see ‘ease of use’ as a combination of structural guidance in the model
J. Kuljis User Interfaces and Discrete Event Simulation Models Page 220
Chapter 6: Proposed Enhancements
development process, error prevention, help provision, and the rate at which familiarity with the
software is gained. However, they are concerned that the provision of these requirements in visual
interactive modelling software will hinder generality and reduce its power.
In this section we make some suggestions as to how simulation environments in existing
simulation systems can be adapted to provide more usable development environments. We see
room for improvement in the following: model development aid, colour use aid, and flexibility of
interaction.
6.2.1 Model Development Aid
The experience we have gained during this research convinced us that the model development
process is generally not well supported. To substantiate this claim we shall use data gathered on
six simulation systems, that was reported in chapter 2. Five of these simulation systems are data-
driven simulators (XCELL+, Taylor II, ProModel for Windows, Micro Saint, and Witness for
Windows) that use some sort of diagramming tools for representation of model logic, and one is a
simulation language (Simscript II.5 for Windows). All six systems provide modelling
environments. Two systems are general purpose (Micro Saint, Simscript II.5) whereas the other
four are manufacturing or mainly manufacturing. Graphic elements for the representation of the
model logic are pre-defmed for all simulators, and cannot be changed for two of them (XCELL+
and Micro Saint). Names of model elements (i.e. machines, parts) are pre-defmed and cannot be
changed for any of the simulators, although the user can provide labels for individual instances of
elements to describe better the domain related elements (i.e. an element machine can be labelled
‘clerk’ or ‘bank teller’ in a bank model using Taylor II). Similarly, all examined simulators use
fixed, pre-defined, and unmodifiable attribute names (fields). Data entry is usually facilitated
through pre-defined, unmodifiable fill-in forms which use the system’s own element names,
attribute names (fields), which usually have default values provided. Data validation is not a
common facility (only in Taylor II and ProModel for Windows).
These attributes support mainly modelling in manufacturing domain. However, if the problem
modelled is from a different domain manufacturing than the modeller has to map the entities of the
domain modelled into the manufacturing domain. The analogical mapping that the modeller has to
J. Kuljis User Interfaces and Discrete Event Simulation Models Page 221
Chapter 6: Proposed Enhancements
perform throughout the modelling process can cause many problems. Firstly, a heavy demand on
the user’s memory is required in order to perform constant translation of used objects to what
these objects actually represent. Secondly, the concepts that have to be used have no close and
natural association with the tackled problem. Thirdly, the tasks that have to be performed during
the modelling process may not at all be related to the problem at hand. The effectiveness and
leamability will therefore be seriously hindered. This will not promote the user’s positive attitude
towards the system.
Background drawing tools are rarely facilitated (Taylor II, ProModel for Windows, Simscript
II.5 for Windows), as is importing graphics from other applications (ProModel for Windows,
Micro Saint, Simscript II.5 for Windows). Icon editors are more common (not provided in
XCELL+ and Micro Saint), even though the majority of them only provide elementary drawing
capabilities. The user is rarely allowed to control statistics collection (only in Micro Saint and
Simscript II.5) and the way the statistics is displayed (only Simscript II.5 gives complete
freedom). Report customisation is rarely allowed. If this facility is provided, only a limited set of
options can be exercised. On-line help, if available, usually does not extend to anything more than
an overview of basic system concepts. Context sensitive help is scarce and good context-sensitive
help is almost non-existent (the exception is ProModel for Windows). On-line help for error
messages is not available on the examined systems. The customisation of the modelling
environment is virtually an unknown commodity. A limited customisation is offered only in
ProModel for Windows. The development of separable user interfaces for particular simulation
problems is possible only in Simscript II.5 for Windows, which facilitates user interface
development by providing templates for menus, fill-in forms, and several types of graphs that can
be then tailored to suit the problem.
An essential aid in model development can be facilitated by selecting model components which
are relevant to the model builder’s modelling requirements. Pidd (1992b) points out that the
graphics components must be directly linked into the simulator itself, so to avoid displays which
are not a direct result of state changes in the simulation and that the model builders should be
given the freedom to lay out the screen display by use of interaction devices, choosing how to
represent the entities as the simulation proceeds from a provided set of icons. Our proposal is that
simulation environment should provide model developers with the following:
J. Kuljis User Interfaces and Discrete Event Simulation Models Page 222

Chapter 6: Proposed Enhancements
1) Several pre-defined problem domains.
2) A facility to create new problem domains.
3) A facility to design and/or choose graphical representations for elements in a problem
domain.
4) A facility to set default values for a problem domain.
5) A facility to set defaults for statistical data collection.
6) A facility to set defaults for the graphical presentation of simulation results.
Provision o f the most common problem domains
Let us first define what we mean by ‘problem domain’. In the case of data-driven simulators, all
modelling elements provided by the simulator are available to the model designer to enable the
design of any particular problem. Let us assume that we want to model a bank using Witness for
Windows (example used in Witness manual). The bank model consists of customers entering a
bank, joining the queue for a clerk, and a clerk who serves one customer at a time. In Witness the
following physical elements are available: parts, fluids, buffers, tanks, machines, processors,
conveyers, pipes, vehicles, tracks, and labour. The bank example will have to make use of three
modelling elements: machine for a clerk, part for a customer, and buffer for a queue. This means
that the other eight elements are obsolete in this domain. Therefore the system fails in matching
with the user task and in the terminology.
Our proposed ‘ideal’ simulation system would come with some of the most common problem
domains already supplied, at least those the vendor claims that the system is intended to model.
Model elements in any particular problem domain would have names relevant to the problem
domain. Therefore, the above example ‘bank domain’ would already be supplied in a system and
available for the user to choose from a list of problem domains. Element names in the ‘bank
domain’ would be customer, queue, and clerk. Once the domain was chosen the user would be
able to develop a model of a particular bank without having the burden of obsolete modelling
entities and inappropriate entity names. The graphical representations of modelling elements
should be domain specific and appropriate for the problem domain (i.e. a customer will be an icon
representing a human, a queue will consist of several customers, and a clerk will be represented as
J. Kuljis User Interfaces and Discrete Event Simulation Models Page 223
Chapter 6: Proposed Enhancements
a human sitting at a desk). The proposed provision would support the user in matching the
modelling elements with the task and by providing the terminology that is appropriate for the task
carried out and thus better support the effectiveness and leamability of the system.
A facility to create new problem domains
It is anticipated that the vendor for our ‘ideal’ simulation system cannot supply all problem
domains that modellers will tackle, so therefore the system should have a facility to create new
problem domains. A new problem domain can be created either from an existing problem domain
(a subset of it) or from a system’s generic domain that provides a full set of all available
modelling entities under generic names. As the user selects a modelling entity for the domain
under construction, he/she should be prompted to provide an appropriate name. After all
modelling entities are defined and acknowledged, the system will automatically modify all
references to corresponding entities and substitute for all new domain entity names (generic or
names in a parent domain). References will be substituted in menus, fill-in forms, reports, on-line
help, etc. The system will also erase all references to unused entities in all menus, forms, reports,
on-line help etc. The user will be prompted to supply default values relevant to the new domain.
The user will be given guidance to choose or to create graphical representations of modelling
entities for the new problem domain. Once a new problem domain is created the user will be given
an opportunity to save it in a list of existing problem domains so that it can be made available for
future use. This provision would enable the modeller to better match the concepts and tasks to the
problem domain of interest. Consequently, the effectiveness and leamability of the system will be
better supported
A facility to design graphical representations o f modelling elements
During the definition of a new problem domain the user will be given the opportunity to select
graphical representations of the domain entities from a library of icons supplied by the vendor. If
the user cannot find suitable icons a facility should be provided to either modify existing icons or
to draw new icons. This facility would normally be an icon editor with a good drawing
capabilities. Provision should be also made to import an icon from some other drawing package or
from icon libraries. This provision would enable the user to choose either a more ‘realistic’ or
preferred graphical representation of the model’s entities and therefore, promote a positive attitude
J. Kuljis User Interfaces and Discrete Event Simulation Models Page 224
Chapter 6: Proposed Enhancements
on his/her part. If the familiar graphical representations are used to model a problem the user’s
memory load would be reduced.
A facility to provide default values to problem domains
All system supplied problem domains would come with default values relevant to respective
problem domains. When the user creates a new problem domain there should be a facility that
enables the specifying of default values for the new domain. A valid data range or set, where
appropriate, can be supplied as well to facilitate data validation during the model development
process. This facility should prompt the user during the process of creation of a new domain. It
should be also made available for the user to make changes of default values in any other problem
domain in the list. This provision would reduce the time and effort necessary to specify
subsequent models in the same domain. It will also reduce the possibility of making errors by
either preventing the user to enter non-valid values or by preventing the user omitting any data
necessary to carry out the model execution.
A facility to set defaults fo r statistical data collection and graphical presentation
Similarly, the user will have a facility available to choose which statistical data will be collected as
a default for a problem domain. The domain can be either a new one or an already existing one.
Presentation preferences can also be made as default values for a problem domain. This provision
would facilitate the flexibility of the modelling environment to better suit the needs of a particular
problem being modelled.
The above provision would make model specification a much easier and faster process. The
users will not have to use names and visual representations that are awkward for a chosen domain
(i.e. machine for a clerk), and make mental transformations to create correspondence between
model names and their visual representation of the entities they represent. They will be given
flexibility to tailor these aspects of the simulation environment to their own preferences. Hence all
four usability dimensions will be better supported. Dialogue independence should be facilitated for
all user interface components in order to make the above recommendations possible.
J. Kuljis User Interfaces and Discrete Event Simulation Models Page 225
Chapter 6: Proposed Enhancements
6.2.2 Colour Use Aid
There are a number of reasons why it is difficult to design with colour. The appearance of colour
depends on the colours in the environment that surrounds it. Any colour is influenced by its
location, its placement, and the size and shape of the area it fills. We therefore cannot choose
colours in isolation; they must be chosen in context. Our colour compositions may need
refinement and alteration with the addition of every colour. Computer colour design has a unique
problem. How should colours be selected for dynamically changing displays? Ambient lighting
also affects the appearances of colours. Further more, computer monitors vary in their calibration.
There is no guarantee that a particular colour combination on one screen will look exactly the same
or have the same effect on another screen. There are other important factors that make colour
interface design even more complex. Users are diverse in their colour perception capabilities, and
have cultural differences that affect meanings associated with colours. Salomon (1990) raises
some interesting issues regarding the use of colour in a display design. She distinguishes between
two interfaces issues regarding colour. Firstly, how to design interfaces that use colour to impart
information to the user. That is, to create interfaces where colour either provides the user with
information not available otherwise, or where colour redundantly reinforces information imparted
through another medium, such as text or shape. Secondly, how to design interfaces that allow
users to choose colours for their own devices.
Factual information can be imparted through colour coding. For example, a map uses colour
coding to indicate climatic zones by showing deserts in yellow and tropical rain forests in green.
Colour can also create an environment for the user on the screen. Skilled colour designers should
be involved throughout the design process. People often make mistakes and overuse colour to the
point that visual clarity is degraded. There are some quite horrific examples of abuse of colour use
in simulation systems (e.g., XCELL+, WITNESS) that seriously decrease their usability.
Interfaces that allow users to choose colours take the form of various colour selection tools,
and can take the form of simple ‘pick one colour out of ten* tools to intelligent advisors that help
users select entire palettes of colours. Finding a suitable coding scheme can be difficult Often,
our instincts can lead to good codes. Providing a legend, as many maps do, may be a good
alternative when less intuitive codes are used. Additionally, codes can be learned over time.
J. Kuljis User Interfaces and Discrete Event Simulation Models Page 226
Chapter 6: Proposed Enhancements
Through cultural conditioning we have developed quite a few strong colour associations. Colour
can be used to give a user intimation of reality. It can improve a user’s understanding of the
situation and support immediate comprehension. When presented in conjunction with certain
shapes and locations, colour can create strong associations and therefore aid recognition and recall
(Salomon, 1990). These factors have a direct implication to visual simulation where a visual
representation of a ‘real world’ problem should be made as realistic as possible. Symbolic
representations hinder recognition and require much more mental effort on the part of the user.
Salomon (1990) proposes several ways that the users can be helped in selecting colours for
interface displays. She proposes that the users should be given a facility for choosing a colour by
mixing colours that are not based on a standard colour mixture using red, green, and blue colour
parameters, which are often represented as number parameters which are difficult to use and do
not correspond with peoples’ everyday experience in mixing colours. If users have to select more
than a single colour at a time, they should be supported by a tool that helps the selection of a set of
colours that work together. Non expert colour users could benefit from a program that would
provide a dynamic, interactive way to examine numerous colour combinations. Programs that
provide assistance to the user in colour related tasks could be tailored to various application
domains. Simulation systems where use of graphic and colour is a standard should therefore be
very good candidates for such assistance. The assistance should be provided as an integral part of
the icon editor and as an environmental adviser when all graphical objects are put into context
(background, icons, graphs, text, etc.). This provision would promote faster development of
graphic objects, improve the clarity and legibility of screen objects, and thus promote
effectiveness and leamability of the system.
6.2.3 Flexibility of Interaction
The structural context in the model should be expressed clearly, so that the graphical
representation makes visible the relations in the model like the dependency or non dependency of
activities or events. Kamper (1993) argues that the sequence in which the model components are
combined, with the possibility to change between the task of combining elements and selecting
constructs from the library, should be decided by the model builder. This sort of flexibility is
J. Kuljis User Interfaces and Discrete Event Simulation Models Page 227
Chapter 6: Proposed Enhancements
present in all examined simulation systems. What we advocate as flexibility of interaction goes
beyond the freedom to choose sequence in which the tasks are performed.
Flexibility of interaction should include changing the system environment to suit the
developer’s preferences and saving the preferred environment for future use. Changes in
environment can include elementary changes like, for example, background colour, placement of
application tool bars and menus, placement and size of application windows and dialogue boxes,
text font types, etc. More advanced changes can include changes in the main application menu
like, for example, changing selection names, selection order, adding selections to the menu, etc.
In addition, users should be supported to tailor fill-in forms by changing form layout, colour, or
by including additional labels. The user should be given the opportunity to choose a preferred
navigation technique, or to design navigation shortcuts setting his/her own commands for such
shortcuts. If the user is given the freedom to tailor the environment to carry out tasks in a desired
or in a familiar way the effectiveness with which the tasks are performed will increase. This
flexibility will also promote a positive attitude towards the system.
63 Data Input/ Model Specification
The least effort in existing simulation systems has been invested into data input facilities. It is
apparent that this part of the system is considered as less important than, for example, the visual
simulation part. Most of the papers on simulation systems only briefly mention the data input
capabilities of systems, if at all. However, there is room for a great deal of improvement in the
domain of data input and/or model specification that would improve existing simulation systems.
We have already mentioned that data validation is supported in only two of the six examined
simulation systems. None of the systems offers database capabilities for keeping multiple
variations of a model. Data input forms, if available, are generally poorly designed. There is no
help provision for individual data fields. Importing data files is supported in four of the examined
systems. The format of imported data is usually an ordinary ASCII text file. Therefore, there is
much to be improved in the way the simulation data is communicated to the systems. The
following list represents features that every simulation would benefit from, some of which are
already reported on in Kuljis (1994): data independence, modeless dialogue, facilities for
J. Kuljis User Interfaces and Discrete Event Simulation Models Page 228
Chapter 6: Proposed Enhancements
representation of complex data structures, data validation facilities, on-line help facility, and
facilities to accept data from some of the major database and spreadsheet software.
Dialogue independence
As already mentioned earlier, it is important that each part of the system preserves the
independence of the interface part from the processing part. This requirement is particularly
important for the data input or model specification. The metaphor for internal data representation
should not determine the metaphor on how the data is presented to the user. The data should be
presented to emphasise the user task and the task domain as far as possible. The screen design for
data input should be independent of the data, so that changes in the display design do not affect
the data. Data independence is essential if flexibility of interaction is to be provided.
M odeless dialogue
When providing interaction through which data input is provided to the system it is important to
let the user escape an endless loop if he/ she wants to abandon the current operation/ procedure.
Modal dialogue boxes can be quite off-putting and, if used in a system, they have to be supported
by adequate guidance as to how to respond to a request.
Facilities fo r representation o f complex data structures
Simulation models can have complicated logic with complex interactions among their entities that
is not always supported by the data input facilities of the existing simulation systems, especially
for new problem domains. The large volume of data, data complexity and provisions for keeping
the definition for more that one model configuration, calls for sophisticated data storing facilities,
possibly a database management system, which in addition supports data integrity. Mathewson
(1989) recognises the value of database facilities to enable the user to carry over some of the
experiences and benefits of previous models. The proposed provision would promote the
effectiveness of the system enabling the user to relatively easily handle the data required to specify
a model.
J. Kuljis User Interfaces and Discrete Event Simulation Models Page 229
Chapter 6: Proposed Enhancements
Data validation facilities
Data validation has several aspects: validation of a single input against a permitted range of values;
validation of the overall consistency of data; and validation of the logic of the system. Validation
of a single input is simple and if not already provided in the system can easily be added. The valid
data range or set that was supplied by the user, or the vendor, can be used. The problem can be
how to check the overall data consistency. If the data is kept using a database system some of the
inconsistency can be resolved by the inherent database facilities. Of course, the consistency of
data that influences the logic of the model cannot be checked. If a system has data validation
facilities, errors related to data being out of a valid range can often be prevented. This provision
increases user confidence in the system and the effectiveness of the system.
On-line help facilities
The end user can be aided in using the system if the system provides help facilities. These
facilities can be implemented in the different levels of the system. At the lowest level help can be
provided for each individual input and for general usage of the system. Examples of valid values
can be provided at least for the fields which are not provided with default values (it is not always
obvious which default values will be appropriate, and if inappropriate default values are supplied
they can confuse the user). At a higher level, help can be provided to explain the consequences of
a particular action or set of actions, explanation of error messages, and explanation of some more
specialised concepts, e.g. the statistical concepts used. On-line help can be invaluable if pre
emptive (modal) dialogue is used in a system. A good on-line help provision is important in
promoting effectiveness, leamability, and a user’s positive attitude towards the system.
Facilities to accept data from some o f the major database and spreadsheet
softw are
Companies that keep most of their data on microcomputers use either a database or a spreadsheet.
It would be convenient to use the data in that format for the simulation model specification rather
than inputting it again in some other format required for some particular simulation software. File
compatibility with the market leader databases and spreadsheets would therefore be a very
desirable facility. If the user already has data, required for the modelling, stored in some other
J . Kuljis User Interfaces and Discrete Event Simulation Models Page 230
Chapter 6: Proposed Enhancements
application, the proposed provision would enable a fast data transfer and therefore increase
effectiveness and promote user willingness to use the system.
6.4 Visual Simulation
Many authors argue that the advantages of VIS include better validation, increased credibility (and
hence model acceptance), better communication between modeller and client, incorporation of the
decision maker into the model via interaction, and learning via playing with the VIS. However,
there is little published empirical evidence to substantiate these claims. Computer animation is one
of many techniques used in the process of simulation model validation and verification. Through
computer animation a “model’s behaviour is displayed graphically as the model moves through
time” (Sargent, 1991). In addition, animation can be used to enhance a model’s credibility and,
according to Law and Kelton (1991), it is the main reason for animation’s expanding use. Swider
et al. (1994) feel that animation can provide convincing evidence that model behaviour is
representative of the system under study. Cyr (1992) see advantage of using animation in its
ability to demonstrate problems with the model itself which would otherwise be difficult to detect.
Kalski and Davis (1991) point out that summary statistics sometimes do not show the active
interactions of processes in a system, and they advocate the use of animation as an aid to the
analyst in identifying the system status under which, for example, bottlenecks occur. There are
many animation proponents in the simulation community, especially the software vendors,
claiming the benefits of animation. However, there is very little published empirical evidence
which would suggest how to design effective animation. As we have already discussed in chapter
2, there are many problems in clearly depicting the model behaviour through an animation display.
The problem is recognised by O’Keefe and Pitt (1991) who find that the acquisition of more
formal evidence will provide a better scientific basis for research and development in VIS, and
more importantly, it will aid the provision of guidelines on pragmatic issues such as animation
design, display preference, and required interaction style. They conducted an experiment where
25 subjects were asked to solve a set problem using a VIS model. The use of the model was
monitored by the simulation program. The aim was to determine what sort of display (an
animation, a listing, and dynamically changing icons) was preferred and how the choice of a
display type influences the performance. They found that subjects have a strong preference for
J. Kuljis User Interfaces and Discrete Event Simulation Models Page 231
Chapter 6: Proposed Enhancements
either the animation or the graphics. No subject made use of the listing. The other important
finding is that there is no observable pattern of usage that directly affects performance. The
authors therefore advocate that VIS should be made more flexible and less constraining.
Flexibility in interactions and different types of displays should allow the VIS to be usable
irrespective of the users cognitive style, as long as each type using the VIS can have access to
their preferred display. Carpenter et al. (1993) conducted an experiment with 47 subjects to
examine how well the animation communicated the operation of the simulation model. They
considered combinations of three aspects of animation - movement, detail of icons, and colour.
The results suggested that movement of icons is more important than their detail or colour in
communicating the behaviour of a simulation model with moving entities. The subjects identified
problems more accurately in less time when viewing animation with movements than without
movements. Another experiment examined the role of animation in communicating invalid model
behaviour. Swider et al. (1994) used 54 subjects to obtain objective and subjective measures in
determining which combinations of animation presentation and speed were best for displaying
violations of model assumptions. The objective results indicated that the slower presentation speed
was superior to the faster speed and that animation with moving icons was superior to animation
with bar graphs. A slower presentation speed resulted in significantly shorter response times with
the same or better problem identification accuracy. Based on the results of this study, Swider at el.
(1994) recommend: the use of pictorial display with moving icons for simulation models with
moving entities; the facility to set the presentation speed to make discrete differences visible; and
to avoid overloading the user with too much visual information.
The results of the above two studies are not surprising and they match our intuition and
common-sense. However, their importance is in substantiating our intuitive judgement with some
mote concrete evidence. Animations with moving icons are often used in current simulation
systems even though presentation of animation is not often well thought about. Ideally, it may
seem desirable to present information on the screen that has characteristics similar to the objects
we perceive in the environment. The visual system could then use the same processes that it uses
when perceiving objects in the environment. Graphical means of description must be given
preference over written ones because they present information in a more compact manner. Factors
that contribute towards the meaningfulness of a stimulus are the familiarity of an item and its
J. Kuljis User Interfaces and Discrete Event Simulation Models Page 232
Chapter 6: Proposed Enhancements
associated imagery. The graphical representation of constructs for different applications should
give definite information about the type of model component it represents, such as waiting
queues, customers or servers in queuing systems or stores, or suppliers in store keeping systems
(Kamper, 1993). Designing manufacturing applications, as suggested by Preece et al. (1994),
might benefit from the use of realistic images in helping the users design and create objects.
However, they anticipate that there might be a problem in the high-cost of real-time image
generation and that for the actual needs of an application, such a degree of realism is often
unnecessary. Nevertheless, we believe that it can help if some approximations of real life objects
are used, Stasko’s (1993) animation design recommendations reported in chapter 5 should be
observed. These recommendations state that animation should provide a sense of context, locality,
and the relationship between and after states. Furthermore that the objects involved in an
animation should depict application entities and that the animation actions should appropriately
represent the user’s mental model. If these recommendations were followed, the effectiveness,
leamability, and the enthusiasm of a wider user population to use simulation systems might
increase.
Animation speed in simulation systems is commonly made adjustable by their users. There are
some problems with the animation speed that are not envisaged by the software developers.
Simulation software is built for a particular hardware configuration and therefore for a particular
processing speed (in MHz). The speed of animation (moving icons) is dependent on the computer
processor speed. Hardware developments are much faster than software developments and by the
time simulation software, based on a particular configuration, has reached the market it may well
happen that the market has already adopted much faster computers. The user will probably install
software on a much faster computer than it was intended for. Even though the user may have a
facility to change animation speed, the slowest available speed may still be too fast for an
animation observer. We have experienced that problem ourselves whilst examining simulation
software reported in chapter 2. Therefore, simulation software developers have to pay attention to
that aspect and provide a facility that can cope with speed irrespective of the processing speed.
This will enable the user to understand what is happening in the model and hence promote the
overall usability of the system.
J. Kuljis User Interfaces and Discrete Event Simulation Models Page 233
Chapter 6: Proposed Enhancements
The eye-catching, appealing nature of animation can tempt designers to apply too many facets
to an interface. Animation is, however, another attribute in which the often quoted design
principle “less is more” does apply. Nevertheless, if the screen design is kept clean, simple, and
well organised some redundant information can be quite useful to the user. This is exemplified in
the case study CLINSIM where the animation screen is divided into two areas - realistic animation
with moving icons representing the model’s entities, and the information part that keeps the user
informed on queue sizes, time, and patients’ waiting times. The moderation principle is something
that many simulation system developers should learn about. User interfaces that have screens
crowded with too many objects, large numbers of offensive colours and incompatible colour
schemes is more of a rule than an exception. To enable ‘good’ design for animation, the tools that
facilitate graphics design should be made sophisticated enough to support such developments.
Therefore tools should: provide greater number of drawing object templates; provide an extensive
colour palette (at least 64 colours) and colour aiding facility; support modification of graphic
objects (erasing parts of graphics, filling whole or parts of graphic objects with colours or
patterns, resizing, rotating, flipping, etc.); provide on-line help; combining several graphical
objects into one; and so on.
6.5 Simulation Statistics/Results
In each model, special components are necessary to carry out statistical computations. The model
builder should have the choice to combine such statistical components, dependent upon his/her
computational requirements, with those representing the real system. In order to make plain the
difference between these “artificial’ objects and those representing the real system, the artificial
objects should be represented by an icon which clarifies the character of such objects (Kamper,
1993). A simulation is a computer-based statistical sampling experiment Thus, if the results of a
simulation study are to have any meaning, appropriate statistical techniques must be used to
design and analyse the simulation experiment Law (1983) points out that the output processes of
virtually all simulations are non stationary (the distributions of the successive observations change
over time) and auto correlated (the observations in the process are correlated with each other).
Thus, classical statistical techniques based on independent identically distributed observations are
not directly applicable.
J. Kuljis User Interfaces and Discrete Event Simulation Models Page 234
Chapter 6: Proposed Enhancements
Graphical coding can provide a powerful way of displaying quantitative data. In particular,
graphs are able to abstract important relational information from quantitative data. The main
advantages of using graphical representations (Preece et al., 1994) are that it can be easier to
perceive:
• the relationships between multidimensional data,
• the trends in data that are constantly changing,
• the defects in patterns of real-time data.
Considerable effort has been invested in the presentation of simulation results. Often this
effort lacks proper insight into the particular needs of simulation systems. Pidd (1992b) argues
that there is no need for special facilities for representing simulation results and performing
statistical analysis since the data can be imported into a standard analysis program. This
dissertation argues that, even though much has already been done in graphical representation of
simulation results, there are still issues that need to be tackled to improve the usability of
simulation systems, some of which are already reported by Kuljis (1994): inter-connectivity of the
results, explanation facilities, representation of results independent of the processing (i.e. interface
independence), a facility to modify graphs, facilities to save results in files compatible with the
major database and spreadsheet packages, and a facility to print tables and graphs.
Inter-connectivity o f the results
Summary statistics sometimes do not show the active interactions of processes of a system. There
is a need for some logical connection of the isolated statistical results. Such a facility should
provide insight in the reasons for the particular behaviour of the simulation experiment. An
Activity Cycle Diagram (ACD) might provide the logical inter-connectivity to underpin type
structures using similar links to those used in hypertext systems for presenting output analysis, a
navigation system and the inter-relationships. Some preliminary research has already been done to
see how machine learning techniques can supply the links among dependent variables (Mladenic et
al., 1993). The proposed facility would benefit the users with a better understanding of the model
behaviour and therefore promote the effectiveness of the system. The effectiveness of any
decision-support system, like for example a simulation system, is determined mostly by the extent
to which it actually aids its users in the decision process.
J. Kuljis User Interfaces and Discrete Event Simulation Models Page 235
Chapter 6: Proposed Enhancements
Explanation facilities
In the case where a simulation system is developed for an end-user, there is a need to provide an
explanation of the simulation results. Regardless of how attractively these results are presented,
end-users often lack the mathematical background necessary for understanding the simulation
results. As Bell (1991) points out, “...replacing numbers with multi-coloured graphics does not
necessarily improve the usefulness of the display for decision making”. It is questionable which
method would be best suited for this purpose, since every interpretation depends on the model
specification. For example, O’Keefe (1986) considered expert systems as a possibility for taking
the role of explaining model results to the user. Mathewson (1989) recognises the need to aid the
user in the interpretation of results which are stochastic, and proposes a knowledge-based system
to take this role. Mladenic et al. (1993) see role of machine learning as an aid the interpretation of
simulation results. The proposed provision would greatly improve leamability and therefore the
effectiveness of simulation systems.
Representation o f results independent o f the processing (i.e. interface
independence)
Every simulation system, especially one developed for the end-user, should enable the display of
simulation results independently from the processing. This means that the results can be examined
after or during the simulation run. The sequencing of the results display should be left to the user
hence providing the user with greater flexibility in using the system.
A facility to modify graphs
While viewing the graphical representation of simulation output, the modeller often finds that the
graph representing the data is not appropriate to communicate accurately a particular simulation
outcome. Even though the modeller may have had a chance to set the graph type and scaling
whilst specifying simulation output prior to the simulation experiment, he/she cannot predict what
the output data will be. Therefore, the modeller should have a facility after the simulation
experiment, or if dynamic graphs are used during the simulation experiment, to modify the graph
type and scaling to an appropriate form for the actual data. This would provide the user with more
flexibility in using the system and enable him/her to present information in a form that better suits
his/her preferences or that improves the understanding of the results.
J. Kuljis User Interfaces and Discrete Event Simulation Models Page 236
Chapter 6: Proposed Enhancements
Facilities to save results in files compatible with the major database and
spreadsheet packages
Very often the results of a simulation experiment can give an insight into the company’s operating
practices and serve as a decision support tool. Statistical results can be incorporated in company
documents and reports. This is not always easily or elegantly done with existing simulation
software. It would be convenient to have files containing the simulation results exported into a
company standard spreadsheet, so that an adequate graphical presentation can be undertaken, and
the results can be incorporated into documents using a company standard word processing
package. It would probably be useful to have a facility to export the statistical data into the most
popular databases. The proposed provision would help the user to use the output data in a way
that is convenient and familiar to him/her and therefore promote a positive attitude towards the
system.
A facility to print tables and graphs
Printing graphs is still not a common facility in simulation systems whereas printing tables is
usually supported. However, it is often useful to have printouts of simulation output. Many
modellers resort to printing the screen which is awkward, or to grabbing screen images. The latter
is achieved using either Windows clipboards, or DOS screen capture software, or other similar
facilities. This provision would help the user to have the results of a simulation available for later
use. It can make it possible to conduct comparative analyses of several model scenarios.
Therefore, this facility would promote effectiveness. Like the previous facility, this provision
would also promote a user’s willingness to use the system.
6.6 User Support and Assistance
User manuals for simulation systems are usually poorly written and need a lot of improvements.
Of the six simulation systems we have examined only two provide Tutorial (Taylor II and Micro
Saint), three provide Getting Started (XCELL+, ProModel for Windows, and Micro Saint), two
provide Reference manuals (Pro Model for Windows and Simscript II.5). An index is provided in
all of them except XCELL+, but it usually lists only system concepts using a particular simulation
system’s terminology. Generally, terminology used in the user manual is too technical. Examples,
J. Kuljis User Interfaces and Discrete Event Simulation Models Page 237
Chapter 6: Proposed Enhancements
if provided, are not followed throughout the development process and are therefore of not much
use. On-line help very rarely provides help for all facilities and tools in the simulation
environment. Context-sensitive help is a rare commodity (it is only provided in Taylor II and
ProModel for Windows) and is almost unheard of for system messages (i.e. error messages). An
on-line tutorial is provided only in ProModel for Windows. Demonstration disks are provided for
three of the examined systems Taylor II, ProModel for Windows, and Micro Saint, and of these
three only ProModel provides a professional and carefully thought out product. Some of the
recognised problems with user support and assistance were already mentioned in chapter 4
together with suggestions on how to improve them. In this section we will, therefore, make only
suggestions on other ways of providing more appropriate user support such as extensive use of
interactive on-line tutorial help, customisation of user interfaces to suit a particular class of users,
adaptive user interfaces, and intelligent help.
Interactive tutorial help
On-line help is usually in the form of text screens which are descriptive or prescriptive in their
nature. They concentrates on what and how. Rarely do they tackle the question as to why some
action could be appropriate or beneficial, or what would be the consequences of a particular
action. If interactive on-line tutorials are available as an option within help screens, much
ambiguity and many answers to what-if questions would be resolved. It is easy to integrate
animation in these tutorials as well and, thus, provide full power that tutorials can offer. A good
interactive tutorial help can greatly improve system leamability, and therefore also its
effectiveness.
Customisation o f user interfaces
End users have unique habits, preferences, idiosyncrasies, and working styles. Attempts to force
end users to change these styles usually results in end user frustration and decreased productivity.
Larson (1992) advocates that all end users of an application system should not be forced to use the
same user interface; user interface designers can customise the user interface to the habits and
styles of user classes, rather than force the user to tailor his or her working style to the user
interface. Users vary in their age, gender, physical abilities, education, cultural or ethnic
background, training, motivation, goals, and personality. People learn, think, and solve problems
J. Kuljis User Interfaces and Discrete Event Simulation Models Page 238
Chapter 6: Proposed Enhancements
in very different ways. Therefore, often cited “Know the user'’ recommendations for user
interface design seem quite obvious. Usually, these recommendations mainly relates to users’
tasks and computer skills, where users are classified into novice, intermittent, and expert frequent
users. Multiple styles of user interfaces can be supported by careful design of an application’s
functional operations and by customising the user interface to the needs of end users in each class.
The ability to customise the user interface by the user promotes usability by providing more
flexibility in using the system, and by providing a more effective environment for its user.
When multiple usage classes must be accommodated in one system, one strategy is to permit a
structured approach to learning; another one might be to permit user control of the density of
information feedback that the system provides (Shneiderman, 1992). Novices want more
informative feedback to confirm their actions, whereas frequent users want less distracting
feedback. Trumbly et al. (1994) observe the following: gathered empirical evidence suggests that
user performance is improved when the interface characteristics match the user skill level; the fact
that user skill levels are not stagnant but rather dynamic and ever changing, hence it is proposed
that the interface characteristics must also change, thereby necessitating some kind of adaptive
user interface.
Adaptive user interfaces
The concept of an adaptive user interface involves changes based on some characteristics of the
user. The successful creation of an interface that adjusts to the skill level of the user suggests a
design that captures the best of both worlds (i.e. structure when needed and flexibility as
required). There have been limited attempts to develop a form of adaptive interface in the past, and
many top-selling microcomputer software products include limited adaptive user interfaces (i.e.
methods of activating commands). These adaptations are most often presented as user selectable
options. The user must have some confidence in making the choice among several pre-defined
options and there is no assurance that the user will make the most appropriate choice. However, it
is possible that optimal adaptation can be achieved for the majority of users when the software
assists the user in choosing the appropriate interface. To test this proposition Trumbly et al.
(1994) conducted an experiment in which a diverse class of users, in terms of computer skills and
knowledge, executed multiple trials of a manufacturing simulation game with different interfaces.
J. Kuljis User Interfaces and Discrete Event Simulation Models Page 239
Chapter 6: Proposed Enhancements
Since the experiment was conducted using a simulation game, and because it gives some
interesting ideas on possible adaptive user interfaces in the domain of simulation, we will describe
it in more detail.
Throughout the trials, a select group of users which demonstrated sufficient expertise was
automatically promoted to a different user interface. The experiment examined users’ profit and
interface performance with a “computer simulated outer space manufacturing facility”. The outer
space manufacturing facility simulation was unknown to the subject, thus avoiding any effect
from the specific task knowledge. Three different versions of the simulation game were
developed: a novice version, an experienced version, and an adaptive version. All three simulation
games executed with the same input and produced the same output. These three user interface
versions follow certain principles recommended in human factors literature. The novice version
includes the use of the menu dialogue style, completely descriptive error messages, on-line help,
automatic transfer from error conditions to help function, extensive use of default values, and
colour. The experienced version employs a command dialogue style, short messages, a simple
user selectable help function, and the absence of both default values and colour. Additionally, the
experienced version does not automatically transfer to the help function for error conditions.
Consolidation of the features of these two versions and the addition of the triggering software
produces an adaptive interface version. The adaptive version begins with the characteristics of the
novice version and ends with the characteristics of the experienced version. Once the user
completes a simulated production run without errors, this results in an interface change. The
absence of errors during a simulated production run is interpreted as adequate proficiency with the
current interface level.
The adaptive user interface demonstrated an impact on both the average profit and the error
ratio of the subjects participating in the manufacturing simulation game. Subjects who were
assigned to the adaptive user interface experienced a decrease in error ratio as their level of
computer knowledge moved from low to moderate then to high. In fact, the lowest error ratio for
high knowledge computer users was achieved with the adaptive user interface. The profit for
users of the adaptive user interface is higher for the users with low computer knowledge, dips
slightly for moderate computer knowledge, and rises again when computer knowledge is high.
For low computer knowledge users, the profit is essentially the same regardless of whether the
J. Kuljis User Interfaces and Discrete Event Simulation Models Page 240
Chapter 6: Proposed Enhancements
adaptive or novice interface is used. But, when high level computer knowledge users employ the
adaptive interface, error rations are lower and profits are higher. The adaptive user interface has
been shown to improve the user’s performance in task learning and interface learning and hence to
promote system usability.
Intelligent help
Some authors see that artificial intelligence can be applied to develop intelligent help facilities.
O’Keefe (1986) proposes that, used within simulation systems, the expert system can aid model
construction, run selection, or results analysis. Hurrion (1991) goes along with these
observations. He claims that VIM is a passive technique which is most effectively used by
experienced personnel, and although a VIM allows the user to initiate an interaction with a model,
the interactions from a model to the user are passive and are only possible as pre-programmed
conditions. He sees the way forward in developing Intelligent Visual Interactive Modelling
methods by the application of expert systems techniques. The aim of an intelligent simulation
environment is that the user, via a suitable interface, may get expert assistance with a simulation
project and therefore increase the understanding of the problem and the process promoting the
overall usability of the system. This help may take the form of determining boundary conditions
for a particular problem, and then letting the expert simulation system infer a solution from its
knowledge base. Expert simulation should also be able to explain its current reasoning at any
stage of a consultation.
6.7 Summary
In this chapter we examine what sort of changes in simulation systems will be beneficial in
improving their usability. These are summarised in Table 6.1. We identified five areas: the
simulation environment, data input, simulation experiments, presentation of output results, and
user support and assistance. We are aware that the listed suggestions resemble very much a small
child’s Christmas present wish list and that one can argue that it is a kitchen sink approach. We
recognise that some of the suggestions are too expensive to implement or premature for the current
state of research. Nevertheless, the list can serve as a source of ideas and a basis for further
research in this area. Given the current state of research in the area, this chapter presents a
J. Kuljis User Interfaces and Discrete Event Simulation Models Page 241
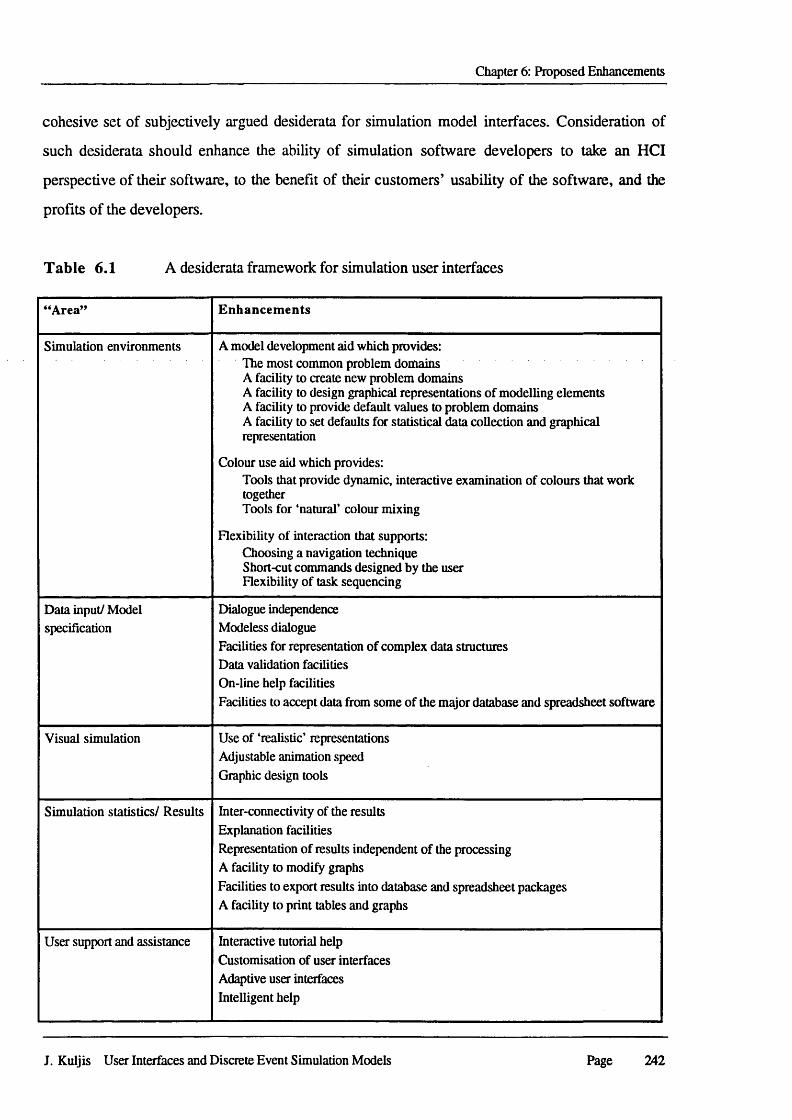
Chapter 6: Proposed Enhancements
cohesive set of subjectively argued desiderata for simulation model interfaces. Consideration of
such desiderata should enhance the ability of simulation software developers to take an HCI
perspective of their software, to the benefit of their customers’ usability of the software, and the
profits of the developers.
Table 6.1 A desiderata framework for simulation user interfaces
“ Area” Enhancem ents
Simulation environments A model development aid which provides:The most common problem domains A facility to create new problem domainsA facility to design graphical representations of modelling elements A facility to provide default values to problem domains A facility to set defaults for statistical data collection and graphical representation
Colour use aid which provides:Tools that provide dynamic, interactive examination of colours that work togetherTools for ‘natural’ colour mixing
Flexibility of interaction that supports:Choosing a navigation technique Short-cut commands designed by the user Flexibility of task sequencing
Data input/ Model specification
Dialogue independence Modeless dialogueFacilities for representation of complex data structures Data validation facilities On-line help facilitiesFacilities to accept data from some of the major database and spreadsheet software
Visual simulation Use of ‘realistic’ representations Adjustable animation speed Graphic design tools
Simulation statistics/ Results Inter-connectivity of the results Explanation facilitiesRepresentation of results independent of the processing A facility to modify graphsFacilities to export results into database and spreadsheet packages A facility to print tables and graphs
User support and assistance Interactive tutorial help Customisation of user interfaces Adaptive user interfaces Intelligent help
J. Kuljis User Interfaces and Discrete Event Simulation Models Page 242
Chapter 7: Summary and Conclusions
In this chapter we provide a summary of the results and findings in this dissertation. We draw out
the major conclusions of the research described in this dissertation. Finally, we suggest some
ideas for future research.
7.1 Summary
A user interface is Critical to the success of any system. Numerous studies have shown that
interface design has a significant influence on factors such as learning time, performance speed,
error rates and user satisfaction (Jones, 1988). The efficiency of man-machine systems as a whole
is determined to a large extent by the efficiency of man-machine interaction, and hence by the
quality of the man-machine interface. The aim is to develop interfaces which accurately fulfil the
user’s requirements and which answer the user’s cognitive needs, accurately supporting his or her
natural cognitive processes and structures. Although some amount of training must always be
expected in order for a user to become maximally proficient with a given system, it is, in general,
easier to modify the characteristics of a computer system than those of the users.
In Chapter 1 we introduced the basic issues related to research presented in this dissertation. It
provides essential information regarding simulation modelling and human-computer interfaces.
We identify research methods we have applied whilst conducting this research and finally,
establish the objectives of the research.
In Chapter 2 we provide an overview of some basic concepts in human-computer interaction.
We introduce interaction in the context of simulation modelling and provide an examination of
several simulation software packages in terms of user interfaces. An interface can be in the form
of a sequential dialogue, which includes request-response interactions, typed command strings,
navigation through networks of menus, and data entry; or in the form of a model world (direct
manipulation) where the end-user is shown what to do by ‘grabbing’ and manipulating (e.g., with
a mouse) visual representations of objects. We try to evaluate the usability of each simulation
system examined against established usability criteria identifying how the usability is supported
and what are the major usability defects.
J. Kuljis: User Interfaces and Discrete Event Simulation Models Page 243
Chapter 7: Summary and Conclusions
In Chapter 3 we describe the CLINSIM case study, its motivation, design and
implementation. CLINSIM was built within a number of severe constraints, such as target
machine, cost, free run-time licensing, software availability and constraints, Department of Health
requirements, and limitations of the expertise of the developers.
In Chapter 4 we critique the case study in terms of user interfaces. CLINSIM has a custom-
made user interface that can be evaluated in terms of its usability. Against the established usability
criteria we identify deficiencies in the case study and a good practice, where appropriate.
In Chapter 5 we examine the relevance of HCI research to simulation systems. We examine
the characteristics of major participants in the human-computer interaction and the characteristics
of the interaction itself. The major participant is the human, the user, the one whom computer
systems are designed to assist. We give an overview of the most influential theories in HCI and
their contribution to the design of more usable computer systems. We try to see how the
accumulated knowledge and theories in HCI can help in our particular problem - the design of
user interfaces to discrete simulation systems. It is noticeably easier to see the direct relevance and
applicability of design guidelines than HCI theories. The problem is maybe more in HCI theories
and their general applicability to the design of interaction systems, than it is in its particular
relevance to simulation systems.
In Chapter 6 we provide a proposed contribution to this field of research. We consider user
interfaces to simulation systems and analyse how they can be enhanced to provide better usability
and support for their users. User interfaces to simulation are no less deficient than for other
application domains. Existing simulation systems have a relatively high standard of graphical
capabilities, especially when it comes to animation. These standards are not matched in data input
facilities, in the presentation of simulation results, and in the user support and assistance
provided. Effort needs to be concentrated on making these aspects of simulation systems more
appropriate for the particular needs of such a highly specialised domain. Although the discussion
in the dissertation concentrates on discrete event simulation, most of the conclusions have some
wider applicability to simulation systems in general, including continuous simulation. The
development of simulation software that has the ability of flexible modelling and all the features
listed in the previous chapter is a considerable, albeit desirable, task.
J. Kuljis User Interfaces and Discrete Event Simulation Models Page 244
Chapter 7: Summary and Conclusions
7.2 Conclusions
Mandelkem (1993) argues that the typical GUI represents the structure of the interface as the
“virtual office” on the computer screen, that is appropriate for those applications that are
representative of the actual work that takes place within the traditional office environment.
However, this metaphor becomes less useful as the computing environment is adapted to less
similar environments. In such cases it is desirable to provide a user interface metaphor that is more
representative of the physical paradigm with which the user is familiar. Nielsen (1993) argues that
one of the defining characteristics of next-generation user interfaces may be that they abandon the
principle of conforming to a canonical interface style and instead become more radically tailored to
the requirements of the individual task.
We agree with the last statement, and in this dissertation argue that in order to enhance the
usability and more general acceptance of simulation systems we should only apply findings from
HCI research where appropriate. It obviously requires that we should not blindly follow common
user interface structures. Applying guidelines and metaphors that are appropriate for one
environment can be inappropriate, or even disastrous, for completely different problem domains.
Nevertheless, even this selective approach requires us to be well informed about developments in
HCI. Simulation modelling is an unusually rich domain, and therefore a worthy one to be
researched into by the HCI community. Maybe it is up to simulation community to give a
necessary impetus in this direction. In this research we have proposed some steps in hope that
others will follow.
The research that we have conducted and that we describe in this dissertation has led to the
derivation of many findings. These findings are summarised below:
1. We established that simulation modelling provides an unusually complex domain that requires
user interfaces which should provide modelling environments to support their users. We have
examined the user interface characteristics of simulation systems. We evaluated their usability
against the established usability criteria. We have identified some of the good practices that
support usability and also have pointed out where there are usability defects and a need for
improvements.
J. Kuljis User Interfaces and Discrete Event Simulation Models Page 245
Chapter 7: Summary and Conclusions
2. The experience obtained from the case study revealed that there is still inadequate support to
model some classes of problems. This experience also stressed the need for user interface
tools to supplement model developments for those problems. There is also a need for tools
that would facilitate better integration of various model components to ensure model
consistency.
3. Based on the literature, case study material, and investigations of six popular and often quoted
simulation systems, we have made several proposals on how the usability of simulation
systems can be improved. Specifically we have proposed what sort of modelling environment
would be appropriate to support modellers in the model development process. The major
recommendations are:
i) Integrated simulation environments with the following characteristics:
A model development aid that provides:
The most common problem domains
A facility to create new problem domains
A facility to design graphical representations of modelling elements
A facility to provide default values for problem domains
A facility to set defaults for statistical data collection and graphical representation
Colour use aid which provides:
Tools that provide dynamic, interactive examination of colours that work together
Tools for ‘natural’ colour mixing
Flexibility of interaction such as:
Choosing the navigation technique
Short-cut commands designed by the user
Flexibility of task sequencing
ii) Data input/Model specification with the following features:
Dialogue independence
Modeless dialogue
Facilities for representation of complex data structures
Data validation facilities
J. Kuljis User Interfaces and Discrete Event Simulation Models Page 246
Chapter 7: Summary and Conclusions
On-line help facilities
Facilities to accept data from some of the major database and spreadsheet software
iii) Visual simulation that provides:
Use of ‘realistic’ representations
Adjustable animation speed independent of processing speed
Graphic design tools
iv) Simulation statistics/Results with the following features:
Inter-connectivity of the results
Explanation facilities
Representation of results independent of the processing
A facility to modify graphs
Facilities to export results into database and spreadsheet packages
A facility to print tables and graphs
v) User support and assistance with the following features:
Interactive tutorial help
Customisation of user interfaces
Adaptive user interfaces
Intelligent help
73 Future Work
There are almost endless possibilities for future research. This is partially due to the complex
nature of simulation systems of which many aspects involve relatively new developments, and
hence are not much researched into. Partially it is due to the comparably new research area of
human-computer interaction. Therefore our proposal for future research is just a small subset of
the possible research directions in this area.
It would be particularly interesting to conduct an evaluation of the usability of existing
simulation systems and a comparable analysis of the results. These comparable results may
indicate what are the important factors that determine the usability of such systems. We should not
J. Kuljis User Interfaces and Discrete Event Simulation Models Page 247
Chapter 7: Summary and Conclusions
assume that the factors used for the general usability criteria and often cited in the HCI literature
apply equally to the domain of simulation modelling. Another interesting study can be an
examination of how symbolic versus ‘realistic’ animation influences modelling performance, i.e.
how it affects the decision making of the modeller. We have mentioned that the majority of
simulation systems often use graphics to represent the results of a simulation experiment.
However, the basis for using a particular graphical technique to depict the numerical results is
often questionable. It would be valuable to evaluate how the different graphical techniques
influence an analysis of simulation output, and how this is manifested in the conclusions that the
modeller or the decision maker infers from the output provided. Another related and interesting
research topic can be the evaluation of the role that the dynamic icons/graphs play in model
verification, and their suitability for use in measuring the performance of particular models.
Many simulation systems use some sort of diagramming technique to represent the logic of the
problems being modelled. However, it is unknown whether the technique chosen in a system has
any influence on the final model validity. An evaluation of different diagramming techniques in
usability terms is another area that might provide better insight into the relationship between model
representation, its validity, and the specification of the model that evolves in the process. An
evaluation of different simulation screen layout options (e.g., what should be on the screen and
where, and the maximal number of objects on the screen) might provide knowledge about the
importance and relevance of displaying particular simulation objects on the screen.
The above research proposals deal mostly with the evaluation of simulation systems that are
already available. These studies would undoubtfuly be valuable for providing some sort of criteria
and guidelines for future developments. However, more exciting research lies in the development
of new paradigms and new technologies. We proposed some enhancements of simulation
modelling environments. Many of these proposals would require further research to be practical.
This particularly applies to the development of aids for output analysis that would also provide
some analysis of the inter-dependence of simulation output results. Related to that is the
development of suitable graphics that can support representations for multi-dimensional data.
Another area that can be researched into is the development of better modelling environments
that would support more general problem domains. Some recommendations on what such
J. Kuljis User Interfaces and Discrete Event Simulation Models Page 248
Chapter 7: Summary and Conclusions
environments should facilitate are given in Chapter 6. This can include, among others, the
development of drawing tools that support the creation of simulation objects. Of special interest
would be the development of a facility to aid in the choice of colours, particularly in the dynamic
environment of animation. Probably the most challenging area is research into the development of
flexible user interfaces for simulation systems. This might be some sort of ‘meta user interface’
that can be used, both to create user interfaces for particular problem domains, and to modify itself
for the particular needs or style of its users. It should also facilitate the development of customised
user support facilities.
The above proposals are just a few possible research directions. The domain of visual
simulation modelling is so rich that is impossible to envisage how it might develop in the future,
since developments so far were very much dependent on developments in the new technologies.
However, that makes the research even more exciting and fascinating.
J. Kuljis User Interfaces and Discrete Event Simulation Models Page 249
References
Abowd, G.D. and R. Beale (1991). Users, systems and interfaces: a unifying frame-work for
interaction. In Diaper, D. and N. Hammond (eds.). HCV91: People and. Computers VI,
Cambridge: Cambridge University Press, pp.73-87.
ACM Special Interest Group on Computer-Human Interaction Curriculum Development Group
(1992). ACM SIGCHI Curricula for human-computer interaction, Technical report, New
York: Association for Computing Machinery, Inc.
Albers, J. (1969). One plus one equals three or more: Factual facts and actual facts. In J. Albers
(ed.) Search Versus Re-search, Hartford, pp. 17-18.
Anderson, J.R. (1983) The architecture o f cognition. Cambridge, MA: Harvard University Press.
Anderson, N.S. and J.R. Olson (eds.) (1985). Methods for designing software to fit human
needs and capabilities. Proceedings o f the Workshop o f Software Human Factors, National
Research Council, Washington, D.C.: National Academy Press.
Apple Computer, Inc. (1992). Macintosh human interface guidelines. Reading, Ma: Addison-
Wesley,
Baecker, R.M. and W.A.S. Buxton (Eds.) (1987). Readings in Human-Computer Interaction.
San Mateo, Ca: Morgan Kaufmann Publishers, Inc.
Baecker, R. and I. Small (1990). Animation at the interface. In B. Laurel (Ed.) The art o f human-
computer interface design, Reading, MA: Addison-Wesley Publishing Company, Inc., pp.
251-267.
Barfield, L. (1993). The user interface. Concepts & design. Wokingham: Addison-Wesley
Publishing Company.
Bell, P.C. (1991). Visual interactive modelling: Past, present and prospects. European Journal o f
Operational Research, Vol. 54, No. 3, pp. 274-286.
J. Kuljis: User Interfaces and Discrete Event Simulation Models Page 250
References
Bellotti, V. (1988). Implications of current design practice for the use of HCI techniques. People
and Computers IV. Proceedings o f the 4th Conference o f BSC HCI Specialist Group,
Cambridge University Press.
Benyon, D. and D. Murray (1988). Experience with adaptive interfaces. The Computer Journal,
Vol. 31, No. 5, p. 465.
Bertin, J. (1981). Graphics and graphic information processing. Berlin.
Bertino, E. (1985). Design issues in interactive user interfaces. Interfaces in Computing, Vol. 3,
pp. 37-53.
Bobrow, D.G., S. Mittal and M.J. Stefik (1986). Expert systems: Perils and promise.
Communications o f the ACM , Vol. 29, No. 9, pp. 880-894.
Booth, P. (1989). An introduction to human-computer interaction. Hove: Lawrence Erlbaum
Associates.
Booth, P.A. and Marsden, P.H. (1989). The future of human computer interaction. In Booth, P.
A. An Introduction to Human-Computer Interaction, Hove: Lawrence Erlbaum Associates,
pp. 205-230.
Bright, J.G. and K.J. Johnston (1991). Whither VIM? - A developers’ view. European Journal
o f Operational Research, Vol. 54, No. 3, pp. 357-362.
Buchanan, B.G. and E.H. Shortliffe (1984). Rule-based expert programs: the MYCIN
experiments o f the Stanford heuristic programming project, Reading, MA: Addison-
Wesley.
Card, S.K, T.P. Moran and A. Newell (1983). The psychology o f human-computer interaction.
Hillsdale, N. J.: Lawrence Erlbaum Associates.
Carpenter, M.L., K.W. Bauer Jr., T.F. Schuppe and M.V. Vidulich (1993). Animation: What’s
essential for effective communication of military simulation model operation? Proceedings
o f the 1993 Winter Simulation Conference, Los Angeles, California: Institute of Electrical
and Electronic Engineers, pp. 1081-1088.
J. Kuljis User Interfaces and Discrete Event Simulation Models Page 251
References
Carroll, J.M., W.A. Kellogg and M.B. Rosson (1991). The task-artefact cycle. In J.M. Carroll
(ed.) Designing Interaction: Psychology at the Human-Computer Interface, Cambridge:
Cambridge University Press.
Cox, K. and D. Walker (1993). User interface design. 2nc* ed., New York: Prentice Hall.
Crookes, J.G., D.W. Balmer, S.T. Chew and R.J. Paul (1986). A three-phase simulation
systems written in Pascal. Journal o f the Operational Research Society, Vol. 37, No. 6, pp.
603-618.
Cyr, R.W. (1992). Using animation to enhance a marine-terminal Monte Carlo simulator.
Proceedings o f the 1992 Winter Simulation Conference, Arlington, Virginia: Institute of
Electrical and Electronic Engineers, pp. 1000-1003.
Deininger, R.L. (1960). Human factors study in the design and use of pushbutton telephone
keysets. Bell System Technical Journal, Vol. 39, pp. 995-1012.
DHSS Operational Research Service (1985). Green Booklet: Reducing waiting time in out-patient
departments.
Dix, A., J. Finlay, G. Abowd and R. Beale (1993). Human-computer interaction. Hertfordshire:
Prentice Hall.
Eberts, R.E. (1994). User interface design. Englewood Cliffs: Prentice Hall.
Egan, D.E. (1988). Individual differences in human-computer interaction. In M. Helander (ed.)
Handbook o f Human-Computer Interaction. Amsterdam: Elsevier Science Publishers B.V.
North-Holland, pp. 543-568.
Ehrenberg, A.S.C. (1977). Rudiments of numeracy. Journal o f the Royal Statistical Society, Vol.
A, No. 140, pp. 277-297.
Eom, H.B. and Lee, S.M. (1990). A survey of decision support applications, Interfaces, Vol. 20,
No. 3, pp. 65-79.
Forrester, M. and D. Reason (1990). HCI ‘Intraface Model’ for system design. Interacting with
Computers, Vol. 2, No. 3, pp. 279-296.
J. Kuljis User Interfaces and Discrete Event Simulation Models Page 252
References
Galer, M., S. Harker and J. Ziegler (eds.) (1992). Methods and tools in user-centred design for
information technology, Amsterdam: Elsevier Science Publishers (North-Holland).
Galliers, R.D. (1992). Choosing information systems research approaches. In R.D. Galliers (ed.)
Information Systems Research. Issues, Methods, and Practical Guidelines, Oxford:
Blackwell Scientific Publications, pp. 144-162.
Goitein, M. (1990). Waiting patiently. The New Journal o f Medicine, Vol. 323, No. 9, pp. 604-
608.
Grudin, J. (1989). The case against user interface consistency. Communications o f the ACM,
Vol. 32, No. 10, pp. 1164-1173.
Hall, J. (1993). Clinsim Study Final Report. London: Hoskyns Group.
Hartson, R.H and D. Hix (1989). Human-computer interface development: Concepts and systems
for its management. ACM Computing Surveys, Vol. 21, No. 1, pp. 5-92.
Hix, D. and R.H. Hartson (1993). Developing user interfaces. Ensuring usability through
product & process. New York: John Wiley & Sons, Inc.
Hlupic, V. (1993). Simulation modelling software approaches to manufacturing problems.
Unpublished PhD dissertation, London School of Economics, University of London.
Holder, R.D. and R.P. Gittins (1989). The effects of warships and replenishment ship attrition on
war arsenal requirements. Journal o f the Operational Research Society, Vol. 40, No. 2, pp.
155-166.
Holtzblatt, K. and S. Jones (1992). Contextual inquiry: A participatory technique for system
design. In Namioka, A. and D. Schuler (eds.) Participatory Design: Principles and
Practice, Hillsdale, NJ: Lawrence Erlbaum & Associates.
Hurrion, R. D. (1991). Intelligent visual interactive modelling. European Journal o f Operational
Research, Vol. 54, No. 3, pp. 349-356.
Institute of Health Services Management (1985). Action on Out Patient Services - Time to Move.
Booklet, ISBN 0-90-100344-1.
J. Kuljis User Interfaces and Discrete Event Simulation Models Page 253
References
Ives, B. (1982). Graphical user interface for business information systems. MIS Quarterly,
Special Issue, pp. 15-46.
Jones, S. (1988). Graphical interfaces for knowledge engineering: An overview of relevant
literature. The Knowledge Engineering Review, Vol.3, No.3.
Kalski, D.R. and A.A. Davis (1991). Computer animation with CINEMA. Proceedings o f the
1991 Winter Simulation Conference, Phoenix, Arizona: Institute of Electrical and Electronic
Engineers, pp. 122-127.
Kamper, S. (1993). A systematization of requirements for the user interface of simulation tools.
SAMS, Vol. 11, No. 2, pp. 107-119.
Kieras, D.E. (1988). Towards a practical GOMS model methodology for user interface design. In
M. Helander (ed.) Handbook o f Human-Computer Interaction. Amsterdam: Elsevier
Science Publishers B.V. North-Holland, pp. 135-156.
Kieras, D.E. and P.G. Poison (1985). An approach to the formal analysis of user complexity.
International Journal o f Man-Machine Studies, Vol. 22, pp. 365-394.
Kirkpatrick, P. and Bell, P.C. (1989). Visual interactive modelling in industry: results from a
survey of visual interactive model builders. Interfaces, Vol. 19, No. 5, pp. 71-79.
Klinger, A. (1991). Mnemonic assistance and user productivity. In A. Klinger (ed.) Human-
Machine Interactive Systems, New York: Plenum Press, pp. 89-101.
Kuljis, J. (1994). User interfaces and discrete event simulation models. Journal o f Simulation
Practice and Theory. Vol. 1, No. 5, pp. 207-221.
Kuljis, J., R.J. Paul, H. Malin and S. Thakar (1990). Designing an out-patient clinic modelling
package. Proceedings o f the 12th International Symposium “Computer at the University ”,
Cavtat, Croatia, pp. 6.3.1-6.3.7.
Kuljis, J. and R J. Paul (1991). Human-computer interfaces to modelling systems. Proceedings
o f the XIII International Conference on Information Technology Interfaces, Cavtat,
Croatia, pp. 401-407.
J. Kuljis User Interfaces and Discrete Event Simulation Models Page 254
References
Kuljis, J. and R.J. Paul (1993). Organising outpatient clinics using simulation modelling.
Submitted to The International Journal o f Management and Systems.
Kuljis, J. and R.J. Paul (1994). Outpatient clinic waiting times: A visual simulation approach
revisited. To be published in A. J. Hedley, W.C. Por, H.L. Ming, S.M. MGhee, J.
Johnston and R. Leung (eds.) Proceeding o f the Third Hong Kong (Asia Pacific) Medical
Informatics Conference, Hong Kong: Hong Kong Society of Medical Informatics Ltd and
Hong Kong Computer Society.
Larson, J.A. (1992). Interactive software. Tools for building interactive user interfaces.
Englewood Cliffs: Prentice Hall.
Law, A.M. (1983) Statistical analysis of simulation output data. Operations Research, Vol. 31,
No. 6, pp. 983-1024.
Law, A.M. and D.W. Kelton (1991). Simulation modeling and analysis, 2nd ed., New York:
McGraw-Hill
Lindgaard, G. (1994). Usability testing and system evaluation: A guide for designing useful
computer systems. London: Chapman & Hall.
Lutz, M.C. and A. Chapanis (1955). Expected locations of digits and letters on 10-button
keysets. Journal o f Applied Psychology, Vol. 29, pp. 314-317.
Mandelkem, D. (1993). GUIs The next generation. Communications o f the ACM , Vol. 36, No.
4, pp. 37-39.
Marcus, A. (1992). Graphic design for electronic documents and user interfaces. Reading, Ma:
Addison-Wesley.
Marcus, A. (1993). Human communication issues in advanced UIs. Communications o f the
ACM , Vol. 36, No. 4, pp. 101-109.
Mathewson, S.C. (1989). The implementation of simulation languages. In M. Pidd (ed.).
Computer Modelling for Discrete Simulation. Chichester: John Wiley & Sons, pp. 23-56.
J. Kuljis User Interfaces and Discrete Event Simulation Models Page 255
References
Mayhew, D J. (1992). Principles and guidelines in software user interface. Englewood Cliffs:
PTR Prentice Hall.
McDermott, J. (1982). Rl: A rule-based configurer of computer systems, Artificial Intelligence,
Vol. 19, No. 1.
Miller, D.P. (1981). The depth/breadth tradeoff in hierarchical computer menus. Proceedings o f
the Human Factors Society 25th Annual Meeting, pp. 296-300.
Miller, G.A. (1956). The magical number seven, plus or minus two: some limits on our capacity
to process information. Psychological Review, Vol. 63, No. 2, pp. 81-97.
Mladenic, D., I. Bratko, R.J. Paul and M. Grobelnik (1993). Using machine learning techniques
to interpret results from discrete event simulation. Proceedings o f the 15th International
Conference on Information Technology Interfaces, Zagreb, Croatia: University Computing
Centre, pp. 401-406.
Molich, R. and J. Nielsen (1990). Improving a human-computer dialogue. Communications o f
the ACM , Vol. 33, No. 3, pp. 338-348.
Morse, A. and G. Reynolds (1993). Overcoming current growth limits in UI development.
Communications o f the ACM , Vol. 36, No. 4, pp. 73-81.
Murch, G.M. (1987). Colour Graphics - Blessing or Ballyhoo? In R.M. Baecker and W.A.S
Buxton (eds.).Readings in Human-Computer Interaction. Los Altos, California: Morgan
Kaufmann Publishers, Inc., pp. 333-341.
Myers, B. A. and M. B. Rosson (1992). Survey on user interface programming. Proceedings o f
HCI Conference on Human Factors in Computing Systems, New York: ACM, pp. 195-
202.
Newell, A. and H. Simon (1972). Human problem solving. Englewood Cliffs, N.J.: Prentice
Hall.
Nielsen, J. (1993). Noncommand user interfaces. Communications o f the ACM , Vol. 36, No. 4,
pp. 83-99.
J. Kuljis User Interfaces and Discrete Event Simulation Models Page 256
References
Norman, D.A. (1986). Cognitive engineering. In D.A. Norman and S.W. Draper (eds.), User
Centered System Design., Hillsdale: Lawrence Erlbaum, pp. 31-61.
Norman, D.A. (1987). Some observations on mental models. In R.M. Baecker and W.A.S
Buxton (eds.).Readings in Human-Computer Interaction. Los Altos, California: Morgan
Kaufmann Publishers, Inc., pp. 241-244.
Norman, K. (1991). The psychology o f menu selection: Designing cognitive control at the
human/ computer interface. Norwood, NJ: Ablex.
Norman, D.A. and S.W. Draper (1986), User centered system design., Hillsdale: Lawrence
Erlbaum.
Olson, J.R. (1987). Cognitive analysis of people’s use of software. In J.M. Carroll (ed.)
Interacting Thought. Cognitive Aspects o f Human-Computer Interaction. Cambridge: MIT
Press, pp. 260-293.
O’Keefe, R.M. (1986) Simulation and expert systems - A taxonomy and some examples.
Simulation, Vol. 46, No. 1, pp. 10-16.
O’Keefe, R.M. and I.L. Pitt (1991). Interaction with a visual interactive simulation, and the effect
of cognitive style. European Journal o f Operational Research, Vol. 54, No. 3, pp. 339-
348.
Paul, R.J. (1991). Recent developments in simulation modelling. Journal o f the Operational
Research Society, Vol. 42, No. 3, pp. 217-226.
Paul, R.J. and D. Balmer (1993). Simulation modelling. Bromley: Chartwell-Bratt Ltd.
Payne, S.J. and T.R.G. Green (1986). Task-action grammars: A model of the mental
representation of task languages. Human-Computer Interaction, Vol. 2, pp. 93-133.
Pidd, M. (1992a). Computer Simulation in Management Sciences. 3rd ed., Chichester: John
Wiley and Sons.
Pidd, M. (1992b). Guidelines for the design of data driven generic simulators for specific
domains. Simulation, Vol. 59, No. 4, pp. 237-243.
J. Kuljis User Interfaces and Discrete Event Simulation Models Page 257
References
Preece, J., Y. Rogers, H. Sharp, D. Benyon, S. Holland, and T. Carey (1994). Humcm-
computer interaction. Wokingham: Addison-Wesley.
Poison, P.G. and C.H. Lewis (1990). Theory-based design for easily learned interfaces. Human-
Computer Interaction, Vol. 5, No. 2 and 3, pp. 191-220.
Potosnak, K. (1988) Do icons make user interfaces easier to use?, IEEE Software, Vol. 5, No. 3,
pp. 97-99.
Reisner, P. (1981). Formal grammar and human factors design of an interactive graphic system.
IEEE Transactions on Software Engineering, SE-5, pp. 229-240.
Reisner, P. (1987). Discussion: HCI, what is it and what research is needed? In J. M. Carroll
(ed.) Interfacing Thought. Cognitive Aspects o f Human-Computer Interaction. Cambridge,
MA: The MIT Press, pp. 337-352.
Salomon, G. (1990). New uses of color. In B. Laurel (Ed.) The Art o f Human-Computer
Interface Design, Reading, MA: Addison-Wesley Publishing Company, Inc., pp. 269-278.
Sargent, R.G. (1991). Simulation model verification and validation. Proceedings o f the 1991
Winter Simulation Conference, Phoenix, Arizona: Institute of Electrical and Electronic
Engineers, pp. 34-47.
Shackel, B. (1991). Usability - context, framework, definition, design and evolution. In Shackel,
B. and S. Richardson (eds.) Human Factors fo r Informatics Usability, Cambridge:
Cambridge University Press.
Shannon, R. E. (1975). Systems simulation - The art and science. Prentice-Hall.
Shneiderman, B. (1980). Software psychology: Human factors in Computer and information
systems, Boston: Little, Brown.
Shneiderman, B. (1983). Direct manipulation: A step beyond programming languages.
Computers, Vol. 16, No. 8, pp. 57-69.
Shneiderman, B. (1992). Designing the user interface: Strategies for effective human-computer
interaction. Reading: Addison-Wesley.
J. Kuljis User Interfaces and Discrete Event Simulation Models Page 258
References
Smith, S.L. and J.N. Mosier (1984). The use interface to computer-based information systems: A
survey of current software design practice. Behaviour and Information Technology, Vol. 3,
No. 3, pp. 195-203.
Smith, S.L. and J.N. Mosier (1986). Guidelines for designing user interface software (ESD-TR-
86-278/MTR 10090). Bedford, Ms: MITRE Corporation.
Stasko, J.T. (1993). Animation in user interfaces: Principles and techniques. In Bass, L. and P.
Dewan (eds.). User Interface Software, Chichester: John Wiley & Sons, pp. 81-101.
Suchman, L.A. (1987). Plans and situated actions. The problem o f human-machine
communication, Cambridge: Cambridge University Press.
Swider, C.L., K.W. Bauer Jr., T.F. Schuppe (1994). The effective use of animation in
simulation model validation. Proceedings o f the 1994 Winter Simulation Conference,
Orlando, Florida: Institute of Electrical and Electronic Engineers, pp. 633-640.
Tanimoto, S.L. and E.P. Glinert (1986). Designing iconic programming systems: Representation
and leamability. IEEE Proceedings Workshop on Visual Languages, pp. 54-60.
Thakar, S. and H. Malin (1989). Reducing Waiting Time in Out-Patient Departments: Strategy
and Tactics. Technical Report ORZ/1186, DHSS Operational Research Services, London.
Thakar, S. (1990). CLINSIM, A General Purpose Simulation Package For Outpatients Clinics.
Internal document, Department Of Health Operational Research Service, London. 23pp.
Trumbly, J.E., K.P. Arnett and P.C. Johnson (1994). Productivity gains via an adaptive user
interface: an empirical analysis. International Journal o f Human-Computer Studies, Vol.
40, pp. 63-81.
Tufte, E.R. (1983). The visual display o f quantitative information. Cheshire, Connecticut:
Graphics Press.
Tufte, E.R. (1990). Envisioning information. Cheshire, Connecticut: Graphics Press.
Tullis, T.S. (1988). Screen design. In M. Helander (ed.) Handbook o f Human-Computer
Interaction. Amsterdam: Elsevier Science Publishers B.V. (North-Holland), pp. 377-411.
J. Kuljis User Interfaces and Discrete Event Simulation Models Page 259
References
Williamson, T.M., R.P. Gittins and D.M. Burke (1989). Replenishment at sea. Journal o f the
Operational Research Society, Vol. 40, No. 10, pp. 881-887.
Winston, P.H. (1984). Artificial intelligence. Second edition, Reading, MA: Addison-Wesley.
Woods, D.D. and Roth, E.M. (1988). Cognitive systems Engineering. In Helander, M. (Ed.)
Handbook o f Human-Computer Interaction, Amsterdam: North-Holland, pp. 3-43.
Wright, G. (1991). The visual world o f Windows computing. Presented at the Conference
“Windows in Action”, London, May.
J. Kuljis User Interfaces and Discrete Event Simulation Models Page 260
References
Software Manuals Referenced
Automenu (1989). Shareware Software, Magee Enterprise.
Borland dBase IV for DOS (1993). Borland Intemationsl, Inc.
CHART-MASTER (1988). Torrance, CA: Ashton-Tate Corporation.
CLINSIM User Guide (1992). RJP Research Associates and Economics and Operational
Research Division Department of Health
Conway, R., W. L. Maxwell, J. O. McClain and S. L. Worona (1990). User guide to XCELL+
factory modeling system. San Francisco: The Scientific Press.
C-scape Interface Management System (1989). Cambridge, MA: Oakland Group Inc.
Data Entry Module (1989). Burlington MA: Island Systems.
dBase IV Developer’s Edition, dBase IV Language Reference (1990), Ashton-Tate Corporation.
graphics_MENU (1989). Burlington MA: Island Systems.
Look and Feel Screen Designer (1989). Cambridge, MA: Oakland Group Inc.
MetaWINDOWS (1986). Scotts Valley, CA: Metagraphics Software Corporation.
Micro Saint (1992). Boulder, CA: Micro Analysis and Design Simulation Software, Inc.
Microsoft Windows Presentation Manager and Microsoft Windows Paint (1988). Redmond, WA:
Microsoft Corporation.
Paradox (1989). Borland Intemationsl, Inc.
ProModel for Windows (1993). Orem, Utah: Promodel Corporation.
Simgraphics II User’s Manual for Simscript II.5 (1993). La Jolla, CA: CACI Products Company.
Simscript n.5 Reference Handbook (1989). San Diego: CACI Products Company.
J. Kuljis User Interfaces and Discrete Event Simulation Models Page 261
References
Taylor II Simulation (1993) Tilburg, Netherlands: F&H Logistics and Automation B.V.
Thomas, L.J., J.O. McClain and D.B. Edwards (1989). Cases in Operations Management. Using
the XCELL factory modeling system, Redwood: The Scientific Press.
Turbo Graphics Toolkit (1988). Scotts Valley, CA: Borland International,.
Turbo Pascal 5.5, Reference Guide (1988), Borland International, Inc.
Visual C++ (1993). Microsoft
Windows Simscript II.5 User’s Manual (1993). San Diego: CACI Products Company.
WITNESS User Manual (1991). Release 307, Version 7.3.0, Redditch, UK: AT&T Istel Visuial
Interactive Systems, Ltd.
J. Kuljis User Interfaces and Discrete Event Simulation Models Page 262
Publications Resulting from this Research
Kuljis, J., R J. Paul, H. Malin and S. Thakar (1990). Designing an out-patient clinic modelling
package. Proceedings o f the 12th International Symposium “Computer at the University ”,
Cavtat, Croatia, pp. 6.3.1-6.3.7.
Kuljis, J. and R J. Paul (1991). Human-computer interfaces to modelling systems. Proceedings
o f the XIII International Conference on Information Technology Interfaces, Cavtat,
Croatia, pp. 401-407.
Kuljis, J. and R.J. Paul (1993). Organising outpatient clinics using simulation modelling.The
International Journal o f Management and Systems. Vol. 10, No.3, pp.299-306.
Kuljis, J. (1994). User interfaces and discrete event simulation models. Journal o f Simulation
Practice and Theory. Vol. 1, No. 5, pp. 207-221.
Kuljis, J. and R.J. Paul (1994). Outpatient clinic waiting times: A visual simulation approach
revisited. To be published in A. J. Hedley, W.C. Por, H.L. Ming, S.M. MGhee, J.
Johnston and R. Leung (eds.) Proceeding o f the Third Hong Kong (Asia Pacific) Medical
Informatics Conference, Hong Kong: Hong Kong Society of Medical Informatics Ltd and
Hong Kong Computer Society.
Kuljis, J. Showing how user interfaces can improve DSSs through the example of visual
simulation modelling. Games, Simulations and Human-Computer Interfaces a special issue
of Journal o f Intelligent Systems, to be published in 1995.
J. Kuljis: User Interfaces and Discrete Event Simulation Models Page 263
Related Documents