Updated: July 5, 2017 Copyright © 2017 John Jechura ([email protected]) Use of Yield Charts & Equations Volume Mass Density Ave BPT Watson K Hydrogen For cracking Sulfur 2 mol/mol S Dissolved in product 1 lb/bbl feed H2S Sulfur in Feed C3‐ 1.0+0.09*(Y LN ) IC4 0.377*(Y LN ) Calculate Pure NC4 0.186*(Y LN ) Calculate Pure C5 to 180F Fig. 7.3 (Y LN ) Calculate Calculate 131F Fig. 7.5 180 to 400F Fig. 7.4 Calculate Calculate 281F Fig. 7.5 400F+ Calculate 460F Fig. 7.5

Welcome message from author
This document is posted to help you gain knowledge. Please leave a comment to let me know what you think about it! Share it to your friends and learn new things together.
Transcript
Updated: July 5, 2017Copyright © 2017 John Jechura ([email protected])
Use of Yield Charts & EquationsVolume Mass Density Ave BPT Watson K
Hydrogen
For cracking
Sulfur 2 mol/mol S
Dissolved in product 1 lb/bbl feed
H2S Sulfur in Feed
C3‐ 1.0+0.09*(YLN)
IC4 0.377*(YLN) Calculate Pure
NC4 0.186*(YLN) Calculate Pure
C5 to 180F Fig. 7.3 (YLN) Calculate Calculate 131F Fig. 7.5
180 to 400F Fig. 7.4 Calculate Calculate 281F Fig. 7.5
400F+ Calculate 460F Fig. 7.5

Updated: July 5, 2017Copyright © 2017 John Jechura ([email protected])
Hydrocracker Yield Trends
Figure 7.3 The lighter the feedstock the more readily it cracks The curves for the 10.9 Watson K factor feed are about 10% lower than the curves for the 12.1 Watson K factor feed. • Suggests the calculation procedure:
12.1
12.11 0.1
10.9 12.1W
WK
KY Y

Updated: July 5, 2017Copyright © 2017 John Jechura ([email protected])
Hydrocracker Yield Trends
Figure 7.4 Start over‐cracking the heavy naphtha fraction when the light naphtha yields gets above 25 vol%.
Updated: July 5, 2017Copyright © 2017 John Jechura ([email protected])
Hydrocracker Yield – Makeup Hydrogen
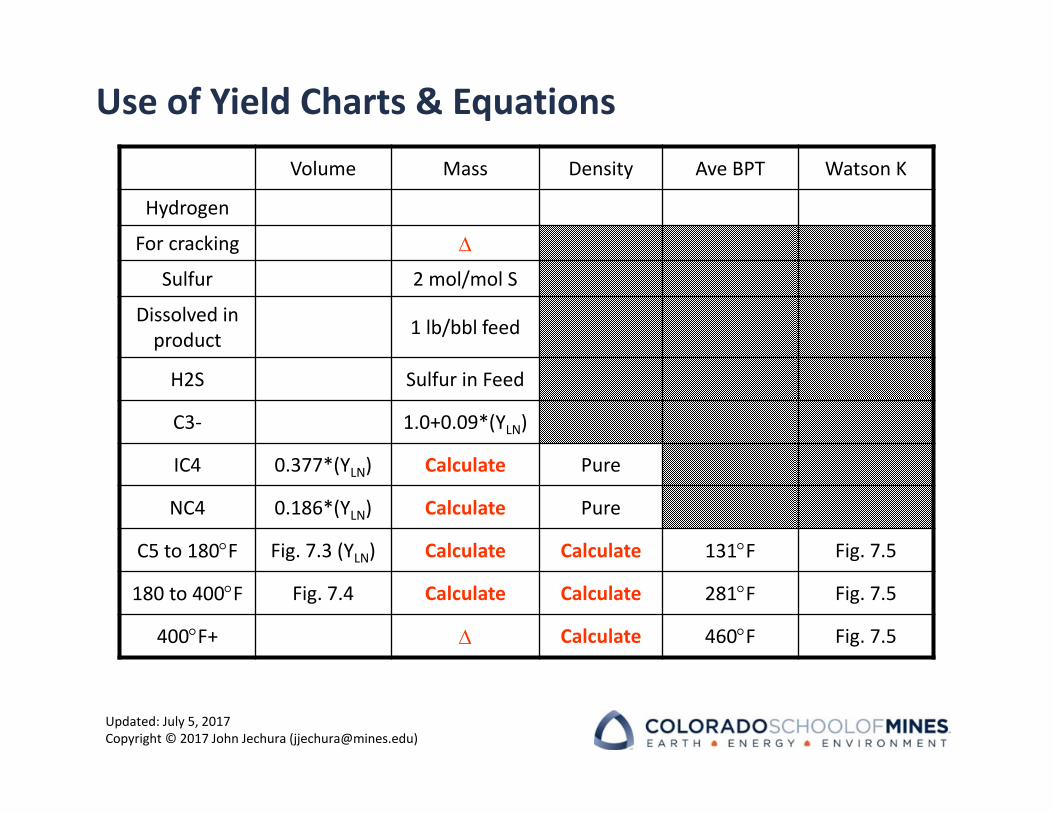
Make up hydrogen must be added to compensate for that chemically consumed & any dissolved in the liquid products Primary hydrogen consumed will be to saturate aromatics & olefin structures and break C‐C bonds Additional hydrogen needed for the removal of sulfur
• Breaking of the C‐S‐C and C‐SH bonds• Assume the more conservative 2 mol H2 per mol S
Liquid products leave with dissolved H2
• Text book recommends 1 lb H2 per bbl liquid product
4

Updated: July 5, 2017Copyright © 2017 John Jechura ([email protected])
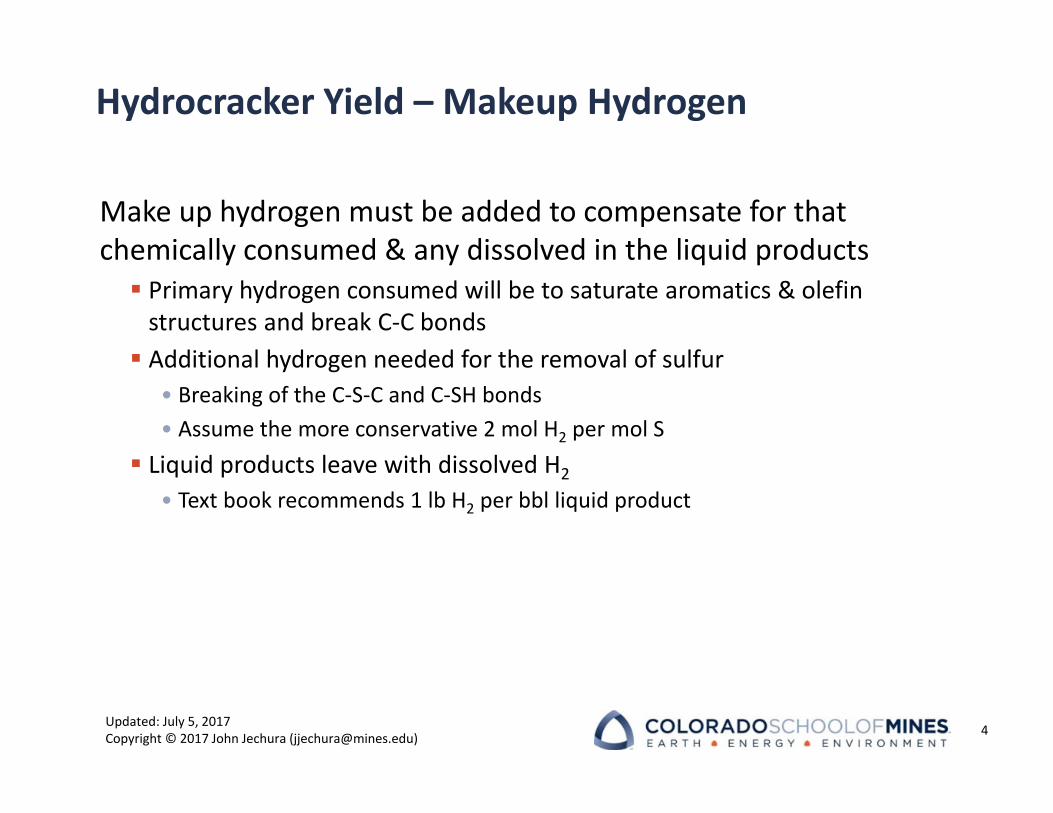
Hydrocracker Yield Example
Estimate the Watson K factors for the liquid products

Updated: July 5, 2017Copyright © 2017 John Jechura ([email protected])
Hydrocracker Yield Example
Calculate other values based on the physical property information & flow data.
Updated: July 5, 2017Copyright © 2017 John Jechura ([email protected])
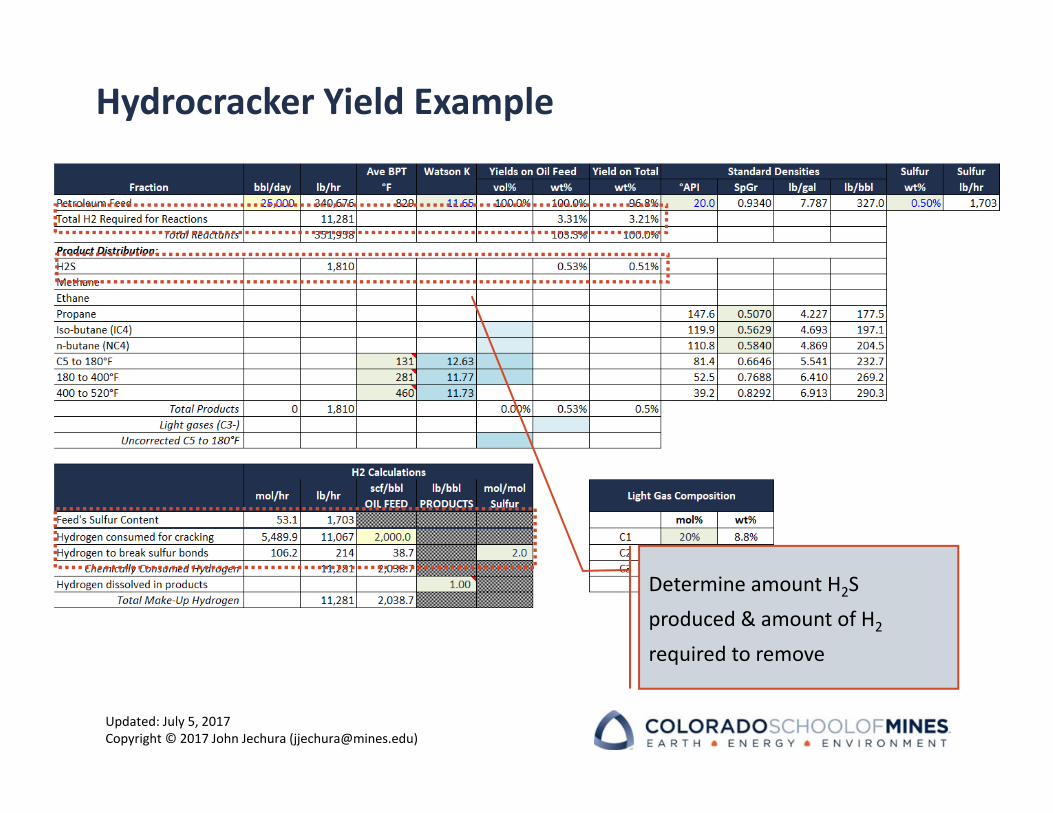
Hydrocracker Yield Example
Determine amount H2S produced & amount of H2
required to remove

Updated: July 5, 2017Copyright © 2017 John Jechura ([email protected])
Hydrocracker Yield Example
Determine Vol% Light Naphtha Yield (based on 12.1 Watson K factor feed).

Updated: July 5, 2017Copyright © 2017 John Jechura ([email protected])
Hydrocracker Yield Example
Correct to actual Watson K factor of feed. Calculate associated mass values.

Updated: July 5, 2017Copyright © 2017 John Jechura ([email protected])
Hydrocracker Yield Example
Determine Vol% Heavy Naphtha (180 to 400oF) Yield. Calculate associated mass values.

Updated: July 5, 2017Copyright © 2017 John Jechura ([email protected])
Hydrocracker Yield Example
Determine Vol% Butane Yield. Calculate associated mass values.

Updated: July 5, 2017Copyright © 2017 John Jechura ([email protected])
Hydrocracker Yield Example
Determine Wt% C3‐ Yield. Split
between C1, C2, & C3.
Updated: July 5, 2017Copyright © 2017 John Jechura ([email protected])
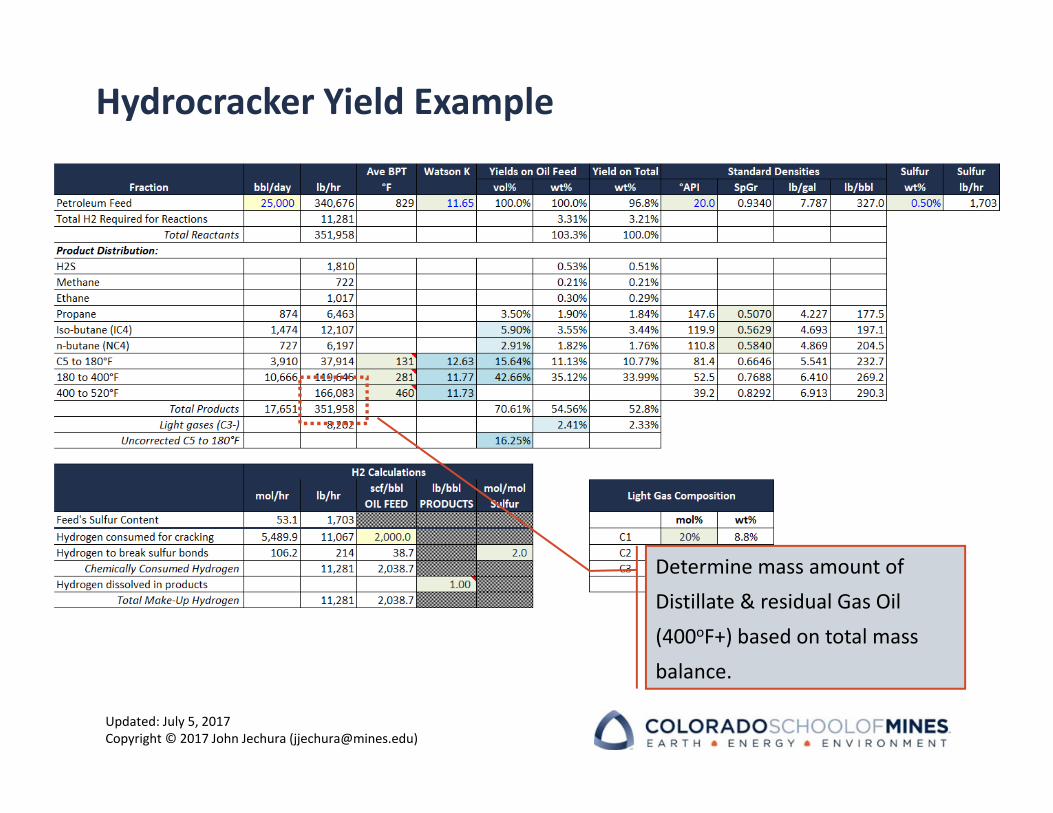
Hydrocracker Yield Example
Determine mass amount of Distillate & residual Gas Oil (400oF+) based on total mass balance.
Updated: July 5, 2017Copyright © 2017 John Jechura ([email protected])
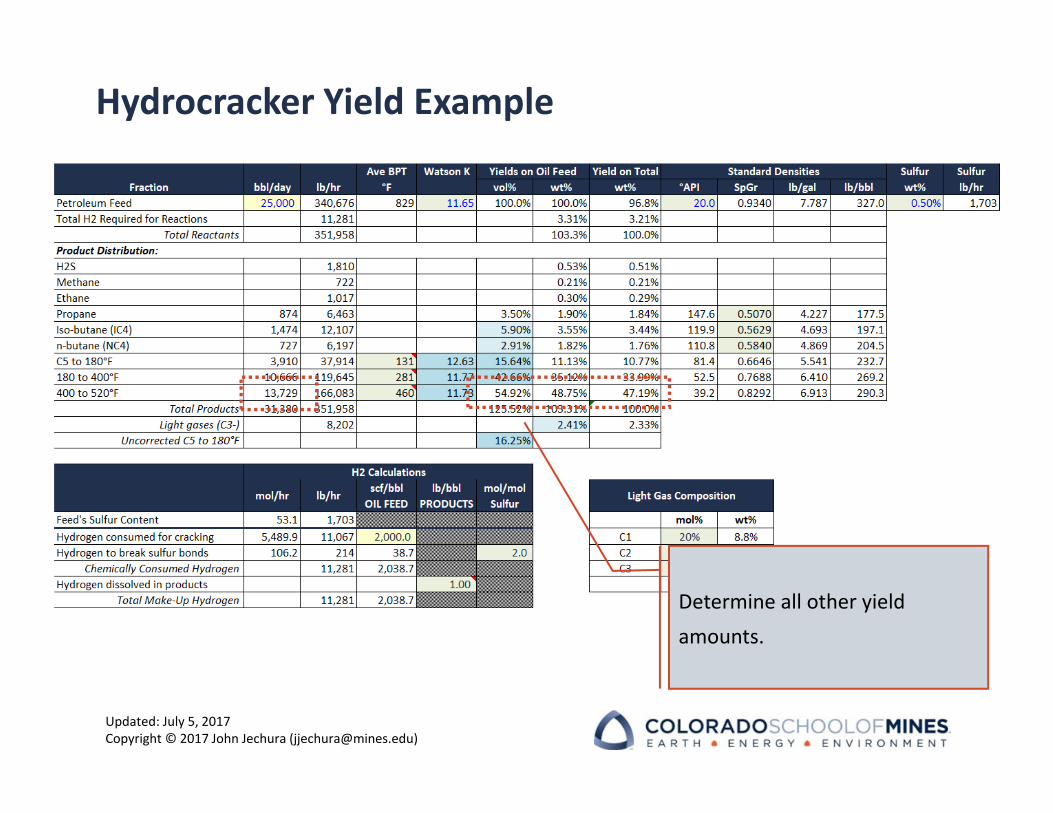
Hydrocracker Yield Example
Determine all other yield amounts.

Updated: July 5, 2017Copyright © 2017 John Jechura ([email protected])
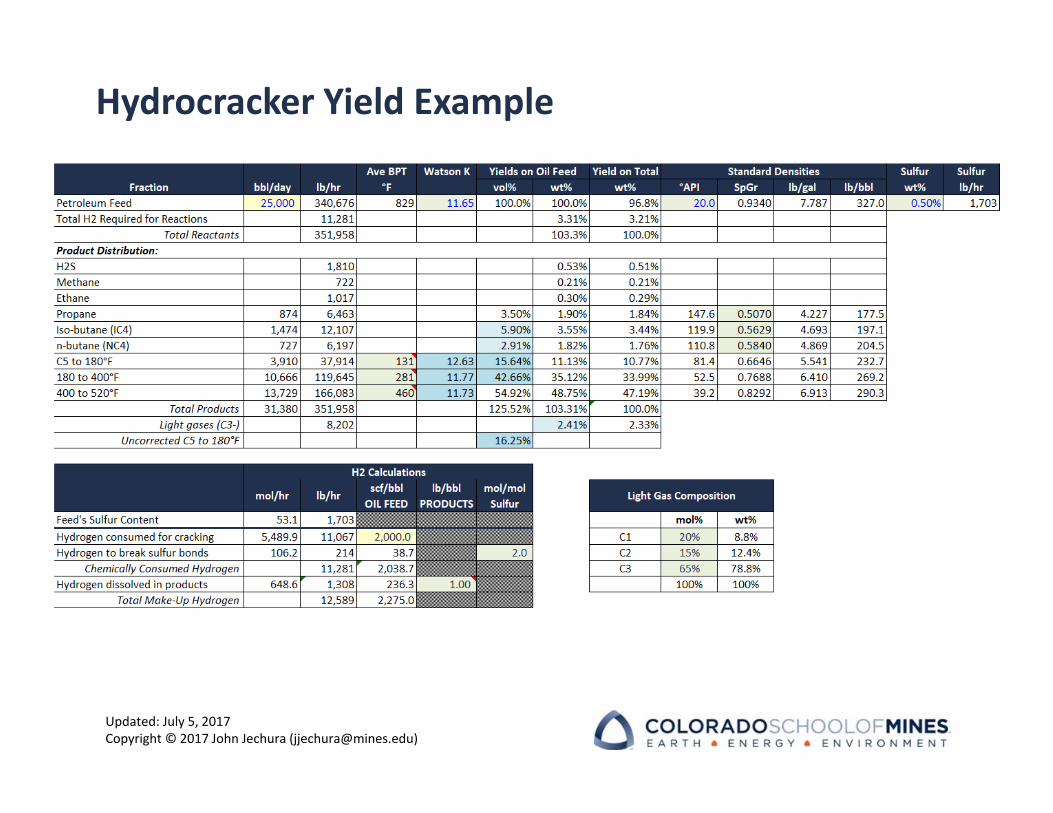
Hydrocracker Yield Example
Determine the amount of dissolved H2 in the liquid products (C3 & heavier)
Related Documents