Use of Treated Effluent Water in Cellulosic Ethanol Production Divya Ramchandran Vijay Singh Department of Civil and Environmental Engineering University of Illinois Urbana-Champaign Kishore Rajagopalan Illinois Sustainable Technology Center Prairie Research Institute University of Illinois at Urbana-Champaign Timothy Strathmann Department of Civil and Environmental Engineering University of Illinois Urbana-Champaign ISTC Reports Illinois Sustainable Technology Center TR-049 March 2013 www.istc.illinois.edu

Welcome message from author
This document is posted to help you gain knowledge. Please leave a comment to let me know what you think about it! Share it to your friends and learn new things together.
Transcript

Use of Treated Effluent Water in Cellulosic Ethanol Production Divya Ramchandran
Vijay Singh Department of Civil and Environmental Engineering University of Illinois Urbana-Champaign
Kishore Rajagopalan Illinois Sustainable Technology Center Prairie Research Institute University of Illinois at Urbana-Champaign
Timothy Strathmann Department of Civil and Environmental Engineering University of Illinois Urbana-Champaign
ISTC Reports Illinois Sustainable Technology Center
TR-049
March 2013
www.istc.illinois.edu


TR-049
Use of Treated Effluent Water in Cellulosic Ethanol Production
Divya Ramchandran Vijay Singh
Department of Civil and Environmental Engineering University of Illinois at Urbana Champaign
Kishore Rajagopalan Illinois Sustainable Technology Center
Prairie Research Institute University of Illinois at Urbana-Champaign
Timothy Strathmann Department of Civil and Environmental Engineering
University of Illinois at Urbana Champaign
March 2013
Submitted to the Illinois Sustainable Technology Center
Prairie Research Institute University of Illinois at Urbana-Champaign
www.istc.illinois.edu
The report is available on-line at: http://www.istc.illinois.edu/info/library_docs/TR/TR049.pdf
Printed by the Authority of the State of Illinois
Patrick J. Quinn, Governor

This report is part of ISTC’s Technical Report Series. Mention of trade names or commercial products does not constitute endorsement or recommendation for use.

Forward
The final report for this project, “Use of Treated Effluent Water in Cellulosic Ethanol Production,” conducted
by Divya Ramchandran, Dr. Vijay Singh, Dr. Kishore Rajagopalan, and Dr. Timothy Strathmann is comprised of
the M.S. thesis of Divya Ramchandran submitted to the Department of Civil and Environmental Engineering
at the University of Illinois at Urbana-Champaign in December 2012.
This research was funded in part by the Illinois Sustainable Technology Center, a division of the Prairie Research
Institute at the University of Illinois at Urbana-Champaign (Grant No. HWR12227).

c© 2012 by Divya Ramchandran. All rights reserved.

USE OF TREATED EFFLUENT WATER IN CELLULOSIC ETHANOL PRODUCTION
BY
DIVYA RAMCHANDRAN
THESIS
Submitted in partial fulfillment of the requirementsfor the degree of Master of Science in Environmental Engineering in Civil Engineering
in the Graduate College of theUniversity of Illinois at Urbana-Champaign, 2012
Urbana, Illinois
Master’s Committee:
Professor Vijay SinghDr. Kishore Rajagopalan, Illinois Sustainable Technology CenterProfessor Timothy J. Strathmann
Abstract
The bioethanol industry exerts a significant demand on water supplies. Current water consumption rate
in corn dry grind ethanol plants is 3 to 4 gallons of water per gallon of ethanol produced (gal/gal) and 6
to 10 gal/gal for cellulosic ethanol plants. The main goal of this study was to examine the use of treated
wastewater effluent in place of potable freshwater for cellulosic ethanol production. The effects of using
two different types of filtered treated effluent; Bloomington- Normal, IL (Residential type) and Decatur, IL
(Industrial/Residential Mix type); on the rate of fermentation and final ethanol yield from a pure cellulosic
substrate were evaluated. Final ethanol concentration with Bloomington- Normal and Decatur effluent and
our control study using de-ionized water were similar, resulting in 4.57 ± 0.22 % v/v (0.36 g/g, db), 4.74 ±
0.13 % v/v (0.37 g/g, db) and 4.55 ± 0.28 % v/v (0.36 g/g, db), respectively. Residual glucose concentrations
were <0.04 % w/v at 48 hr in all cases, suggesting complete fermentation.
Further study with Decatur effluent using 0.08 mm finely ground Miscanthus as the substrate resulted in
a final ethanol concentration of 0.46 ± 0.008 % v/v (0.14 g/g db) which was similar to ethanol concentration
of 0.52 ± 0.07 % v/v (0.17 g/g db) obtained with control treatment using de-ionized water. These findings
suggest that with proper characterization studies and under appropriate conditions, the use of treated effluent
water in cellulosic ethanol production is feasible.
ii

Dedicated to my parents.
iii
Acknowledgments
At the outset, I wish to express my gratitude towards all those who have been a part of my research thesis
experience and without whose help this report would never have taken shape. I express my sincere gratitude
to my adviser, Dr. Vijay Singh who besides guiding me throughout my graduate studies, has also been a
constant source of motivation and inspiration. I would also like to thank Dr. Kishore Rajagopalan for his
invaluable advice, guidance and support. I convey my sincere thanks to my co-adviser, Dr. Timothy J.
Strathmann, for his expert and inspiring guidance and his unfailing support.
I am very grateful to my academic adviser, Dr. Julie L. Zilles, who guided and helped me fulfill my
course curriculum requirements. I would like to thank the Department of Environmental Engineering and
Department of Agricultural and Biological Engineering for giving me the opportunity to work on this project,
which has been a highly rewarding and rich experience.
I express my whole hearted thanks to all the members of Burnsides Research Laboratory and Illinois
SustainableTechnology Center, for all the help and infrastructural support. I would like to thank Wei Liu
and Jennifer Deluhery for helping me out with my experimental work. I thank all my labmates, Esha
Khullar, Ming Hsu Chen, Song Li and Benjamin Plumier who have helped me whenever I needed them and
also created a positive and friendly work environment.
Finally, I thank my loving parents who taught me to maintain a positive attitude which has helped me
throughout my life and for their constant support and encouragement.
iv

Table of Contents
List of Figures . . . . . . . . . . . . . . . . . . . . . . . . . . . . . . . . . . . . . . . . . . . . . . vi
List of Tables . . . . . . . . . . . . . . . . . . . . . . . . . . . . . . . . . . . . . . . . . . . . . . vii
Chapter 1 Introduction . . . . . . . . . . . . . . . . . . . . . . . . . . . . . . . . . . . . . . . 1
Chapter 2 Literature Review . . . . . . . . . . . . . . . . . . . . . . . . . . . . . . . . . . . . 32.1 Need for water management . . . . . . . . . . . . . . . . . . . . . . . . . . . . . . . . . . . . . 42.2 Energy and water are interrelated . . . . . . . . . . . . . . . . . . . . . . . . . . . . . . . . . . 42.3 Water use in dry grind ethanol plants . . . . . . . . . . . . . . . . . . . . . . . . . . . . . . . 52.4 Water use in cellulosic ethanol plants . . . . . . . . . . . . . . . . . . . . . . . . . . . . . . . . 52.5 Effects of metals and ions on ethanol production . . . . . . . . . . . . . . . . . . . . . . . . . 52.6 Water implications of cellulosic ethanol production in the US . . . . . . . . . . . . . . . . . . 7
2.6.1 Stress on local water supplies . . . . . . . . . . . . . . . . . . . . . . . . . . . . . . . . 72.6.2 Water pollution due to bio-refineries . . . . . . . . . . . . . . . . . . . . . . . . . . . . 8
2.7 Technological improvements for water conservation . . . . . . . . . . . . . . . . . . . . . . . . 8
Chapter 3 Characterization of effluent water . . . . . . . . . . . . . . . . . . . . . . . . . . 93.1 Introduction . . . . . . . . . . . . . . . . . . . . . . . . . . . . . . . . . . . . . . . . . . . . . . 93.2 Materials and methods . . . . . . . . . . . . . . . . . . . . . . . . . . . . . . . . . . . . . . . . 93.3 Results and discussions . . . . . . . . . . . . . . . . . . . . . . . . . . . . . . . . . . . . . . . 10
3.3.1 Comparison of concentration of ions between Bloomington-Normal, IL and Decatur,IL effluent water samples . . . . . . . . . . . . . . . . . . . . . . . . . . . . . . . . . . 10
3.3.2 Comparison between Decatur, IL effluent before and after filtration . . . . . . . . . . . 133.4 Conclusions . . . . . . . . . . . . . . . . . . . . . . . . . . . . . . . . . . . . . . . . . . . . . . 13
Chapter 4 Pretreatment, Hydrolysis and Fermentation . . . . . . . . . . . . . . . . . . . . 144.1 Introduction . . . . . . . . . . . . . . . . . . . . . . . . . . . . . . . . . . . . . . . . . . . . . . 144.2 Materials and methods . . . . . . . . . . . . . . . . . . . . . . . . . . . . . . . . . . . . . . . . 154.3 Results and discussions . . . . . . . . . . . . . . . . . . . . . . . . . . . . . . . . . . . . . . . 18
4.3.1 Effect of different ratios of filtered Decatur, IL effluent with DI water on hydrolysisand fermentation rates and final ethanol yields . . . . . . . . . . . . . . . . . . . . . . 18
4.3.2 Effect of different ratios of filtered Bloomington-Normal, IL effluent with DI wateron hydrolysis and fermentation rates and final ethanol yields . . . . . . . . . . . . . . 21
4.3.3 Effect of using Decatur, IL effluent directly without filtration on final ethanol yield . . 234.3.4 Effect of using concentrated Decatur, IL effluent on glucose and ethanol yields . . . . 254.3.5 Effect of filtered Decatur, IL effluent on hydrolysis and fermentation rates and final
ethanol concentration using Miscanthus as the substrate . . . . . . . . . . . . . . . . . 274.4 Conclusions . . . . . . . . . . . . . . . . . . . . . . . . . . . . . . . . . . . . . . . . . . . . . . 30
Chapter 5 Recommendations for future work . . . . . . . . . . . . . . . . . . . . . . . . . . 31
v

List of Figures
1.1 Water routing in Dry Grind Ethanol plant. . . . . . . . . . . . . . . . . . . . . . . . . . . . . 2
4.1 Glucose production as a function of hydrolysis time with Decatur effluent. . . . . . . . . . . . 194.2 Glucose consumption as a function of fermentation time with Decatur effluent. . . . . . . . . 194.3 Ethanol production as a function of fermentation time with Decatur effluent. . . . . . . . . . 204.4 Glucose production as a function of hydrolysis time with Bloomington-Normal effluent. . . . 214.5 Glucose consumption as a function of fermentation time with Bloomington-Normal effluent. . 224.6 Ethanol production as a function of fermentation time with Bloomington-Normal effluent. . . 224.7 Glucose production as a function of hydrolysis time with Decatur effluent with and without
filtration. . . . . . . . . . . . . . . . . . . . . . . . . . . . . . . . . . . . . . . . . . . . . . . . 234.8 Glucose consumption as a function of fermentation time for Decatur, IL effluent with and
without filtration. . . . . . . . . . . . . . . . . . . . . . . . . . . . . . . . . . . . . . . . . . . . 244.9 Ethanol production as a function of fermentation time for Decatur, IL effluent with and
without filtration. . . . . . . . . . . . . . . . . . . . . . . . . . . . . . . . . . . . . . . . . . . . 244.10 Glucose production as a function of hydrolysis time with concentrated Decatur effluent. . . . 254.11 Glucose consumption as a function of fermentation time with concentrated Decatur effluent. . 264.12 Ethanol production as a function of fermentation time with concentrated Decatur effluent. . . 264.13 Glucose production as a function of hydrolysis time using Decatur effluent and Miscanthus
as substrate. . . . . . . . . . . . . . . . . . . . . . . . . . . . . . . . . . . . . . . . . . . . . . . 284.14 Glucose consumption as a function of fermentation time using Decatur effluent and Mis-
canthus as substrate. . . . . . . . . . . . . . . . . . . . . . . . . . . . . . . . . . . . . . . . . . 294.15 Ethanol production as a function of fermentation time using Decatur effluent and Miscant-
hus as substrate. . . . . . . . . . . . . . . . . . . . . . . . . . . . . . . . . . . . . . . . . . . . 29
vi

List of Tables
3.1 Composition of effluent water samples. . . . . . . . . . . . . . . . . . . . . . . . . . . . . . . . 113.2 Concentration of ions and trace metals in effluent water samples. . . . . . . . . . . . . . . . . 123.3 Concentration of ions in Decatur, IL effluent before and after filtration. . . . . . . . . . . . . 13
4.1 Table showing ratio of water composition used for washing and enzyme hydrolysis steps. . . . 164.2 Mean final glucose and ethanol yields (g/g db) for Decatur, IL effluent. . . . . . . . . . . . . 274.3 Mean final glucose and ethanol yields (g/g db) for Bloomington-Normal, IL effluent. . . . . . 27
vii
Chapter 1
Introduction
There is a rising awareness of the need to reduce the dependence of fuel industry on exhaustive non-renewable
fossil fuels and to focus on renewable sources. Environmental concerns arising from the extensive use of
fossil fuels such as increased pollution, global warming, and acid rain affecting the earth’s climate, weather
conditions, vegetation and aquatic ecosystems is alarming and demands for the use of clean and renewable
energy sources. Considering the energy security and global environment, there is a pressing need to develop
nonpolluting and renewable energy sources.
The United States (US) fuel ethanol industry is an example of production of renewable fuels. At present,
corn based dry grind and wet milling facilities account for 95% of fuel ethanol produced in the US (Zheng
et al., 2009 [27]). Most commercial bioethanol plants are based on fermentation of sugars from starch such as
corn or other sugar based crops. The successful growth of corn based ethanol industry has laid a foundation
for use of cellulosic feedstock for ethanol production. Also, due to concerns such as using a food product
as a feedstock for fuel ethanol, there is an urging need to shift to using non-food crops such as cellulosic
substrates for ethanol production. Using lignocellulosic feedstock for fuel ethanol production has several
advantages such as lowering greenhouse gas emissions, reducing cost pressure on food and feed markets and
use of land which is unsuitable for row crops by using perennial crops and drought resistant crops.
One of the major concerns in ethanol plants is the amount of water consumed in the process of ethanol
production. Use of fresh water in ethanol plants results in depletion of a precious natural resource, which
cannot be sustained in the long term. Thus, water management technologies are critical for the successful
operation of an ethanol plant. Water used in a dry grind ethanol plant is categorized into two types: process
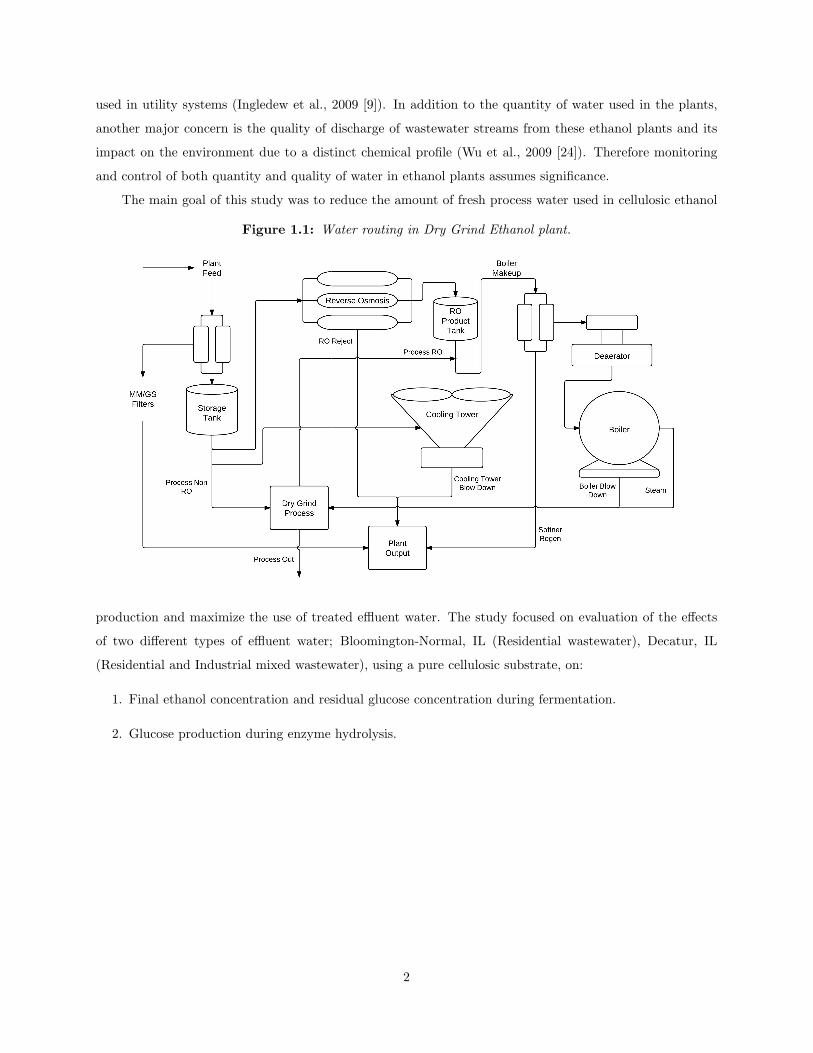
water and non-process water. The general schematic for water routing in dry grind ethanol plant is shown
in Figure 1.1. Water coming in direct contact with the grain being processed is known as process water.
It includes water used in premix tanks and cooking process. Non-process water includes the water which
does not directly come into contact with the feedstock such as water circulating in cooling towers, boilers,
heat exchangers and water going into the Reverse Osmosis (RO) unit. Dry grind ethanol plants currently
consume around 3 to 4 gallon of water per gallon of ethanol produced whereas cellulosic ethanol plants are
estimated to consume around 6 to 10 gallon of water per gallon of ethanol (Rajagopalan et al., 2010 [15]).
At present, the average water requirement for a 50 million gallon ethanol plant is 150 to 250 million gallons
per year. One third of the water coming in the plant is used in ethanol production process and two third is
1
used in utility systems (Ingledew et al., 2009 [9]). In addition to the quantity of water used in the plants,
another major concern is the quality of discharge of wastewater streams from these ethanol plants and its
impact on the environment due to a distinct chemical profile (Wu et al., 2009 [24]). Therefore monitoring
and control of both quantity and quality of water in ethanol plants assumes significance.
The main goal of this study was to reduce the amount of fresh process water used in cellulosic ethanol
Figure 1.1: Water routing in Dry Grind Ethanol plant.
production and maximize the use of treated effluent water. The study focused on evaluation of the effects
of two different types of effluent water; Bloomington-Normal, IL (Residential wastewater), Decatur, IL
(Residential and Industrial mixed wastewater), using a pure cellulosic substrate, on:
1. Final ethanol concentration and residual glucose concentration during fermentation.
2. Glucose production during enzyme hydrolysis.
2
Chapter 2
Literature Review
Water usage in bioethanol production is around four to seven units of water for one unit of ethanol produc-
tion as compared to one and a half units of water in petroleum refining. Apart from this, the effluent water
from bioethanol industry accounts for high salinity and high biochemical oxygen demand (BOD) (Fedler and
Duan, 2011 [8]). Both the stated factors brings to light that the amount of water usage in bioethanol pro-
duction cannot be ignored and questions the feasibility and sustainability of use of energy crops for ethanol
production in the long run (Fedler and Duan, 2011 [8]).
Water consumption in fuel production depends on various factors such as type of feedstock used, region
where the feedstock is harvested, soil type, climatic conditions and production technology used. Conserva-
tion of water can be achieved to a great extent by reducing the water use at the feedstock growth and fuel
production stage. At the level of feedstock growth, the major portion of water consumed is the irrigation
water. For corn based ethanol production, 7 gal of water per gal of ethanol produced has been reported to be
consumed for corn farming in regions of Iowa, Illinois, Indiana, Ohio, Missouri. Irrigation water consumed
varies from region to region. Three gallons of water per gal of ethanol produced was reported for fuel produc-
tion thus making a total of 10 gal water/gal of ethanol produced (Wu et al., 2009 [24]). In case of cellulosic
biomass, irrigation water depends on the type of feedstock used. Hence, the choice of cellulosic biomass is
vital and it is recommended to select the feedstock from their native habitat such as perennial crops like
switchgrass which can reduce irrigation water requirement for feedstock production. Water consumption
reported for cellulosic ethanol plants is much more than dry grind ethanol plants. Current biochemical tech-
niques of ethanol production consumes around 10 gal water/ gal ethanol produced which has been reduced
to 6 gal/gal ethanol produced by improving ethanol yields (Wu et al., 2009 [24]).
The impacts of water released from fuel production plants on the environment are also significant. Con-
taminant release, nutrient release and increase in water temperature are some of the effects caused by water
discharge from ethanol plants into the environment (Wu et al., 2009 [24]). Thus, process water discharges
calls for special treatment of water before release into the environment or recycling into the plant again.
A strategy reported to reduce the amount of freshwater used in fuel ethanol production was to use the
municipal wastewater and animal feedlot discharges for biomass feedstock production. This not only solves
wastewater disposal issues but also provides nutrients such as nitrogen and phosphorus required for biomass
growth (Wu et al., 2009 [24]).
3
2.1 Need for water management
Water is an important natural resource which is required in all spheres of life. The demand for water
continues to rise with the growing population and technological advancements. The continued depletion of
water is an area of concern and calls for newer ways to conserve water and use it judiciously (Shannon, 2009
[16]). Ethanol plants use large amounts of water as mentioned above. Thus, water management has become
an important aspect to be considered while planning and designing a new plant.
The characterization of source water - city water, municipal water, surface water, wastewater or other
sources to be used in the plant is the first step for water management analysis. The water chemistry of
source water helps to determine appropriate treatment operations so that it meets system requirements.
Some of the common treatment operations include disinfection, reverse osmosis (RO), water softening and
multimedia filtration (Ingledew et al., 2009 [9]). Water chemistry plays an important role in maintaining
the efficiency of ethanol plant. It can help in reducing scale deposits, corrosion and microbe growth in
cooling towers and heat exchangers used in the plant increasing the overall energy efficiency and reducing
the maintenance costs. Environmental discharge, operational and capital costs are other important factors
to be considered. Determining the quantity of water to be used in the plant along with the quality of water
required is also significant. Zero liquid discharge systems are considered and applied in ethanol plants by
re-using wastewater streams generated within the plant (Ingledew et al., 2009 [9]). This helps in reducing
the burden on incoming water supply.
2.2 Energy and water are interrelated
Water use and energy consumption go hand in hand. Energy is required to recover water, treat it for
further reuse and recycling, and discharge of water and other contaminants into the environment. Reuse of
wastewater can help in reducing energy needs by utilizing the energy contained in wastewater. This reduces
the energy required to treat wastewater, and lowers the need to pump and discharge wastewater which in
turn helps to maintain a clean environment. Reusing wastewater also helps in recovering nutrients which
can be further used in fertilizers.
The recovery of Distillers Dried Grains with Solubles (DDGS) in corn dry grind ethanol plants is one
of the examples which show the correlation between energy and water usage. After the whole stillage is
separated into thin stillage and wet grains using a centrifuge, thin stillage is concentrated to thick syrup
using an evaporator and wet grains is passed through a dryer. The overall energy and water usage increases
if the separation of thin stillage and wet grains is not efficient (Johnston and Henriques, 2009 [11]).
4

2.3 Water use in dry grind ethanol plants
In a typical dry grind ethanol plant, water is used for grinding, liquefaction, fermentation, separation, and
drying. Heating, cooling and drying are the major water consumption steps. Cooling tower accounts for 70%
of total water consumption (McDonald and Rieke, 2007 [12]). Water loss occurs mainly during evaporation
in dryers; as blow down water released by cooling towers and boilers; and as water trapped in ethanol and
DDGS. The extent of water loss depends on various factors such as the temperature used in ethanol plants,
the type of dryer used for DDGS recovery determining the amount of water vapor entrapped in DDGS, blow
down water and boiler condensate reuse in the plants.
In a cooling tower, water is lost in the form of evaporation, drift or windage water and blow down water
(Wu et al., 2009 [24]). Blow down water consists of dissolved ions and contributes to wastewater generation.
Water used in cooling towers are low salt streams containing low levels of dissolved ions and can be treated
easily and reused in the plant to save overall water and energy consumption (Shannon, 2009 [16]). Process
water such as water generated by starch processing in dry grind ethanol plants is rich in salt concentration
and contains large amounts of nitrogen and phosphorus which if released can cause eutrophication. This
high salt stream is commonly treated using membrane separation processes such as Nano filtration (NF),
and Reverse osmosis (RO) before reuse in the plant (Shannon, 2009 [16]).
2.4 Water use in cellulosic ethanol plants
The two main technologies of cellulosic ethanol production are biochemical and thermo-chemical conversion
processes. Water use in cellulosic ethanol production depends on the type of conversion technology used
and the extent of water reuse and recycling involved in the procedure. Biochemical process uses enzyme
hydrolysis and fermentation techniques whereas thermo-chemical conversion includes pyrolysis, gasification
and combustion techniques.
More water is used in biochemical conversion compared to thermo-chemical conversion of cellulosic ethanol
production. The major water consuming steps in biochemical cellulosic ethanol production are pretreatment
of cellulosic feedstock, enzyme hydrolysis and fermentation. With current technologies and improvements,
biochemical conversion uses 6 gal of water per gal of ethanol compared to thermochemical conversion which
uses only around 1.9 gal of water per gal of ethanol (Wu et al., 2009 [24]).
2.5 Effects of metals and ions on ethanol production
Ethanol production by yeast, Saccharomyces cerevisiae, is dependent on several factors such as temperature,
pH and the availability of sufficient nutrients for the growth of yeast biomass. Microelements and trace met-
als are required in optimum quantities which favors yeast growth and ethanol production. These metal ions
5

are vital for yeast growth but excess of these ions can be deleterious to the organism as well. Toxic effects
by metal ions result from blockage of functional groups and enzyme sites, denaturation and inactivation of
essential enzymes and disturbance in membrane functionality (Miksaj et al., 2002 [13]).
Water reuse in ethanol plants results in increased ion concentration which can be stressful to yeast
(Jacques et al., 2003 [10] and Tosun and Ergun, 2007 [21]). Similarly using effluent water for ethanol pro-
duction can lead to yeast stress due to the varying amounts of ions present in effluent water. The quality
of effluent water depends on its source, whether it is residential, industrial effluent water or a mix. Effects
of microelements on yeast growth have been a widely researched topic in the past. Some of the important
metal ions whose effects on yeast have been studied and mentioned in the literature are zinc, copper, cobalt,
calcium, potassium, sodium, manganese, phosphorus and chromium.
Zinc in the form of Zn2+ ions is an important cofactor for many enzymes such as alcohol dehydroge-
nase, alkaline phosphatase, carbonic anhydrase and carboxypeptidases, some of which are involved in the
glycolysis metabolic pathway and helps in the synthesis of vitamins like riboflavin, which promotes cell
growth (Stehlik-Tomas et al., 2004 [20]). Deficiency of Zn2+ ions stops the cell growth and fermentation
activity whereas Zn2+ ions above the optimum level can be toxic as it affects the membrane permeability to
potassium thus decreasing yeast growth and ethanol production and slowing down respiration rate of yeast
cells. The optimum concentration of zinc ions in the nutrient medium as cited in the literature is 5-15 µM
(Stehlik-Tomas et al., 2004 [20]). Cobalt also plays an important role in the respiration activity of yeast
cells, concentrations of 2-25 mg/L of cobalt are optimum for yeast growth (Miksaj et al., 2002 [13]).
Potassium (K) is known to be involved in osmoregulation and charge balancing. Low potassium lev-
els are toxic to yeast cells. Competitive inhibition of sodium and potassium leads to low potassium levels
and high sodium levels in the yeast cells and is the reason for sodium toxicity for Saccharomyces cerevisiae
(Tosun and Ergun, 2007 [21]). Sodium is generally used as caustic soda (NaOH) in fuel alcohol plants for
cleaning purposes. Sodium levels greater than 500 mg/L results in yeast stress and inhibits their growth and
fermentation activity (Ingledew et al., 2009 [9]).
Copper (Cu) like zinc is an important cofactor for many enzymes such as lactase, cytochrome-c oxidase
and Cu-Zn superoxide dismutase. It helps in the detoxification of yeasts and enhances their respiration
activity (Stehlik-Tomas et al., 2004 [20]). The optimal concentration of Cu is known to be 1 µM and is
toxic to yeast in excess amounts (Rajagopalan et al., 2010 [15]). Manganese is required at a concentration
of 2-10 µM as it plays an important role in the glycolytic pathway being a part of pyruvate carboxylase and
enhances bud growth (Stehlik-Tomas et al., 2004 [20]).
Effect of calcium ions (Ca2+) on the fermentation of sucrose by S. cerevisiae was studied (Chotineeranat
et al., 2010 [6]). It was observed that sucrose fermentation was inhibited with increased calcium ion concen-
tration which was explained on the basis that calcium can inhibit the activity of invertase enzymes required
for the breakdown of sucrose to glucose and fructose. Also, it could be toxic to yeast cells and affect the
ionic strength and pH of the medium.
6

Chromium (Cr), along with other microelements such as Zn, Fe, Cu are known to be involved in the
stability of cell membranes and synthesis of nucleic acids. The main role of chromium in yeast cells is car-
bohydrate metabolism and is also known to stabilize the tertiary structure of proteins and conformations of
RNA and DNA (Zetic et al., 2001 [26]).
2.6 Water implications of cellulosic ethanol production in the US
In 2007, the US Energy Independence and Security Act set a goal of achieving the target of 15 billion gal/yr
(BGY) of ethanol from corn by 2015 and an additional 16 BGY from cellulosic feedstock by 2022 (Dominguez-
Faus et al., 2009 [7]). Current ethanol production in the US is 13.6 billion gal/yr. The environmental concerns
due to the growing biofuel industry are many but water security is one of the major issues which need to be
studied further to mitigate the harmful effects of water shortage and water pollution.
2.6.1 Stress on local water supplies
Water supplies in the US vary depending on the region; bio-refineries use less water at the production stage
compared to the water used for irrigation of biofuel crops. However, depending on the location of the ethanol
plant, water usage in the production stage can present serious local problems as water is generally extracted
from an underground aquifer of that particular region.
In some areas water resources are already stressed such as Ogallala or the High Plain aquifer which
runs from West Texas to South Dakota and Wyoming. Bioethanol plants located on the High Plain aquifer
require around 0.1 to 1 million gallons water per day. Current withdrawal rate is more than the aquifers
recharge rate and has led to a water table decline of about 190 feet in the last 50 years. A 100 million gallon
ethanol plant in southwestern Minnesota was denied the support from a local water supply as it required
350 million gallons of water per year (1 million gallon water per day) which was equivalent to water supply
for a town of 5,000 people (Reference [2]). Similarly, an article in croplife magazine (Reference [3]) stated
that a project by Gulfstream Bioflex Energy LLC worth 165 million dollars was stopped in Missouri as it
was going to draw 1.3 million gallons of water every day from the Ozark aquifer.
It was reported in the memorandum of ‘Department of community development services’ in 2006 that a
single ethanol plant will use around 10 percent of daily water usage of Urbana- Champaign, IL. This was
based on the data that a 100 million gallon ethanol plant will need 600 million gallon of water per year or 2
million gallon water per day and Illinois water company draws out around 22 million gallons water per day for
all the areas that it serves. The Mahomet aquifer covers nine counties of east central Illinois. This aquifer
has abundant water, around four trillion gallons. In 2000, water consumption by Mahomet aquifer was
around 84 million gallons per day, of which 38 million gallons was consumed by 800,000 residents, 24 million
by industries, 15 million by commercial enterprises and 7 million gallons for miscellaneous purposes such as
irrigation. It was reported that if one ethanol plant is located in each of the counties served by Mahomet
7
aquifer, additional 18 million gallon water per day will be drawn out of the aquifer. Although individual
projects do not affect supply from Mahomet aquifer, collective effects of various projects, expansion of urban
areas utilizing the aquifer, increased irrigation for agriculture, and new areas connecting to the aquifer can
have a major impact. Thus, reuse and recycle of water is being promoted and implemented in most of the
bio-refineries.
2.6.2 Water pollution due to bio-refineries
Ethanol plants generate a lot of waste streams such as blow-down water from cooling towers and boilers,
which has a large salt concentration due to evaporation and scaling, and reject water generated by reverse
osmosis. This effluent water should follow the National Pollutant Discharge Elimination System (NPDES)
permit requirements, which usually covers total dissolved solids, acidity, total suspended solids, residual
chlorine, and iron before being discharged to the environment (Reference [2]). Evaporators used in ethanol
plants at various stages produces an evaporate condensate stream which has a high Biological oxygen demand
(BOD) concentration. Wastewater streams having high BOD concentrations cannot be discharged directly
to the environment as it is a threat to aquatic animals causing eutrophication and hypoxia.
Cellulosic ethanol plants can produce additional wastewater streams as it has one additional step of
pretreating the cellulosic feedstock for solubilizing lignin and converting cellulose to hydrolysable sugars.
These wastewater streams before being discharged needs to be treated on site or sent to treatment facilities
of publicly owned treatment works (POTW).
2.7 Technological improvements for water conservation
Improvements in technologies for fuel production can reduce the water consumption to a great extent.
Fresh water use can be reduced in ethanol plants by introducing certain modifications like reducing the
cooling load by using thermophilic yeasts in fermentation process, by integrating heating and cooling loads,
using alternative cooling methods such as air cooled heat exchangers, geothermal cooling or hybrid wet/dry
cooling methods instead of evaporative cooling method. Use of alternative sources of water like municipal
wastewater, agricultural runoff water, storm water etc. can reduce the strain on fresh water sources. Water
conservation can also be achieved by reuse of steam condensate, recycling of treated process water, water
vapor capture from the dryer, boiler condensate reuse and process optimization (Wu et al., 2009 [24]).
Since introducing modifications in a fully functional existing plant is not easy and can be really expensive,
researchers are looking for ways which can be easily implemented as well are cost effective. One of such
methods being considered is to reuse effluent water instead of fresh water. Reclaiming wastewater and
reusing it, not only helps in water conservation but also helps in maintaining the water quality and solves
wastewater disposal problems. Although there are certain factors which can act as barriers such as treatment
costs, proximity to effluent plant and regulatory issues and need to be thoroughly studied and examined.
8
Chapter 3
Characterization of effluent water
3.1 Introduction
Characterization studies give a good idea about the concentration of constituents present in effluent samples.
The quality of effluent water depends on the constituents present in it and can affect the fermentation process
and final ethanol concentration. The objectives for this study were:
1. Comparison of characterization results of Bloomington-Normal, IL and Decatur, IL effluents after
collection.
2. Comparison of characterization results of filtered Decatur, IL effluent after filtering through 2.7 µm
(Grade GF/D) glass microfiber filter papers (Whatman, Buckinghamshire, UK) with unfiltered De-
catur, IL effluent.
3.2 Materials and methods
Treated effluent water samples were collected from Bloomington, IL and Decatur, IL and transported to
the Illinois Sustainability Technology Center, Champaign, IL, USA. Effluent from Bloomington-Normal was
collected from a Bloomington-Normal Water Reclamation District, Southeast Wastewater Treatment Plant
(BNWRD Se WWTP), Bloomington, IL and was mainly residential wastewater. The flow rate of water
at the time of collection was 4 million gallon per day (MGD). Temperature, pH and conductivity of water
sample at the time of measurement were 21.2◦C, 7.28 and 828 µS respectively. Decatur effluent water sample
was mainly a mix of industrial and residential wastewater and was collected from Sanitary District of Water,
Decatur, IL. Generally, the year round average is 45% industrial and 55% residential wastewater. At the
time of measurement, the water had a low flow rate and was mainly industrial accounting to around 75% of
flow. Flow rate was 23 MGD; temperature, pH and conductivity of water sample at the time of measurement
were 27.2◦C, 7.58 and 2.8 mS respectively. Water samples were stored at 4◦C prior to analysis.
For Decatur WWTP, the primary treatment involves screening of wastewater to remove all large particles
and primary clarification is used to separate solid particles from the liquid. Solids settled at the bottom of
tanks are sent to the digester for stabilization. Clear clarified liquid from the top is sent for secondary treat-
9

ment which includes aerated secondary clarifier tanks where waste water is treated with microorganisms.
Microorganisms and solids produced in this aerated system are again settled at the bottom and clear clarified
liquid is sent to the Nitrification aeration tanks to treat ammonia with wastewater for tertiary treatment.
A portion of the settled solids is sent to the digesters for stabilization whereas the rest is returned to the
secondary aeration tanks to aid with the treatment of primary effluent. Treated effluent is sent to aeration
tanks for further treatment. Again, a part of solids settled are sent to digesters and rest is returned to tertiary
aeration tanks for treatment of secondary effluent. A part of effluent flow is used as plant process water,
whereas rest is disinfected with sodium hypochlorite. Excess chlorine residuals are removed by bisulfite and
the clean wastewater is discharged through a cascade of aerators which adds oxygen to it. Digester residuals
known as biosolids are applied to farmland as fertilizer [1].
Total suspended solids (TSS) and Total dissolved solids (TDS) were measured according to the Standard
methods 2540 D and C (APHA-AWWA-WEF, 1998 [5]). Total organic carbon (TOC) analysis was done
according to the EPA Method 415.3 (Potter and Wimsatt, 2005 [14]). Alkalinity of effluent water was de-
termined by titration method in accordance with the Standard method 2320 B (APHA-AWWA-WEF, 1998
[5]).
Ammonia concentration (NH3-N) and Nitrate concentration (NO3−) were determined according to the
Standard ammonia selective electrode method 4500 D and UV-VIS spectrophotometer method 4500 B re-
spectively (APHA-AWWA-WEF, 1998 [5]). Anions such as Br−, Cl−, NO32−, SO4
2−, PO43−, F−, were
analyzed by EPA Method 300.1 Revision 1.0 (USEPA, 2000 [23]) using an Ion Chromatography system
(Dionex DX600, Ion Chromatography (IC) System). Target metals such as B, Mg, Al, Si, Cr, Mn, Ni, Cu,
Zn, As, Sr, Cd, Tl, Ba, and Pb were analyzed based on the USEPA method 6020A (USEPA, 1998 [22]) us-
ing an inductively coupled plasma-mass spectrometer (PQ Excell, Thermo Scientific, Waltham, MA, USA).
USEPA method 7000B (USEPA, 1998 [22]) was followed for analyzing Na, K, Ca and Fe.
Both the effluent water samples were tested for Biological Oxygen Demand (BOD) and Chemical Oxygen
Demand (COD) at Peoria Disposal Company, Peoria, IL, USA using standard methods 5210 B and 5220 D
(APHA-AWWA-WEF, 1992 [4]). Standard methods 9222 D and 9215 B (APHA-AWWA-WEF, 1992 [4])
were used to determine fecal coliform bacteria and standard plate count (SPC) respectively.
3.3 Results and discussions
3.3.1 Comparison of concentration of ions between Bloomington-Normal, IL
and Decatur, IL effluent water samples
The composition of treated Bloomington-Normal, IL and Decatur, IL effluent is presented in Tables 3.1 and
3.2. The overall concentration of ions was observed to be higher for Decatur, IL effluent. TSS value of
Bloomington-Normal and Decatur effluent was 0.56 mg/L and 5.2 mg/L respectively. The TDS value for
10
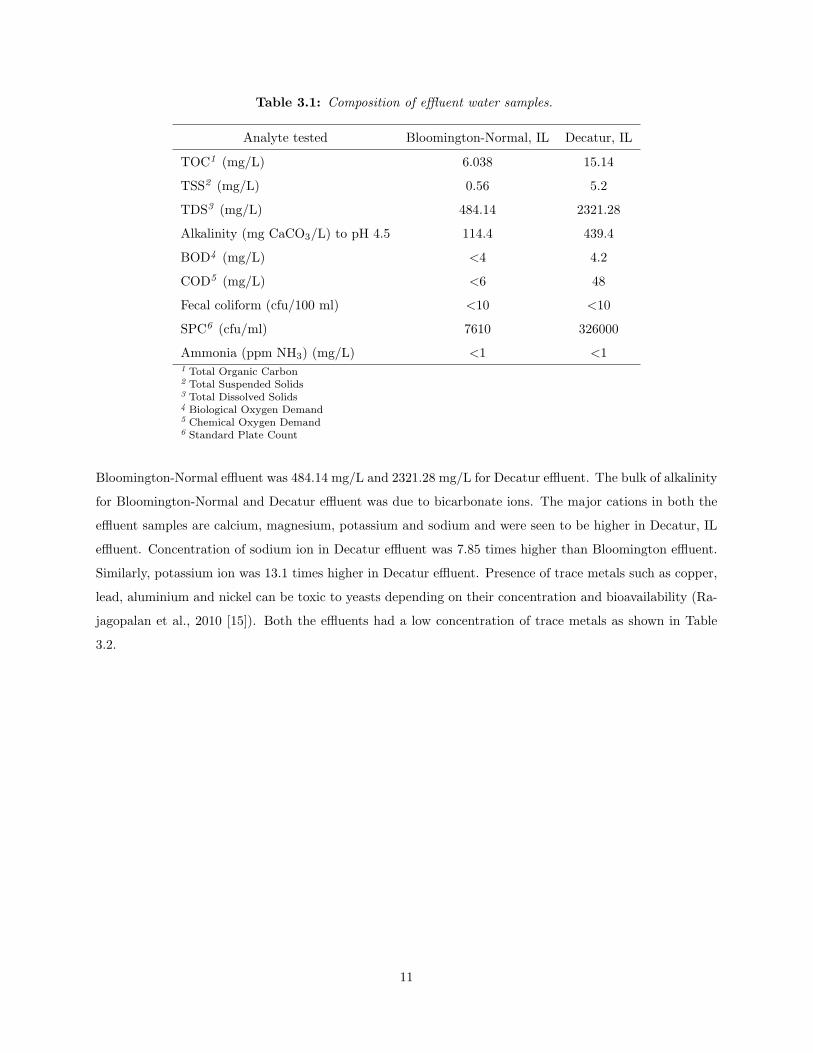
Table 3.1: Composition of effluent water samples.
Analyte tested Bloomington-Normal, IL Decatur, IL
TOC1 (mg/L) 6.038 15.14
TSS2 (mg/L) 0.56 5.2
TDS3 (mg/L) 484.14 2321.28
Alkalinity (mg CaCO3/L) to pH 4.5 114.4 439.4
BOD4 (mg/L) <4 4.2
COD5 (mg/L) <6 48
Fecal coliform (cfu/100 ml) <10 <10
SPC6 (cfu/ml) 7610 326000
Ammonia (ppm NH3) (mg/L) <1 <11 Total Organic Carbon2 Total Suspended Solids3 Total Dissolved Solids4 Biological Oxygen Demand5 Chemical Oxygen Demand6 Standard Plate Count
Bloomington-Normal effluent was 484.14 mg/L and 2321.28 mg/L for Decatur effluent. The bulk of alkalinity
for Bloomington-Normal and Decatur effluent was due to bicarbonate ions. The major cations in both the
effluent samples are calcium, magnesium, potassium and sodium and were seen to be higher in Decatur, IL
effluent. Concentration of sodium ion in Decatur effluent was 7.85 times higher than Bloomington effluent.
Similarly, potassium ion was 13.1 times higher in Decatur effluent. Presence of trace metals such as copper,
lead, aluminium and nickel can be toxic to yeasts depending on their concentration and bioavailability (Ra-
jagopalan et al., 2010 [15]). Both the effluents had a low concentration of trace metals as shown in Table
3.2.
11

Table 3.2: Concentration of ions and trace metals in effluent water samples.
Analyte tested Bloomington-Normal, IL Decatur, ILAnions (mg/L) Cl− 131 591
SO4−2 42.4 411
NO3− 83 142
NO2− <0.5 <0.5
F− 1 0.84Br− <5 <5
P-PO4−3 3.58 18.09
Cations (mg/L) Na 79 620K 13 170Ca 38 64Mg 29 49
Target metals (mg/L) Fe 0.85 0.73Sr 0.096 0.094Ru 0.011 0.067Al 0.0082 0.028Ni 0.005 0.028Zn 0.034 0.027Cu 0.0056 0.02Ba 0.025 0.0072Cr 0.0037 0.0061As 0.0012 0.0028Co 0.00052 0.0011Pb 0.00062 0.00058Li <0.02 <0.02V <0.01 <0.01Ag <0.002 <0.002Cs <0.002 <0.002Be <0.0002 <0.0002Cd <0.0002 <0.0002Th <0.0002 <0.0002
12
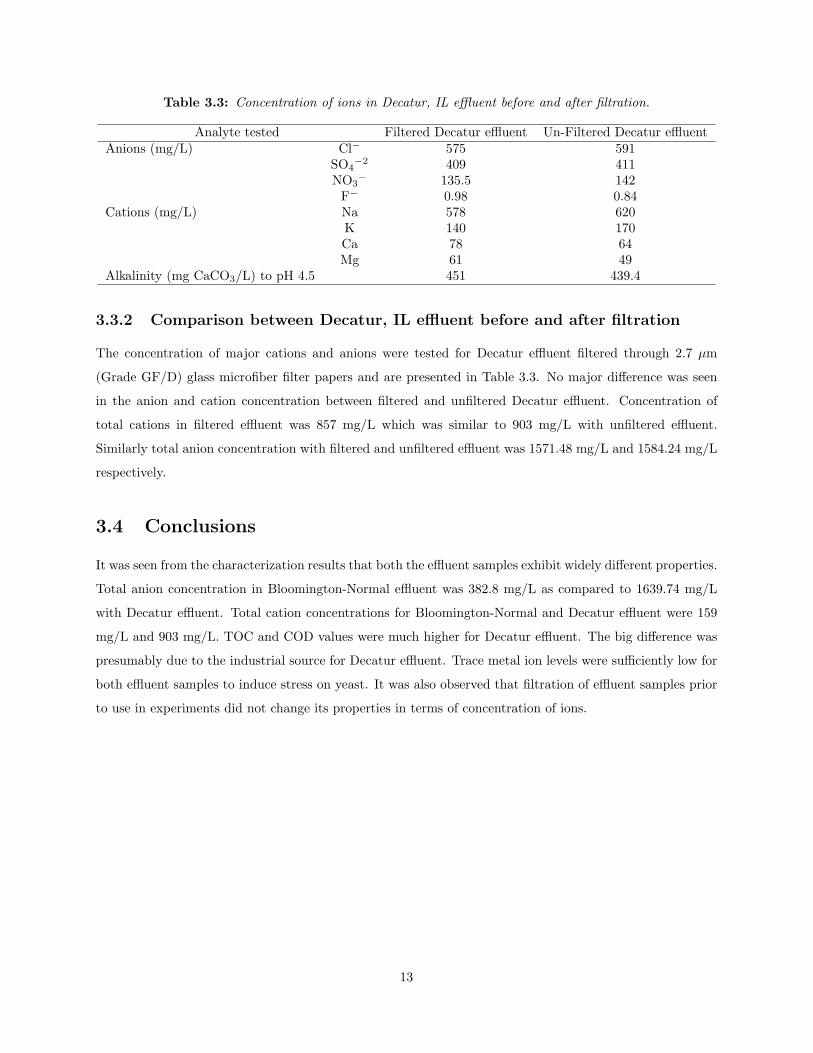
Table 3.3: Concentration of ions in Decatur, IL effluent before and after filtration.
Analyte tested Filtered Decatur effluent Un-Filtered Decatur effluentAnions (mg/L) Cl− 575 591
SO4−2 409 411
NO3− 135.5 142
F− 0.98 0.84Cations (mg/L) Na 578 620
K 140 170Ca 78 64Mg 61 49
Alkalinity (mg CaCO3/L) to pH 4.5 451 439.4
3.3.2 Comparison between Decatur, IL effluent before and after filtration
The concentration of major cations and anions were tested for Decatur effluent filtered through 2.7 µm
(Grade GF/D) glass microfiber filter papers and are presented in Table 3.3. No major difference was seen
in the anion and cation concentration between filtered and unfiltered Decatur effluent. Concentration of
total cations in filtered effluent was 857 mg/L which was similar to 903 mg/L with unfiltered effluent.
Similarly total anion concentration with filtered and unfiltered effluent was 1571.48 mg/L and 1584.24 mg/L
respectively.
3.4 Conclusions
It was seen from the characterization results that both the effluent samples exhibit widely different properties.
Total anion concentration in Bloomington-Normal effluent was 382.8 mg/L as compared to 1639.74 mg/L
with Decatur effluent. Total cation concentrations for Bloomington-Normal and Decatur effluent were 159
mg/L and 903 mg/L. TOC and COD values were much higher for Decatur effluent. The big difference was
presumably due to the industrial source for Decatur effluent. Trace metal ion levels were sufficiently low for
both effluent samples to induce stress on yeast. It was also observed that filtration of effluent samples prior
to use in experiments did not change its properties in terms of concentration of ions.
13

Chapter 4
Pretreatment, Hydrolysis andFermentation
4.1 Introduction
The digestibility of lignocellulosic biomass is of prime importance for efficient conversion of cellulose to
ethanol. Hence, pretreatment of lignocellulosic feedstock is one of the significant steps in processing cellu-
losic ethanol. Lignocellulosic feedstock mainly comprises of three components: Cellulose, hemicellulose and
lignin. The combination of lignin and hemicellulose provides a protective sheath around the cellulose, which
must be modified or removed before efficient hydrolysis can occur. Furthermore, the crystalline structure
of cellulose makes it highly insoluble and resistant to attack. Lignin is the most refractory component of
biomass and poses difficulties in pretreatment of biomass conversion processes.
The basic purpose of pretreatment is to reduce the recalcitrance by depolymerizing and solubilizing
the hemicellulose, which can further be hydrolyzed or fermented. The pretreatment can enhance the bio-
digestibility of the feedstock to various biofuels and increase accessibility of the enzymes to the materials.
Pretreatment methods have an effect on the overall process of cellulosic ethanol production. Upstream
processes such as harvesting, storage and size reduction of the feedstock are influenced by the choice of
pretreatment method employed. Pretreatment might produce degradation or toxic products affecting the
downstream processes such as on the enzymatic hydrolysis and fermentation. Removal of inhibitor products
generated in the pretreatment step is done by washing the solids several times. Washing can remove these
inhibitors but another effluent is generated that requires treatment before discharge. These soluble degra-
dation products such as furfural, acetic acid etc. need to be removed before release to the environment and
thus, add to the wastewater treatment costs (Yang and Wyman, 2008 [25]). Thus, the choice of pretreatment
method has to be compatible with the overall process of cellulosic ethanol production and should be cost
effective.
Enzyme hydrolysis is the second step to convert the pretreated solids (mainly cellulose) to glucose by
the action of cellulase enzymes. The conversion efficiency depends on several factors such as temperature,
pH and enzyme loading. Every enzyme has an optimum temperature and pH range and it is important to
maintain the temperature and pH within that range for maximum enzyme activity.
Fermentation is the anaerobic conversion of glucose to ethanol by the yeast, Saccharomyces cerevisiae.
Yeast has the capability of switching between aerobic and anaerobic pathways of glycolysis, it uses aerobic
14

pathway to produce more yeast cell biomass and other important membrane related compounds. Under high
glucose concentrations, it switches to anaerobic fermentation cycle to produce ethanol. High performance
liquid chromatography (HPLC) method can be used to determine glucose, ethanol, acetic acid and other
metabolites. Main Objectives of this chapter were to:
1. Evaluate the use of different ratios of Decatur, IL and Bloomington-Normal, IL effluents with DI
water on hydrolysis rate, fermentation rate and final ethanol concentration using Avicel cellulose as
the substrate material (Table 4.1).
2. Evaluate the effect of direct use of 100% (1X) Decatur, IL effluent without the initial filtration step
and the use of 4 times concentrated (4X) filtered Decatur, IL effluent on hydrolysis and fermentation
using Avicel cellulose as the substrate material.
3. Evaluate the effect of 100% (1X) Decatur, IL effluent water on hydrolysis and fermentation using
Miscanthus as the substrate material.
4.2 Materials and methods
Avicel PH101 (Sigma Aldrich, St. Louis, MO), a microcrystalline cellulose was used as the substrate for
this study. The moisture content of Avicel was determined by standard NREL LAP-001 protocol (drying at
105◦C for 4 hours) (Sluiter et al., 2008 [18]).
Dilute acid pretreatment technique was used for the pretreatment of Avicel sample. Based on the moisture
content of Avicel sample (3.88%), 1.56 g of avicel sample was mixed with 8.44 mL of 1% w/w dilute sulfuric
acid (prepared by 72% sulfuric acid) in piped reactor tubes for each experiment to maintain solids content
of 15%. 10mL water was added to the thermocouple reactor tube. All the tubes were sealed properly and
incubated in a fluidized sand bed reactor (Model IFB-51, Techne, Burlington, NJ) at 160◦C for 10 minutes.
The tubes were then cooled quickly by quenching in cold water. The pretreated biomass was recovered from
the tubes and a sample for HPLC analysis was taken for the determination of initial sugar content.
Water composition was the main experimental variable. Water composition was varied using De-Ionized
(DI) water and effluent water sample in various proportions as shown in Table 4.1. Each experiment was
carried out in triplicate. Effluent water sample was filtered through 2.7 µm (Grade GF/D) glass microfiber
filter papers (Whatman, Buckinghamshire, UK) prior to use in the experiment. Filtration of effluent water
presumably sterilizes it.
Washing of pretreated biomass was done using standard centrifugation method as stated in NREL LAP-
018 protocol (Sluiter et al., 2008 [19]) in a pre-weighed 50 mL centrifuge tube by adding 30 mL of water and
centrifuging at 3000 rpm (Model IEC CL30, Thermo Fisher Scientific, Ascheville, NC) for 5 minutes. Wash
water was discarded and the washing steps were repeated till the pH of wash water was in the range of 4.5
to 7. Moisture content of washed solids was determined using standard NREL LAP-001 protocol (drying at
15

Table 4.1: Table showing ratio of water composition used for washing and enzyme hydrolysis steps.
Experiment Label DI water (%) Effluent water (%)Control 100 0E-100 0 100E-75 25 75E-50 50 50E-25 75 25
105◦C for 24 hours) (Sluiter et al., 2008 [18]). Washed solids were stored at 4◦C prior to enzyme hydrolysis.
Dry weight of the washed solids was determined based on its moisture content. Citrate buffer (1M) of
pH 4.5 prepared by dissolving 21.4 g of citric acid monohydrate (Sigma Aldrich, St. Louis, MO) in 100
mL of water was added to the washed solids to obtain a final concentration of 0.05 M. Water was added to
attain 10% solids content used for enzyme hydrolysis. Accellerase Duet enzyme (Genencor, Danisco division,
Palo Alto, CA) was added at 0.25 mL per gram of biomass. Accellerase Duet enzyme has an endoglucanase
activity of 2400-3000 CMC U/g (Carboxymethylcellulose units). The xylanase activity and beta-glucosidase
activity of the enzyme are more than 3600 ABX U/g (Acid Birchwood Xylanase Units) and 400 pNPG U/g
(pNP-glucoside units) respectively. Hydrolysis was carried out at 50◦C and 75 rpm in a shaking water bath
(Model SK-939 XL, Amerex Instruments Inc., Lafayette, CA) for 72 hr. It was monitored by taking 1 mL
sample at 12 hr intervals and analyzed using HPLC.
Yeast inoculum was prepared by mixing 1 g active dry yeast (Ethanol Red, Lesaffre Yeast Corp., Mil-
waukee, WI) in 5 mL of water and incubated at 32◦C for 30 minutes. Yeast extract inoculum was prepared
by mixing 4 g of yeast extract powder (Fisher Scientific, Fair Lawn, NJ) in 5 mL of water. Fermentation
was carried out at 32◦C and 75 rpm in a shaking water bath (Model SK-939 XL, Amerex Instruments Inc.,
Lafayette, CA). The fermentation process was monitored by withdrawing 1 mL samples at 0, 3, 6, 9, 12, 24,
48 hr and analyzed using HPLC. The process employed in this study was semi simultaneous hydrolysis and
fermentation with a pre hydrolysis time of 72 hr.
The experiments were performed using:
1. Different ratios of filtered Decatur, IL effluent (E-100, E-75, E-50, E-25) with DI water. E-100 is
defined as 100% effluent water and 0% DI water.
2. Different ratios of filtered Bloomington, IL effluent (E-100, E-75, E-50, E-25) with DI water.
Further study with Decatur, IL effluent was conducted using:
1. Unfiltered 100% Decatur, IL effluent.
2. Concentrated (E-400) filtered Decatur, IL effluent - Concentrated Decatur effluent (4 times) was pre-
pared by lyophilizing 2000 ml of filtered effluent water using a freeze dryer (Labconco Freezone 6 liter
Console Freeze dry system, Labconco, Kansas, MO). Aliquots of 30 ml water samples were prepared in
16

50 ml centrifuge tubes and were frozen at −80◦C. These were then transferred to glass flasks and con-
nected to the ports of the freeze dryer. Freeze drying was done maintaining the low temperature and
pressure conditions of −47◦C and 0.1 mBar for 3 days. The lyophilized product was then collected and
mixed with 250 ml of DI water. This effluent was used to study the effect of concentrated Decatur ef-
fluent (E-400) on hydrolysis and fermentation rates. This experiment was done with duplicate samples.
3. Filtered 100% Decatur, IL effluent usingMiscanthus as the substrate - To study the effect ofMiscanthus
as the substrate with 100% filtered Decatur, IL effluent on hydrolysis and fermentation, the same basic
experimental protocol as mentioned above with Avicel PH101 was followed, except that here we used
10% and 2.5% solids content for pretreatment and enzyme hydrolysis steps respectively. Control study
was conducted using Miscanthus and DI water. This experiment was also done with duplicate samples.
The results for glucose and ethanol yields are expressed in g of glucose produced/ g of pretreated dry biomass
(g/g db) and g of ethanol produced / g of pretreated dry biomass (g/g db) respectively.
Data analysis by HPLC
The 1 mL samples collected during hydrolysis and fermentation were centrifuged at 13,000 rpm (Model 5415
D, Brinkmann - Eppendorf, Hamburg, Germany) for 5 minutes and clear supernatant liquid was passed
through 0.2 µm syringe filters (Nylon acrodisc WAT200834, Pall life sciences, Ann Arbor, MI) into 150 µL
vials. Filtered liquid were then analyzed by HPLC, by passing the filtered liquid through ion exclusion column
(Aminex HPX-87H, Bio-Rad, Hercules, CA) maintained at 50◦C. Glucose, ethanol and other metabolites
such as acetic acid, lactic acid, citrate, xylose and arabinose were eluted out from the column along with
HPLC grade water containing 5 mM sulfuric acid. The elution rate was 0.6 mL/min. Separated components
were detected by refractive index detector (model 2414, Waters Corporation, Milford, MA). Data were
processed using HPLC software (Waters Corporation, Milford, MA).
The statistical tests used to compare the final glucose and ethanol yields were Pooled t test, Analysis of
Variance (ANOVA) and Fisher’s Least Significant Difference (LSD)(SAS 9.2 version). The level selected to
show the statistical significance in all the cases were 5% (P < 0.05).
Glucose Y ield (g/g db) =Glucose from HPLC in %w/v ∗ Total volume used
100 ∗ Dry weight of pretreated dry biomass(4.1)
Ethanol Y ield (g/g db) =Ethanol from HPLC in %v/v ∗ 0.789 ∗ Total volume used
100 ∗ Dry weight of pretreated biomass(4.2)
17

4.3 Results and discussions
4.3.1 Effect of different ratios of filtered Decatur, IL effluent with DI water on
hydrolysis and fermentation rates and final ethanol yields
The different ratios tested (control, E-100, E-75, E-50, E-25; Table 4.1) with filtered Decatur, IL effluent did
not have any effect on the hydrolysis and fermentation rates. The glucose concentration profile, in all cases,
increased rapidly during the first 12 hours and then increased at a slower rate till 72 hours. Final glucose
concentrations and yields during enzyme hydrolysis at 72 hr were similar in all treatments resulting in 6.8
± 0.3 % w/v (0.68 ± 0.03 g/g db) for control study and 7.4 ± 0.1 % w/v (0.74 ± 0.01 g/g db), 7.5 ± 0.3 %
w/v (0.75 ± 0.03 g/g db), 7.2 ± 0.1 % w/v (0.72 ± 0.01 g/g db), 7.6 ± 0.3 % w/v (0.76 ± 0.03 g/g db), for
E-100, E-75, E-50 and E-25, respectively (Figure 4.1).
The ethanol concentrations increased slowly during first 3 hours, then rapidly from 3 to 9 hours and
finally at a decreasing rate after 9 hours. Final ethanol concentration and yield during fermentation at 48
hr for control was 4.55 ± 0.28 % v/v (0.36 ± 0.022 g/g db), which was comparable to the other treatments,
E-100, E-75, E-50, E-25 resulting in 4.74 ± 0.13 % v/v (0.37 ± 0.01 g/g db), 4.41 ± 0.85 % v/v (0.36 ± 0.06
g/g db), 4.63 ± 0.25 % v/v (0.36 ± 0.02 g/g db) and 4.24 ± 0.84 % v/v (0.33 ± 0.06 g/g db), respectively
(Figure 4.3). Residual glucose concentrations were <0.04 % w/v at 48 hr in all cases, suggesting complete
fermentation.
Previous study (Shen and Ablevor, 2010 [17]) resulted in a final ethanol concentration of 2.03 % v/v for
24 hr pre-hydrolysis time and 12 hr fermentation time and 1.77 % v/v for 12 hr pre-hydrolysis time and
60 hr fermentation time with Avicel cellulose as the substrate. The method used in this study was direct
hydrolysis and fermentation of Avicel cellulose without the pretreatment step (Shen and Ablevor, 2010 [17]).
Our results for control treatment indicated a final ethanol concentration 4.54 % v/v for 72 hr pre-hydrolysis
time and 48 hr fermentation. The difference in the results was possibly due to the inclusion of pretreatment
step in our study and the longer time duration for hydrolysis and fermentation.
18

Figure 4.1: Glucose production as a function of hydrolysis time with Decatur effluent.
0 12 24 36 48 60 72
0.0
0.2
0.4
0.6
0.8
1.0
Glu
cose
yie
ld (g
/g d
b)
Time (hr)
Control E-100 E-75 E-50 E-25
0 12 24 36 48 60 72
0.0
0.2
0.4
0.6
0.8
1.0
Figure 4.2: Glucose consumption as a function of fermentation time with Decatur effluent.
0 3 6 9 12 15 18 21 24 27 30 33 36 39 42 45 48 51
0.0
0.1
0.2
0.3
0.4
0.5
0.6
0.7
0.8
0.9
1.0
Glu
cose
yie
ld (g
/g d
b)
Time (hr)
Control E-100 E-75 E-50 E-25
0 3 6 9 12 15 18 21 24 27 30 33 36 39 42 45 48 51
0.0
0.1
0.2
0.3
0.4
0.5
0.6
0.7
0.8
0.9
1.0
19
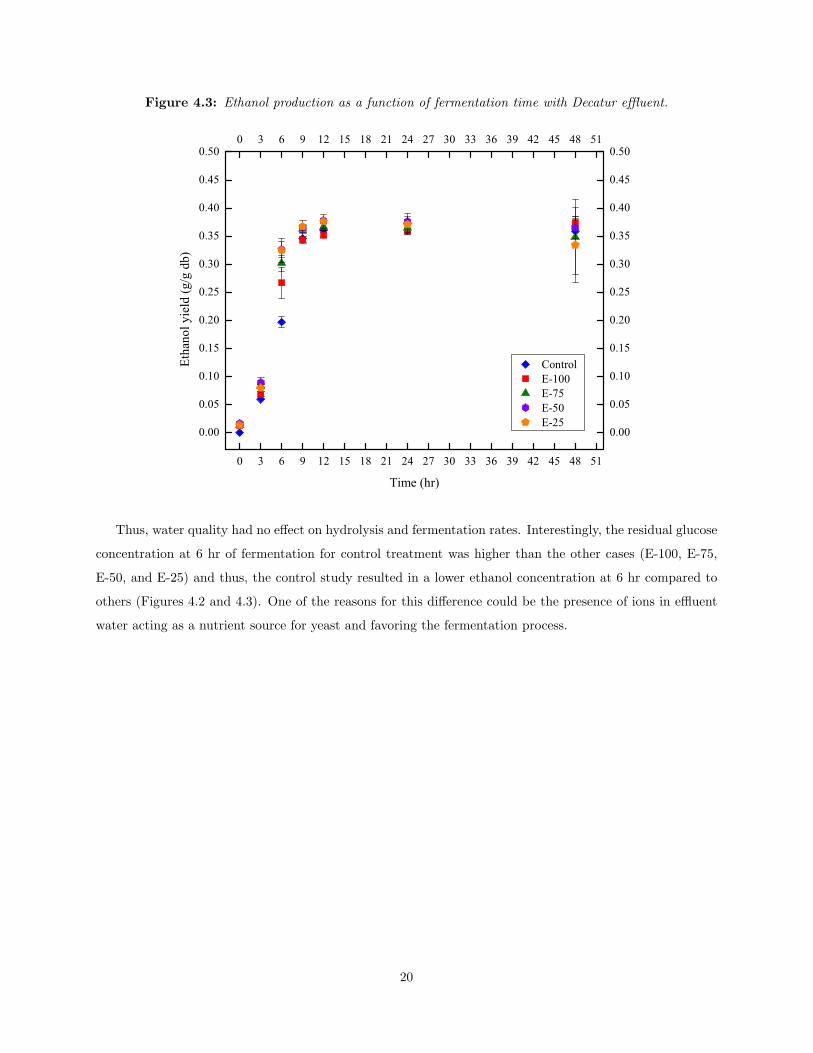
Figure 4.3: Ethanol production as a function of fermentation time with Decatur effluent.
0 3 6 9 12 15 18 21 24 27 30 33 36 39 42 45 48 51
0.00
0.05
0.10
0.15
0.20
0.25
0.30
0.35
0.40
0.45
0.50
Etha
nol y
ield
(g/g
db)
Time (hr)
Control E-100 E-75 E-50 E-25
0 3 6 9 12 15 18 21 24 27 30 33 36 39 42 45 48 51
0.00
0.05
0.10
0.15
0.20
0.25
0.30
0.35
0.40
0.45
0.50
Thus, water quality had no effect on hydrolysis and fermentation rates. Interestingly, the residual glucose
concentration at 6 hr of fermentation for control treatment was higher than the other cases (E-100, E-75,
E-50, and E-25) and thus, the control study resulted in a lower ethanol concentration at 6 hr compared to
others (Figures 4.2 and 4.3). One of the reasons for this difference could be the presence of ions in effluent
water acting as a nutrient source for yeast and favoring the fermentation process.
20

4.3.2 Effect of different ratios of filtered Bloomington-Normal, IL effluent with
DI water on hydrolysis and fermentation rates and final ethanol yields
Both the hydrolysis and fermentation rates with Bloomington-Normal, IL followed the same pattern as
shown with Decatur, IL effluent in section 4.3.1. No effect on the final glucose and ethanol yields were seen
with Bloomington-Normal effluent. Final glucose concentration at the end of hydrolysis (72 hr) with the
tested ratios of Bloomington-Normal effluent and DI water (E-100, E-75, E-50, E-25) were 6.64 ± 0.24 %
w/v (0.66 ± 0.02 g/g db), 6.41 ± 0.17 % w/v (0.64 ± 0.017 g/g db), 7.7 ± 0.4 % w/v (0.77 ± 0.04 g/g db)
and 7.8 ± 0.22 % w/v (0.78 ± 0.022 g/g db) (Figure 4.4 This was similar to our control study with 6.8 ±
0.3 % w/v (0.68 ± 0.03 g/g db) final glucose concentration. Final ethanol concentrations were also similar
resulting in 4.55 ± 0.28 % v/v (0.36 ± 0.022 g/g db), 4.57 ± 0.22 % v/v (0.36 ± 0.017 g/g db), 4.27 ± 0.002
% v/v (0.34 ± 1.7 × 10⁻³g/g db), 4.21 ± 0.10 % v/v (0.33 ± 0.008 g/g db) and 3.8 ± 0.29 % v/v (0.3 ±
0.02 g/g db) for control, E-100, E-75, E-50 and E-25 respectively (Figure 4.6).
Figure 4.4: Glucose production as a function of hydrolysis time with Bloomington-Normal effluent.
0 12 24 36 48 60 72
0.0
0.2
0.4
0.6
0.8
1.0
Glu
cose
Yie
ld (g
/g d
b)
Time (hr)
Control E-100 E-75 E-50 E-25
0 2 4 6 8 10
0.0
0.2
0.4
0.6
0.8
1.0
21

Figure 4.5: Glucose consumption as a function of fermentation time with Bloomington-Normal effluent.
0 3 6 9 12 15 18 21 24 27 30 33 36 39 42 45 48 51
0.0
0.1
0.2
0.3
0.4
0.5
0.6
0.7
0.8
0.9
1.0G
luco
se Y
ield
(g/g
db)
Time (hr)
Control E-100 E-75 E-50 E-25
0 3 6 9 12 15 18 21 24 27 30 33 36 39 42 45 48 51
0.0
0.1
0.2
0.3
0.4
0.5
0.6
0.7
0.8
0.9
1.0
Figure 4.6: Ethanol production as a function of fermentation time with Bloomington-Normal effluent.
0 3 6 9 12 15 18 21 24 27 30 33 36 39 42 45 48 51
0.00
0.05
0.10
0.15
0.20
0.25
0.30
0.35
0.40
0.45
0.50
Etha
nol Y
ield
(g/g
db)
Time (hr)
Control E-100 E-75 E-50 E-25
0 3 6 9 12 15 18 21 24 27 30 33 36 39 42 45 48 51
0.00
0.05
0.10
0.15
0.20
0.25
0.30
0.35
0.40
0.45
0.50
22
4.3.3 Effect of using Decatur, IL effluent directly without filtration on final
ethanol yield
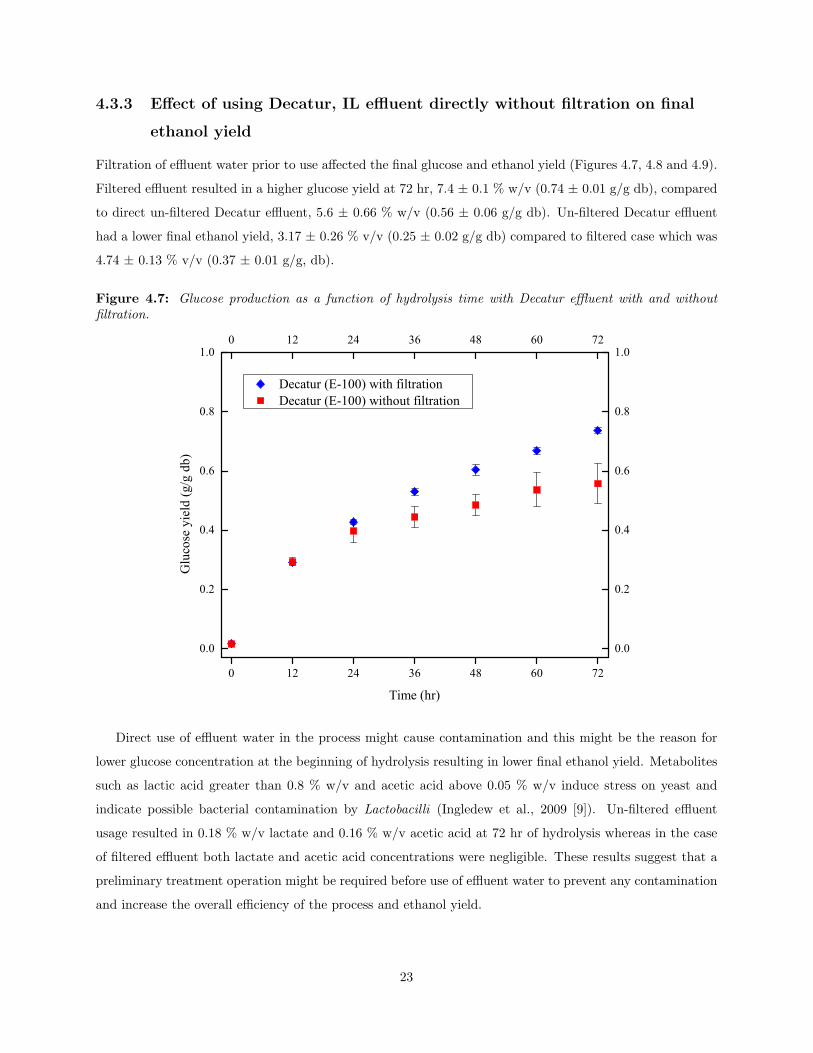
Filtration of effluent water prior to use affected the final glucose and ethanol yield (Figures 4.7, 4.8 and 4.9).
Filtered effluent resulted in a higher glucose yield at 72 hr, 7.4 ± 0.1 % w/v (0.74 ± 0.01 g/g db), compared
to direct un-filtered Decatur effluent, 5.6 ± 0.66 % w/v (0.56 ± 0.06 g/g db). Un-filtered Decatur effluent
had a lower final ethanol yield, 3.17 ± 0.26 % v/v (0.25 ± 0.02 g/g db) compared to filtered case which was
4.74 ± 0.13 % v/v (0.37 ± 0.01 g/g, db).
Figure 4.7: Glucose production as a function of hydrolysis time with Decatur effluent with and withoutfiltration.
0 12 24 36 48 60 72
0.0
0.2
0.4
0.6
0.8
1.0
Glu
cose
yie
ld (g
/g d
b)
Time (hr)
Decatur (E-100) with filtration Decatur (E-100) without filtration
0 12 24 36 48 60 72
0.0
0.2
0.4
0.6
0.8
1.0
Direct use of effluent water in the process might cause contamination and this might be the reason for
lower glucose concentration at the beginning of hydrolysis resulting in lower final ethanol yield. Metabolites
such as lactic acid greater than 0.8 % w/v and acetic acid above 0.05 % w/v induce stress on yeast and
indicate possible bacterial contamination by Lactobacilli (Ingledew et al., 2009 [9]). Un-filtered effluent
usage resulted in 0.18 % w/v lactate and 0.16 % w/v acetic acid at 72 hr of hydrolysis whereas in the case
of filtered effluent both lactate and acetic acid concentrations were negligible. These results suggest that a
preliminary treatment operation might be required before use of effluent water to prevent any contamination
and increase the overall efficiency of the process and ethanol yield.
23

Figure 4.8: Glucose consumption as a function of fermentation time for Decatur, IL effluent with andwithout filtration.
0 3 6 9 12 15 18 21 24 27 30 33 36 39 42 45 48 51
0.0
0.1
0.2
0.3
0.4
0.5
0.6
0.7
0.8
0.9
1.0G
luco
se y
ield
(g/g
db)
Time (hr)
Decatur (E-100) with filtration Decatur (E-100) without filtration
0 3 6 9 12 15 18 21 24 27 30 33 36 39 42 45 48 51
0.0
0.1
0.2
0.3
0.4
0.5
0.6
0.7
0.8
0.9
1.0
Figure 4.9: Ethanol production as a function of fermentation time for Decatur, IL effluent with and withoutfiltration.
0 3 6 9 12 15 18 21 24 27 30 33 36 39 42 45 48 51
0.00
0.05
0.10
0.15
0.20
0.25
0.30
0.35
0.40
0.45
0.50
Etha
nol y
ield
(g/g
db)
Time (hr)
Decatur (E-100) with filtration Decatur (E-100) without filtration
0 3 6 9 12 15 18 21 24 27 30 33 36 39 42 45 48 51
0.00
0.05
0.10
0.15
0.20
0.25
0.30
0.35
0.40
0.45
0.50
24

4.3.4 Effect of using concentrated Decatur, IL effluent on glucose and ethanol
yields
Concentrated Decatur effluent (E-400) did have an effect on enzyme hydrolysis step. As shown in Figure
4.10, rate of glucose production was lower with concentrated effluent than with filtered Decatur effluent
(E-100) and resulted in a lower final glucose concentration of 5.13 ± 0.35 % w/v (0.51 ± 0.035 g/g db)
compared to 7.4 ± 0.1 % w/v (0.74 ± 0.01 g/g db). Final ethanol concentration was however, similar in
both cases, resulting in 4.6 ± 0.12 % v/v (0.36 ± 0.01 g/g db) and 4.74 ± 0.13 % v/v (0.37 ± 0.01 g/g db)
for E-400 and E-100 respectively. (Figure 4.12)
Figure 4.10: Glucose production as a function of hydrolysis time with concentrated Decatur effluent.
0 12 24 36 48 60 72
0.0
0.2
0.4
0.6
0.8
1.0
Glu
cose
Yie
ld (g
/g d
b)
Time (hr)
Control E-100 E-400
0 12 24 36 48 60 72
0.0
0.2
0.4
0.6
0.8
1.0
The reason for similar ethanol yields could be due to simultaneous production and consumption of glucose
during fermentation. The rate of glucose consumption from 0 to 6 hr for concentrated effluent (E-400) was
slower compared to other treatments (control and E-100) (Figure 4.11) whereas the rate of ethanol production
was same for all the cases as seen from Figure 4.12. This suggests that glucose production did not stop during
hydrolysis but continued during fermentation as well.
Table 4.2 shows LSD results for the mean final glucose and ethanol yields with the control treatment and
Decatur effluent (E-400, E-100, E-75, E-50, E-25, Decatur without filtering). Table 4.3 shows the mean final
glucose and ethanol yields with Bloomington-Normal effluent (E-100, E-75, E-50, E-25). As seen from Table
4.2, concentrated (E-400) and unfiltered Decatur effluent resulted in a lower final glucose yield which was
25

Figure 4.11: Glucose consumption as a function of fermentation time with concentrated Decatur effluent.
0 3 6 9 12 15 18 21 24 27 30 33 36 39 42 45 48 51
0.0
0.1
0.2
0.3
0.4
0.5
0.6
0.7
0.8
0.9
1.0
Glu
cose
Yie
ld (g
/g d
b)
Time (hr)
Control E-100 E-400
0 3 6 9 12 15 18 21 24 27 30 33 36 39 42 45 48 51
0.0
0.1
0.2
0.3
0.4
0.5
0.6
0.7
0.8
0.9
1.0
Figure 4.12: Ethanol production as a function of fermentation time with concentrated Decatur effluent.
0 3 6 9 12 15 18 21 24 27 30 33 36 39 42 45 48 51
0.00
0.05
0.10
0.15
0.20
0.25
0.30
0.35
0.40
0.45
0.50
Etha
nol Y
ield
(g/g
db)
Time (hr)
Control E-100 E-400
0 3 6 9 12 15 18 21 24 27 30 33 36 39 42 45 48 51
0.00
0.05
0.10
0.15
0.20
0.25
0.30
0.35
0.40
0.45
0.50
26

Table 4.2: Mean final glucose and ethanol yields (g/g db) for Decatur, IL effluent.
Labels Percentage of Effluent water used Mean final glucose yield1 Mean final ethanol yield2
Control 0 0.679b 0.358a
E-100 100 0.737a 0.374a
E-75 75 0.75a 0.348a
E-50 50 0.721ab 0.365a
E-25 25 0.756a 0.334a
E-400 400 0.512c 0.365a
Unfiltered Decatur 100 0.557c 0.247b1 Mean glucose yields followed by the same letter in a column (abc) were not different (P<0.05). LSD value was 0.0575.2 Mean ethanol yields followed by the same letter in a column (ab) were not different (P<0.05). LSD value was 0.0676.
Table 4.3: Mean final glucose and ethanol yields (g/g db) for Bloomington-Normal, IL effluent.
Labels Percentage of Effluent water used Mean final glucose yield1 Mean final ethanol yield2
Control 0 0.679bc 0.358a
E-100 100 0.664c 0.360a
E-75 75 0.738ab 0.341a
E-50 50 0.770a 0.332a
E-25 25 0.780a 0.300b1 Mean glucose yields followed by the same letter in a column (abc) were not different (P<0.05). LSD value was0.0617.
2 Mean ethanol yields followed by the same letter in a column (ab) were not different (P<0.05). LSD value was 0.031.
significantly different from other treatments. Final ethanol yield for unfiltered Decatur effluent treatment
was observed to be significantly different from other treatments. Final glucose yields with control treatment
and 100% (E-100) Bloomington effluent was slightly lower than the other treatments probably due to lower
concentration of ions in DI water and excess of the same in E-100 treatment (Table 4.3). Final ethanol
yields, however were similar in all treatments except for the case with 25% effluent (E-25).
4.3.5 Effect of filtered Decatur, IL effluent on hydrolysis and fermentation
rates and final ethanol concentration using Miscanthus as the substrate
Both hydrolysis and fermentation profiles with Miscanthus as the substrate followed a similar pattern as
described in section 4.3.1. As seen from Figure 4.13 , both the control experiment (with DI water) and
filtered Decatur effluent (E-100) resulted in similar glucose production throughout the hydrolysis. Final
glucose concentrations with control and Decatur effluent were 1.09 ± 0.08 % w/v (0.45 ± 0.007 g/g db) and
1.17 ± 0.017 % w/v (0.44 ± 0.03 g/g db). Fermentation was completed in 6 hours for both cases as can be
seen from Figure 4.14. Overlap of data points during fermentation as seen in Figure 4.15, shows that there
27

was no effect of water quality on fermentation with Miscanthus as the substrate material. Final ethanol
concentration at 48 hr of fermentation with the control experiment was 0.53 ± 0.07 % v/v (0.166 ± 0.02
g/g db) and with Decatur effluent was 0.46 ± 0.008 % v/v (0.15 ± 0.003 % g/g db).
Pooled t test was used in this study to compare the final glucose and ethanol yields of control study
and filtered Decatur effluent. P values of 0.69 and 0.28 were obtained for final glucose and ethanol yields,
respectively suggesting that there is no significant difference between the control study and E-100.
Figure 4.13: Glucose production as a function of hydrolysis time using Decatur effluent and Miscanthus assubstrate.
0 12 24 36 48 60 72
0.0
0.1
0.2
0.3
0.4
0.5
Glu
cose
yie
ld (g
/g d
b)
Time (hr)
Control Decatur (E-100)
0 12 24 36 48 60 72
0.0
0.1
0.2
0.3
0.4
0.5
28

Figure 4.14: Glucose consumption as a function of fermentation time using Decatur effluent and Miscanthusas substrate.
0 3 6 9 12 15 18 21 24 27 30 33 36 39 42 45 48 51
0.0
0.1
0.2
0.3
0.4
0.5
Glu
cose
yie
ld (g
/g d
b)
Time (hr)
Control Decatur (E-100)
0 3 6 9 12 15 18 21 24 27 30 33 36 39 42 45 48 51
0.0
0.1
0.2
0.3
0.4
0.5
Figure 4.15: Ethanol production as a function of fermentation time using Decatur effluent and Miscanthusas substrate.
0 3 6 9 12 15 18 21 24 27 30 33 36 39 42 45 48 51
0.0
0.1
0.2
0.3
Etha
nol y
ield
(g/g
db)
Time (hr)
Control Decatur (E-100)
0 3 6 9 12 15 18 21 24 27 30 33 36 39 42 45 48 51
0.0
0.1
0.2
0.3
29
4.4 Conclusions
Glucose and ethanol concentrations were similar for control study, filtered Decatur and filtered Bloomington-
Normal effluent despite the difference in the nature of water samples being used. It was also seen that presence
of ions in the effluent samples possibly favored the fermentation process by the increased ethanol yield at
6 hr of fermentation with effluent samples compared to control experiment using DI water. Direct use of
Decatur effluent without filtration resulted in a lower glucose and ethanol yield suggesting the possibility of
contamination. Use of concentrated Decatur effluent slowed the hydrolysis process and resulted in a lower
glucose yield compared to the other treatments. However, the final ethanol concentration during fermentation
was similar to the control treatment, suggesting that the enzymes might still be active producing glucose
during fermentation. Final glucose and ethanol yields were not affected in the case of using Decatur effluent
with Miscanthus as the substrate.
This study shows that with proper characterization studies, the use of treated effluent water is feasible
in cellulosic ethanol production. However, due to the limited effluent water samples used in this study, more
extensive research is required in this field.
30

Chapter 5
Recommendations for future work
Water quality is one of the prime factors affecting hydrolysis and fermentation rates and final ethanol
concentrations. This will ultimately affect the process economics of cellulosic ethanol plants. Further study
related to this field could include the following:
1. A detailed study on the process economics of cellulosic ethanol plants considering the installation of a
treatment unit to pretreat the effluent water before use.
2. Studying the effect of increased concentration of ions on the process and finding the upper limit of
various ions which could inhibit fermentation completely.
3. Effect of using treated effluent water for the entire process, including pretreatment, hydrolysis and
fermentation.
4. Study on using the effluent water and improving the efficiency of the process simultaneously.
31
References
[1] Sanitary District of Decatur, Operations. URL http://sddcleanwater.org/operations.
[2] Water implications of biofuels production in the United States. The National Academies Press, Wash-ington D. C., 2008. ISBN 0-309-11362-8. URL http://www.nap.edu/catalog/12039.html.
[3] Backsplash Backlash, March 2008. URL http://www.croplife.com/article/4526.
[4] APHA-AWWA-WEF. Standard Methods for the Examination of Water and Wastewater. AmericanPublic Health Association/American Water Works Association/Water Environment Federation, Wash-ington, DC, 18th edition, 1992.
[5] APHA-AWWA-WEF. Standard Methods for the Examination of Water and Wastewater. AmericanPublic Health Association/American Water Works Association/Water Environment Federation, Wash-ington, DC, 20th edition, 1998.
[6] S. Chotineeranat, R. Wansuksri, K. Piyachomkwan K, P. Chatakanonda, P. Weerathaworn, andK. Sriroth. Effect of calcium ions on ethanol production from molasses by Saccharomyces cerevisiae.Sugar Tech, 12(2):120–124, 2010.
[7] R. Dominguez-Faus, S. E. Powers, J. G. Burken, and P. J. Alvarez. The water footprint of biofuels: Adrink or drive issue. Environmental Science and Technology, 43(9):3005–3010, 2009.
[8] C. B. Fedler and R. Duan. Biomass production for bioenergy using recycled wastewater in a naturalwaste treatment system. Resources, Conservation and Recycling, 55(8):793–800, 2011.
[9] W. M. Ingledew, D. R. Kelsall, G. D. Austin, and C. Kluhspies. The Alcohol Textbook. NottinghamUniversity Press, Nottingham, fifth edition, 2009.
[10] K. A. Jacques, T. P. Lyons, and D. R. Kelsall. The Alcohol Textbook. Nottingham University Press,Nottingham, fourth edition, 2003.
[11] David B. Johnston and Ana Beatriz Henriques. Enzymatic water removal: Potential energy and wa-ter reductions for fuel ethanol production. Technical report, Sixth International Starch TechnologyConference, May 2009.
[12] James McDonald and Jim Rieke. Efficient Water Management. Technical report, Biofuels Business,August 2007. URL www.BioFuelsBusiness.com.
[13] M. Miksaj, N. Burcuck, M. Jukic, and Z. Filipovic-Kovacevic. Amperometric Biosensor for monitoringrespiration activity of Saccharomyces cerevisiae in the presence of cobalt and zinc. Food Technol.Biotechnol, 40(2):111–117, 2002.
[14] B. B. Potter and J. C. Wimsatt. Method 415.3 Determination of Total Organic Carbon and Specific UVAbsorbance at 254nm IN Source Water and Drinking Water. Technical report, USEPA, 2005. ReportEPA/600/R-05/055, USEPA, Washington, DC.
[15] N. Rajagopalan, V. Singh, B. Panno, and M. Wilcoxon. Use of cooling tower blowdown in ethanolfermentation. Water science and technology, 62(10):2263–2269, 2010.
32
[16] Mark A. Shannon. Water Sustainability for peoples of the world: Nexus to the food production andprocessing. Technical report, Sixth International Starch Technology Conference, May 2009.
[17] J. Shen and F. A. Ablevor. Modeling semi-simultaneous saccharification and fermentation of ethanolproduction from cellulose. Biomass and Bioenergy, 34:1098–1107, 2010.
[18] A. Sluiter, B. Hames, D. Hyman, C. Payne, R. Ruiz, C. Scarlata, J. Sluiter, D. Templeton, and J. Wolfe.Determination of total solids in biomass and total dissolved solids in in liquid process samples. Technicalreport, NREL Laboratory Analytical Procedure, 2008. NREL/TP-510-42621.
[19] A. Sluiter, D. Hyman, C. Payne, and J. Wolfe. Determination of insoluble solids in pretreated biomassmaterial. Technical report, NREL Laboratory Analytical Procedure, 2008. NREL/TP-510-42627.
[20] V. Stehlik-Tomas, V. Gulan Zetic, D. Stanzer, S. Grba, and N. Vahcic. Zinc, Copper and ManganeseEnrichment in Yeast Saccharomyces cerevisiae. Food Technol. Biotechnol, 42(2):115–120, 2004.
[21] A. Tosun and M. Ergun. Use of experimental design method to investigate metal ion effects in yeastfermentations. Journal of Chemical Technology and Biotechnology, 82(1):11–15, 2007.
[22] USEPA. Test Methods for Evaluating Solid Wastes, Physical/ Chemical Methods (SW-846), Office ofSolid Waste and Emergency Response. Technical report, USEPA,Washington, DC, 1998.
[23] USEPA. Methods for the Determination of Organic and Inorganic Compounds in Drinking Water.Technical report, USEPA, 2000. Volume 1. Report EPA/815-R-00-014, USEPA, Washington, DC.
[24] M. Wu, M. Mintz, M. Wang, and S. Arora. Consumptive water use in the production of ethanol andpetroleum gasoline. Technical report, Argonne National Laboratory (ANL), Argonne, IL, USA, January2009. Report ANL/ESD/09-1.
[25] B. Yang and C. E. Wyman. Pretreatment: the key to unlocking low-cost cellulosic ethanol. Biofuels,Bioproducts and Biorefining, 2:26–40, 2008. DOI: 10.1002/bbb.
[26] V. G. Zetic, V. Sthelik-Tomas, S. Grba, L. Lutilsky, and D. Kozlek. Chromium uptake by Saccharomycescerevisiae and isolation of glucose tolerance factor from yeast biomass. Journal of Biosciences, 26(2):217–223, 2001.
[27] Y. Zheng, Z. Pan, and R.Zhang. Overview of biomass pretreatment for cellulosic ethanol production.International journal of Agriculture and Biological Engineering, 2(3):51–68, 2009.
33
Related Documents