Use of the water quality index and dissolved oxygen deficit as simple indicators of watersheds pollution Enrique Sa ´nchez a , Manuel F. Colmenarejo a , Juan Vicente b , Angel Rubio b , Marı ´a G. Garcı ´a a , Lissette Travieso c , Rafael Borja c, * a Centro de Ciencias Medioambientales (CSIC), C/Serrano, 115-Duplicado, 28006 Madrid, Spain b Ayuntamiento of Las Rozas, Madrid, Spain c Instituto de la Grasa (CSIC), Avda Padre Garcı ´a Tejero 4, E-41012 Sevilla, Spain Received 21 November 2005; received in revised form 16 February 2006; accepted 21 February 2006 Abstract The use of the water quality index (WQI) and the dissolved oxygen deficit (D) as simple indicators of the watersheds pollution was investigated and compared in the Municipality of Las Rozas (north-west of Madrid, Spain). The quality of the water in Guadarrama and Manzanares rivers and Paris Park ponds, the main watersheds of this area was investigated during 2 years (from September 2001 to September 2003). It was found that the WQI was very useful for the classification of the waters monitored. The WQI was 70, which corresponds to ‘‘good’’ quality water at the sampling point 1 (entrance of Las Rozas) and decreased to around 64 (medium quality) at the sampling point 6 (outlet of Las Rozas) in the case of Guadarrama River. The WQI was around 65 in the influents of Manzanares River. Finally, in Paris Park the WQI ranged from around 72–55, which corresponded to a classification from ‘‘good’’to ‘‘medium’’ quality, respectively. A high linear relationship between the WQI and the dissolved oxygen deficit (D) was found. Therefore, a fast determination of WQI may be carried out knowing the values of D, which are easily obtainable by field measurements. It was found an influence of the climate conditions on the values of WQI and D. # 2006 Elsevier Ltd. All rights reserved. Keywords: Water quality index (WQI); Dissolved oxygen deficit (D); Watersheds pollution 1. Introduction Different regions of the world are faced with diffe- rent types of problems associated with the occurrence, use and control of water resources, which may endanger the sustainable development of these resources. The quality of surface waters is a very sensitive issue. Anthropogenic influences as well as natural processes degrade surface waters and impair their use for drinking, industry, agriculture, recreation and other purposes (Carpenter et al., 1998; Jarvie et al., 1998; Simeonov et al., 2003). Due to the spatial and temporal This article is also available online at: www.elsevier.com/locate/ecolind Ecological Indicators 7 (2007) 315–328 * Corresponding author. Tel.: +34 95 4689654; fax: +34 95 4691262. E-mail address: [email protected] (R. Borja). 1470-160X/$ – see front matter # 2006 Elsevier Ltd. All rights reserved. doi:10.1016/j.ecolind.2006.02.005

Welcome message from author
This document is posted to help you gain knowledge. Please leave a comment to let me know what you think about it! Share it to your friends and learn new things together.
Transcript
This article is also available online at:www.elsevier.com/locate/ecolind
Ecological Indicators 7 (2007) 315–328
Use of the water quality index and dissolved oxygen
deficit as simple indicators of watersheds pollution
Enrique Sanchez a, Manuel F. Colmenarejo a, Juan Vicente b, Angel Rubio b,Marıa G. Garcıa a, Lissette Travieso c, Rafael Borja c,*
a Centro de Ciencias Medioambientales (CSIC), C/Serrano, 115-Duplicado, 28006 Madrid, Spainb Ayuntamiento of Las Rozas, Madrid, Spain
c Instituto de la Grasa (CSIC), Avda Padre Garcıa Tejero 4, E-41012 Sevilla, Spain
Received 21 November 2005; received in revised form 16 February 2006; accepted 21 February 2006
Abstract
The use of the water quality index (WQI) and the dissolved oxygen deficit (D) as simple indicators of the watersheds
pollution was investigated and compared in the Municipality of Las Rozas (north-west of Madrid, Spain). The quality of the
water in Guadarrama and Manzanares rivers and Paris Park ponds, the main watersheds of this area was investigated during 2
years (from September 2001 to September 2003). It was found that the WQI was very useful for the classification of the waters
monitored. The WQI was 70, which corresponds to ‘‘good’’ quality water at the sampling point 1 (entrance of Las Rozas) and
decreased to around 64 (medium quality) at the sampling point 6 (outlet of Las Rozas) in the case of Guadarrama River. The
WQI was around 65 in the influents of Manzanares River. Finally, in Paris Park the WQI ranged from around 72–55, which
corresponded to a classification from ‘‘good’’ to ‘‘medium’’ quality, respectively. A high linear relationship between the WQI
and the dissolved oxygen deficit (D) was found. Therefore, a fast determination of WQI may be carried out knowing the values of
D, which are easily obtainable by field measurements. It was found an influence of the climate conditions on the values of WQI
and D.
# 2006 Elsevier Ltd. All rights reserved.
Keywords: Water quality index (WQI); Dissolved oxygen deficit (D); Watersheds pollution
1. Introduction
Different regions of the world are faced with diffe-
rent types of problems associated with the occurrence,
* Corresponding author. Tel.: +34 95 4689654;
fax: +34 95 4691262.
E-mail address: [email protected] (R. Borja).
1470-160X/$ – see front matter # 2006 Elsevier Ltd. All rights reserved
doi:10.1016/j.ecolind.2006.02.005
use and control of water resources, which may endanger
the sustainable development of these resources. The
quality of surface waters is a very sensitive issue.
Anthropogenic influences as well as natural processes
degrade surface waters and impair their use for
drinking, industry, agriculture, recreation and other
purposes (Carpenter et al., 1998; Jarvie et al., 1998;
Simeonov et al., 2003). Due to the spatial and temporal
.

E. Sanchez et al. / Ecological Indicators 7 (2007) 315–328316
variations in water chemistry, a monitoring programme
and a representative and reliable estimation of the
quality of surface waters are necessary (Bollinger et al.,
1999). The water quality index (WQI) has been
considered to give a criteria for surface water
classification based on the use of standard parameters
for water characterization (Couillard and Lefebvre,
1985; House and Newsome, 1989; Smith, 1989;
Melloul and Collin, 1998; Nives, 1999; Pesce and
Wunderlin, 2000; Swamee and Tyagi, 2000; Bordalo
et al., 2001; Cude, 2001; Nagel, 2001; Jonnalagadda
and Mhere, 2001; Liou et al., 2003; Hernandez-Romero
et al., 2004). This index is a mathematical instrument
used to transform large quantities of water character-
ization data into a single number, which represents the
water quality level. The use of WQI is a simple
practice, which allows adequate classification of
water quality. The determination of WQI requires a
normalization step where each parameter is trans-
formed into a 0–100 scale, where 100 represents the
maximum quality. The next step is to apply a
weighting factor in accordance with the importance
of the parameter as an indicator of water quality
(Nives, 1999; Pesce and Wunderlin, 2000; Jonnala-
gadda and Mhere, 2001).
Dissolved oxygen (DO) and dissolved oxygen
deficit (D) are parameters frequently used to evaluate
the water quality on different reservoirs and water-
sheds. These parameters are strongly influenced by a
combination of physical, chemical, and biological
characteristics of streams of oxygen demanding
substances, including algal biomass, dissolved organic
matter, ammonia, volatile suspended solids, and
sediment oxygen demand (Spanou and Chen, 1999;
Cox, 2003; Mullholand et al., 2005; Quinn et al.,
2005). Williams et al. (2000) studied the water quality
variation in three rivers of United Kingdom. The
authors established an empirical equation between the
oxygen deficit variation, the average photosynthesis
rate and the average respiration rate. The use of
dissolved oxygen content as an index of water quality
was also used to estimate the effect of industrial and
municipal effluents on the waters of San Vicente Bay,
Chile (Rudolf et al., 2002). The results suggested that
the oxygen depletion was a representative parameter
for establishing a relative scale of water quality in
these waters. A method based on the maximum and
minimum dissolved oxygen (DO) deficits was derived
to estimate metabolism rates (photosynthesis and
respiration) in streams. This method was applied to
DO concentrations that were measured in two creeks
located in urbanized and agricultural watersheds,
respectively (Wang et al., 2003). An oxygen equiva-
lent model for water quality dynamics was applied
in a macrophyte dominated river (Park et al., 2003).
The model simulated seven coupled state variables:
BOD5, DO, organic nitrogen, ammonia nitrogen,
nitrite/nitrate nitrogen, total organic phosphorus and
dissolved inorganic phosphorus.
The subject of the present work was the use of
the water quality index (WQI) and the dissolved
oxygen deficit (D) as indicators of the environmental
quality of watersheds. As a particular case the main
surface watersheds located in Las Rozas, Madrid
(Spain) were monitored for a period of 2 years
(September 2001 to September 2003). For the deter-
mination of the WQI, European Standards (EU,
1975) for clean water were used as reference in each
case. Finally, the study of the influence of the climate
condition on the water quality was other objective
of the present paper.
2. Materials and methods
2.1. Description of the watersheds investigated
Las Rozas, Madrid (Spain) is a town located in
the north-west of Madrid with a total surface area
of around 59 km2, the urban area corresponds to 44%
of the total area. The total population is 56,000, 77%
of which lives in the urban area. The main watersheds
are distributed in the rivers of Guadarrama and
Manzanares and their influents and in the ponds
of Paris Park. These resources are also of great
importance for the city of Madrid.
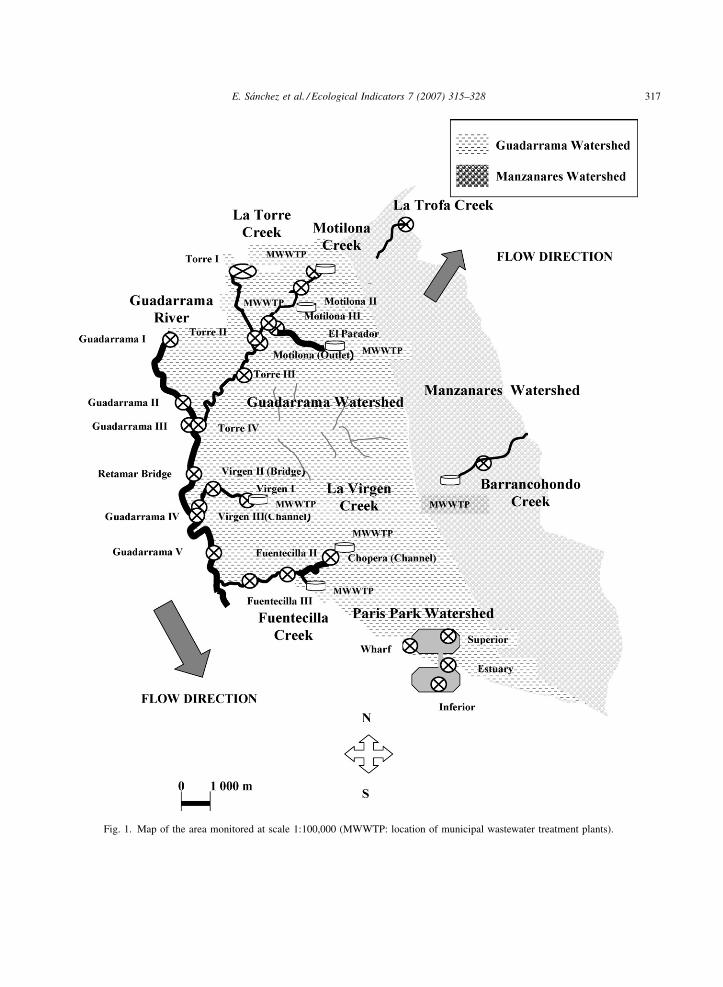
Fig. 1 shows the three watersheds monitored:
Guadarrama River, located on the west border and
made up of the Guadarrama River and the influent
creeks (La Torre, La Virgen and Fuentecillas),
Manzanares River on the east border and made up
of the La Trofa and Barrancohondo creeks and the
Paris Park located in the south, a recreational area with
two connected lakes called Superior and Inferior. The
water is recycled from the Inferior Lake to the
Superior Lake by pumping.
E. Sanchez et al. / Ecological Indicators 7 (2007) 315–328 317
Fig. 1. Map of the area monitored at scale 1:100,000 (MWWTP: location of municipal wastewater treatment plants).

E. Sanchez et al. / Ecological Indicators 7 (2007) 315–328318
2.2. Procedure for watershed sampling
Sampling of the watersheds was carried during
2 years (from September 2001 to September 2003),
Table 1
Description and location of the sampling points monitored
Watershed Sampling point
1 2 3
Guadarrama
Guadarrama River
Name of the
sample point
Guadarrama I Guadarrama II Guadar
Distance (km) 0 1.75 2.43
La Torre creek
Sampling point 1 2 3
Name of the
sample point
La Torre I La Torre II La Tor
Distance (km) 0 1.9 2.54
Motilona creek
Sampling point 1 2 3
Name of the
sample point
Motilona I Motilona II Motilo
Distance (km) 0 0.15 1.35
La Virgen creek
Sampling point 1 2 3
Name of the
sample point
La Virgen I Bridge Channe
Distance (km) 0 0.96 1.68
Fuentecillas creek
Sampling point 1 2 3
Name of the
sample point
Chopera channel Fuentecillas II Fuente
Distance (km) 0 0.67 2.71
Manzanares
La Trofa creek
Sampling point 1
Name of the
sample point
La Trofa
Distance (km) 1.50
Barrancohondo creek
Sampling point 1
Name of the
sample point
Barrancohondo
Distance (km) 0.70
Paris Park
Paris Park
Sampling point 1 2 3
Name of the
sample point
Wharf Lake superior Estuary
covering all seasons. The samples were taken every
2 weeks and after the determination of field para-
meters they were transported to the laboratory. A
detailed description of the sampling points is
4 5 6
rama III Retamar Guadarrama IV Guadarrama V
3.36 4.45 6.00
4
re III La Tore IV
4.61
4
na III Motilona IV
2.0
l
cillas III
4
Lake inferior
E. Sanchez et al. / Ecological Indicators 7 (2007) 315–328 319
Table 2
Temperatures and rainfalls during the period evaluated (September 2001–September 2003)
Season Temperature variationa (8C) Rainfalla (mm)
TMin TMedium TMax Monthly Total
Autumn 4.5 � 1.1 9.6 � 4.2 14.4 � 4.9 65.7 � 8.5 197.0 � 25.5
Winter 1.8 � 0.5 5.1 � 3.2 9.6 � 3.9 66.3 � 9.4 199.0 � 28.2
Spring 7.2 � 3.5 13.4 � 3.3 19.8 � 5.2 56.0 � 7.3 168.0 � 21.9
Summer 14.8 � 4.3 22.8 � 2.8 28.4 � 5.2 15.0 � 6.3 45.0 � 18.9
a Mean values � S.E. of 56 samples.
summarized in Table 1. Sample point 1 of Guadarrama
River corresponded to the inlet to ‘‘Las Rozas’’
municipality.
2.3. Climate conditions
The sampling started at the beginning of September
2001 and finished at the end of the September 2003.
Table 2 shows the average values of temperature and
rainfall for each season during this period.
2.4. Field determinations and laboratory analyses
Field determinations of pH, conductivity (K),
temperature (T 8C) and dissolved oxygen (DO) were
carried out using portable equipments according to
the Standard Methods for the Examination of Water
and Wastewaters (APHA, 1999). The conductivity, pH
and DO were measured using ‘‘Hanna’’, ‘‘Crison’’ and
‘‘Inolab WTW’’ portable equipments, respectively.
Table 3
Values of Cia and Pi for different parameters of water quality
Parameter Pi Ci
100 90 80 70 60
Range of analytical value
pH 1 7 7–8 7–8.5 7–9 6.5–7
Kb 2 <0.75 <1.00 <1.25 <1.50 <2.00
TSS 4 <20 <40 <60 <80 <100
Amm. 3 <0.01 <0.05 <0.10 <0.20 <0.30
NO2� 2 <0.005 <0.01 <0.03 <0.05 <0.10
NO3� 2 <0.5 <2.0 <4.0 <6.0 <8.0
PT 1 <0.2 <1.6 <3.2 <6.4 <9.6
COD 3 <5 <10 <20 <30 <40
BOD5 3 <0.5 <2.0 <3 <4 <5
DO 4 �7.5 >7.0 >6.5 >6.0 >5.0
T 1 21/16 22/15 24/14 26/12 28/10
a All values, except pH, in mg/l.b Conductivity in mS/cm.
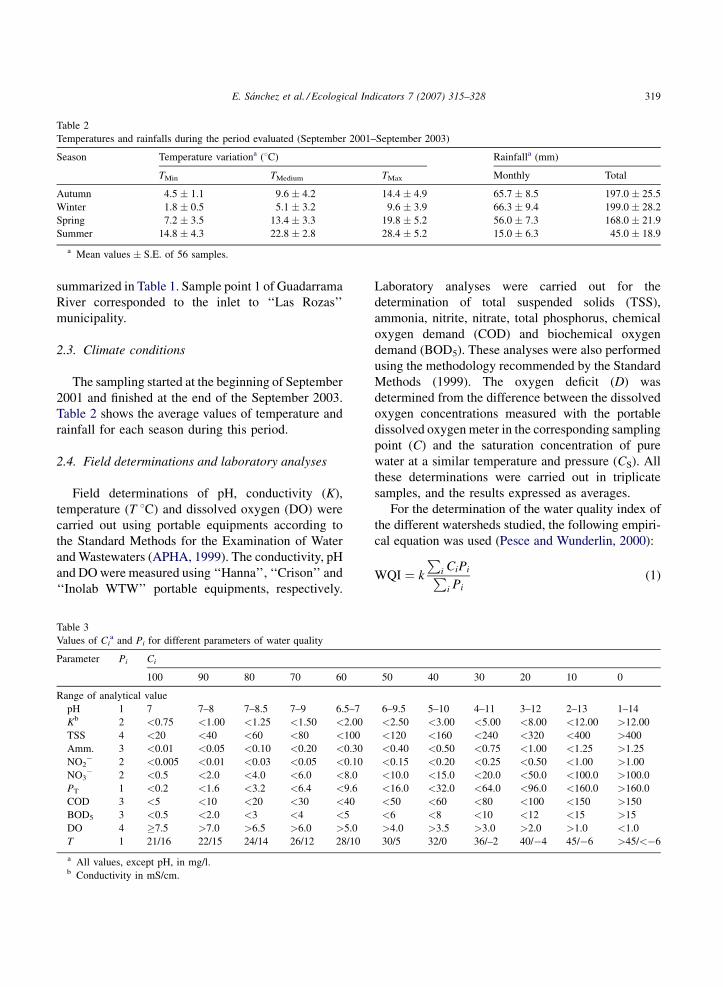
Laboratory analyses were carried out for the
determination of total suspended solids (TSS),
ammonia, nitrite, nitrate, total phosphorus, chemical
oxygen demand (COD) and biochemical oxygen
demand (BOD5). These analyses were also performed
using the methodology recommended by the Standard
Methods (1999). The oxygen deficit (D) was
determined from the difference between the dissolved
oxygen concentrations measured with the portable
dissolved oxygen meter in the corresponding sampling
point (C) and the saturation concentration of pure
water at a similar temperature and pressure (CS). All
these determinations were carried out in triplicate
samples, and the results expressed as averages.
For the determination of the water quality index of
the different watersheds studied, the following empiri-
cal equation was used (Pesce and Wunderlin, 2000):
WQI ¼ k
Pi CiPiP
i Pi(1)
50 40 30 20 10 0
6–9.5 5–10 4–11 3–12 2–13 1–14
<2.50 <3.00 <5.00 <8.00 <12.00 >12.00
<120 <160 <240 <320 <400 >400
<0.40 <0.50 <0.75 <1.00 <1.25 >1.25
<0.15 <0.20 <0.25 <0.50 <1.00 >1.00
<10.0 <15.0 <20.0 <50.0 <100.0 >100.0
<16.0 <32.0 <64.0 <96.0 <160.0 >160.0
<50 <60 <80 <100 <150 >150
<6 <8 <10 <12 <15 >15
>4.0 >3.5 >3.0 >2.0 >1.0 <1.0
30/5 32/0 36/–2 40/�4 45/�6 >45/<�6
E. Sanchez et al. / Ecological Indicators 7 (2007) 315–328320
Table 4
Water characteristics of Guadarrama Rivera
Sampling point
1 2 3 4 5 6
pH 7.07 � 0.07 7.00 � 0.08 7.01 � 0.08 7.0 � 0.03 7.01 � 0.07 6.88 � 0.09
K (mS/cm) 0.40 � 0.01 0.40 � 0.01 0.39 � 0.01 0.39 � 0.01 0.41 � 0.01 0.41 � 0.01
TSS (mg/l) 5.7 � 0.5 35.1 � 13.9 9.5 � 1.3 12.2 � 1.5 13.2 � 0.1 15.2 � 1.8
Amm. (mg/l) 1.9 � 0.2 1.2 � 0.2 1.0 � 0.1 1.1 � 0.1 1.2 � 0.2 1.2 � 0.2
NO2� (mg/l) 0.21 � 0.02 0.17 � 0.01 0.16 � 0.01 0.19 � 0.01 0.17 � 0.01 0.17 � 0.01
NO3� (mg/l) 15.9 � 1.5 15.1 � 1.2 15.3 � 1.3 11.2 � 0.6 15.2 � 1.3 14.8 � 1.2
PT (mg/l) 2.6 � 0.2 2.4 � 0.1 2.1 � 0.1 2.2 � 0.1 1.9 � 0.1 2.2 � 0.1
COD (mg/l) 14.6 � 1.3 16.3 � 1.6 15.7 � 1.8 12.5 � 0.9 16.1 � 1.5 14.3 � 1.5
BOD5 (mg/l) 6.0 � 0.8 5.8 � 0.9 6.1 � 1.0 3.8 � 0.5 4.8 � 0.7 4.7 � 1.0
DO (mg/l) 9.9 � 0.2 6.2 � 0.3 5.6 � 0.2 5.7 � 0.3 5.7 � 0.2 5.8 � 0.2
D (mg/l) 3.9 � 0.1 4.3 � 0.3 4.9 � 0.2 4.7 � 0.2 4.8 � 0.2 4.9 � 0.2
T (8C) 13.0 � 0.6 13.6 � 0.6 13.7 � 0.7 13.8 � 0.7 13.1 � 0.7 13.0 � 0.7
a Mean values � S.E. of 56 samples.
where k is a subjective constant with a maximum
value of 1 for apparently good quality water and
0.25 for apparently highly polluted water, Ci is the
normalized value of the parameter and Pi is the
relative weight assigned to each parameter. In this
work, such as in other studies reported in literature,
the constant k was not considered in order not to
introduce a subjective evaluation (Nives, 1999;
Hernandez-Romero et al., 2004). In relation to
the parameter Pi, the maximum value of 4 was
assigned to parameters of relevant importance for
aquatic life as for example DO and TSS, while the
minimum value (unity) was assigned to parameters
Table 5
Water characteristics of the ‘‘La Torre and ‘‘Motilona’’ creeks (Guadarra
‘‘La Torre’’
Sampling
point 1
Sampling
point 2
Sampling
point 3
Sampling
point 4
pH 7.13 � 0.05 7.31 � 0.04 7.23 � 0.05 7.30 � 0.0
K (mS/cm) 0.69 � 0.02 0.69 � 0.01 0.56 � 0.02 0.58 � 0.0
TSS (mg/l) 37.2 � 4.9 12.1 � 1.2 11.0 � 1.6 19.8 � 4.6
Amm. (mg/l) 6.4 � 0.8 7.5 � 1.2 5.2 � 0.9 4.0 � 0.6
NO2� (mg/l) 0.06 � 0.01 0.11 � 0.01 0.12 � 0.01 0.17 � 0.0
NO3� (mg/l) 2.3 � 0.4 5.3 � 0.9 3.7 � 0.3 11.2 � 1.1
PT (mg/l) 2.5 � 0.3 2.0 � 0.2 3.2 � 0.3 2.2 � 0.3
COD (mg/l) 94.8 � 9.2 60.7 � 9.9 44.9 � 7.6 32.5 � 6.8
BOD5 (mg/l) 45.4 � 5.2 28.5 � 3.8 14.5 � 2.2 11.2 � 1.6
DO (mg/l) 2.6 � 0.2 4.6 � 0.2 2.3 � 0.3 5.3 � 0.2
D (mg/l) 8.0 � 0.2 6.2 � 0.2 5.6 � 0.2 5.1 � 0.1
T (8C) 12.8 � 0.5 12.1 � 0.5 11.8 � 0.6 12.3 � 0.5
a Mean values � S.E. of 56 samples.
with minor relevance such as for example tempera-
ture and pH.
Table 3 shows the values suggested for the
parameters Ci and Pi, used in the calculation of
WQI, which were based on European Standards (EU,
1975). When the values of WQI are in the range of 0–
25, the water must be classified as ‘‘very bad’’; for a
WQI value in the range of 25–50 the water is classified
as ‘‘bad’’; for WQI values in the range of 51–70 the
water classification is ‘‘medium’’; finally, when the
WQI values are within the range of 71–90 and 91–100
the water is classified as ‘‘good’’ and as ‘‘excellent’’,
respectively (Jonnalagadda and Mhere, 2001).
ma watershed)a
‘‘Motilona’’
Sampling
point 1
Sampling
point 2
Sampling
point 3
Sampling
point 4
2 7.22 � 0.04 7.23 � 0.02 7.56 � 0.03 7.39 � 0.08
2 0.63 � 0.01 0.77 � 0.01 0.72 � 0.02 0.73 � 0.01
41.0 � 0.8 102.0 � 1.6 28.9 � 3.7 37.7 � 6.8
4.6 � 0.2 12.2 � 1.6 6.1 � 0.6 10.1 � 1.4
2 0.06 � 0.01 0.04 � 0.01 0.14 � 0.02 0.03 � 0.01
2.8 � 0.2 3.4 � 0.6 8.1 � 1.4 0.9 � 0.2
2.3 � 0.2 3.3 � 0.4 4.4 � 0.4 5.5 � 0.7
159 � 4 359 � 32 163.3 � 18.4 161.1 � 21.5
51.0 � 2.5 109.0 � 11.6 60.7 � 8.7 66.6 � 11.7
2.4 � 0.2 2.7 � 0.2 4.7 � 0.2 4.1 � 0.2
7.8 � 0.2 8.1 � 0.2 5.9 � 0.2 6.9 � 0.2
14.1 � 0.3 12.4 � 0.6 12.6 � 0.6 11.2 � 0.5
E. Sanchez et al. / Ecological Indicators 7 (2007) 315–328 321
Table 6
Water characteristics of the ‘‘La Virgen’’ and ‘‘Fuentecillas’’ creeks (Guadarrama watershed)a
‘‘La Virgen’’ ‘‘Fuentecillas’’
Sampling point 1 Sampling point 2 Sampling point 3 Sampling point 1 Sampling point 2 Sampling point 3
pH 7.09 � 0.07 7.34 � 0.02 7.33 � 0.07 7.19 � 0.06 7.21 � 0.10 7.01 � 0.10
K (mS/cm) 0.69 � 0.02 0.75 � 0.01 0.74 � 0.01 0.84 � 0.02 0.74 � 0.03 0.77 � 0.04
TSS (mg/l) 26.4 � 4.3 11.5 � 1.6 22.9 � 4.3 1 414 � 493 74.8 � 9.2 1919 � 508
Amm. (mg/l) 6.8 � 0.9 5.5 � 0.9 4.3 � 0.3 5.5 � 0.9 2.9 � 0.2 0.6 � 0.1
NO2� (mg/l) 0.08 � 0.02 0.02 � 0.03 0.09 � 0.02 0.09 � 0.01 0.14 � 0.02 0.03 � 0.0
NO3� (mg/l) 1.2 � 0.2 1.0 � 0.1 5.2 � 1.0 3.6 � 0.5 7.0 � 0.3 7.6 � 0.5
PT (mg/l) 7.5 � 0.1 7.6 � 0.2 8.3 � 0.1 8.2 � 0.1 2.5 � 0.1 0.9 � 0.1
COD (mg/l) 75.7 � 5.8 54.6 � 5.4 49.5 � 5.6 593 � 154 78.0 � 10.7 37.2 � 5.7
BOD5 (mg/l) 27.7 � 3.2 14.0 � 1.8 15.6 � 1.8 209 � 39 9.5 � 0.9 3.0 � 0.5
DO (mg/l) 3.7 � 0.2 3.6 � 0.3 4.3 � 0.3 2.7 � 0.2 5.1 � 0.1 7.3 � 0.1
D (mg/l) 6.6 � 0.1 7.1 � 0.2 6.6 � 0.3 7.6 � 0.2 5.9 � 0.1 4.1 � 0.1
T (8C) 14.3 � 0.5 12.3 � 0.4 11.5 � 0.3 14.4 � 0.4 10.7 � 0.3 9.8 � 0.4
a Mean values � S.E. of 56 samples.
3. Results and discussion
3.1. Characteristics of the waters of the different
watersheds
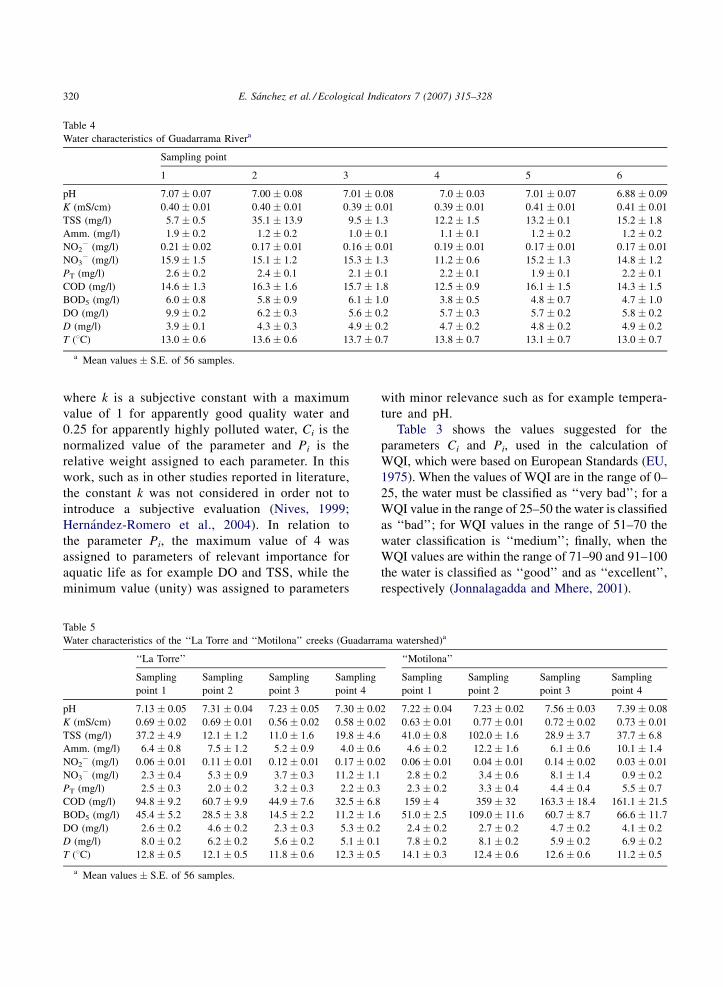
Tables 4–7 show the mean values and standard
errors of the data obtained during the study of the three
watersheds. Table 4 summarizes the results obtained
for the six sampling points tested in the Guadarrama
River. The mean values of pH remained practically
constant between the sampling points 1–5, but at the
sampling point 6 the mean value of pH decreased to
Table 7
Water characteristics of ‘‘Manzanares’’ and ‘‘Paris Park’’ watershedsa
‘‘Manzanares’’ ‘‘Paris Park’’
Sampling point 1b Sampling point 2c Sampling po
pH 6.96 � 0.04 6.60 � 0.05 8.04 � 0.16
K (mS/cm) 0.32 � 0.01 0.34 � 0.02 0.23 � 0.02
TSS (mg/l) 6.6 � 0.1 40.3 � 5.9 7.8 � 0.8
Amm. (mg/l) 1.6 � 0.2 0.8 � 0.1 0.9 � 0.1
NO2� (mg/l) 0.07 � 0.01 0.03 � 0.01 0.01 � 0.01
NO3� (mg/l) 6.9 � 0.5 8.9 � 0.9 0.7 � 0.1
PT (mg/l) 1.4 � 0.1 0.6 � 0.1 0.2 � 0.1
COD (mg/l) 32.7 � 3.5 33.0 � 2.0 52.5 � 6.8
BOD5 (mg/l) 10.3 � 1.0 8.0 � 0.9 13.4 � 1.6
DO (mg/l) 5.2 � 0.3 5.3 � 0.2 6.9 � 0.2
D (mg/l) 5.5 � 0.2 6.4 � 0.3 2.4 � 0.2
T (8C) 12.4 � 0.4 8.6 � 0.3 18.6 � 0.3
a Mean values � S.E. of 56 samples.b ‘‘La Trofa creek’’.c ‘‘Barrancohondo creek’’.
6.88, probably due to the increase in organic acid
concentration caused by the organic matter decom-
position introduced by La Torre and La Virgen creeks.
Similar behaviour was observed by other authors
(Bollinger et al., 1999; Jonnalagadda and Mhere,
2001; Simeonov et al., 2003) in other streams. The
conductivity, indirect measurement of dissolved solids
concentration, remained practically constant between
the sampling points 1–6. On the other hand, the
concentration of TSS augmented significantly from
point 1 to point 2 and decreased in point 3, increasing
again in points 4–6. The increase of suspended solids
int 1 Sampling point 2 Sampling point 3 Sampling point 4
8.17 � 0.15 7.63 � 0.12 7.87 � 0.14
0.26 � 0.01 0.27 � 0.01 0.25 � 0.01
30.8 � 4.5 41.0 � 4.2 28.5 � 4.6
0.9 � 0.1 1.1 � 0.2 0.9 � 0.1
0.01 � 0.01 0.01 � 0.01 0.01 � 0.01
5.2 � 1.8 3.5 � 1.2 3.7 � 1.0
0.4 � 0.1 0.4 � 0.1 0.5 � 0.1
59.1 � 8.7 64.0 � 8.1 45.3 � 8.0
24.8 � 3.8 20.9 � 2.0 16.7 � 2.9
5.5 � 0.3 3.6 � 0.3 5.4 � 0.3
3.9 � 0.3 5.9 � 0.2 4.0 � 0.3
18.6 � 0.4 18.2 � 0.4 18.2 � 0.4
E. Sanchez et al. / Ecological Indicators 7 (2007) 315–328322
may affect the metabolism of photosynthetic organ-
isms and the production of oxygen (Hernandez-
Romero et al., 2004; Jarvie et al., 1998; Jonnalagadda
and Mhere, 2001; Simeonov et al., 2003; Williams
et al., 2000). Ammonia, nitrite and nitrate concentra-
tions decreased from point 1 to point 2 and had slight
variation in points 3–6. Total phosphorus concentra-
tion was slightly higher in point 1 with respect to the
other sampling points. The concentration of COD and
BOD5 increased slightly from points 1–3, decreased
in point 4, increasing again in points 5 and 6.
However, significant differences of the mean values
could not be observed. The dissolved oxygen
concentration decreased from point 1 to point 3 and
remained practically constant in points 3–6. There-
fore, the oxygen deficit increased slightly as far as
point 3 and remained practically constant down-
stream. Similar results have been obtained by other
authors (Bollinger et al., 1999; Bordalo et al., 2001;
Carpenter et al., 1998; Jonnalagadda and Mhere,
2001; Liou et al., 2003; Nives, 1999; Smith, 1989).
Among the six sampling points evaluated, the water
quality appears to be affected after the point of mixing
between Guadarrama River and La Torre creek
(sampling point 3) and in point 5 due to the mixing
with La Virgen creek as may be observed in Fig. 1.
Table 5 shows the profiles of the parameters
monitored in La Torre creek. The values of pH
remained in the range of 7.1–7.3. The values of
conductivity decreased compared to the value
observed at the initial sampling point. The concen-
tration of TSS decreased down-stream between points
1 and 3 but increased at point 4 due to the discharge of
the final effluent of municipal wastewater treatment
plants (MWWTPs) (Fig. 1). The mean value of
ammonia concentration decreased while nitrites and
nitrate concentrations increased throughout the creek,
which may be caused by the nitrification process and
the incorporation of nitrified effluents from the
MWWTPs. The mean concentration of total phos-
phorus suffered a minimum variation in the points
evaluated although a slight tendency to increase was
appreciated from the point 1 to 4. The mean COD and
BOD5 concentrations decreased down-stream, the
minimum being observed at the point of discharge in
the Guadarrama River probably due to the oxidation
of the organic matter causing the reduction of
dissolved oxygen concentration and the increase in
oxygen deficit (D). Similar results were reported by
other authors (Bollinger et al., 1999; Bordalo et al.,
2001; Carpenter et al., 1998; Cox, 2003; Jonnala-
gadda and Mhere, 2001; Liou et al., 2003; Mullholand
et al., 2005; Nives, 1999; Quinn et al., 2005; Smith,
1989).
Table 5 also shows the characteristics of Motilona
creek water, influent of La Torre creek. The mean
value of pH and conductivity increased between
points 1 and 3, but decreased at point 4. The
concentration of TSS increased from point 1 to point
2, decreased at point 3 and increased again at point 4.
Ammonia and phosphorus concentrations increased
down-stream while the concentration of nitrate
increased between points 1 and 3, but decreased at
point 4. Values of COD and BOD5 were high in all
sampling points throughout the creek with mean
values of concentrations in the range of 159–359 mg/l
and from 51 to 109 mg/l, respectively, both equiva-
lents to a low-strength domestic wastewater. In
consequence, the DO concentration was lower than
5 mg/l, while the oxygen deficit values were higher
than 5.5 mg/l, respectively. The low quality of the
Motilona creek water may be caused by the discharge
of MWWTP effluents in points 1–3.
Table 6 summarizes the characteristics of La
Virgen creek. As can be seen the mean values of pH
and conductivity increased throughout the creek.
The concentration of TSS decreased from point 1 to
point 2 but increased again at point 3. The ammonia
concentration decreased, while the concentration of
nitrate and phosphorus increased throughout the
creek. Moreover, the values of COD and BOD5
decreased. These values were lower than those
observed in Motilona creek but may still be considered
high taking into account that the mean COD and
BOD5 values ranged from 49 to 76 mg/l and from 14
to 28 mg/l, respectively. Values of DO and oxygen
deficit were in the range of 3.6–4.4 mg/l and 6.5–
7.1 mg/l, respectively.
Table 6 also shows the characteristics of Fuente-
cillas creek. The mean value of pH slightly increased,
while the conductivity decreased throughout the
creek. The concentration of TSS decreased at point
2 but increased again at point 3. Ammonia concentra-
tion decreased while the nitrate concentration
increased throughout the creek, showing that the
nitrification process took place. Moreover, the COD
E. Sanchez et al. / Ecological Indicators 7 (2007) 315–328 323
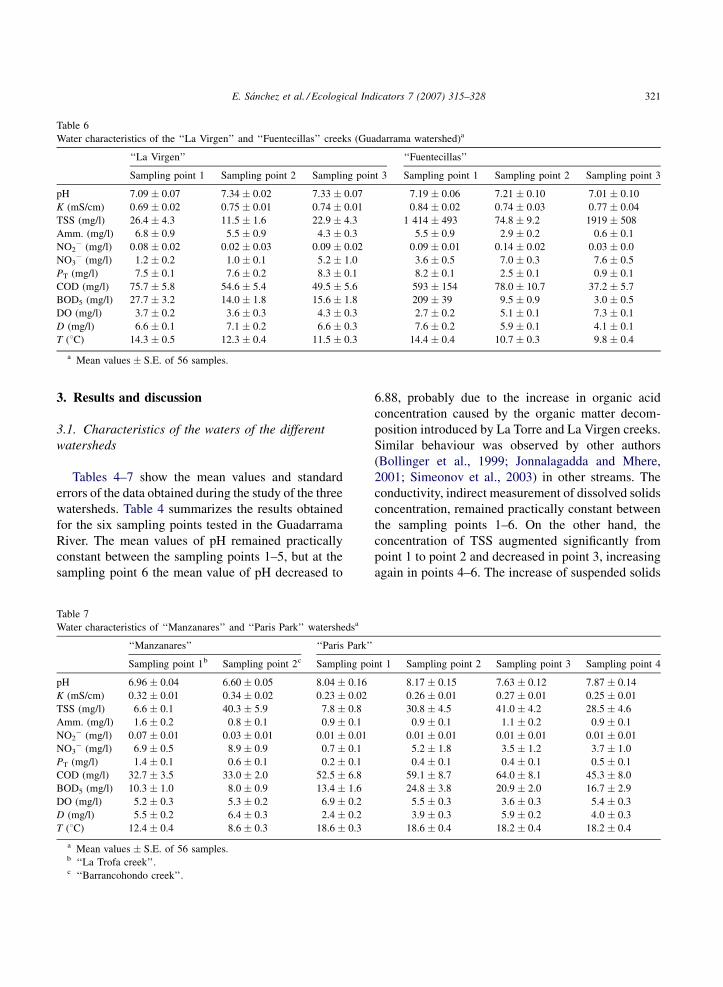
Fig. 2. Variation of the water quality index (WQI) and dissolved
oxygen deficit (D) for the different sampling points assessed in
‘‘Guadarrama’’ River.
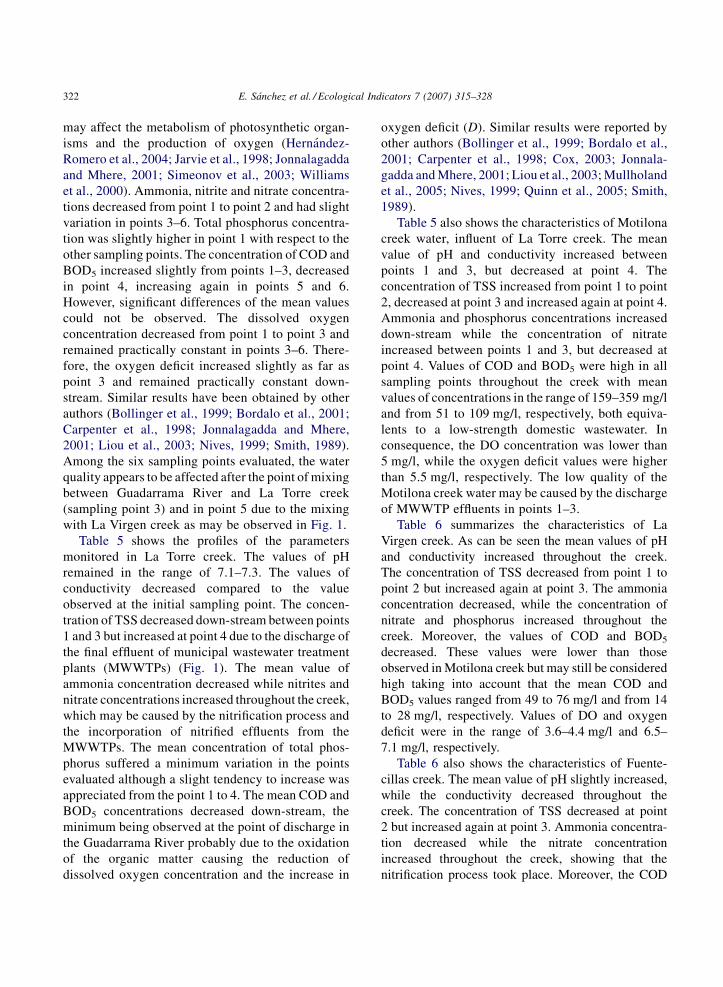
Fig. 3. Variation of the water quality index (WQI) and dissolved
oxygen deficit (D) for the different sampling points assessed in ‘‘La
Torre’’ creek.
and BOD5 values also decreased considerably from
593 to 37 mg/l and from 209 to 3 mg/l, respectively,
showing that a high rate of organic matter oxidation
occurred throughout the creek. This fact was remarked
because an increase of the DO concentration and a
decrease of the oxygen deficit were observed at the
same time.
Table 7 summarizes the characteristics of La Trofa
and Barrancohondo creeks (Manzanares watershed).
The mean value of pH was around 7 for La Trofa and
6.6 for Barrancohondo although significant differ-
ences could not be established. TSS concentration was
lower in La Trofa water than in Barrancohondo.
Nutrients concentration was very similar when
compared samples of La Trofa and Barrancohondo
creeks and Guadarrama River, but they were
significantly lower than those observed in the samples
of Guadarrama watershed. Mean values of COD and
BOD5 were around 30 and 10 mg/l, respectively, for
both points analysed. These values were significantly
lower than those obtained in the Guadarrama
watershed influents but comparable to the values
observed for Guadarrama River.
Finally, Table 7 also shows the characteristics of the
water in Paris Park. The mean values of pH were
higher than 7.60 in all points sampled with a
maximum of 8.17 for point 2, corresponding to
Superior Lake. Therefore, the water pH was appro-
priate for the presence and metabolism of photosyn-
thetic organisms (Bollinger et al., 1999; Bordalo et al.,
2001; Carpenter et al., 1998; Jarvie et al., 1998;
Melloul and Collin, 1998; Nagel, 2001). The mean
values of conductivity were lower than those observed
in waters from other watersheds. The concentration of
TSS was in the range of 7–41 mg/l, with a maximum
for point 2. The concentrations of ammonia were
lower than those observed in the waters from other
watersheds evaluated, while the concentrations of
nitrite were higher. The concentration of nitrate was at
a maximum at point 2. However, the values of this
parameter were lower than those obtained in the other
surface waters. The values of COD were in the range
of 45–65 mg/l, while the BOD5 values were in the
range of 13–25 mg/l, showing a maximum at point 2.
Finally, the values of DO were higher than 3 mg/l, the
minimum being at point 3, while the oxygen deficit
was lower than 6 mg/l at all points, the maximum
value being located at point 3.
3.2. Evaluation of the water quality with the use
of the WQI and D
In order to evaluate the feasibility of the WQI
and D as indicators of the level of pollution of the
water samples analysed, the values of these para-
meters were determined in the different sampling
points. Figs. 2–6 show plots of the variation of values
of WQI and the oxygen deficit (D) for the different
E. Sanchez et al. / Ecological Indicators 7 (2007) 315–328324
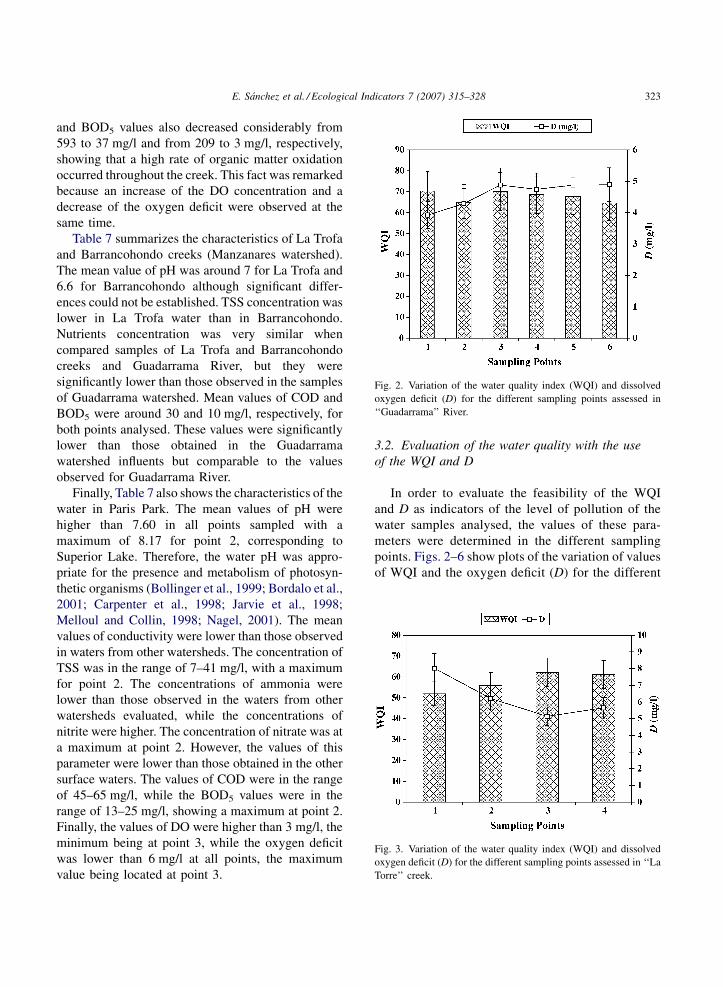
Fig. 4. Variation of the water quality index (WQI) and dissolved
oxygen deficit (D) for the different sampling points assessed in
‘‘Motilona’’ creek.
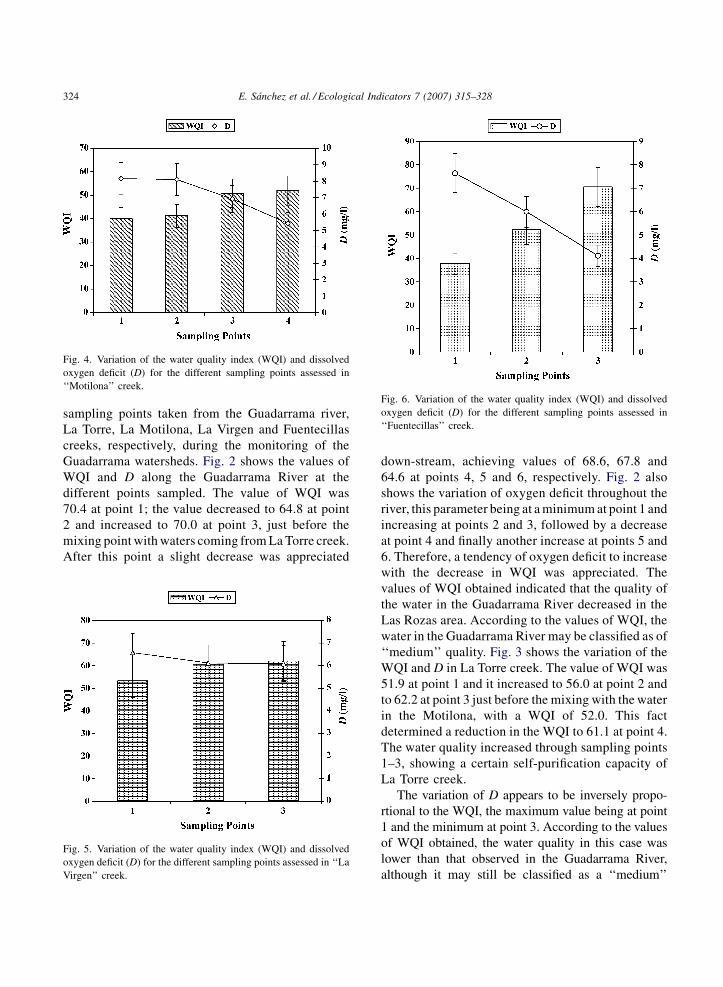
Fig. 6. Variation of the water quality index (WQI) and dissolved
oxygen deficit (D) for the different sampling points assessed in
‘‘Fuentecillas’’ creek.
sampling points taken from the Guadarrama river,La Torre, La Motilona, La Virgen and Fuentecillas
creeks, respectively, during the monitoring of the
Guadarrama watersheds. Fig. 2 shows the values of
WQI and D along the Guadarrama River at the
different points sampled. The value of WQI was
70.4 at point 1; the value decreased to 64.8 at point
2 and increased to 70.0 at point 3, just before the
mixing point with waters coming from La Torre creek.
After this point a slight decrease was appreciated
Fig. 5. Variation of the water quality index (WQI) and dissolved
oxygen deficit (D) for the different sampling points assessed in ‘‘La
Virgen’’ creek.
down-stream, achieving values of 68.6, 67.8 and
64.6 at points 4, 5 and 6, respectively. Fig. 2 also
shows the variation of oxygen deficit throughout the
river, this parameter being at a minimum at point 1 and
increasing at points 2 and 3, followed by a decrease
at point 4 and finally another increase at points 5 and
6. Therefore, a tendency of oxygen deficit to increase
with the decrease in WQI was appreciated. The
values of WQI obtained indicated that the quality of
the water in the Guadarrama River decreased in the
Las Rozas area. According to the values of WQI, the
water in the Guadarrama River may be classified as of
‘‘medium’’ quality. Fig. 3 shows the variation of the
WQI and D in La Torre creek. The value of WQI was
51.9 at point 1 and it increased to 56.0 at point 2 and
to 62.2 at point 3 just before the mixing with the water
in the Motilona, with a WQI of 52.0. This fact
determined a reduction in the WQI to 61.1 at point 4.
The water quality increased through sampling points
1–3, showing a certain self-purification capacity of
La Torre creek.
The variation of D appears to be inversely propo-
rtional to the WQI, the maximum value being at point
1 and the minimum at point 3. According to the values
of WQI obtained, the water quality in this case was
lower than that observed in the Guadarrama River,
although it may still be classified as a ‘‘medium’’
E. Sanchez et al. / Ecological Indicators 7 (2007) 315–328 325
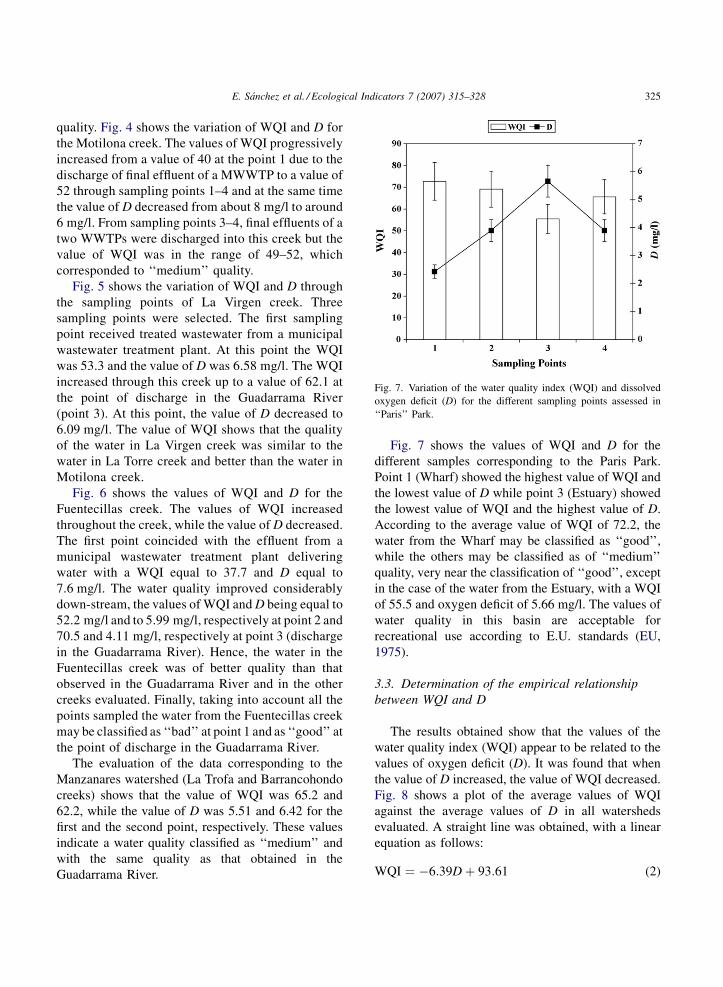
Fig. 7. Variation of the water quality index (WQI) and dissolved
oxygen deficit (D) for the different sampling points assessed in
‘‘Paris’’ Park.
quality. Fig. 4 shows the variation of WQI and D for
the Motilona creek. The values of WQI progressively
increased from a value of 40 at the point 1 due to the
discharge of final effluent of a MWWTP to a value of
52 through sampling points 1–4 and at the same time
the value of D decreased from about 8 mg/l to around
6 mg/l. From sampling points 3–4, final effluents of a
two WWTPs were discharged into this creek but the
value of WQI was in the range of 49–52, which
corresponded to ‘‘medium’’ quality.
Fig. 5 shows the variation of WQI and D through
the sampling points of La Virgen creek. Three
sampling points were selected. The first sampling
point received treated wastewater from a municipal
wastewater treatment plant. At this point the WQI
was 53.3 and the value of D was 6.58 mg/l. The WQI
increased through this creek up to a value of 62.1 at
the point of discharge in the Guadarrama River
(point 3). At this point, the value of D decreased to
6.09 mg/l. The value of WQI shows that the quality
of the water in La Virgen creek was similar to the
water in La Torre creek and better than the water in
Motilona creek.
Fig. 6 shows the values of WQI and D for the
Fuentecillas creek. The values of WQI increased
throughout the creek, while the value of D decreased.
The first point coincided with the effluent from a
municipal wastewater treatment plant delivering
water with a WQI equal to 37.7 and D equal to
7.6 mg/l. The water quality improved considerably
down-stream, the values of WQI and D being equal to
52.2 mg/l and to 5.99 mg/l, respectively at point 2 and
70.5 and 4.11 mg/l, respectively at point 3 (discharge
in the Guadarrama River). Hence, the water in the
Fuentecillas creek was of better quality than that
observed in the Guadarrama River and in the other
creeks evaluated. Finally, taking into account all the
points sampled the water from the Fuentecillas creek
may be classified as ‘‘bad’’ at point 1 and as ‘‘good’’ at
the point of discharge in the Guadarrama River.
The evaluation of the data corresponding to the
Manzanares watershed (La Trofa and Barrancohondo
creeks) shows that the value of WQI was 65.2 and
62.2, while the value of D was 5.51 and 6.42 for the
first and the second point, respectively. These values
indicate a water quality classified as ‘‘medium’’ and
with the same quality as that obtained in the
Guadarrama River.
Fig. 7 shows the values of WQI and D for the
different samples corresponding to the Paris Park.
Point 1 (Wharf) showed the highest value of WQI and
the lowest value of D while point 3 (Estuary) showed
the lowest value of WQI and the highest value of D.
According to the average value of WQI of 72.2, the
water from the Wharf may be classified as ‘‘good’’,
while the others may be classified as of ‘‘medium’’
quality, very near the classification of ‘‘good’’, except
in the case of the water from the Estuary, with a WQI
of 55.5 and oxygen deficit of 5.66 mg/l. The values of
water quality in this basin are acceptable for
recreational use according to E.U. standards (EU,
1975).
3.3. Determination of the empirical relationship
between WQI and D
The results obtained show that the values of the
water quality index (WQI) appear to be related to the
values of oxygen deficit (D). It was found that when
the value of D increased, the value of WQI decreased.
Fig. 8 shows a plot of the average values of WQI
against the average values of D in all watersheds
evaluated. A straight line was obtained, with a linear
equation as follows:
WQI ¼ �6:39Dþ 93:61 (2)

E. Sanchez et al. / Ecological Indicators 7 (2007) 315–328326
Fig. 8. Regression line between the WQI and dissolved oxygen
deficit (D).
The regression coefficient (R2) was found to be
equal to 0.91 with p � 0.1. In order to demonstrate the
feasibility of Eq. (2) to determine the water quality,
based on the data of dissolved oxygen deficit (D),
Table 8
Comparison of the results obtained for WQI by using Eqs. (1) and (2)
Sample WQI (Eq. (1)) WQI (Eq. (2))
P1. Guadarrama 70.4 68.6
P2. Guadarrama 65.0 66.2
P3. Guadarrama 70.0 62.4
P4. Guadarrama 68.6 63.3
P5. Guadarrama 67.8 62.4
P6. Guadarrama 64.6 62.4
P1. La Torre 51.9 42.4
P2. La Torre 56.0 53.9
P3. La Torre 62.2 52.6
P4. La Torre 61.1 57.5
P1. Motilona 40.0 41.5
P2. Motilona 41.2 41.9
P3. Motilona 50.8 49.4
P4. Motilona 52.0 58.9
P1. La Virgen 53.3 51.6
P2. La Virgen 60.7 54.5
P3. La Virgen 62.1 54.7
P1. Fuentecillas 37.7 44.8
P2. Fuentecillas 52.2 55.3
P3. Fuentecillas 70.5 67.3
P1. La Trofa 65.2 58.4
P2. Barrancohondo 62.2 60.8
P1. Wharf 72.7 78.1
P2. Superior 69.1 68.7
P3. Estuary 55.5 57.4
P4. Inferior 65.6 68.7
the classification of the water was obtained by using
Eq. (2) and the data obtained compared to those
obtained in Eq. (1). Table 8 shows the results obtained
in both equations, which coincided in 93% of the
samples analysed with a probability level of 95% on
the basis of the 26 samples studied.
3.4. Influence of the climate conditions on the
WQI
The influence of the climate conditions on the WQI
of the Guadarrama River was evaluated. Fig. 9 shows
the variation of the WQI for the six sampling points of
Guadarrama River as a function of the season. Values
of WQI were in the range of 80–90 during the winter,
and these values were significantly higher than those
observed in other seasons. In the rest of the seasons the
values of WQI ranged from 50 to 70 and significant
differences could not be clearly observed among them.
Three factors may influence the WQI: the precipita-
tion level, the temperature of the surroundings and
solar radiation. The high level of rainfall helped to
Water classification (Eq. (1)) Water classification (Eq. (2))
Good Medium
Medium Medium
Medium Medium
Medium Medium
Medium Medium
Medium Medium
Medium Bad
Medium Medium
Medium Medium
Medium Medium
Bad Bad
Bad Bad
Medium Bad
Medium Medium
Medium Medium
Medium Medium
Medium Medium
Bad Bad
Medium Medium
Medium Medium
Medium Medium
Medium Medium
Good Good
Medium Medium
Medium Medium
Medium Medium

E. Sanchez et al. / Ecological Indicators 7 (2007) 315–328 327
Fig. 9. Variation of the WQI for the six sampling points of Gua-
darrama River as a function of the season.
decrease the WQI because it increased the amount of
water in the river, thus increasing the runoff and
uncontrolled pollution. An increase in temperature
contributes to an increase in the biological activity,
decreasing the dissolved oxygen concentration and
increasing the value of D. The increase in solar
radiation is favourable for photosynthesis, increasing
the concentration of oxygen producing organisms
(microalgae and aquatic plants), which increase the
dissolved oxygen concentration during the day but
cause the reduction of oxygen concentration at night.
Moreover, the increase of the concentration of
photosynthetic organisms produced an additional
oxygen demand during the decomposition of dead
biomass. For all these reasons the water quality
decreased in autumn, spring and summer, when
compared with winter. Other authors observed the
same phenomenon (Bordalo et al., 2001; Couillard
and Lefebvre, 1985; Hernandez-Romero et al., 2004;
Jonnalagadda and Mhere, 2001; Pesce and Wunderlin,
2000; Rudolf et al., 2002).
4. Conclusions
The monitoring of the Las Rozas watersheds
demonstrated that water quality of Guadarrama
watershed was slightly affected in the section of
the river within this town. The characteristics of the
waters corresponding to the Manzanares River and
the Paris Park watersheds indicate an acceptable level
of quality for the assigned uses. The determination of
WQI to the waters monitored demonstrated the
importance of this index in order to classify the
waters studied. It was found that the WQI was around
70 at the entrance to Las Rozas section and was 64.6
at the outlet of the section. This water was classified
as of ‘‘medium’’ quality. The water quality was influ-
enced by the quality of the creek influents of La Torre
and La Virgen with a value of WQI of 61.1 and 62.1,
respectively. The values of WQI for the Manzanares
River show a quality classified as ‘‘medium’’. The
results obtained in the monitoring of the Paris Park
show a water quality between ‘‘medium’’ and good.
The best quality was found in the Wharf and the worst
in the Estuary. A high linear relationship between the
WQI and the oxygen deficit (D) of the samples was
found. The classifications of water based on the two
methods coincided in 93% of the samples studied.
This allowed the determination of WQI based on the
values of the oxygen deficit. The estimation of the
WQI by the calculation of the oxygen deficit is an
advantageous way for a simple, rapid and economical
determination of a water quality. It was found that
water quality was influenced by the climatic condi-
tions, the highest qualities being observed during
the winter.
Acknowledgements
We thank the municipal Government of ‘‘Las
Rozas’’ (Madrid, Spain), the ‘‘Consejerıa de Medio
Ambiente’’ for providing financial support for the
present work through the programme of ‘‘Optimiza-
cion de Recursos’’ and to the ‘‘Laboratorio Municipal
de Salud Publica’’.
References
American Public Health Association (APHA), 1999. Standard
Methods for the Examination of Waters and Wastewaters,
20th ed. APHA, Washington, DC, USA.
Bollinger, J.E., Steinberg, L.J., Harrison, M.J., Crews, J.P., Eng-
lande, A.J., Velasco-Gonzalez, C., White, L.E., George, W.J.,
1999. Comparative analysis of nutrient data in the lower Mis-
sissippi River. Water Res. 33, 2627–2632.
Bordalo, A.A., Nilsumranchi, W., Chalermwat, K., 2001. Water
quality and uses of the Bangpakong River (Eastern Thailand).
Water Res. 35, 3535–3642.
E. Sanchez et al. / Ecological Indicators 7 (2007) 315–328328
Carpenter, S.R., Caraco, N.F., Correll, D.L., Howarth, R.W.,
Sharpley, A.N., Smith, V.H., 1998. Nonpoint pollution of
surface waters with phosphorus and nitrogen. Ecol. Appl. 8,
559–568.
Couillard, D., Lefebvre, Y., 1985. Analysis of water quality indexes.
J. Env. Manage. 21, 161–179.
Cox, B.A., 2003. A review of dissolved oxygen modelling tech-
niques for lowland rivers. Sci. Total Environ. 314–316, 303–
334.
Cude, C., 2001. Oregon water quality index: a tool for evaluating
water quality management effectiveness. J. Am. Water Res.
Assoc. 37, 125–137.
European Union (EU), 1975. Council Directive 75/440/EEC of 16
June 1975 concerning the quality required of surface water
intended for the abstraction of drinking water in the Member
States. Official Journal L 194, 25/07/1975, 0026–0031.
Hernandez-Romero, A.H., Tovilla-Hernandez, C., Malo, E.A.,
Bello-Mendoza, R., 2004. Water quality and presence of pes-
ticides in a tropical coastal wetland in southern Mexico. Marine
Poll. Bull. 48, 1130–1141.
House, M.A., Newsome, D.H., 1989. Water quality indices for the
management of surface water quality. Water Sci. Technol. 21,
1137–1148.
Jarvie, H.P., Whitton, B.A., Neal, C., 1998. Nitrogen and phosphorus
in east coast British rivers: speciation, sources and biological
significance. Sci. Total Environ. 210/211, 79–109.
Jonnalagadda, S.B., Mhere, G., 2001. Water quality of the Odzi river
in the eastern highlands of Zimbabwe. Water Res. 35, 2371–
2376.
Liou, S.M., Lo, S.L., Hu, C.Y., 2003. Application of two-stage fuzzy
set theory to river quality evaluation in Taiwan. Water Res. 37,
1406–1416.
Melloul, A.J., Collin, M., 1998. A proposed index for aquifer water-
quality assessment: the case of Israel’s Sharon region. J. Env.
Manage. 54, 131–142.
Mullholand, P.J., Houser, J.N., Maloney, O.K., 2005. Stream diurnal
dissolved oxygen profiles as indicators of in-stream metabolism
and disturbance effects: fort Benning as a case study. Ecol. Ind. 5,
243–252.
Nagel, J.W., 2001. A water quality index for contact recreation.
Water Sci. Technol. 43, 285–292.
Nives, S.G., 1999. Water quality evaluation by index in Dalamatia.
Water Res. 33, 3423–3440.
Park, S.S., Na, Y., Uchrin, C.G., 2003. An oxygen equivalent model
for water quality dynamics in a macrophyte dominated river.
Ecol. Model. 168, 1–12.
Pesce, S.F., Wunderlin, D.A., 2000. Use of water quality indices to
verify the impact of Cordoba City (Argentina) on Suquia River.
Water Res. 34, 2915–2926.
Quinn, N.T.W., Jacobs, K., Chen, K.W., Stringfellow, W.T., 2005.
Elements of decision support system for real-time management
of dissolved oxygen in the San Joaquin River Deep Water Ship
Cannel. Env. Mod. Software 20, 1495–1504.
Rudolf, A., Ahumada, R., Perez, C., 2002. Dissolved oxygen content
as an index of water quality in San Vicente Bay, Chile (36
degrees, 450S). Env. Monit. Assess. 78, 89–100.
Simeonov, V., Stratis, J.A., Samara, C., Zachariadis, G., Voutsa, D.,
Anthemidis, A., Sofoniou, M., Kouimtzis, Th., 2003. Assess-
ment of the surface water quality in Northern Greece. Water Res.
37, 4119–4124.
Smith, D.G., 1989. A new form of water quality index for rivers and
streams. Water Sci. Technol. 21, 123–127.
Spanou, M., Chen, D., 1999. An object-oriented tool for the control
of point-source pollution in river systems. Env. Mod. Software
15, 35–54.
Swamee, P.K., Tyagi, A., 2000. Describing water quality with
aggregate index. J. Environ. Eng. 126, 451–455.
Wang, H., Hondzo, M., Xu, C., Poole, V., Spacie, A., 2003. Dis-
solved oxygen dynamics of streams draining an urbanized and
an agricultural catchment. Ecol. Model. 160, 145–161.
Williams, R.J., White, C., Harrow, M.L., Neal, C., 2000. Temporal
and small-scale spatial variations of dissolved oxygen in the
Rivers Thames, Pang and Kennet, UK. Sci. Total Environ. 251/
252, 497–510.
Related Documents


