Use of Soil Apparent Electrical Resistivity Contact Sensors for the Extensive Study of Archaeological Sites JOSÉ MARÍA TERRÓN 1 , VICTORINO MAYORAL 2 * , JOSÉ ÁNGEL SALGADO 1 , FRANCISCO ANTONIO GALEA 1 , VÍCTOR HURTADO PÉREZ 3 , CARLOS ODRIOZOLA 3 , PEDRO MATEOS 2 AND ANTONIO PIZZO 2 1 Centro de Investigaciones Científicas y Tecnológicas de Extremadura (CICYTEX) – Instituto de Investigaciones Agrarias Finca “La Orden-Valdesequera”, Gobierno de Extremadura, Autovía A-5 p.k. 372, 06187, Guadajira, Badajoz, Spain 2 Institute of Archaeology – Mérida, CSIC (Spanish National Research Council) – GOBEX (Government of Extremadura), Plaza de España 15, 06800, Mérida, Badajoz, Spain 3 Department of Prehistory and Archaeology, University of Sevilla, C/ María de Padilla S/N, 41004, Sevilla, Spain ABSTRACT Geoelectrical soil mapping using contact sensors with mobile arrays is a widespread method implemented within Pre- cision Agriculture practices since the 1990s, but only in recent times has it begun to be used extensively in the field of archeology. Vehicle towed equipment for the automatic recording of apparent electrical resistivity (ERa) are highly adaptable to land plot structure and are able to cover large areas quickly. In this article we will give an overview of a specific experience of ERa mapping at two archaeological sites with the VERIS 3150 system. This is a contact- sensor that provides georeferenced measurements at two different depths (0–30/0–90 cm). The process of capture, refinement and normalization of raw data is explained. The work also deals with interpolation procedures used for the creation of continuous surfaces. Finally some examples are offered regarding the identification of buried archae- ological and geomorphological features. ERa maps are integrated in a geographical information system (GIS) environ- ment, in order to provide a more reliable basis for interpretation. The advantage of the VERIS 3150 sensor is stressed, in terms of cost over traditional electrical resistivity/conductivity mapping techniques for the acquisition of high-quality archaeological information. Copyright © 2015 John Wiley & Sons, Ltd. Key words: Non-destructive methods; geophysical survey; earth resistance; apparent electrical conductivity; VERIS 3150; archaeological sites; Iberian archaeology Introduction There is a global trend in the development of faster and more accurate equipment for geophysical survey. This is an imperative need in a growing number of disci- plines related with territorial planning and land man- agement. More specifically, Precision Agriculture (PA) has fostered the progressive improvement of mobile systems, mainly for geoelectrical prospection, designed to cover large areas (Allred et al., 2008). Just as in this field of research, in archaeology a key issue is the study of spatial heterogeneity in the distribution of variables related with the soil composition, and its influence in the elements subject of study (crops/presence of ar- chaeological elements). The relationship of both disci- plines is therefore clearly symbiotic, given that in both cases the detection of contrasts within the ground is a primary source of meaningful information. Since the late 1990s archaeologists have begun to be aware of the potential of these developments to maximize the geophysical exploration of great and complex areas. Nevertheless, this technological trans- fer has progressed slowly, and we still have a poor * Correspondence to: V. Mayoral, Institute of Archaeology – Mérida, CSIC (Spanish National Research Council) – GOBEX (Government of Extremadura), Plaza de España 15, 06800, Mérida, Badajoz, Spain. E- mail: [email protected] Copyright © 2015 John Wiley & Sons, Ltd. Received 12 November 2014 Accepted 26 March 2015 Archaeological Prospection Archaeol. Prospect. (2015) Published online in Wiley Online Library (wileyonlinelibrary.com) DOI: 10.1002/arp.1512

Welcome message from author
This document is posted to help you gain knowledge. Please leave a comment to let me know what you think about it! Share it to your friends and learn new things together.
Transcript

* Correspondence to: V. MaCSIC (Spanish National ReExtremadura), Plaza de Espmail: [email protected]
Copyright © 2015 John
Archaeological ProspectionArchaeol. Prospect. (2015)Published online in Wiley Online Library(wileyonlinelibrary.com) DOI: 10.1002/arp.1512
Use of Soil Apparent Electrical ResistivityContact Sensors for the Extensive Study ofArchaeological Sites
JOSÉ MARÍA TERRÓN1, VICTORINO MAYORAL2*, JOSÉ ÁNGEL SALGADO1,FRANCISCO ANTONIO GALEA1, VÍCTOR HURTADO PÉREZ3,CARLOS ODRIOZOLA3, PEDRO MATEOS2 AND ANTONIO PIZZO2
1 Centro de Investigaciones Científicas y Tecnológicas de Extremadura (CICYTEX) – Instituto deInvestigaciones Agrarias Finca “La Orden-Valdesequera”, Gobierno de Extremadura, Autovía A-5 p.k. 372,06187, Guadajira, Badajoz, Spain2 Institute of Archaeology – Mérida, CSIC (Spanish National Research Council) – GOBEX (Government ofExtremadura), Plaza de España 15, 06800, Mérida, Badajoz, Spain3 Department of Prehistory and Archaeology, University of Sevilla, C/ María de Padilla S/N, 41004, Sevilla,Spain
ABSTRACT Geoelectrical soil mapping using contact s
ensors with mobile arrays is a widespread method implemented within Pre-cision Agriculture practices since the 1990s, but only in recent times has it begun to be used extensively in the field ofarcheology. Vehicle towed equipment for the automatic recording of apparent electrical resistivity (ERa) are highlyadaptable to land plot structure and are able to cover large areas quickly. In this article we will give an overview ofa specific experience of ERa mapping at two archaeological sites with the VERIS 3150 system. This is a contact-sensor that provides georeferenced measurements at two different depths (0–30/0–90 cm). The process of capture,refinement and normalization of raw data is explained. The work also deals with interpolation procedures used forthe creation of continuous surfaces. Finally some examples are offered regarding the identification of buried archae-ological and geomorphological features. ERa maps are integrated in a geographical information system (GIS) environ-ment, in order to provide a more reliable basis for interpretation. The advantage of the VERIS 3150 sensor is stressed,in terms of cost over traditional electrical resistivity/conductivity mapping techniques for the acquisition of high-qualityarchaeological information. Copyright © 2015 John Wiley & Sons, Ltd.Key words: Non-destructive methods; geophysical survey; earth resistance; apparent electrical conductivity; VERIS3150; archaeological sites; Iberian archaeology
Introduction
There is a global trend in the development of faster andmore accurate equipment for geophysical survey. Thisis an imperative need in a growing number of disci-plines related with territorial planning and land man-agement. More specifically, Precision Agriculture (PA)has fostered the progressive improvement of mobilesystems, mainly for geoelectrical prospection, designed
yoral, Institute of Archaeology – Mérida,search Council) –GOBEX (Government ofaña 15, 06800, Mérida, Badajoz, Spain. E-
Wiley & Sons, Ltd.
to cover large areas (Allred et al., 2008). Just as in thisfield of research, in archaeology a key issue is the studyof spatial heterogeneity in the distribution of variablesrelated with the soil composition, and its influence inthe elements subject of study (crops/presence of ar-chaeological elements). The relationship of both disci-plines is therefore clearly symbiotic, given that in bothcases the detection of contrasts within the ground is aprimary source of meaningful information.Since the late 1990s archaeologists have begun to be
aware of the potential of these developments tomaximize the geophysical exploration of great andcomplex areas. Nevertheless, this technological trans-fer has progressed slowly, and we still have a poor
Received 12 November 2014Accepted 26 March 2015

J. M. Terrón et al.
knowledge of the performance of some equipmentwith archaeological targets. The VERIS system is oneof these, and the objective of this article is to evaluatethe limitations and potentialities using two study casesof the Iberian Peninsula as our open laboratories.
Precision agriculture (PA) and electrical resistivitymapping
PA has been defined as an agrologic management sys-tem and a strategy for ‘decision making’ based on cropinformation. It involves a set of activities for the re-cording and management of data to apply economicand environmental decisions for harvest production.Therefore, PA concepts have in common the need toknow, manage and evaluate spatial variability of themain factors that have influence in potential produc-tivity of a farming plot and in their environmentaland economic sustainability (Terrón, 2013). PA tech-niques have increased their sophistication in recentyears due to the fast development and spread of spa-tial technologies for land management [low altitude re-mote sensing, geophysical exploration, geographicalinformation system (GIS) integration and analysis,etc.]. More specifically, geoelectrical survey sensorshave become one of the most useful tools to identify,measure and map the soil physical-chemical propertiesinfluencing crop yield patterns (Corwin and Lesch,2005a, 2005b).Two groups of techniques for geoelectrical mapping
have become the main and widespread solutions: gal-vanic resistivimeters and electromagnetic induction(EMI) instruments. EMI devices are the most com-monly used in PA. They calculate apparent electricalconductivity (ECa) through a function among the dif-ferences between a primary magnetic field, sent tothe soil by an emitter coil, and the response of a sec-ondary magnetic field from the soil received by an-other coil situated at a fixed distance from the firstone. Earth resistance instruments directly record ap-parent electrical resistivity (ERa) injecting an electricalcurrent through several electrodes (insertion probesor surface arrays) penetrating into the soil, and otherelectrodes measure the difference in current flow po-tential. Continuous data capture is achieved using dif-ferent arrays of rolling electrodes.Advantages and drawbacks of each system have
been experimentally tested, comparing the perfor-mance and reliability of different commercial solu-tions. See for example the work by Gebbers et al.(2009) for a test field on sandy soils in Germany. Morerecently the work by Serrano et al. (2014) deals with theresponse of shallow and eroded Mediterranean soils in
Copyright © 2015 John Wiley & Sons, Ltd.
Portugal. Obviously the election of a specific methodand equipment depends on the research objectivesand characteristics of terrain. Nevertheless some basiccapabilities and limitations can be pointed out.EMI instruments do not need contact with the soil to
acquire data, are of small size and low weight, and canbe towed with light vehicles. Therefore they are able towork very fast and are highly adaptable. It is possibleto capture data under any moisture conditions, andcan operate even in planted fields during part of thegrowing season. The main disadvantage of EMI sys-tems is that they are very sensitive to electrical interfer-ences, and needs the application of correction factorsfor other variables like air temperature. Another ob-served drawback is that the depth of investigationtends to exceed the near-surface, so it has been argued(Gebbers et al., 2009: 188) that is not an optimal solu-tion for analysing the rooting zone (actually an advan-tage in the case of archaeological survey).Regarding Earth resistance contact sensors, experi-
mental work has stressed their greater suitability forPA. It has been observed that these sensors have agreater temporal stability in the correlation of ERavalues and soil properties under varying conditionsof moisture and vegetal ground cover (Serrano et al.,2014: 10038). On the downside, bigger size and weightrequires pulling them with a tractor, and therefore arelimited by the size and shape of the land plots. Rollingelectrodes require a good contact, something that, aswe will see later, becomes problematic in stonyand/or dry terrains of Mediterranean landscapes.
Archaeological applications of geoelectrical survey
Geoelectrical survey methods have been very widelyapplied in Archaeology for a long time (Atkinson,1946). Until the late 1990s most used systems for resis-tivity profiling with varying configurations of pole-dipole arrays were manually operated. They werepopular due to the low cost, small size and flexibility,but they had a noticeably low performance due to thehigh cost of time and effort required for covering greatareas. Without any doubt this may have been one ofthe reasons why in the last few years, magnetometryand ground penetrating radar have been the mainmethods used in this discipline, while Earth resistancehas become less usual or remained as a complemen-tary source for checking survey results (Carreras,2013: 153). Only recently technology has providedmeans for a fast exploration of larger areas (Piro,2009: 29). This is a response to the need for more effi-cient and extensive methods in the realm of preventivearchaeology.
Archaeol. Prospect. (2015)DOI: 10.1002/arp

Figure 1. The VERIS sensor capturing data in the archaeological siteof Contributa. The water tank is necessary for ph measurements,not used in our campaigns. This figure is available in colour onlineat wileyonlinelibrary.com/journal/arp
Apparent Electrical Resistivity Sensors in Archaeological Sites
In this direction the introduction of EMI in Archaeol-ogy has been more successful due to the aforemen-tioned advantages. First experiences of applicationdate back to the 1960s (Scollar, 1962; Howell, 1968),but we had to wait for the development of systems thatprovide simultaneous measurement of ECa and appar-ent magnetic susceptibility (MSa) in the 1990s forgreater archaeological interest. Nevertheless, examplescovering great areas are scarce until recent times. Thereare exceptions, like the study of flood plain environ-ments in the United States applying EM 31 systemfor depositional mapping oriented to the determina-tion of more suitable areas for the location of ancientsettlements (Conyers et al., 2008).
Figure 2. VERIS sensor function scheme. A, Transmitting electrodes; B, rec
Copyright © 2015 John Wiley & Sons, Ltd.
Specifically research focusing on archaeological tar-gets has been undertaken on several study cases inthe northwest of Belgium. Simpson et al. (2009)analysed the effect of multiple coil configurations inthe detection of buried structures depending on theirdepth, size and shape. They compare the performanceof Dualem 21S and EM 38 and demonstrate the highcomplementarity of ECa an MSa data for a better defi-nition of archaeological features.In subsequent publications the possibilities of com-
bination of simultaneous ECa measurements havebeen explored to discriminate shallow archaeologicalfeatures (Saey et al., 2012), creating EC layers with dif-ferent depth of investigation. This modus operandi hasbeen extrapolated to the investigation at a landscapescale (De Smedt et al., 2013). It was particularly suc-cessful in the identification of World War I (WWI)structures and paleo-topographical and pedologicalvariations. As a whole, these experiences showed theirbest results in the reconstruction of the general frame-work of the soil landscape, rather than in the produc-tion of detailed images of small-scale anomalies (Saeyet al., 2013).With respect to automatic Earth resistance methods
with mobile arrays, its application to Archaeologyhas been noticeably slower. This development goesback to the works by Hesse et al. (1986). Geoscan hasworked on manually towed systems (Walker et al.,2005). More recent versions allow simultaneous resis-tance and magnetic measurement. Nevertheless, theintroduction of sensors designed to explore great ex-tensions of terrain comes from the aforementioned
eiving electrodes (superficial); C, receiving electrodes (deep).
Archaeol. Prospect. (2015)DOI: 10.1002/arp

Table 1. Root mean square error (RMSE) adjustment of raw,filtered and optimized values in a VERIS data set.
Sample Mean RMS Minimumvalue
Number ofobservations
ECd raw 9.4 5.4 0.2 11245ECd filtered 8.6 4.1 0.2 10673ECd minimumRMSE
7.4 2.2 2.8 8119
J. M. Terrón et al.
advances on agronomic and soil sciences. There aretwo main available systems: the Automatic ResistivityProfiling (ARP) developed by Geocarta (France), andthe VERIS (Veris Technologies Inc., Salina, KS, USA).Originally conceived for PA, the ARP system hadtwo immediate ancestors the RATEAU (Dabas et al.,1989), and the MUCEP, a multipole system towed bya tractor able to record resistivity at several depths(Panissod et al., 1997). Two key innovations were theimplementation of real-time storage of values and,with the improvement of global navigation satellitesystem (GNSS) systems, direct geopositioning withcentimetre accuracy of every measurement. Neverthe-less it was only in 2004 when the ARP was used witharchaeological purposes for the first time (Dabas,2009: 120).Regarding the VERIS systems, although it has been
very widely utilized in PA, we have not found any ref-erence in scientific literature of their use in Archeology.Dabas (2009) included data of VERIS 2000 perfor-mance in an experimental test comparing results withother geoelectrical methods and equipment, but we
Figure 3. Boxplot graphs of the spread of electrical conductivity (EC) measrected; 2, corrected; 3, optimized.
Copyright © 2015 John Wiley & Sons, Ltd.
lack practical data from archaeological sites. Our objec-tive was therefore to assess its behaviour and successfor the detection of archaeological features.This opportunity of testing the VERIS system came
up in the framework of a trans-border cooperation pro-ject between Spain and Portugal. This initiative has fo-cused its goals on the revaluation of archaeologicalsites by integrating a wide variety of non-destructivemethods (Mayoral et al., 2013). Inspired by successfulnearby experiences (see Corsi and Vermeulen, 2012),a comprehensive programme of surveys at severallarge and complex archaeological sites was designed.Involvement in the project of research centres fromseveral disciplines like PA opened interesting pros-pects to find points of contact and common concerns.
Materials and methods
Equipment and survey method
First of all, it must be pointed out that, like other gal-vanic contact sensors, the VERIS records directly theERa value of the soil (in Ohm/m). Nevertheless thedata logger of this equipment automatically convertsthese to its inverse measure, ECa, and therefore we willuse ECa in the following sections. This is somethingusually adopted by research tradition in PA studies,where the geoelectrical survey is oriented to find bestconditions for plant development, and therefore higherECa values indicate more suitable areas.
urements in a selected land plot of the Contributa survey. 1, Uncor-
Archaeol. Prospect. (2015)DOI: 10.1002/arp

Table 2. Differences between corrected and optimized values of an experimental data set extracted from the VERIS campaigns atContributa.
Sample Number ofobservations
Mean RMSE Tolerance Goodness-of-fit Arithmetic error.
Corrected 10.05 4.2 2.7 5.47 1.64 2.13Optimized 8.32 3.2 1.6 3.27 1.48 1.34
Figure 4. Differences between raw (A) and normalized (B) distributionof EC values in several land plot over the eastern side of theContributa site.
Apparent Electrical Resistivity Sensors in Archaeological Sites
ECa can be defined as the ability of the soil on itsnatural state to transmit an electric current. The unitsused to describe it are milliSiemens per metre (mS/m), which expresses the conductivity independentlyof the volume of the measured object. It has been dem-onstrated that ECa variations are highly dependent onmoisture and chemical composition of soils, which inturn are closely related to its clay content. Therefore itis a widely used method for mapping the spatial vari-ation of soil properties (Terrón et al., 2011). Moisture ofthe soil must be at least 10% of the ‘wilting point’(when the soil is dried to a level such that the remain-ing water is held with a suction force greater than theabsorption by the roots of plants). Thus, given thesame land plot with two different degrees of humidity,ECa values will be lower in the dryer one, but relativevalues between different areas will remain homoge-neous. Coherence in these contrast, quantitativelyexpressed as the spatial auto-correlation of ECa valuesacross a surface, will be a key aspect in the identifica-tion of meaningful areas from the productive and/orarchaeological perspective. Theoretically, in a Mediter-ranean environment optimal conditions in the field canbe found in two specific periods. The first one is imme-diately after the first rains of the autumn and beforethe preparation of the land for sowing in midOctober/November. The second one corresponds tothe interval between the spring rains (beginning at lateMarch) and the harvest in the second half of May.Another conditioning factor for the ECa measure-
ments is the stoniness and compaction of the terrainsurface. In an archaeological area it can produce pro-nounced spatial variations and extreme values. Thesecan be produced by buried features but also, especiallyin drier conditions, by the bumping of contact sensorsout of the ground, producing anomalous values thatdistort the image of underground targets.The VERIS 3150 captures measurements (Figure 1)
through an array of six electrodes (coulters) in a modi-fied Wenner configuration (Figure 2). Each one consistsof a rotating metallic disc that penetrates the ground.The electrodes located in the inner zone inject a currentinto the soil, while the other four record the voltagedrop. The system can be configured to record data attwo different depth-layers. By using the inner discs itis possible to measure the top 30 cm of soil (ECs), while
Copyright © 2015 John Wiley & Sons, Ltd.
the outer coulters allow measurements to reach 90 cmdeep (ECd). This device is mounted on a tractor, andis connected to a GNSS system (Maxor-GGDT, JavadNavigation Systems, San Jose, CA, USA) that recordsradiofrequency real time kinematics (RTK) corrections.It provides sub-metric accuracy for the spatial positionof each sampling point, with an interval of one second.This is a basic prerequisite for a subsequent mappingand spatial analysis of soil conditions.A crucial aspect of the survey design was the inten-
sity and distribution of sampling points acquired withthe VERIS. In PA an interval of 10 to 20m between
Archaeol. Prospect. (2015)DOI: 10.1002/arp

Figure 5. Location of the study cases cited in the text within the Iberian Peninsula. This figure is available in colour online at wileyonlinelibrary.com/journal/arp
J. M. Terrón et al.
tracks is considered adequate to produce a reliableestimation of ECa values across large areas. These pa-rameters would be useful in a geophysical explorationoriented to geoarchaeological research, but are obvi-ously inappropriate if the aim is to detect smaller, ir-regularly distributed features. Therefore in ourcampaigns we adopted 1–1.5m spacing with a con-stant speed of 5km/h in order to keep a denser andmore regular distribution of points.
Processing the VERIS data set
VERIS data are recorded in an ASCII format file thatincludes ECs and ECd values linked to the coordinatesof each sampling point. These files were imported intoa GIS environment (ESRI ArcGIS 10.0) for error reduc-tion and analysis. In order to provide a basis for the in-terpretation of the survey results, we have followed athree-stage processing of original data. Firstly theyhave been filtered and corrected, then we have pro-duced several interpolation surfaces, and finally thesehave been normalized to produce a coherent global im-age of explored areas.
CorrectionA proper measurement of ECa with the VERIS
equipment requires that the electrodes penetrate welland continuously in the ground. As we have men-tioned before, this is not always possible, due to thecompaction of the soil or the presence of big stonesand voluminous archaeological artefacts (i.e. buildingmaterials). This is an inevitable source of random
Copyright © 2015 John Wiley & Sons, Ltd.
errors that determines the precision of the final result,and makes imperative a first correction of raw datathrough unidimensional statistics.ECa values of each land plot were stored in indepen-
dent datasets. In order to keep a unified method fortheir management, we created a spreadsheet templatefor processing ASCII files for the elimination of outliervalues. Goodness-of-fit was calculated for each series.If it was not between the predefined ranges for a bino-mial distribution probability model, values that exceeda tolerance interval with a confidence level of 95%were eliminated. Beyond this basic correction, we opti-mized the data sets repeating the process until the rootmean square error (RMSE) value was not increased re-gardless of the reduction of the sample size (Table 1).This process of refinement of the original data set obvi-ously implied the creation of gaps for the subsequentprocess of interpolation. Nevertheless it was consid-ered that the selection of data with minimal RMSEvalues was appropriate in order to avoid the inclusionof any observation with a value below zero.
InterpolationCorrected data of each land plot were exported to
separated vector georeferenced files. The followingstep was to produce from this cloud of points a contin-uous surface of the underlying variable throughinterpolation. Considering the complexity of the phe-nomenon to be modelled, we decided to adopt an ex-act interpolation method (Wheatley and Gillings,2002: 193–200).
Archaeol. Prospect. (2015)DOI: 10.1002/arp

Figure 6. Distribution of sampling points at La Pijotilla (A) andContributa Iulia (B).
Figure 7. Interpolated surfaces from VERIS data capture in one singledirection (A) and combined with perpendicular tracks (B).
Apparent Electrical Resistivity Sensors in Archaeological Sites
Although ordinary Kriging was experimentally usedwith a limited set of data, it was not adopted as themain interpolator for several reasons. First, we tookinto account the lack of a normal distribution of values.Second, due to strong contrasts of EC records from dif-ferent land plots, we had the limitation of requiring aseparate variogram for each one. Finally, most of theprocess of interpretation of ECa anomalies has beenbased on visual analysis. After filtering the data, com-parison between Kriging and other exact interpolatorslike IDW (inverse distance weighed) surfaces did notadd meaningfully better results, nor did it show rele-vant differences. Nevertheless this is an open questionfor further research.Therefore the main interpolation method used was
IDW, implemented through ArcGIS 10.0 software andcomparing results with corrected and optimized data(Figure 3 and Table 2). We accepted values by defaultof cell size, but other parameters were modified in or-der to assess the differences between local versus
Copyright © 2015 John Wiley & Sons, Ltd.
global variation. Search radius was set as variable, try-ing with different values of nearest points. It was ob-served that a combination of low power values (lessinfluence of measurements of distant points) and shortsearch radius prevents the appearance of the bull`s eyeeffect keeping a clear definition of ECa anomalies.Comparison of interpolated surfaces at different
depths for the same land plots in different days showeda wide range of errors. The experimentation with inter-polation methods showed us that, while we cannot as-sume that our correction methodology is the one thatproduce less error in the prediction of ECa values, it isvery suitable for the detection of buried features.
NormalizationAs we have seen, data provided by the VERIS are ab-
solute measurements expressed in milliSiemens permetre (mS/m). Correlation of ECa with soil moistureand tilling conditions makes the comparison of theseoriginal values across diverse land plots at differenttimes during the survey campaign very difficult.
Archaeol. Prospect. (2015)DOI: 10.1002/arp

Figure 8. Definition through EC values of the inner enclosure and ground-truth excavation. This figure is available in colour online atwileyonlinelibrary.com/journal/arp
J. M. Terrón et al.
Therefore we need to standardize these, creating aunique scale that allows perceiving relative variationsof ECa in a big area. We used for this purpose the fea-ture scaling method. This method scaled the range offeatures to make them independent of each other, andaims to scale the range between zero and one, valuesthat correspond to theminimum andmaximum respec-tively. The general formula is given as:
Ω ¼ X �mð Þ= M�mð Þ½ �;where Ω is the normalized value, X is the original
Figure 9. Identification of several sections of the city walls at Contributa.
Copyright © 2015 John Wiley & Sons, Ltd.
value to normalize, ‘m’ is the minimal value of the sam-ple, and ‘M’ is the maximal value.As a result of this methodological process two main
raster images were obtained: a layer of ECs and anotherone showing ECd (Figure 4). It was expected that archae-ological features, like walls or building foundations,could be detected as coherent peaks of low conductivity,while negative structures like ditches or channels willshow high conductivity values. Therefore, according tothis premise an interpretation of ECa levels could be ac-complished,mapping archaeological elements of interest.
Archaeol. Prospect. (2015)DOI: 10.1002/arp

Figure 10. Normalized ECa values and the general outline of the street network defined through other remote sensing methods. This figure isavailable in colour online at wileyonlinelibrary.com/journal/arp
Apparent Electrical Resistivity Sensors in Archaeological Sites
Regarding the degree of detail we can achieve, it is clearthat the average interval of sampling points exceeds thedimensions of many archaeological elements, so the pro-duction of high resolution images is impossible. Never-theless, the adaptation of the mobile device to land plotsoffers the possibility of mapping large areas quickly.
The study casesIn order to test the suitability of the VERIS equipmentfor archaeological purposes, we selected two studycases characterized by their large area and internalcomplexity. At the same time they were consideredhighly complementary for the analysis, since the firstone (La Pijotilla) has a great abundance of negative ex-cavated features, while the second one (Contributa) ismainly composed of positive stone masonry structures(Figures 5 and 6).As a whole, visual analysis showed that ECd slice is
less noisy and reflects the underground structures bet-ter than ECs, probably because shallow data are moreaffected by tillage conditions than deeper ones. We willsee how post-processing of the original data, combinedwith other data sources (aerial images, remote sensingand test excavation) provided an enhanced reading ofburied structures.
La pijotilla
The site and the fieldworkThe Pijotilla site is a Calcolithic settlement located
6km south of the Guadiana River. It comprises at least
Copyright © 2015 John Wiley & Sons, Ltd.
three large ditched enclosures, with a maximum pe-rimeter of 1 km and a total surface of ca. 80ha. An ex-tensive Programme of excavation conducted at thesite since 1976 has established a continued sequenceof inhabitation from 3000 to c.2200 BC (Hurtado, 1999;Odriozola et al., 2008). The environment of the archae-ological zone, crossed by the Pijotilla stream, is charac-terized by a soft relief, with clayey soils, mostlydevoted to vineyards, olive trees and cereal crops.The survey campaign was conducted during a single
working day in October 2013. Soil conditions werequite favourable. Moisture level was high after severalprevious rainy days. The shape of land plots allowed avery regular arrangement of data capture, with an av-erage distance of 3 to 4m between survey tracks withnorthwest-southeast (NW-SE) orientation and 1–1.5mbetween sampling points. With this system it was pos-sible to cover 3.8 ha. As an additional measure, asmaller area (2 ha) was covered with transverse trackswith southwest-northeast (SW-NE) orientation, in or-der to obtain an area with the highest possible densityof points.
ResultsThe general image offered by the large, one-direction
survey draws quite clearly at least two big anomaliesthat were interpreted as the limits of two concentric en-closures of the prehistoric settlement. The smaller one(Figure 7A, 1), in the centre of the site and very closeto the Pijotilla stream, has an oval shape with a totalsurface of about 0.8 ha. Alternation of low and high
Archaeol. Prospect. (2015)DOI: 10.1002/arp
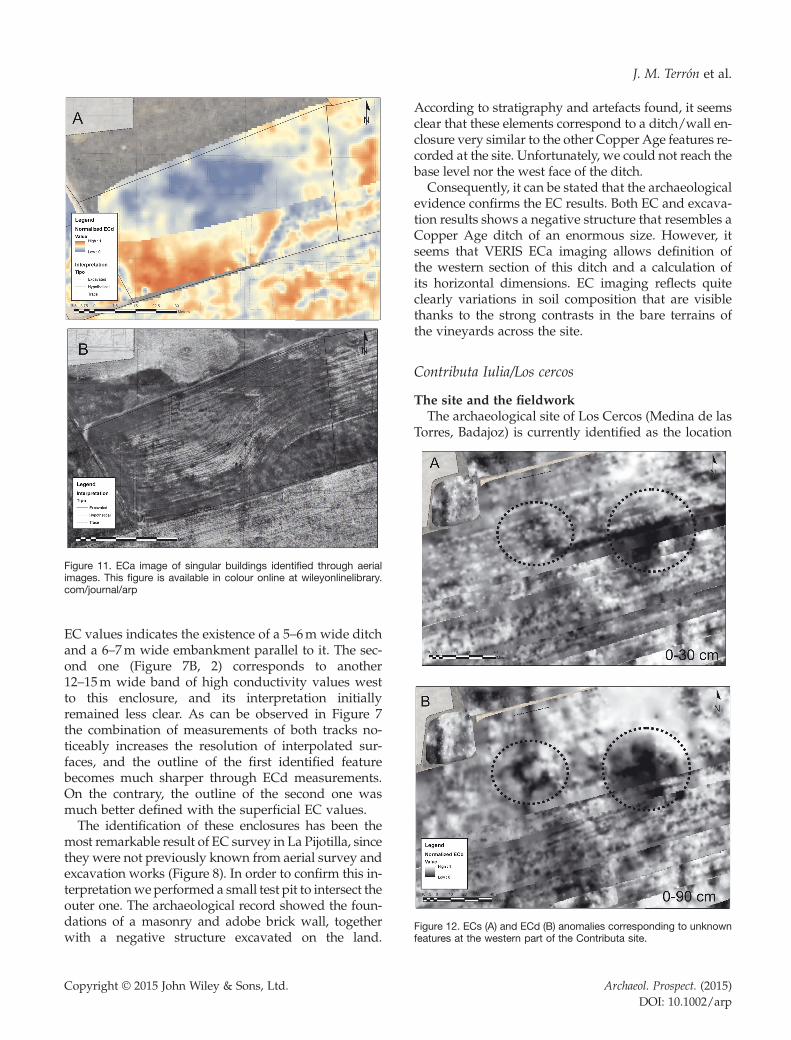
Figure 11. ECa image of singular buildings identified through aerialimages. This figure is available in colour online at wileyonlinelibrary.com/journal/arp
Figure 12. ECs (A) and ECd (B) anomalies corresponding to unknownfeatures at the western part of the Contributa site.
J. M. Terrón et al.
EC values indicates the existence of a 5–6m wide ditchand a 6–7m wide embankment parallel to it. The sec-ond one (Figure 7B, 2) corresponds to another12–15m wide band of high conductivity values westto this enclosure, and its interpretation initiallyremained less clear. As can be observed in Figure 7the combination of measurements of both tracks no-ticeably increases the resolution of interpolated sur-faces, and the outline of the first identified featurebecomes much sharper through ECd measurements.On the contrary, the outline of the second one wasmuch better defined with the superficial EC values.The identification of these enclosures has been the
most remarkable result of EC survey in La Pijotilla, sincethey were not previously known from aerial survey andexcavation works (Figure 8). In order to confirm this in-terpretationweperformed a small test pit to intersect theouter one. The archaeological record showed the foun-dations of a masonry and adobe brick wall, togetherwith a negative structure excavated on the land.
Copyright © 2015 John Wiley & Sons, Ltd.
According to stratigraphy and artefacts found, it seemsclear that these elements correspond to a ditch/wall en-closure very similar to the other Copper Age features re-corded at the site. Unfortunately, we could not reach thebase level nor the west face of the ditch.Consequently, it can be stated that the archaeological
evidence confirms the EC results. Both EC and excava-tion results shows a negative structure that resembles aCopper Age ditch of an enormous size. However, itseems that VERIS ECa imaging allows definition ofthe western section of this ditch and a calculation ofits horizontal dimensions. EC imaging reflects quiteclearly variations in soil composition that are visiblethanks to the strong contrasts in the bare terrains ofthe vineyards across the site.
Contributa Iulia/Los cercos
The site and the fieldworkThe archaeological site of Los Cercos (Medina de las
Torres, Badajoz) is currently identified as the location
Archaeol. Prospect. (2015)DOI: 10.1002/arp

Figure 13. ECd map of the oval anomaly identified as anamphitheatre, combined with the plan of structures found after testexcavation. This figure is available in colour online atwileyonlinelibrary.com/journal/arp
Apparent Electrical Resistivity Sensors in Archaeological Sites
of the Roman town of Contributa Iulia. It has been ex-tensively excavated from 2007 (Mateos et al., 2009)but initially we lacked any information about its realextension, nor a global picture of its urban layout.The topography of the settlement is well defined on ahilltop flanked by two small streams. Slope valuesare low, but bedrock appears at many points, and soilsare in general terms quite shallow. Regarding land use,the site is completely dedicated to dry crop productionwith an intense ploughing activity in the last two cen-turies. Archaeological features are consequently veryclose to the surface, sometimes in the first 10–15 cm.These features consist mostly of stone masonry wallswith a predominance of schist and slates as buildingmaterial.Fieldwork campaigns with the VERIS sensor were
conducted in two different periods (June–July and Oc-tober 2012). In the first case ground conditions were farfrom ideal: soil moisture was very low, although theautumn campaign was carried out after a week of lightrains. Nevertheless conductivity readings offeredmeaningful patterns and a good contrast. The longshape of land plots was optimal for continuous datacapture, allowing coverage of the entire site and its im-mediate surrounding area.
ResultsThe combined use of remote sensing and survey
methods for the interpretation of the Contributa town-scape has been extensively discussed elsewhere(Mateos et al., 2014). Therefore we will focus here onthe results of ECa campaigns. As a whole, these wereespecially successful for the identification of the mainfeatures on the urban structure. Thus, it made possible
Copyright © 2015 John Wiley & Sons, Ltd.
the delimitation of the site through the identification ofthe city walls (Figure 9). With an average width of 2m,it was very poorly preserved, and therefore impossibleto identify through topographic changes. ECa valueshowever draw very clearly its outline, especially inthe eastern and north-western side of the enclosure.The VERIS campaign was also successful in
outlining the structural axes of the street network.Despite the low resolution of conductivity maps, theContributa study case offers several examples of howtraces that are much better defined with other surveymethods (crop marks, thermal images) can be never-theless recognizable in ECa readings. In this sense,the match between EC oscillations and the limits andorientation of several features of the urban layoutcorresponding to singular buildings can be observed(Figures 10 and 11).There are however other large conductivity anoma-
lies that we are unable to explain for the moment(Figure 12). This is the case of a square shape of about24m×27m, defined by a strip of low conductivity ofabout 8m wide. It seems to be superimposed on thecity walls and it coincides with the eastern end of oneof the main street axes, but according to its orientationand size it does not seem to correspond to any kind ofdefensive tower or monumental gate.Outside the walled enclosure, a remarkable result of
ECa mapping was the characterization of a large sub-elliptical anomaly (74m×68m). These traces have pre-viously been detected by aerial photographs, and actu-ally are quite noticeable through topography as anannular mound. Low conductivity values confirmedthat this anomaly was produced by a subsurface struc-ture consisting of two concentric walls with a clay fill-ing between them. EC anomalies showed also severallow conductivity bands perpendicular to the annularones, suggesting the existence of radial features(Figure 13). Ground-truthing by excavation has provedthe validity of this interpretation of the EC data, sug-gesting the existence of an amphitheatre (Mateoset al., 2014).
Concluding remarks
The ECa survey with the VERIS equipment is an effec-tive and low cost method for the extensive geophysicalexploration of large and complex archaeological sites.The adaptation to the shape and size of the cultivatedfields facilitates fast mapping of large areas. Althoughsoil moisture has proved to be a crucial variable affect-ing the detection of buried structures, the VERIS hasbeen able to produce coherent images and meaningful
Archaeol. Prospect. (2015)DOI: 10.1002/arp

J. M. Terrón et al.
results even far from ideal conditions. Strong differ-ences in EC values related to soil compaction and di-verse tillage procedures, make crucial a carefulprocessing of raw data through filtering and normali-zation. The selection of interpolation methods is alsoa critical step if we want to obtain reliable predictionsof EC values.Regarding questions of spatial resolution, as a whole
it can be said that the VERIS allows us to differentiatebetween natural soil changes and areas where the pres-ence of buried features have introduced ‘noise’ that in-terferes with the continuous variation of EC.Nevertheless, it is clear that the VERIS instrumenthas not been designed to detect small structures likehouse foundations. Although it is able to catch theoverall shape of artificial features like a building, it isalmost impossible to interpret these anomalies cor-rectly without the support of other techniques. Onthe contrary, it has proved to be very effective in theidentification of bigger elements like public buildings,ditches or ramparts. Sometimes a coarse picture canenhance our understanding of bigger scale phenom-ena. This is also the case in the differentiation of soilunits and the recognition of geomorphologic features,like buried alluvial channels of rock outcrops. The ca-pacity of the VERIS sensor of covering great areasmakes possible a landscape-scale exploration thatcould become a tool for the identification of buried fea-tures like ancient land divisions, road networks of irri-gation systems.Finally, the adaptation of an equipment originally
designed for PA can offer the archaeologist the oppor-tunity to access a great volume of data produced withthe purpose of agronomic research. This combineduse can contribute to a more integrated study ofvariables affecting agricultural production frommultiple dimensions, including the identification andprotection of the historical heritage that lies withinthe fields.
Acknowledgements
This work is part of the results of the RITECA project(Cross-border Research Network of Extremadura,Centro and Alentejo) funded by the European Re-gional Development Fund (ERDF) through the Opera-tional Programme for Cross-border CooperationSpain-Portugal (POCTEP) 2007-13. The authors wantto give thanks to Francisco Delgado Álvarez, major ofthe municipality of Medina de las Torres for his contin-uous support for the development of fieldwork atContributa. The authors extend their gratitude to thestaff from the Centre of Scientific and Technological
Copyright © 2015 John Wiley & Sons, Ltd.
Research of Extremadura (CICYTEX) (Government ofExtremadura) and especially to the tractor driverswho worked in the survey campaigns. Many thanksalso to Cristina Corsi, Frank Vermeulen and Paul John-son for their comments and suggestions in the devel-opment of this article.
References
Allred B, Daniels JJ, Ehsani MR. 2008. Handbook of Agricul-tural Geophysics. CRC Press: Boca Raton, FL.
Atkinson RJC. 1946. Field Archaeology. Methuen & Co.:London.
Carreras C. 2013. Earth resistance survey: a mature ar-chaeological geophysics method for archaeology. InGood Practice in Archaeological Diagnostics. Non-invasivesurvey of complex archaeological sites, Corsi C, SlapsakB, Vermeulen F (eds). Springer International Publish-ing: Cham; 153–164.
Conyers LB, Ernenwein EG, Grealy M, Lowe KM. 2008.Electromagnetic conductivity mapping for site predic-tion in meandering river floodplains. ArchaeologicalProspection 15(2): 81–91.
Corsi C, Vermeulen F (eds). 2012. Ammaia I: The Survey. ARomano-Lusitanian Townscape Revealed. Academia Press:Ghent.
Corwin DL, Lesch SM. 2005a. Characterizing soil spatialvariability with apparent soil electrical conductivity.Survey protocols. Computers and Electronics in Agricul-ture 46: 103–133.
Corwin DL, Lesch SM. 2005b. Apparent soil electricalconductivity measurements in agriculture. Computersand Electronics in Agriculture 46: 11–43.
Dabas M, Ducomet G, Hesse A, Jolivet A, Tabbagh A.1989. Intérêt de la cartographie de la résistivitéélectrique pour la connaissance du sol à grande échelle.Science du sol 27(1): 65–68.
Dabas M. 2009. Theory and practice of the new fast elec-trical imaging system ARP©. In Seeing the Unseen, Geo-physics and Landscape Archaeology, Campana S, Piro S(eds). CRC Press, Taylor and Francis Group: London;105–126.
De Smedt P, Saey T, Lehouck A, et al. 2013. Exploring thepotential of multi-receiver EMI survey forgeoarchaeological prospection: a 90 ha dataset.Geoderma 199(0): 30–36.
Gebbers RE, Lück M, Dabas M, Domsch H. 2009. Com-parison of instruments for geoelectrical soil mappingat the field scale. Near Surface Geophysics 7: 179–190.
Hesse A, Jolivet A, Tabbagh A. 1986. New prospectsin shallow depth electrical surveying for archaeolog-ical and pedological applications. Geophysics 51:585–594.
Howell M. 1968. The soil conductivity anomaly detector(SCM) in archaeological prospection. ProspezioneArcheologiche Roma 3: 101–103.
Hurtado V. 1999. Los Inicios de La Complejizacion Socialy el Campaniforme En Extremadura. SPAL 8: 47–83.
Mateos P, Pizzo A, Delgado P. 2009. ¿Contributa IuliaUgultunia? intervenciones arqueológicas en el
Archaeol. Prospect. (2015)DOI: 10.1002/arp

Apparent Electrical Resistivity Sensors in Archaeological Sites
yacimiento arqueológico de ‘los cercos’, en Medina delas Torres, (Badajoz). Romula 8: 7–31.
Mateos P, Pizzo A, Mayoral V. 2014. Integrating surveydata for the study of the Roman townscape ofContributa Iulia Ugultunia (Medina de las Torres, Ba-dajoz). Journal of Roman Archaeology 27: 109–132.
Mayoral V, Terrón JM, Mateos P, Pizzo A, Mota M. 2013.Mirando más allá del suelo: La arqueología de mínimainvasión como herramienta para la revalorización delpatrimonio histórico. Riteca 2: 15–20.
Odriozola C, Hurtado V, Dias MI, Prudêncio MI. 2008.Datación por Técnicas Luminiscentes de La Tumba 3y el conjunto campaniforme de La Pijotilla (Badajoz,España). In VIII Congreso Ibérico de Arqueometría.ACTAS, Instituto de Historia (CSIC) (eds). MuseoArqueológico Nacional y SAPaC: Madrid.
Panissod C, Dabas M, Jolivet A, Tabbagh A. 1997. A novelmobile multipole system (MUCEP) for shallow (0–3m)geoelectrical investigation: the ‘Vol-de-canards’ array.Geophysical Prospecting 45(6): 983–1002.
Piro S. 2009. Introduction to geophysics for archaeology.In Seeing the Unseen, Geophysics and Landscape Archaeol-ogy. Campana S, Piro S (eds). CRC Press, Taylor andFrancis Group: London; 27–63.
Saey T, De Smedt P, Meerschman E, et al. 2012. Electricalconductivity depth modelling with a multireceiveremi sensor for prospecting archaeological features. Ar-chaeological Prospection 12: 21–30.
Saey T, Van Meirvenne M, De Smedt P, et al. 2013. Inte-grating multi-receiver electromagnetic induction mea-surements into the interpretation of the soil landscape
Copyright © 2015 John Wiley & Sons, Ltd.
around the school of gladiators at Carnuntum.European Journal of Soil Science 64: 716–727.
Simpson D, Van Meirvenne M, Saey T, et al. 2009.Evaluating the multiple coil configurations of theEM38DD and DUALEM-21S sensors to detect archaeo-logical anomalies. Archaeological Prospection 16(2):91–102.
Scollar I. 1962. Electromagnetic prospecting methods inarchaeology. Archaeometry 5: 147–153.
Serrano J, Shahidian S, Marques da Silva J. 2014. Spatialand temporal patterns of apparent electrical conductiv-ity: DUALEM vs. Veris sensors for monitoring soilproperties. Sensors 14: 10024–10041.
Terrón JM. 2013. Delimitación de zonas de manejo enAgricultura de Precisión a partir de medidas deconductividad eléctrica aparente del suelo mediante eluso de sensores móviles de contacto. PhD Thesis,Universidad de Córdoba, Servicio de Publicaciones,Universidad de Córdoba. Avalaible at http://helvia.uco.es/xmlui/handle/10396/10181
Terrón JM, Marques da Silva J, Moral FJ, García Ferrer A.2011. Soil apparent electrical conductivity and geo-graphically weighted regression for mapping soil. Pre-cision Agriculture 12: 750–761.
Walker R, Gaffney C, Gater J, Wood E. 2005. Fluxgategradiometry and square array resistance survey atDrumlanrig, Dumfries and Galloway, Scotland. Archae-ological Prospection 12(2): 131–136.
Wheatley D, Gillings M. 2002. Spatial Technology and Ar-chaeology. The Archaeological Application of GIS. Taylor& Francis: London.
Archaeol. Prospect. (2015)DOI: 10.1002/arp
Related Documents