This is an author produced version of a paper published in Plant and Soil. This paper has been peer-reviewed and is proof-corrected, but does not include the journal pagination. Citation for the published paper: Stenberg, Bo; Jonsson, Anders; Börjesson, Thomas. (2005) Use of near infrared reflectance spectroscopy to predict nitrogen uptake by winter wheat within fields with high variability in organic matter. Plant and Soil. Volume: 269, pp 251-258. http://dx.doi.org/10.1007/s11104-004-0556-1. Access to the published version may require journal subscription. Published with permission from: Springer. Standard set statement from the publisher: "An author may self-archive an author-created version of his/her article on his/her own website and or in his/her institutional repository. He/she may also deposit this version on his/her funder’s or funder’s designated repository at the funder’s request or as a result of a legal obligation, provided it is not made publicly available until 12 months after official publication. He/ she may not use the publisher's PDF version, which is posted on www.springerlink.com, for the purpose of self-archiving or deposit. Furthermore, the author may only post his/her version provided acknowledgement is given to the original source of publication and a link is inserted to the published article on Springer's website. The link must be accompanied by the following text: "The final publication is available at www.springerlink.com".Prior versions of the article published on non-commercial pre- print servers like arXiv.org can remain on these servers and/or can be updated with the author’s accepted version. The final published version (in PDF or HTML/XML format) cannot be used for this purpose. Acknowledgement needs to be given to the final publication and a link should be inserted to the published article on Springer’s website, accompanied by the text “The final publication is available at www.springerlink.com”. Epsilon Open Archive http://epsilon.slu.se

Welcome message from author
This document is posted to help you gain knowledge. Please leave a comment to let me know what you think about it! Share it to your friends and learn new things together.
Transcript

This is an author produced version of a paper published in
Plant and Soil.
This paper has been peer-reviewed and is proof-corrected, but does not
include the journal pagination.
Citation for the published paper:
Stenberg, Bo; Jonsson, Anders; Börjesson, Thomas. (2005) Use of near
infrared reflectance spectroscopy to predict nitrogen uptake by winter wheat
within fields with high variability in organic matter. Plant and Soil.
Volume: 269, pp 251-258.
http://dx.doi.org/10.1007/s11104-004-0556-1.
Access to the published version may require journal subscription.
Published with permission from: Springer.
Standard set statement from the publisher:
"An author may self-archive an author-created version of his/her article on his/her own
website and or in his/her institutional repository. He/she may also deposit this version on
his/her funder’s or funder’s designated repository at the funder’s request or as a result of a
legal obligation, provided it is not made publicly available until 12 months after official
publication. He/ she may not use the publisher's PDF version, which is posted on
www.springerlink.com, for the purpose of self-archiving or deposit. Furthermore, the
author may only post his/her version provided acknowledgement is given to the original
source of publication and a link is inserted to the published article on Springer's website.
The link must be accompanied by the following text: "The final publication is available at
www.springerlink.com".Prior versions of the article published on non-commercial pre-
print servers like arXiv.org can remain on these servers and/or can be updated with the
author’s accepted version. The final published version (in PDF or HTML/XML format)
cannot be used for this purpose. Acknowledgement needs to be given to the final
publication and a link should be inserted to the published article on Springer’s website,
accompanied by the text “The final publication is available at www.springerlink.com”.
Epsilon Open Archive http://epsilon.slu.se
1
Use of near infrared reflectance spectroscopy to predict nitrogen uptake by winter wheat within fields of high variability in organic matter Bo Stenberg1, Anders Jonsson1,2 & Thomas Börjesson2 1 Division of Precision Agriculture, Department of Soil Science, SLU, PO Box 234, SE-532 23 Skara, Sweden, [email protected] 2 Swedish Farmers Supply and Crop Marketing Association, Östra hamnen, SE-531 87 Lidköping, Sweden
Keywords NIR, Nitrogen mineralization, Organic carbon, PLS, Precision agriculture, Within-field variation
Abstract In this study, the ability to predict N-uptake in winter wheat crops using NIR-spectroscopy on soil samples was evaluated. Soil samples were taken in unfertilized plots in one winter wheat field during three years (1997-1999) and in another winter wheat field nearby in one year (2000). Soil samples were analyzed for organic C content and their NIR-spectra. N-uptake was measured as total N-content in aboveground plant materials at harvest. Models calibrated to predict N-uptake were internally cross validated and validated across years and across fields. Cross-validated calibrations predicted N-uptake with an average error of 12.1 to 15.4 kg N ha-1. The standard deviation divided by this error (RPD) ranged between 1.9 and 2.5. In comparison, the corresponding calibrations based on organic C alone had an error from 11.7 to 28.2 kg N ha-1 and RPDs from 1.3 to 2.5. In three of four annual calibrations within a field, the NIR-based calibrations worked better than the organic C based calibrations. The prediction of N-uptake across years, but within a field, worked slightly better with an organic C based calibration than with a NIR based one, RPD = 1.9 and 1.7 respectively. Across fields, the corresponding difference was large in favour of the NIR-calibration, RPD = 2.5 for the NIR-calibration and 1.5 for the organic C calibration. It was concluded that NIR-spectroscopy integrates information about organic C with other relevant soil components and therefore has a good potential to predict complex functions of soils such as N-mineralization. A relatively good agreement of spectral relationships to parameters related to the N-mineralization of datasets across the world suggests that more general models can be calibrated.
Introduction The general goal of precision agriculture is to apply inputs where they best fit their purpose. Adjustments of inputs are to be made as precisely as possible, with a high spatial resolution, according to what is required by the soil and crop potentials. The yield variations within a field can be several tons of cereals per ha (Thylén, 1997) and nutrient requirements vary correspondingly. Considerable amounts of soil N have the potential to be mineralized during the growing season (Lindén et al., 1992). Large variations between fields, but also within fields, have been encountered (Börjesson et al., 1999). Thus, site-specific inputs of nutrients can save resources and the impact on the environment can be minimized without lowering total yields or putting product quality at risk (Robert, 1999). Regulation of field inputs “on the go” has been made possible by the GPS (Geographical Positioning System) technology, which gives the farmer his exact real-time positioning in the
2
field. However, the real challenge is to provide a reliable basis for decision-making. The concept of precision agriculture has highlighted the need for simple and reliable tools to predict the within-field differences in fertilizer requirement (Dawson, 1997; McBratney and Pringle, 1997). Today, crop status sensors are used commercially for real-time adjustment of late nitrogen applications. For example, in Sweden during 2002, the Hydro N-Sensor was used in more than 20.000 hectares of mainly winter wheat to apply supplementary nitrogen according to estimated within-field differences in demand (Knud Nissen, pers. comm.; www.hydroprecise.com). This sensor estimates the nitrogen and biomass in the crop through light reflectance spectroscopy. These adjustments depend entirely on the nitrogen taken up by the crop before the intended application. Any mineralization after the adjusted application cannot be taken into account. To support high spatial resolution, extensive sampling and analyses are required for many soil characteristics. Therefore rational soil analysis strategies are needed (Rossel and McBratney, 1998). In general, the NIR (Near Infrared Reflectance) technology has many of the features required for rapid and labor-saving soil analysis (Janik et al., 1998). Sample preparation can be kept to a minimum. For laboratory measurements, samples are only dried, ground and sieved before analysis. In addition, there are instruments adapted for use in the field and suitable for remote sensing. Scanning of a spectrum can be performed in a tenth of a second. Thus, there is a potential for on-line measurements while passing over the field. The near infrared is the region between 700 and 2500 nm in the electromagnetic spectrum. In this region, signals reflected from soils consist mainly of vibrational bands and overtones from the mid infrared region, originating from bonds in organic molecules and water (C-O, C=O, N-H and O-H). Because of highly overlapping absorption bands from these overtones and combination bands, direct quantitative estimates from NIR-spectra are impossible (Wetzel, 1983). A known reference data set is always needed for calibration of prediction models. For this, multivariate statistics such as multiple linear regression (MLR) and partial least squares (PLS) regression are commonly used (Martens and Naes, 1989). A number of studies have indicated the ability of NIR to relate to N-mineralization potential of soils as estimated by Walkely-Black digestion (Mayer, 1989), long term soil incubations (Chang et al., 2001; Fystro, 2002), pot trials (Wagner et al., 2001) and a range of biological and chemical tests (Russell et al., 2002). However, there are few examples of good relationships demonstrated between such laboratory tests and the situation in the field. In recent years, attempts have been made to relate NIR-spectra to N-uptake in crops within single fields, with promising results (Börjesson et al., 1999; Dunn et al., 2000). NIR-spectra have been related to several soil properties that can be expected to have influence on plant available N, such as amount and quality of organic matter (Chang and Laird, 2002; Fystro, 2002; Palmborg and Nordgren, 1993), soil texture (Chang et al., 2001; Stenberg et al., 1995) and nutrient status (Malley et al., 1999). Börjesson et al. (1999) compared the performance of NIR-models with potential net N-mineralization, organic matter content and initial mineral N present in the soil profile at the beginning of the cropping season in order to predict N-uptake by the crop, and found NIR and initial mineral N to have the best predictive ability and to be equally good. Initial mineral N in combination with NIR did not improve the predictive ability. However, until now the validity of the method over years and between fields has not been tested. In the present study, winter wheat was grown without fertilizers in 15-20 small plots each year distributed in one field between 1997 and 1999 and in another field in 2000. The objective was to test NIR-calibrations for N-uptake within and across these years and fields.

3
Materials and Methods
Soil and plant samples Samples were taken during 1997-1999 from Field I and in 2000 from Field II at the time of sowing. The distance between these fields was about 500 m. Winter wheat was grown all years on both fields. A cereal crop always preceded the wheat. The size of Field I was about 10 ha and Field II was about 15 ha. The fields are located in Southwestern Sweden, about 100 km northeast of Gothenburg. In both fields, cereals dominated the crop sequence. Pig slurry was occasionally applied, but not within a two year period before, or during the experiments. The soil in both fields was classified as a silt loam. A previous study from Field I showed that the clay content in the fields was 110-390 g kg-1 and the pH 5.4-6.5. Data for total C is given for each year in Table 1. All four years were rather wet compared with an average for the previous 30 years. This was particularly the case in 1998 (data not shown). The pressure of weeds and pests were rather low during the experimental period. Infection pressure from pests is generally very modest in cereals in Sweden. Herbicides and pesticides were used according to what was required and to what was indicated by regional pest prognoses. Noticeable pest attacks were never recorded. Table 1. Total C content in soil samples from the unfertilized experimental plots Year/Field no. Min
(g kg-1) Max
(g kg-1) Mean* (g kg-1)
Median (g kg-1)
St. dev. (g kg-1)
Skewness
1997 / I (n=15) 18 130 51a 28 37 0.8 1998 / I (n=20) 15 113 40ab 30 28 1.3 1999 / I (n=20) 16 100 39ab 29 29 1.1 1997-99 / I (n=55) 15 130 43a# 27 31 1.2 2000 / II (n=20) 13 63 25b 21 14 1.4 *Values with the same letter are not significantly different (unbalanced ANOVA, p<0.5) #1997-99 / I was only tested with 2000 / II Ten randomly selected soil cores (1.5 cm in diameter) down to 20 cm were taken from 25 m2 unfertilized plots and mixed. Fifteen plots were sampled in 1997 and 20 plots in 1998-2000. The soil was dried at 35±2 °C and crushed to pass a 2 mm screen before analysis. The plots were distributed over the fields to cover maximum variation according to elevation and the farmers’ experiences of soil and crop variations in the fields. The plots where moved each year. The dried and crushed samples were submitted to NIR-analysis and total carbon analysis. NIR-spectra were analyzed on approximately 10 g dry soil with an InfraAlyzer 500 (Bran & Lübbe, Norderstedt, Germany) scanning instrument. The log of inverse reflectance (log R-1; absorbance) of every fourth nanometer between 1100 and 2500 nm was recorded, giving 351 data points per spectrum. Ten spectra per sample were analysed and averaged. A LECO FP-428 (LECO corp. St. Joseph, MI, USA) combustion analyser was used for total C determination. Soils in this area do not contain carbonate and organic C was therefore assumed to equal total C. At harvest in August, all aboveground plant parts from four randomly selected 0.25 m2 quadrants were sampled from each plot. The plant material was dried at 60°C forced air over night and threshed with a stationary thresher. The straw was chopped in a Pühler Abfall-Schnitzler (Karl Pühler jr. Bergneustadt, Germany). Chopped straw and grain were milled in a Falling Number 3100 Laboratory Mill (Perten Instruments, Huddinge, Sweden). Total N was analyzed in the LECO FP-428 combustion analyzer.

4
Data analysis Differences between years and fields in organic C and N-uptake were tested with unbalanced ANOVA in the Statistica® version 5.1 (Statsoft Inc.). All other data treatments, calibration work and statistics were performed with Unscrambler® version 7.8 (Camo A/S, Oslo, Norway). The logarithm of organic C content was calibrated to N-uptake by linear regression. NIR-spectra were calibrated to N-uptake by means of PLS (Partial Least Squares, see (Martens and Naes, 1989; Martens and Martens, 1986; Wold et al., 1984). PLS is a multivariate linear calibration technique. A NIR PLS-model is of the form: N-uptake = β0 + β1λ1 + β2λ2 + β3λ3 + β4λ4 … βnλn eq.1 Where β0 is the intercept, β1,2,3,4…n is the regression coefficient and λ1,2,3,4…n is the recorded and transformed absorbance for the individual wavelengths. Prior to analysis, each NIR-spectrum was transformed according to Barnes et al. (1993), by the standard normal variate to have a standard deviation of 1 of each spectrum to reduce light scatter effects caused by particle size effects; and by De-Trend to remove linear and quadratic curvature of each spectrum. NIR-spectra were also smoothed by fitting each recorded wavelength to a second order polynomial using the three adjacent data points on each side (Savitzky and Golay 1964). The number of PLS components to be used was generally chosen to be at the minimum root mean squared error of cross validation (RMSECV), except when the difference to the previous component was smaller than the total variance through the number of independent variables (wavelengths). Calibrations based on NIR-data (PLS) and on organic C content (linear regression) were both validated by full cross validation. In cross validation, all samples in the calibration set were also used for validation by omitting one at a time. In cases where calibrations were tested across years and fields, the particular year or field as a whole was kept out of the calibration and used for validation only. Table 2. N-uptake in aboveground plant parts at harvest, 1997-2000 Year/Field no. Min
(kg N ha-1) Max
(kg N ha-1) Mean*
(kg N ha-1) Median
(kg N ha-1) St. dev.
(kg N ha-1) Skewness
1997 / I 24.4 131 63.6a 51.8 35.7 0.7 1998 / I 16.1 117 61.7a 62.8 28.8 0.4 1999 / I 20.5 124 67.1a 68.1 31.7 0.2 1997-99 / I 16.1 131 64.1a# 61.5 31.3 0.5 2000 / II 34.0 104 59.0a 52.6 22.8 0.8 * Values with the same letter are not significantly different (unbalanced ANOVA, p<0.5) #1997-99 / I was only tested with 2000 / II To evaluate the performance of the calibrations, r2-values, RMSECV, root mean squared error of prediction (RMSEP), mean error of prediction (bias), and ratio of standard deviation of calibration samples to RMSEP or RMSECV (RPD) were calculated on the relationship between measured and predicted N-uptake in validation samples. The RMSEP, RMSECV and bias have the same unit as the dependent variable (the N-uptake). RMSEP and RMSECV indicates the error in absolute values and the bias indicates if the model tends to overestimate or underestimate the dependent variable. The RPD makes it possible to compare different data sets with each other independent of units, as the error is expressed in relation to the standard deviation. That is, an RPD of one is no better than a guess. The influence of the different
5
wavelengths was evaluated by comparing the regression coefficients in the PLS calibrations for the individual wavelengths.
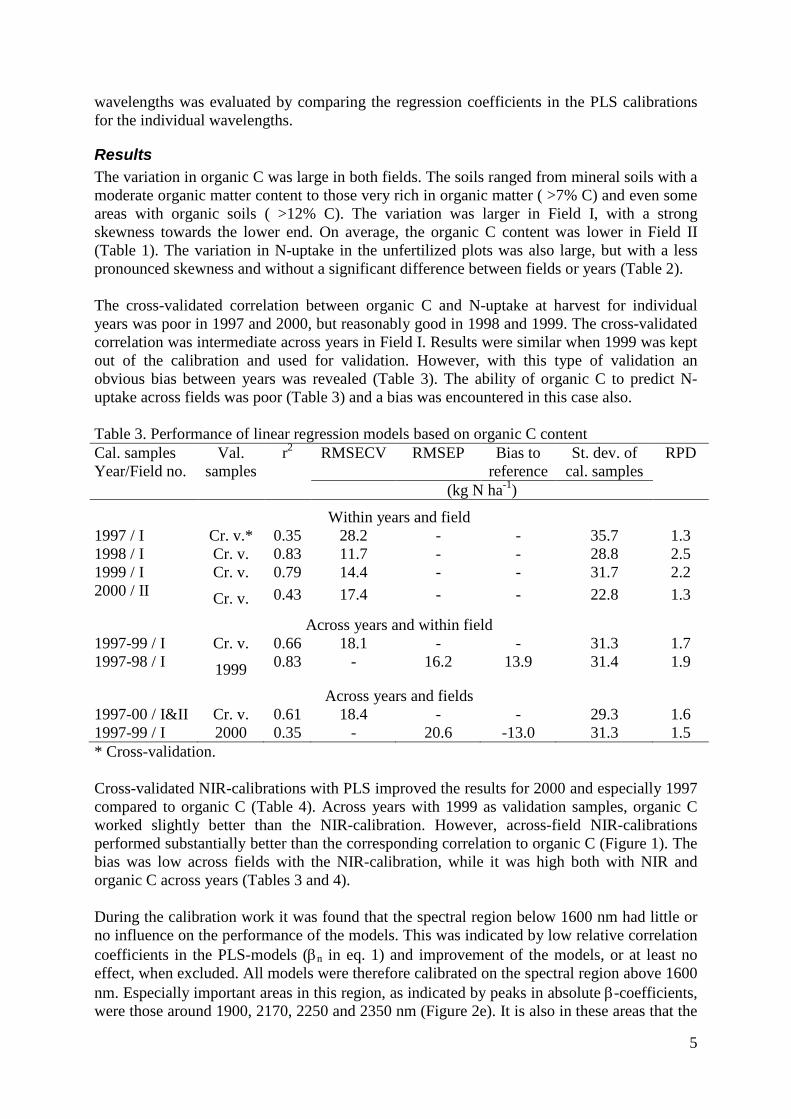
Results The variation in organic C was large in both fields. The soils ranged from mineral soils with a moderate organic matter content to those very rich in organic matter ( >7% C) and even some areas with organic soils ( >12% C). The variation was larger in Field I, with a strong skewness towards the lower end. On average, the organic C content was lower in Field II (Table 1). The variation in N-uptake in the unfertilized plots was also large, but with a less pronounced skewness and without a significant difference between fields or years (Table 2). The cross-validated correlation between organic C and N-uptake at harvest for individual years was poor in 1997 and 2000, but reasonably good in 1998 and 1999. The cross-validated correlation was intermediate across years in Field I. Results were similar when 1999 was kept out of the calibration and used for validation. However, with this type of validation an obvious bias between years was revealed (Table 3). The ability of organic C to predict N-uptake across fields was poor (Table 3) and a bias was encountered in this case also. Table 3. Performance of linear regression models based on organic C content Cal. samples Year/Field no.
Val. samples
r2 RMSECV RMSEP
Bias to reference
St. dev. of cal. samples
RPD
(kg N ha-1)
Within years and field 1997 / I Cr. v.* 0.35 28.2 - - 35.7 1.3 1998 / I Cr. v. 0.83 11.7 - - 28.8 2.5 1999 / I Cr. v. 0.79 14.4 - - 31.7 2.2 2000 / II Cr. v. 0.43 17.4 - - 22.8 1.3
Across years and within field 1997-99 / I Cr. v. 0.66 18.1 - - 31.3 1.7 1997-98 / I 1999 0.83 - 16.2 13.9 31.4 1.9
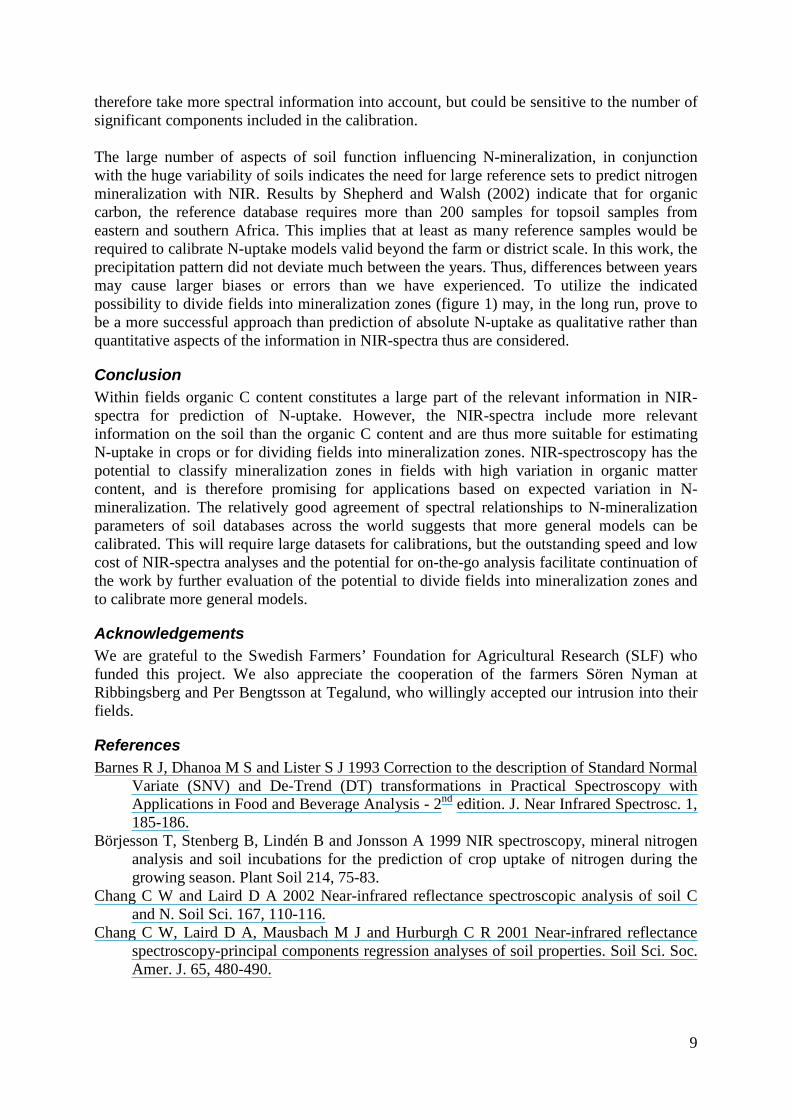
Across years and fields 1997-00 / I&II Cr. v. 0.61 18.4 - - 29.3 1.6 1997-99 / I 2000 0.35 - 20.6 -13.0 31.3 1.5 * Cross-validation. Cross-validated NIR-calibrations with PLS improved the results for 2000 and especially 1997 compared to organic C (Table 4). Across years with 1999 as validation samples, organic C worked slightly better than the NIR-calibration. However, across-field NIR-calibrations performed substantially better than the corresponding correlation to organic C (Figure 1). The bias was low across fields with the NIR-calibration, while it was high both with NIR and organic C across years (Tables 3 and 4). During the calibration work it was found that the spectral region below 1600 nm had little or no influence on the performance of the models. This was indicated by low relative correlation coefficients in the PLS-models (βn in eq. 1) and improvement of the models, or at least no effect, when excluded. All models were therefore calibrated on the spectral region above 1600 nm. Especially important areas in this region, as indicated by peaks in absolute β-coefficients, were those around 1900, 2170, 2250 and 2350 nm (Figure 2e). It is also in these areas that the

6
standard normal variate and De-Trended NIR-spectra have smaller or larger peaks (Figure 2a-b). The curve of correlation coefficients for individual standard normal variate and De-Trended wavelengths to the N-uptake indicates a similar pattern with some important exceptions at 1900 and 2350 nm. However, this is not discussed further as remaining areas were redundant. Table 4. Performance of PLS-models based on standard normal variate and De-Trended NIR-spectra Cal. samples Year/Field no.
Val. samples
No. of comp.
r2 RMSECV RMSEP
Bias to reference
St. dev. of cal. samples
RPD
(kg N ha-1)
Within years and field 1997 / I Cr. v.* 8 0.81 15.4 - - 35.7 2.3 1998 / I Cr. V. 3 0.74 14.4 - - 28.8 2.0 1999 / I Cr. v. 7 0.83 12.9 - - 31.7 2.5 2000 / II Cr. v. 4 0.65 12.1 - - 22.8 1.9
Across years and within field 1997-99 / I Cr. v. 7 0.78 15.0 - - 31.3 1.9 1997-98 / I 1999 3 0.72 - 19.0 9.6 31.4 1.7
Across years and fields 1997-00 / I&II Cr. V. 7 0.68 14.7 - - 29.3 2.0 1997-99 / I 2000 7 0.61 - 12.6 -0.5 31.3 2.5 * Cross-validation. To evaluate the possible implementation of the predictions of N-uptake in practical agriculture, we assumed the RPD-value to be a rough estimate of number of N-mineralization classes that could be established by predictions with reasonably good agreement to measured values. An RPD of 2.5 thus implies 2-3 classes. We therefore divided the range in N-uptake in Field I in 1997-1999 into three classes ranging from 16-54, 54-93 and 93-131 kg N ha-1, respectively, and applied these classes to predicted values of Field II in 2000. Figure 1a shows that 4 out of 20 samples were classified to the wrong class (outside the shaded area), all four to a neighboring class. Performing the same experiment with N-uptake predicted from organic C content resulted in seven samples being classified to the wrong class, two of them from class III to class I and five to a neighboring class (Figure 1b).
Discussion Cross-validated NIR models to predict N-uptake by crops for the years 1997-1999 individually were equally good, with RPDs between 2.0 and 2.5 (Table 4). These can be regarded as reasonably good values as an RPD of three for forage materials was regarded as good by Williams and Sobering (1996). For soil properties, analyses with RPD>2 were regarded to be readily and accurately estimated (Chang et al., 2001). The difference in identified limits can probably be related to a difference in estimated accuracy of reference methods. The cross-validated model for 1997-2000 performed about equally well as the models based on individual years (RPD = 2.0). The model was not noticeably affected by excluding Field II in the year 2000 (Table 4). The performance of these cross-validated calibrations corresponds to the performance found by Dunn at al., (2000) for N-uptake in rice. The under-prediction of the N-uptake in 1999 in Field I by both the C- and NIR-calibrations on N-uptake 1997-1998 in Field I could be argued to be due to the slightly (although not
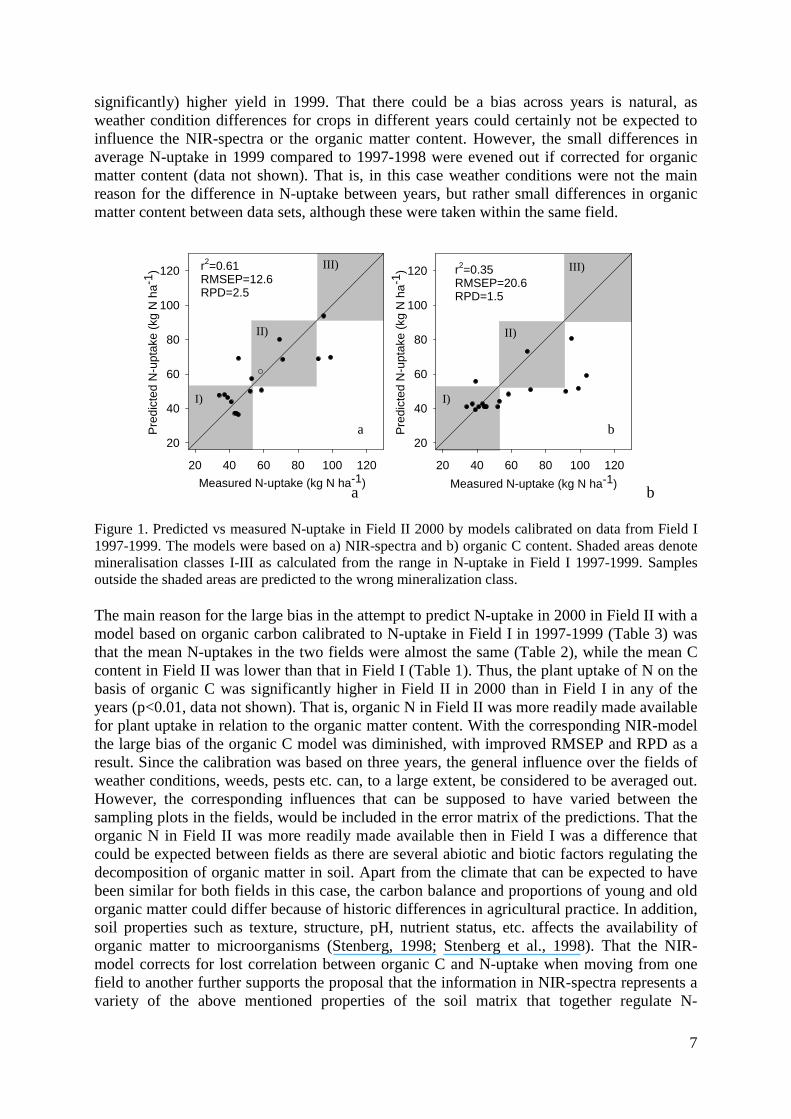
7
significantly) higher yield in 1999. That there could be a bias across years is natural, as weather condition differences for crops in different years could certainly not be expected to influence the NIR-spectra or the organic matter content. However, the small differences in average N-uptake in 1999 compared to 1997-1998 were evened out if corrected for organic matter content (data not shown). That is, in this case weather conditions were not the main reason for the difference in N-uptake between years, but rather small differences in organic matter content between data sets, although these were taken within the same field.
Measured N-uptake (kg N ha-1)20 40 60 80 100 120
Pre
dict
ed N
-upt
ake
(kg
N h
a-1 )
20
40
60
80
100
120
Measured N-uptake (kg N ha-1)20 40 60 80 100 120
Pre
dict
ed N
-upt
ake
(kg
N h
a-1 )
20
40
60
80
100
120r2=0.61RMSEP=12.6RPD=2.5
r2=0.35RMSEP=20.6RPD=1.5
I)
II)
III)
I)
II)
III)
a b
Figure 1. Predicted vs measured N-uptake in Field II 2000 by models calibrated on data from Field I 1997-1999. The models were based on a) NIR-spectra and b) organic C content. Shaded areas denote mineralisation classes I-III as calculated from the range in N-uptake in Field I 1997-1999. Samples outside the shaded areas are predicted to the wrong mineralization class. The main reason for the large bias in the attempt to predict N-uptake in 2000 in Field II with a model based on organic carbon calibrated to N-uptake in Field I in 1997-1999 (Table 3) was that the mean N-uptakes in the two fields were almost the same (Table 2), while the mean C content in Field II was lower than that in Field I (Table 1). Thus, the plant uptake of N on the basis of organic C was significantly higher in Field II in 2000 than in Field I in any of the years (p<0.01, data not shown). That is, organic N in Field II was more readily made available for plant uptake in relation to the organic matter content. With the corresponding NIR-model the large bias of the organic C model was diminished, with improved RMSEP and RPD as a result. Since the calibration was based on three years, the general influence over the fields of weather conditions, weeds, pests etc. can, to a large extent, be considered to be averaged out. However, the corresponding influences that can be supposed to have varied between the sampling plots in the fields, would be included in the error matrix of the predictions. That the organic N in Field II was more readily made available then in Field I was a difference that could be expected between fields as there are several abiotic and biotic factors regulating the decomposition of organic matter in soil. Apart from the climate that can be expected to have been similar for both fields in this case, the carbon balance and proportions of young and old organic matter could differ because of historic differences in agricultural practice. In addition, soil properties such as texture, structure, pH, nutrient status, etc. affects the availability of organic matter to microorganisms (Stenberg, 1998; Stenberg et al., 1998). That the NIR-model corrects for lost correlation between organic C and N-uptake when moving from one field to another further supports the proposal that the information in NIR-spectra represents a variety of the above mentioned properties of the soil matrix that together regulate N-
a b

8
dynamics, as suggested by Börjesson et al. (1999). It still remains to establish which mechanisms and properties relevant for N-uptake that influences the NIR-spectra directly.
wavelength (nm)
1200 1400 1600 1800 2000 2200 2400
e
d
c
b
a
Figure 2. NIR absorbance spectra and their relationship to N-uptake in winter wheat, (a) first derivative of the average spectrum for 1997 to 2000 samples, (b) standard normal variate and De-Trend of the average spectrum for 1997 to 2000, (c) correlation coefficients for individual wavelengths of the first derivative spectra for Field II 2000, (d) correlation coefficients for individual wavelengths of the standard normal variate and De-Trended spectra for Field II 2000, and (e) cross-validated PLS β-coefficients from Field II 2000. Values are relative to the horizontal baseline. Russell et al. (2002) state that the spectral areas they found most correlated to N-mineralization in rice soils contrasted markedly to those found by Börjesson et al. (1999), who used samples from the same unfertilized plots as we did in 1997. However, the NIR-spectra used by Russell et al. were transformed by the first derivative and those used by Börjesson et al. were transformed by a simple base line correction. In addition, Russell et al. interpreted correlation coefficients from individual wavelengths and Börjesson et al. β-coefficients from PLS-models. As can be seen in Figure 2c and e, these are not comparable. Actually the relative coefficients from individual derived wavelengths in Figure 2c resemble those reported by Russell et al. (2002), and Chang et al. (2001) for potentially mineralizable N. The major deviations can be found in the coefficients by Russell et al. (2002), which show a smoother curve above 2200 nm. Consequently, the derived NIR-spectra are smoother with fewer peaks in this region. Pronounced deviations in the NIR-spectra can be expected from soils so different in type, age and origin. Whether regression coefficients or PLS coefficients are the better for comparing importance of different spectral regions between different data sets is open for discussion. However, it is clear that the different kinds of data cannot be compared crosswise. For identification and better understanding of important regions in the spectra regarding N mineralization a consensus would be beneficial. The advantage of using PLS coefficients is that they are the actual outcome of the calibration, which utilize combinations of several wavelengths, or patterns, in the spectra and the PLS coefficients therefore reflects the relative weight of each wavelength in the calibration and not the relationship of each individual wavelength to the dependent variable. PLS coefficients will
9
therefore take more spectral information into account, but could be sensitive to the number of significant components included in the calibration. The large number of aspects of soil function influencing N-mineralization, in conjunction with the huge variability of soils indicates the need for large reference sets to predict nitrogen mineralization with NIR. Results by Shepherd and Walsh (2002) indicate that for organic carbon, the reference database requires more than 200 samples for topsoil samples from eastern and southern Africa. This implies that at least as many reference samples would be required to calibrate N-uptake models valid beyond the farm or district scale. In this work, the precipitation pattern did not deviate much between the years. Thus, differences between years may cause larger biases or errors than we have experienced. To utilize the indicated possibility to divide fields into mineralization zones (figure 1) may, in the long run, prove to be a more successful approach than prediction of absolute N-uptake as qualitative rather than quantitative aspects of the information in NIR-spectra thus are considered.
Conclusion Within fields organic C content constitutes a large part of the relevant information in NIR-spectra for prediction of N-uptake. However, the NIR-spectra include more relevant information on the soil than the organic C content and are thus more suitable for estimating N-uptake in crops or for dividing fields into mineralization zones. NIR-spectroscopy has the potential to classify mineralization zones in fields with high variation in organic matter content, and is therefore promising for applications based on expected variation in N-mineralization. The relatively good agreement of spectral relationships to N-mineralization parameters of soil databases across the world suggests that more general models can be calibrated. This will require large datasets for calibrations, but the outstanding speed and low cost of NIR-spectra analyses and the potential for on-the-go analysis facilitate continuation of the work by further evaluation of the potential to divide fields into mineralization zones and to calibrate more general models.
Acknowledgements We are grateful to the Swedish Farmers’ Foundation for Agricultural Research (SLF) who funded this project. We also appreciate the cooperation of the farmers Sören Nyman at Ribbingsberg and Per Bengtsson at Tegalund, who willingly accepted our intrusion into their fields.
References Barnes R J, Dhanoa M S and Lister S J 1993 Correction to the description of Standard Normal
Variate (SNV) and De-Trend (DT) transformations in Practical Spectroscopy with Applications in Food and Beverage Analysis - 2nd edition. J. Near Infrared Spectrosc. 1, 185-186.
Börjesson T, Stenberg B, Lindén B and Jonsson A 1999 NIR spectroscopy, mineral nitrogen analysis and soil incubations for the prediction of crop uptake of nitrogen during the growing season. Plant Soil 214, 75-83.
Chang C W and Laird D A 2002 Near-infrared reflectance spectroscopic analysis of soil C and N. Soil Sci. 167, 110-116.
Chang C W, Laird D A, Mausbach M J and Hurburgh C R 2001 Near-infrared reflectance spectroscopy-principal components regression analyses of soil properties. Soil Sci. Soc. Amer. J. 65, 480-490.

10
Dawson C J 1997 Management for spatial variability. In Precision Agriculture ´97, Warwick, 7-10 Sep 1997. Vol. 1. Spatial Variability in Soil and Crop. Ed. J V Stafford. pp. 45-58. BIOS Scientific Publishers Ltd, Oxford, UK.
Dunn B, Beecher G, Batten G and Blakeney A 2000 Estimating the uptake of nitrogen by rice crops using near infrared reflectance analysis of soil. In Near Infrared Spectroscopy: Proceedings of the 9th International Conference, Verona, Italy, 2000. Eds. A M C Davies and R Giangiacomo. pp. 565-568. NIR Publications, Chichester, UK.
Fystro G 2002 The prediction of C and N content and their potential mineralisation in heterogeneous soil samples using Vis-NIR spectroscopy and comparative methods. Plant Soil 246, 139-149.
Janik L J, Merry R H and Skjemstad J O 1998 Can mid infrared diffuse reflectance analysis replace soil extractions? Aust. J. Exp. Agr. 38, 681-696.
Lindén B, Lyngstad I, Sippola J, Søegaard K and Kjellerup V 1992 Nitrogen mineralization during the growing season I. Contribution to the nitrogen supply of spring barley. Swed. J. Agr. Res. 22, 3-12.
Malley D F, Yesmin L, Wray D and Edwards S 1999 Application of near-infrared spectroscopy in analysis of soil mineral nutrients. Commun. Soil Sci. Plan. 30, 999-1012.
Martens H and Naes T 1989 Multivariate calibration. John Wiley & Sons, Chichester, UK. 419 pp.
Martens M and Martens H 1986 Partial least squares regression. In Statistical procedures in food research. Ed. J R Piggott. pp. 3-85. Elsevier appl. sci. publ., London, UK.
Mayer J H 1989 Rapid simultaneous rating of soil texture, organic matter, total nitrogen and nitrogen mineralization potential by near-infrared reflectance. South African Journal of Plant Soil 6, 59-63.
McBratney A B and Pringle M J 1997 Spatial variability in soil - implications for precision agriculture. In Precision Agriculture ´97. Warwick, 7-10 Sep 1997. Vol. 1. Spatial Variability in Soil and Crop. Ed. J V Stafford. pp. 3-31. BIOS Scientific Publishers Ltd, Oxford, UK.
Palmborg C and Nordgren A 1993 Modelling Microbial Activity and Biomass in Forest Soil with Substrate Quality Measured Using Near Infrared Reflectance Spectroscopy. Soil Biol. Biochem. 25, 1713-1718.
Robert P 1999 Precision agriculture: Research needs and status in the USA. In Precision Agriculture `99. Ed. J V Stafford. pp. 19-33. SCI, Sheffield, UK.
Rossel R A V and McBratney A B 1998 Soil chemical analytical accuracy and costs: implications from precision agriculture. Austral. J. Exp. Agr. 38, 765-775.
Russell C A, Angus J F, Batten G D, Dunn B W and Williams R L 2002 The potential of NIR spectroscopy to predict mineralization in rice soils. Plant Soil 247, 243-252.
Savitzky A and Golay M 1964 Smoothing and differentiation of data by simplified least squares procedures. Anal. Chem. 36, 1627-1639.
Shepherd K D and Walsh M G 2002 Development of reflectance spectral libraries for characterization of soil properties. Soil Sci. Soc. Amer. J. 66, 988-998.
Stenberg B 1998 Soil attributes as predictors of crop production under standardized conditions. Biol. Fert. Soils 27, 104-112.
Stenberg B, Nordkvist E and Salomonsson L 1995 Use of near infrared reflectance spectra of soils for objective selection of samples. Soil Sci. 159, 109-114.
Stenberg B, Pell M and Torstensson L 1998 Integrated evaluation of variation in biological, chemical and physical soil properties. Ambio 27, 9-15.

11
Thylén L 1997 Consistency in yield variation and optimal nitrogen rate. In Precision Agriculture ´97. Warwick, 7-10 Sep 1997. Vol. 1. Spatial Variability in Soil and Crop. Ed. J V Stafford. pp. 345-350. BIOS Scientific Publishers Ltd, Oxford, UK.
Wagner B, Gutser R and Schmidhalter U 2001 NIR-spectroscopy to estimate soil nitrogen supply. In Plant Nutrition - Food Security and Sustainability of Agro-Ecosystems, Ed W J Horst. pp. 752-753. Kluwer Academic Publishers, the Netherlands.
Wetzel D L 1983 Near-infrared reflectance analysis - Sleeper among spectroscopic techniques. Anal. Chem. 55, 1165-1176.
Williams P and Sobering D 1996 How do we do it: a brief summary of the methods we use in developing near infrared calibrations. In Near Infrared Spectroscopy: The Future Waves, Montreal, Canada, 6-11 August 1995. Eds. A M C Davies and P Williams. pp. 185-188. NIR Publications, Chichester, UK.
Wold S, Albano C, Dunn W J, Esbensen K, Hellberg S and Johansson E 1984 Modelling data tables by principal components and PLS: Class patterns and quantitative predictive relations. Analysis 12, 477-485.
Related Documents