USE OF COAL DRYING TO REDUCE WATER CONSUMED IN PULVERIZED COAL POWER PLANTS QUARTERLY REPORT FOR THE PERIOD April 1, 2004 to June 30, 2004 by Edward K. Levy Nenad Sarunac Wei Zhang Report Issued July 2004 DOE Award Number DE-FC26-03NT41729 Energy Research Center Lehigh University 117 ATLSS Drive Bethlehem, PA 18015

Welcome message from author
This document is posted to help you gain knowledge. Please leave a comment to let me know what you think about it! Share it to your friends and learn new things together.
Transcript

USE OF COAL DRYING TO REDUCE WATER CONSUMED IN PULVERIZED COAL POWER PLANTS
QUARTERLY REPORT FOR THE PERIOD
April 1, 2004 to June 30, 2004
by
Edward K. Levy Nenad Sarunac
Wei Zhang
Report Issued July 2004
DOE Award Number DE-FC26-03NT41729
Energy Research Center Lehigh University 117 ATLSS Drive
Bethlehem, PA 18015

ii
DISCLAIMER
“This report was prepared as an account of work sponsored by an agency of the
United States Government. Neither the United States Government nor any agency
thereof, nor any of their employees, makes any warranty, express or implied, or
assumes any legal liability or responsibility for the accuracy, completeness, or
usefulness of any information, apparatus, product, or process disclosed, or represents
that its use would not infringe privately owned rights. Reference herein to any specific
commercial product, process, or service by trade name, trademark, manufacturer, or
otherwise does not necessarily constitute or imply its endorsement, recommendation, or
favoring by the United States Government or any agency thereof. The views and
opinions of authors expressed herein do not necessarily state or reflect those of the
United States Government or any agency thereof.”

iii
ABSTRACT
This is the sixth Quarterly Report for this project. The background and technical
justification for the project are described, including potential benefits of reducing fuel
moisture, prior to firing in a pulverized coal boiler.
Coal drying experiments were performed with a Powder River Basin coal to
measure the effects of fluidization velocity and drying temperature on rate of drying in a
batch drying process. Comparisons to computational results using the batch bed drying
model show good agreement. Comparisons to drying results with North Dakota lignite
at the same process conditions confirm the lignite dries slightly more rapidly than the
PRB.
Experiments were also carried out to determine the effects of inlet air humidity on
drying rate. The specific humidity ranged from a value typical for air at temperatures
near freezing to a value for 30°C air at 90 percent relative humidity. The experimental
results show drying rate is strongly affected by inlet air humidity, with the rate
decreasing with more humid inlet air. The temperature of the drying process also plays
a strong role, with the negative impacts of high inlet moisture being less of a factor in a
higher temperature drying process.
Concepts for coal drying systems integrated into a power plant were developed.
These make use of hot circulating cooling water from the condenser, steam extraction
from the turbine cycle and thermal energy extracted from hot flue gas, in various
combinations. Analyses are under way to calculate the effects of drying system design
and process conditions on unit performance, emissions, and cooling tower makeup
water.

iv
TABLE OF CONTENTS
Page
INTRODUCTION 1 Background 1
Previous Work 3
This Investigation 5
Task 1: Fabricate and Instrument Equipment 5
Task 2: Perform Drying Experiments 6
Task 3: Develop Drying Models and Compare to Experimental Data 6
Task 4: Drying System Design 6
Task 5: Analysis of Impacts on Unit Performance and Cost of Energy 6
EXECUTIVE SUMMARY 8
Background 8
Results 8
EXPERIMENTAL 10
Test Apparatus 10
Test Procedure 11
Results and Discussion 12
Drying Rates with PRB Coal 12
Effect of Inlet Air Humidity on Drying Rate 14
DRYING SYSTEM DESIGN AND ANALYSIS OF IMPACTS ON UNIT 19 PERFORMANCE AND COST OF ENERGY
Drying System Configuration 26
NOMENCLATURE 28
REFERENCES 28
APPENDIX A A-1

v
LIST OF FIGURES Figure Page 1 Schematic of Plant Layout, Showing Air Heater and Coal 2 Dryer (Version 1) 2 Schematic of Plant Layout, Showing Air Heater and Coal 2 Dryer (Version 2) 3 The Effects of Coal Moisture on Cooling Tower Makeup Water 3 4 Improvement in Net Unit Heat Rate Versus Reduction in Coal 4 Moisture Content 5 Project Schedule 7 6 Sketch of Experimental Bed Setup 10 7 Moisture Content Versus Time – PRB Coal 13 8 Drying Rate Versus Velocity – PRB Coal 13 9 Γ Versus Tlog (φ) – Equilibrium Coal Moisture 15 10 Drying Rate Versus Velocity – PRB and Lignite 15 11 Coal Moisture Content Versus Time – PRB 16 12 Bed Temperature Versus Time – PRB 16 13 Relative Humidity Versus Time – PRB 17 14 Coal Moisture Content Versus Time – PRB 17 15 Bed Temperature Versus Time – PRB 18 16 Relative Humidity Versus Time – PRB 18 17 Drying Rate Versus Inlet Humidity – PRB 20 18 Coal Moisture Content Versus Time – Lignite 20 19 Bed Temperature Versus Time – Lignite 21

vi
LIST OF FIGURES (continued) Figure Page 20 Relative Humidity Versus Time – Lignite 21 21 Coal Moisture Content Versus Time – Lignite 22 22 Bed Temperature Versus Time – Lignite 22 23 Relative Humidity Versus Time – Lignite 23 24 Coal Moisture Content Versus Time – Lignite 23 25 Bed Temperature Versus Time – Lignite 24 26 Relative Humidity Versus Time – Lignite 24 27 Drying Rate Versus Inlet Humidity – Lignite 25 28 ULT Case 26 A1 Relationship Between Two Different Definitions of Coal Moisture A-1

vii
LIST OF TABLES Table Page 1 Procedure for Drying Tests 11

1
INTRODUCTION
Background
Low rank fuels such as subbituminous coals and lignites contain significant
amounts of moisture compared to higher rank coals. Typically, the moisture content of
subbituminous coals ranges from 15 to 30 percent, while that for lignites is between 25
and 40 percent, where both are expressed on a wet coal basis. Please see Appendix A
for more details on definitions of coal moisture used in this report.
High fuel moisture has several adverse impacts on the operation of a pulverized
coal generating unit. High fuel moisture results in fuel handling problems, and it affects
heat rate, mass rate (tonnage) of emissions, and the consumption of water needed for
evaporative cooling.
This project deals with lignite and subbituminous coal-fired pulverized coal power
plants, which are cooled by evaporative cooling towers. In particular, the project
involves use of power plant waste heat to partially dry the coal before it is fed to the
pulverizers. Done in a proper way, coal drying will reduce cooling tower makeup water
requirements and also provide heat rate and emissions benefits.
The technology addressed in this project makes use of the hot circulating cooling
water leaving the condenser to heat the air used for drying the coal (Figure 1). The
temperature of the circulating water leaving the condenser is usually about 49°C
(120°F), and this can be used to produce an air stream at approximately 43°C (110°F).
Figure 2 shows a variation of this approach, in which coal drying would be
accomplished by both warm air, passing through the dryer, and a flow of hot circulating
cooling water, passing through a heat exchanger located in the dryer. Higher
temperature drying can be accomplished if hot flue gas from the boiler or extracted
steam from the turbine cycle is used to supplement the thermal energy obtained from

2
the circulating cooling water. Various options such as these are being examined in this
investigation.
Figure 1: Schematic of Plant Layout, Showing Air Heater and Coal Dryer (Version 1)
Figure 2: Schematic of Plant Layout, Showing Air Heater and Coal Dryer (Version 2)

3
Previous Work
Two of the investigators (Levy and Sarunac) have been involved in work with the
Great River Energy Corporation on a study of low temperature drying at the Coal Creek
Generating Station in Underwood, North Dakota. Coal Creek has two units with total
gross generation exceeding 1,100 MW. The units fire a lignite fuel containing
approximately 40 percent moisture and 12 percent ash. Both units at Coal Creek are
equipped with low NOx firing systems and have wet scrubbers and evaporative cooling
towers.
The project team performed a theoretical analysis to estimate the impact on
cooling water makeup flow of using hot circulating water to the cooling tower to heat the
drying air and to estimate the magnitude of heat rate improvement that could be
achieved at Coal Creek Station by removing a portion of the fuel moisture. The results
show that drying the coal from 40 to 25 percent moisture will result in reductions in
makeup water flow rate from 5 to 7 percent, depending on ambient conditions (Figure
3). For a 550 MW unit, the water savings are predicted to range from 1.17 × 10⁶
liters/day (0.3 × 10⁶ gallons/day) to 4.28 × 10⁶ liters/day (1.1 × 10⁶ gallons/day). The
analysis also shows the heat rate and the CO2 and SO2 mass emissions will all be
reduced by about 5 percent (Ref. 1).
Figure 3: The Effects of Coal Moisture on Cooling Tower Makeup Water
0
1
2
3
4
5
6
7
8
25 30 35 40
Coal Moisture Content [%]
Red
uctio
n in
Coo
ling
Tow
er M
akeu
p Fl
ow [%
]
Spring/FallSummerWinter

4
A coal test burn was conducted at Coal Creek Unit 2 in October 2001 to
determine the effect on unit operations. The lignite was dried for this test by an outdoor
stockpile coal drying system. On average, the coal moisture was reduced by 6.1
percent, from 37.5 to 31.4 percent. Analysis of boiler efficiency and net unit heat rate
showed that with coal drying, the improvement in boiler efficiency was approximately
2.6 percent, and the improvement in net unit heat rate was 2.7 to 2.8 percent. These
results are in close agreement with theoretical predictions (Figure 4). The test data also
showed the fuel flow rate was reduced by 10.8 percent and the flue gas flow rate was
reduced by 4 percent. The combination of lower coal flow rate and better grindability
combined to reduce mill power consumption by approximately 17 percent. Fan power
was reduced by 3.8 percent due to lower air and flue gas flow rates. The average
reduction in total auxiliary power was approximately 3.8 percent (Ref. 1).
Figure 4: Improvement in Net Unit Heat Rate Versus Reduction in Coal Moisture Content
0
1
2
3
4
5
0 2 4 6 8 10
Reduction in Coal Moisture [%]
Impr
ovem
ent i
n N
et U
nit H
eat R
ate
[%]
Theoretical PredictionTest Data

5
This Investigation
Theoretical analyses and coal test burns performed at a lignite fired power plant
show that by reducing the fuel moisture, it is indeed possible to improve boiler
performance and unit heat rate, reduce emissions and reduce water consumption by the
evaporative cooling tower. The economic viability of the approach and the actual
impact of the drying system on water consumption, unit heat rate and stack emissions
will depend critically on the design and operating conditions of the drying system.
The present project is evaluating low temperature drying of lignite and Power
River Basin (PRB) coal. Drying studies are being performed to gather data and develop
models on drying kinetics. In addition, analyses are being carried out to determine the
relative costs and performance impacts (in terms of heat rate, cooling tower water
consumption and emissions) of the various drying options, along with the development
of an optimized system design and recommended operating conditions.
The project is being carried out in five tasks:
Note: Minor Change in Scope.
The original Task Statements included experiments and analyses for both
fluidized bed and fixed bed dryers (see previous Quarterly Reports). After the project
was started, it became clear there is no advantage to using fixed bed dryers for this
application. For this reason, the technical scope was changed in June 2004 to
emphasize fluidized bed drying. The Task Statements in this report reflect this change
in emphasis.
Task 1: Fabricate and Instrument Equipment
A laboratory scale batch fluidized bed drying system will be designed, fabricated
and instrumented in this task.

6
Task 2: Perform Drying Experiments
The experiments will be carried out while varying superficial air velocity, inlet air
temperature and specific humidity, particle size distribution, bed depth, and in-bed
heater heat flux. Experiments will be performed with both lignite and PRB coals.
Task 3: Develop Drying Models and Compare to Experimental Data
In this task, the laboratory drying data will be compared to equilibrium and kinetic
models to develop models suitable for evaluating tradeoffs between dryer designs.
Task 4: Drying System Design
Using the kinetic data and models from Tasks 2 and 3, dryers will be designed
for 600 MW lignite and PRB coal-fired power plants. Designs will be developed to dry
the coal by various amounts. Auxiliary equipment such as fans, water to air heat
exchangers, dust collection system and coal crushers will be sized, and installed capital
costs and operating costs will be estimated.
Task 5: Analysis of Impacts on Unit Performance and Cost of Energy
Analyses will be performed to estimate the effects of dryer operation on cooling
tower makeup water, unit heat rate, auxiliary power, and stack emissions. The cost of
energy will be estimated as a function of the reduction in coal moisture content. Cost
comparisons will be made between dryer operating conditions (for example, drying
temperature and superficial air velocity).
The project was initiated on December 26, 2002. The project schedule is shown
in Figure 5.

7
Figure 5: Project Schedule
1. Fabricate and Instrument Equipment
2. Perform Drying Experiments
3. Develop Drying Models and Compare to Experimental Data
4. Drying System Design
5. Analysis of Impacts on Unit Performance and Cost of Energy
6. Reporting
TASK0 6
Months 6 12 1818 24 30

8
EXECUTIVE SUMMARY Background
Low rank fuels such as subbituminous coals and lignites contain relatively large amounts of moisture compared to higher rank coals. High fuel moisture results in fuel handling problems, and it affects station service power, heat rate, and stack gas emissions.
This project deals with lignite and subbituminous coal-fired pulverized coal power plants, which are cooled by evaporative cooling towers. The project involves use of the hot circulating cooling water leaving the condenser to provide heat needed to partially dry the coal before it is fed to the pulverizers.
Recently completed theoretical analyses and coal test burns performed at a
lignite-fired power plant showed that by reducing the fuel moisture, it is possible to reduce water consumption by evaporative cooling towers, improve boiler performance and unit heat rate, and reduce emissions. The economic viability of the approach and the actual impact of the drying system on water consumption, unit heat rate and stack emissions will depend critically on the design and operating conditions of the drying system.
This project is evaluating alternatives for the low temperature drying of lignite and
Power River Basin (PRB) coal. Laboratory drying studies are being performed to gather data and develop models on drying kinetics. In addition, analyses are being carried out to determine the relative costs and performance impacts (in terms of heat rate, cooling tower water consumption and emissions) of drying, along with the development of an optimized system design and recommended operating conditions. Results
During the last Quarter, coal drying experiments were performed with a Powder River Basin coal to measure the effects of fluidization velocity and drying temperature on rate of drying in a batch drying process. The data show drying rate increases with air velocity and drying temperature. Comparisons to computational results using the batch bed drying model show good agreement between the experimental data and the theoretical predictions. Comparisons to drying results with North Dakota lignite at the same process conditions confirm the lignite dries more rapidly than the PRB. For the process conditions at which the comparisons were made, the differences are from 6 to 8 percent.
Experiments were also carried out to determine the effects of inlet air humidity on drying rate. The specific humidity ranged from a value typical for air at temperatures near freezing to a value for 30°C air at 90 percent relative humidity. The experimental results show drying rate is strongly affected by inlet air humidity, with the rate decreasing with more humid inlet air. The temperature of the drying process also plays

9
a strong role, with the negative impacts of high inlet moisture being less of a factor in a higher temperature drying process. In the case of PRB coal being dried at 43°C, drying rate decreased by 60 percent as the specific humidity went from the low to high value. At 66°C, the drying rate decreased by 30 percent over the same range of inlet air humidities. Lignite drying followed these same trends, with a 55 percent drop in drying rate at 43°C and a 20 percent decrease at 66°C.
Several concepts for coal drying systems integrated into a power plant were developed. These make use of hot circulating cooling water from the condenser, steam extraction from the turbine cycle and thermal energy extracted from hot flue gas, in various combinations. Analyses are under way to calculate the effects of drying system design and process conditions on unit performance, emissions, and cooling tower makeup water.

10
EXPERIMENTAL
Test Apparatus
The drying experiments are being performed in the Energy Research Center’s
Fluidized Bed Laboratory. The bed vessel is 152.4 mm (6”) in diameter, with a 1372
mm (54”) column and a sintered powder metal distributor plate. The air and entrained
coal particles flow into a filter bag before the air is discharged from the apparatus
(Figure 6). Compressed air used in the experiments flows though a rotameter and an
air heater before entering the plenum. In some experiments, steam is injected into the
air to increase its moisture content before it enters the dryer. Operating at 1.6 m/s of
superficial air velocity in the 152.4 mm (6-inch) diameter bed, the electrically heated, air
heater can attain a maximum steady state temperature of 66°C (150°F).
Thermocouples inserted through the bed wall are used to measure vertical
distribution of bed temperature. A horizontal bundle of eighteen 12.7 mm (½”) diameter
Figure 6: Sketch of Experimental Bed Setup
Rubber Connector/Reducer
Plexiglas Tube
Metal Bed
Distributor
Air Heater
Rotameter
Compressed Air
Metal Ducting
Filter Bag
Plenum

11
electric heating elements is used to provide in-bed heating. The heaters are located in
the region from 51 mm (2”) to 304.8 mm (12”) above the distributor and are
instrumented with thermocouples to indicate heater surface temperature. By controlling
power to the heaters, the heater surface temperature can be operated in a range from
38°C (100°) to 65.6°C (150°F). At a given heater surface temperature, total heat flux to
the bed can be reduced from the maximum by disconnecting selected heaters from the
power supply.
Test Procedure
The desired amount of coal was loaded into the apparatus. The flow rate and
temperature of the inlet air and the power level to the in bed heaters were set. Small
samples of the coal were removed from the bed during the drying tests and coal
moisture was measured. This was determined by drying samples of the coal in
crucibles in an oven at 110°C for 5 to 6 hours, and weighing the samples before and
after drying. The complete test procedure used in these experiments is described in
Table 1.
Table 1
Procedure for Drying Tests
1. With no coal in bed, turn on compressor, set air flow to desired value, turn on air preheater and allow system to reach steady-state at desired temperature. Measure inlet relative humidity and dry bulb temperature of air.
2. Once air is at steady-state, turn off air preheater and air flow, load coal into bed, turn on all heaters and air flow to appropriate values, start stopwatch, and record pressure of inlet air from pressure gauge above rotameter.
3. Begin recording temperatures after 5 minutes, collect small samples of lignite from bed, measure wet and dry bulb temperatures at exit of bed, record values for temperature readings at each assigned thermocouple, adjust voltage regulators for the heaters so that surface temperatures remain steady at appropriate values, and repeat this procedure for each time interval on data sheet.
4. At end of test, shut off heaters but keep air flow on to cool the heaters, detach filter bag, load coal samples into crucibles, place crucibles into oven, set to 100°C, and leave for 5-6 hours or overnight, remove remaining lignite from the bed and weigh it.
5. Analyze results.

12
Results and Discussion
The experiments performed in this reporting period were carried out with two
coals, a North Dakota lignite and a Powder River Basin (PRB) coal. The as-received
moisture content of the lignite varied slightly from sample-to-sample, usually ranging
from 35 to 38 percent (expressed as mass of moisture/mass of as-received fuel) and
from 54 to 58 percent (expressed as mass of moisture/mass dry fuel). The PRB coal
had a moisture content of approximately 27 percent (expressed as mass of
moisture/mass of as-received fuel) and 37 percent (expressed as mass of
moisture/mass dry fuel). All tests were carried out with coal having a minus ¼” (6350
µm) size distribution. The settled bed depth was 0.39 m.
During the first minute or two of each test, fines were elutriated from the bed.
The drying rate, Γ&
× min coaldry kg
OH kg 2 , presented here is based on the dry coal which
remained in the bed after elutriation had occurred and after coal samples had been
removed for analysis.
Drying Rates with PRB Coal
Previous progress reports contained data on drying of a lignite coal, and the
effects of superficial air velocity, inlet air temperature, in bed heat flux and bed depth
were shown. Figure 7 shows the effect of superficial air velocity on the drying curves for
a PRB coal. These tests were run with constant inlet air and heater temperatures and
inlet air specific humidity; and all of them show typical drying behavior of an initial
constant slope (or initial drying rate), followed by a decreasing rate of drying. The
results also show that drying rate increased with increasing superficial velocity (U0).
Figure 8 summarizes the effect of U0 on initial drying rate, Γ& , for 43° and 66°C drying
temperatures.

13
0
0.05
0.1
0.15
0.2
0.25
0.3
0.35
0.4
0.45
0.5
0 10 20 30 40Time (min)
Γ
Uo = 1.14m/sUo = 1.14m/sUo = 1.34m/sUo = 1.52m/s
PRBTair,in = 66 oCTtube = 66 oCω1= 0.004
0
0.002
0.004
0.006
0.008
0.01
0.012
0.014
0.016
0.018
1 1.1 1.2 1.3 1.4 1.5 1.6 1.7 1.8
U0 (m/s)
dΓdt
66 oC
43 oC
PRBω1= 0.004
Figure 7: Moisture Content Versus Time – PRB Coal
Figure 8: Drying Rate Versus Velocity – PRB Coal

14
Figure 9 gives the relations between equilibrium coal moisture, relative humidity
of air and temperature for both the lignite and PRB coals tested. These results show
that the equilibrium relation does depend on coal type and this is important since the
mathematical models for drying require a relation for ( )T,φ Γ=Γ . (See Ref. 2 and 3 for
description of mathematical drying models.)
Figure 10 is a comparison between the experimental data on Γ& and the
computer predictions for PRB. These agree to within 6 percent. Also shown for
reference here is the computer prediction for lignite drying for the same process
conditions. Previous test results (Ref. 4) showed that lignite dries slightly more rapidly
than PRB. These computer predictions are further confirmation of these relative rates.
Effect of Inlet Air Humidity on Drying Rate
A series of tests was performed with both lignite and PRB to determine the
effects of inlet air moisture on the drying kinetics. With these experiments, steam was
injected into the inlet air to the dryer to raise the specific humidity of the inlet air (ω1) to
values greater than those leaving the compressor. The values of ω1 ranged from 0.004
to 0.024. The lower value of ω1 corresponds to ambient air at temperatures near
freezing. An ω1 of 0.024 occurs at 90% relative humidity and a dry bulb temperature of
30°C.
Figure 11 shows the effect of ω1 on the drying curves for 3 tests with PRB coal.
These show clearly a reduction in drying rate with increasing ω1. With less evaporation
occurring, the heat input to the bed results in an increase in bed temperature (Figure
12). The relative humidities of the air leaving the bed (Figure 13) show that during the
latter stages of the drying process the air is closer to saturation with high ω1. The data
in Figures 11 to 13 were obtained with a drying temperature of 43°C. Figures 14 to 16
show the corresponding results for PRB at higher inlet air temperature and in-bed heat
flux.

15
Tlog(Φ) = -13227Γ4 + 22882Γ3 - 14723Γ2 + 4336.4Γ - 538.7
Tlog(Φ) = -46150Γ4 + 53081Γ3 - 23696Γ2 + 5147.5Γ - 495.71
-450
-400
-350
-300
-250
-200
-150
-100
-50
00 0.1 0.2 0.3 0.4 0.5 0.6 0.7
Γ
Tlog
( φ φφφ)
Lignite
PRB
Equation for Lignite
Equation for PRB coal
0.005
0.007
0.009
0.011
0.013
0.015
0.017
0.019
0.8 1 1.2 1.4 1.6 1.8
U0 (m/s)
dΓdt
Test Results - PRB
Simulation - PRB
Simulation - Lignite
Tair,in = 66 oCTtube = 66 oCω1 = 0.004
Figure 9: Γ Versus Tlog (φ) – Equilibrium Coal Moisture
Figure 10: Drying Rate Versus Velocity – PRB and Lignite

16
0
0.05
0.1
0.15
0.2
0.25
0.3
0.35
0.4
0.45
0 10 20 30 40 50Time (min)
Γ
ω1 = 0.0203
ω1 = 0.0128
ω1 = 0.0050
PRBTair,in = 43 oC Ttube = 43 oC U0 = 1.52 m/s
0
5
10
15
20
25
30
35
40
0 10 20 30 40 50Time (min)
Aver
age
Bed
Tem
pera
ture
(o C)
ω1 = 0.0203
ω1 = 0.0128
ω1 = 0.0050
PRBTair,in = 43 oC Ttube = 43 oC U0 = 1.52 m/s
Figure 11: Coal Moisture Content Versus Time – PRB
Figure 12: Bed Temperature Versus Time – PRB

17
0
0.1
0.2
0.3
0.4
0.5
0.6
0.7
0.8
0.9
1
0 10 20 30 40 50Time (min)
Φ
ω1 = 0.0203
ω1 = 0.0128
ω1 = 0.0050
PRBTair,in = 43 oC Ttube = 43 oC U0 = 1.52 m/s
0
0.05
0.1
0.15
0.2
0.25
0.3
0.35
0.4
0.45
0 10 20 30 40 50Time (min)
Γ
ω1 = 0.0224 ω1 = 0.0231
ω1 = 0.0050
PRBTair,in = 66 oC Ttube = 66 oC U0 = 1.52 m/s
Figure 13: Relative Humidity Versus Time – PRB
Figure 14: Coal Moisture Content Versus Time – PRB

18
0
10
20
30
40
50
60
0 10 20 30 40 50Time (min)
Ave
rage
Bed
Tem
pera
ture
(o C)
ω1 = 0.0224
ω1 = 0.0050
ω1 = 0.0231 PRBTair,in = 66 oC Ttube = 66 oC U0 = 1.52 m/s
0
0.1
0.2
0.3
0.4
0.5
0.6
0.7
0.8
0.9
0 10 20 30 40 50Time (min)
Φ
ω1 = 0.0224
ω1 = 0.0231
ω1 = 0.0050
PRBTair,in = 66 oC Ttube = 66 oC U0 = 1.52 m/s
Figure 15: Bed Temperature Versus Time – PRB
Figure 16: Relative Humidity Versus Time – PRB

19
While the drying rates are still degraded due to high ω1, the effects are not quite as
large. Figure 16 shows lower values of φ2, indicating the process is farther away from
saturated conditions.
Figure 17 summarizes the effects of inlet specific humidity on PRB drying rates
for 43 and 66°C inlet air temperatures. At 43°C, the drying rate decreased by 60
percent as the inlet air humidity went from 0.005 to 0.022 (kg H2O/kg dry air). At 66°C,
the reduction in drying rate was 31 percent over the same range of inlet humidities.
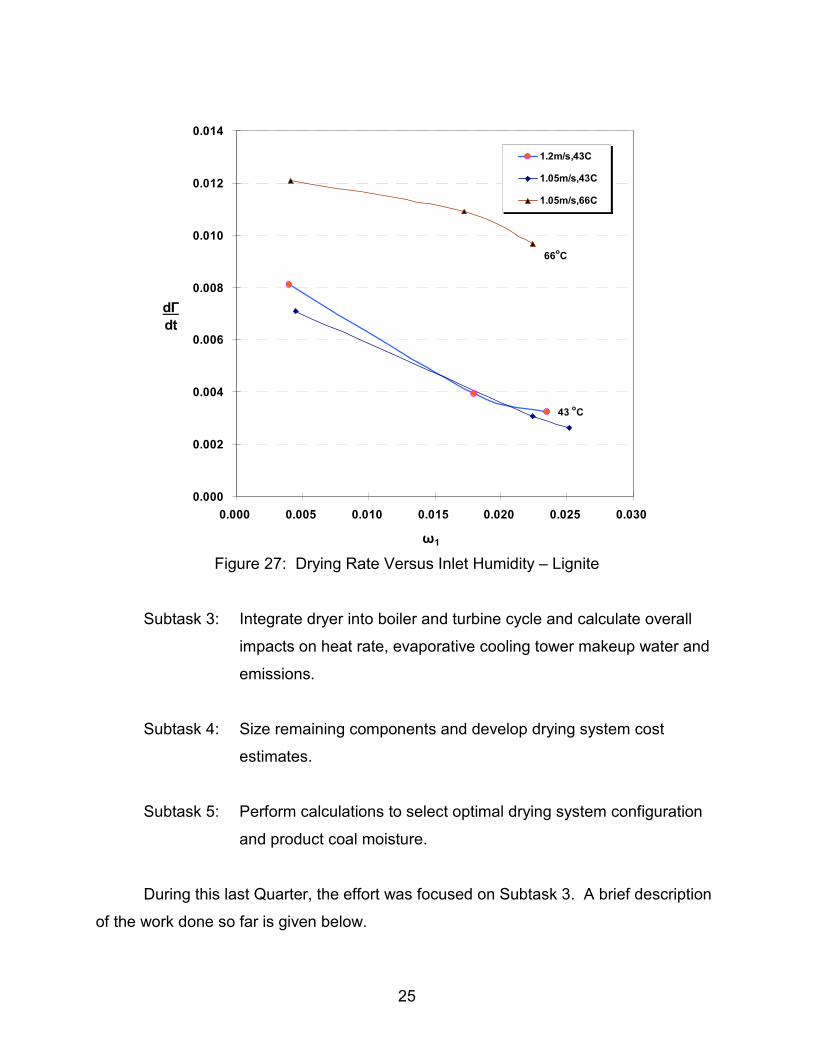
Figures 18 to 27 show lignite drying behavior with variations in inlet air humidity
and drying temperature. Similarly to the PRB, lignite dries more rapidly with lower ω1,
and the effects of inlet air moisture on drying rate are more pronounced at lower drying
temperatures.
DRYING SYSTEM DESIGN AND ANALYSIS OF IMPACTS ON UNIT PERFORMANCE AND COST OF ENERGY
Tasks 4 and 5 involve the design of drying systems for 600 MW lignite and PRB
coal-fired power plants, analysis of the effects of dryer operation on cooling tower
makeup water, unit heat rate, auxiliary power and stack emissions, and estimation of
the cost of energy as a function of reduction in coal moisture content and dryer design.
The work in these two tasks is progressing in the following subtasks:
Subtask 1: Estimate effects of firing dried coal on flow rates of combustion air
and flue gas, required feed rate of coal to boiler, mill and fan power,
boiler efficiency and unit heat rate.
Subtask 2: Estimate required dryer size, flow rates of fluidizing air and amount
of in-bed heat transfer as functions of drying temperature and coal
product moisture.

20
0.000
0.002
0.004
0.006
0.008
0.010
0.012
0.014
0.016
0.018
0 0.005 0.01 0.015 0.02 0.025 0.03
ω1
dΓdt
1.52vm/s, 43C test1.52vm/s, 66C testSimulation - PRB - 66CSimulation - PRB - 43C
0
0.1
0.2
0.3
0.4
0.5
0.6
0.7
0 10 20 30 40 50 60Time (min)
Γω1 = 0.008
ω1 = 0.0040
Lignite Test #34, 40, 47, 64 and 66 Tair,in = 43 oCTtube = 43 oCU0 = 1.2 m/s
ω1 = 0.0234ω1 = 0.0180
ω1 = 0.0060
Figure 17: Drying Rate Versus Inlet Humidity – PRB
Figure 18: Coal Moisture Content Versus Time – Lignite

21
0
5
10
15
20
25
30
35
40
0 10 20 30 40 50 60Time (min)
Ave
rage
Bed
Tem
pera
ture
(o C)
ω1 = 0.008 ω1 = 0.0040
ω1 = 0.0234
ω1 = 0.0180 ω1 = 0.0060
Lignite Test #34, 40, 47, 64 and 66 Tair,in = 43 oCTtube = 43 oCU0 = 1.2 m/s
0
0.2
0.4
0.6
0.8
1
1.2
0 10 20 30 40 50 60Time (min)
Φ
ω1 = 0.008
ω1 = 0.0040
ω1 = 0.0234ω1 = 0.0180
ω1 = 0.0060Lignite Test #34, 40, 47, 64 and 66 Tair,in = 43 oCTtube = 43 oCU0 = 1.2 m/s
Figure 19: Bed Temperature Versus Time – Lignite
Figure 20: Relative Humidity Versus Time – Lignite

22
0
0.1
0.2
0.3
0.4
0.5
0.6
0 10 20 30 40 50Time (min)
Γ
ω1 = 0.010
ω1 = 0.003
Lignite Test #76 and 78 Tair,in = 54 oCTtube = 54 oCU0 = 1.1 m/s
0
5
10
15
20
25
30
35
40
45
50
0 10 20 30 40 50Time (min)
Ave
rage
Bed
Tem
pera
ture
(o C)
ω1 = 0.003
ω1 = 0.010
Lignite Test #76 and 78 Tair,in = 54 oC Ttube = 54 oCU0 = 1.1 m/s
Figure 21: Coal Moisture Content Versus Time – Lignite
Figure 22: Bed Temperature Versus Time – Lignite

23
0
0.1
0.2
0.3
0.4
0.5
0.6
0.7
0.8
0.9
1
0 10 20 30 40 50Time (min)
Φ
ω1 = 0.010
ω1 = 0.003
Lignite Test #76 and 78 Tair,in = 54oCTtube = 54 oCU0 = 1.1 m/s
0
0.1
0.2
0.3
0.4
0.5
0.6
0 10 20 30 40 50 60 70 80Time (min)
Γ
ω1 = 0.0224
ω1 = 0.0172
ω1 = 0.0040
Lignite Test #36, 70 and 71 Tair,in = 66 oCTtube = 66 oCU0 = 1.05 m/s
Figure 23: Relative Humidity Versus Time – Lignite
Figure 24: Coal Moisture Content Versus Time – Lignite

24
0
10
20
30
40
50
60
70
0 10 20 30 40 50 60 70 80Time (min)
Ave
rage
Bed
Tem
pera
ture
(o C)
ω1 = 0.0224
ω1 = 0.0040
ω1 = 0.0172
Lignite Test #36, 70 and 71 Tair,in = 66 oCTtube = 66 oCU0 = 1.05 m/s
0
0.1
0.2
0.3
0.4
0.5
0.6
0.7
0.8
0.9
1
0 10 20 30 40 50Time (min)
Φ
ω1 = 0.0224 ω1 = 0.0172
ω1 = 0.0040 Lignite Test #36, 70 and 71 Tair,in = 66 oCTtube = 66 oCU0 = 1.05 m/s
Figure 25: Bed Temperature Versus Time – Lignite
Figure 26: Relative Humidity Versus Time – Lignite
25
0.000
0.002
0.004
0.006
0.008
0.010
0.012
0.014
0.000 0.005 0.010 0.015 0.020 0.025 0.030
ω1
dΓdt
1.2m/s,43C
1.05m/s,43C
1.05m/s,66C
66oC
43 oC
Figure 27: Drying Rate Versus Inlet Humidity – Lignite
Subtask 3: Integrate dryer into boiler and turbine cycle and calculate overall
impacts on heat rate, evaporative cooling tower makeup water and
emissions.
Subtask 4: Size remaining components and develop drying system cost
estimates.
Subtask 5: Perform calculations to select optimal drying system configuration
and product coal moisture.
During this last Quarter, the effort was focused on Subtask 3. A brief description
of the work done so far is given below.

26
Hot Cooling Water
Cold Cooling Water
COOLINGTOWER
Heating Coil
BI-SECTOR AIR PREHEATER
PrimaryAir
FD Fan
Coal Mill
Dry Coal
Flue Gas
Flue Gas
FURNACE
BOILER
Feeder
CoalBunker
Steam from LPSteam Turbine
Steam to HP Steam Turbine
Condensate toFeedwater Heaters
STEAMCONDENSER
To In-Bed Heat Exchanger
From In-Bed Heat Exchanger
1st StageFluidizing/DryingAir
2nd StageFluidizing/DryingAir
Hot Air Stream
Steam fromSteam Cycle (If Needed)
Condensate to Steam Cycle
FB DRYER
SAH
Fluidizing Air
FB DryerFan
SecondaryAir
Moist Air
Wet Coal
Drying System Configurations
Several drying system concepts are being evaluated in Subtask 3. Figure 28
shows one of these, a design concept which uses hot circulating cooling water leaving
the condenser to heat the fluidizing air and provide hot water for the in-bed heat
exchanger in the dryer. This results in a temperature of 38 to 43°C for both the
fluidizing air entering the bed and in-bed heat exchanger tubes.
Figure 28: ULT Case

27
The drying rate experiments described in this and previous quarterly reports
show a strong dependence of drying rate on drying temperature. As a consequence,
drying processes which occur at lower temperatures will require a longer coal residence
time, a larger dryer vessel, and higher flow rates of fluidizing air. One way to increase
the drying temperature and improve dryer performance is to use steam extracted from
the turbine cycle in a heat exchanger (SAH) to directly increase the temperature of the
fluidizing air stream (Figure 28).
Other drying system concepts which are being analyzed involve use of hot flue
gas and steam extraction from the turbine cycle to provide higher temperature heat
sources in combination with the circulating cooling water from the condenser.
Work is in progress to evaluate the performance of these drying system options.
The results will be included in the next few quarterly reports.

28
NOMENCLATURE
dp Particle Size
ho Settled Bed Depth
am& Air Flow Rate
Qave Average Heat Flux to Bed
Ta, in Air Inlet Temperature
Tb Bed Temperature
Uo Superficial Air Velocity
Y Coal Moisture (Kg H2O/Kg Moist Coal)
φ Relative Humidity
Γ Coal Moisture
coaldry kg
OH kg 2
Γ& Drying Rate
× timecoaldry kgOH kg 2
ω Specific Humidity of Air
REFERENCES
1. Bullinger, C., M. Ness, N. Sarunac, E. Levy, “Coal Drying Improves Performance and Reduces Emissions,” Presented at the 27th International Technical Conference on Coal Utilization and Fuel Systems, Clearwater, Florida, March 4-7, 2002.
2. Levy, E. et al., “Use of Coal Drying to Reduce Water Consumed in Pulverized
Coal Power Plants,” DOE Project DE-FC26-03NT41729, Quarterly Report for July 1, 2003 to September 30, 2003.
3. Levy, E. et al., “Use of Coal Drying to Reduce Water Consumed in Pulverized
Coal Power Plants,” DOE Project DE-FC26-03NT41729, Quarterly Report for January 1, 2004 to March 31, 2004.
4. Levy, E. et al., “Use of Coal Drying to Reduce Water Consumed in Pulverized
Coal Power Plants,” DOE Project DE-FC26-03NT41729, Quarterly Report for October 1, 2003 to December 31, 2003.

Relation Between Γ and y
0.00
0.05
0.10
0.15
0.20
0.25
0.30
0.35
0.40
0
y (k
g H
2O/k
g w
et c
oal)
Γ=m /m
APPENDIX A DEFINITION OF COAL MOISTURE
It should be noted that two different definitions of coal moisture are used in this
report. The moisture content of coal, Y, obtained as part of a Proximate coal analysis,
is expressed on a wet coal basis, as Kg H2O/Kg wet coal. The moisture contents in
Figures 3 and 4 rely on this definition. For purposes of theoretical predictions of coal
moisture and analysis of dryer test data, it is much more convenient to express the
moisture on a dry coal basis, Γ, as Kg H2O/Kg dry coal. Figures 7 to 11, 14, 17, 21, 24
and 27 express coal moisture on a dry basis. The parameters Y and Γ are related by
the following equation.
Γ+Γ=
1Y
)mm/(mY where DCOHOH 22+≡
DCOH m/m2
≡Γ Figure A1 shows the relationship between Y and Γ.
Figure A1: R
ΓΓΓΓ
A-1
0.1 0.2 0.3
Γ (kg H2O/kg dry c
H20 dc
y=mH2O/(mdc+mH2O)
elationship Between Two Differ
ΓΓΓΓ
ΓΓΓΓ
0.4 0.5 0.6 0.7
oal)
ent Definitions of Coal Moisture
Related Documents


