Emerging Infectious Diseases • Vol. 8, No. 8, August 2002 753 RESEARCH Use of Automated Ambulatory- Care Encounter Records for Detection of Acute Illness Clusters, Including Potential Bioterrorism Events Ross Lazarus,*† Ken Kleinman,‡§ Inna Dashevsky,‡ Courtney Adams,‡ Patricia Kludt,¶ Alfred DeMaria, Jr.,¶ and Richard Platt*‡§ The advent of domestic bioterrorism has emphasized the need for enhanced detection of clusters of acute illness. We describe a monitoring system operational in eastern Massachusetts, based on diagnoses obtained from electronic records of ambulatory-care encounters. Within 24 hours, ambulatory and tele- phone encounters recording patients with diagnoses of interest are identified and merged into major syn- drome groups. Counts of new episodes of illness, rates calculated from health insurance records, and estimates of the probability of observing at least this number of new episodes are reported for syndrome surveillance. Census tracts with unusually large counts are identified by comparing observed with expected syndrome frequencies. During 1996–1999, weekly counts of new cases of lower respiratory syn- drome were highly correlated with weekly hospital admissions. This system complements emergency room- and hospital-based surveillance by adding the capacity to rapidly identify clusters of illness, includ- ing potential bioterrorism events. apid identification of unusual clusters of acute illness in the general population is a fundamental challenge for public health surveillance (1). Recent distribution of Bacillus anthracis spores and the resulting occurrence of clinical dis- ease (2) provide new impetus to developing and implementing surveillance systems that can identify both bioterrorism events and naturally occurring illness clusters, such as influenza and waterborne disease. Recognizing individual cases of infection, e.g., inhalational anthrax, requires astute and alert clinicians. However, many potential biological agents of terrorism, including anthrax, have nonspecific prodromal phases, and no explicit diagnosis is ever made for many other syndromes of potential importance. Recognizing these clusters at the earliest possible opportunity will require well-designed surveillance systems to ensure timely detection of unusual clusters of pro- dromal, nonspecific illness. Several projects have been developed specifically to pro- vide improved surveillance for detecting bioterrorism in urban populations (3). Some of these existing surveillance systems operate in emergency departments and hospitals (4). While these systems are very useful, implementation may be impeded by the effort required for timely collection and analy- sis of diagnosis data in a suitable format. Additionally, emer- gency rooms and hospitals may see increased numbers of cases days after the first, milder symptoms of disease bring new patients to ambulatory-care settings. Surveillance systems based in ambulatory-care settings, particularly those based on automated medical records, may therefore provide worthwhile additional information. One of the best-known such systems is the Department of Defense Electronic Surveillance System for the Early Notification of Community-based Epidemics (ESSENCE) system (5), which is based on encounter data from health services operated by the Department of Defense. Another such system is operating in Minnesota (6). Nurse hot lines have also been used for sur- veillance purposes (7). We describe here an automated system developed in a part- nership between the Centers for Disease Control and Preven- tion, the Massachusetts Department of Public Health, a large group practice, a health plan, and an academic department. The system produces next-day information about illness clus- ters, based on ambulatory-care visits and telephone calls. Methods The utility of diagnoses from automated ambulatory encounter data for detecting respiratory disease clusters has been described (8). In this report, we extend the use of encoun- ter data to produce daily surveillance summary reports cover- ing a broad range of syndromes for use by public health officials and health-care providers. The encounter data come from an electronic medical record system used by Harvard Vanguard Medical Associates, *Brigham and Women’s Hospital, Harvard Medical School, Boston, Massachusetts, USA; †University of Sydney School of Public Health, Sydney, Australia; ‡Harvard Medical School, Harvard Pilgrim Health Care and Harvard Vanguard Medical Associates, Boston, Massachu- setts, USA; §CDC Eastern Massachusetts Prevention Epicenter and HMO Research Network Center for Education and Research in Thera- peutics, Boston, Massachusetts, USA; and ¶Massachusetts Depart- ment of Public Health, Boston, Massachusetts, USA R

Welcome message from author
This document is posted to help you gain knowledge. Please leave a comment to let me know what you think about it! Share it to your friends and learn new things together.
Transcript
Emerging Infectious Diseases • Vol. 8, No. 8, August 2002 753
RESEARCH
Use of Automated Ambulatory-Care Encounter Records for Detection of Acute Illness
Clusters, Including Potential Bioterrorism Events
Ross Lazarus,*† Ken Kleinman,‡§ Inna Dashevsky,‡ Courtney Adams,‡ Patricia Kludt,¶ Alfred DeMaria, Jr.,¶ and Richard Platt*‡§
The advent of domestic bioterrorism has emphasized the need for enhanced detection of clusters of acuteillness. We describe a monitoring system operational in eastern Massachusetts, based on diagnosesobtained from electronic records of ambulatory-care encounters. Within 24 hours, ambulatory and tele-phone encounters recording patients with diagnoses of interest are identified and merged into major syn-drome groups. Counts of new episodes of illness, rates calculated from health insurance records, andestimates of the probability of observing at least this number of new episodes are reported for syndromesurveillance. Census tracts with unusually large counts are identified by comparing observed withexpected syndrome frequencies. During 1996–1999, weekly counts of new cases of lower respiratory syn-drome were highly correlated with weekly hospital admissions. This system complements emergencyroom- and hospital-based surveillance by adding the capacity to rapidly identify clusters of illness, includ-ing potential bioterrorism events.
apid identification of unusual clusters of acute illness inthe general population is a fundamental challenge for
public health surveillance (1). Recent distribution of Bacillusanthracis spores and the resulting occurrence of clinical dis-ease (2) provide new impetus to developing and implementingsurveillance systems that can identify both bioterrorism eventsand naturally occurring illness clusters, such as influenza andwaterborne disease. Recognizing individual cases of infection,e.g., inhalational anthrax, requires astute and alert clinicians.However, many potential biological agents of terrorism,including anthrax, have nonspecific prodromal phases, and noexplicit diagnosis is ever made for many other syndromes ofpotential importance. Recognizing these clusters at the earliestpossible opportunity will require well-designed surveillancesystems to ensure timely detection of unusual clusters of pro-dromal, nonspecific illness.
Several projects have been developed specifically to pro-vide improved surveillance for detecting bioterrorism in urbanpopulations (3). Some of these existing surveillance systemsoperate in emergency departments and hospitals (4). Whilethese systems are very useful, implementation may beimpeded by the effort required for timely collection and analy-
sis of diagnosis data in a suitable format. Additionally, emer-gency rooms and hospitals may see increased numbers ofcases days after the first, milder symptoms of disease bringnew patients to ambulatory-care settings.
Surveillance systems based in ambulatory-care settings,particularly those based on automated medical records, maytherefore provide worthwhile additional information. One ofthe best-known such systems is the Department of DefenseElectronic Surveillance System for the Early Notification ofCommunity-based Epidemics (ESSENCE) system (5), whichis based on encounter data from health services operated bythe Department of Defense. Another such system is operatingin Minnesota (6). Nurse hot lines have also been used for sur-veillance purposes (7).
We describe here an automated system developed in a part-nership between the Centers for Disease Control and Preven-tion, the Massachusetts Department of Public Health, a largegroup practice, a health plan, and an academic department.The system produces next-day information about illness clus-ters, based on ambulatory-care visits and telephone calls.
MethodsThe utility of diagnoses from automated ambulatory
encounter data for detecting respiratory disease clusters hasbeen described (8). In this report, we extend the use of encoun-ter data to produce daily surveillance summary reports cover-ing a broad range of syndromes for use by public healthofficials and health-care providers.
The encounter data come from an electronic medicalrecord system used by Harvard Vanguard Medical Associates,
*Brigham and Women’s Hospital, Harvard Medical School, Boston,Massachusetts, USA; †University of Sydney School of Public Health,Sydney, Australia; ‡Harvard Medical School, Harvard Pilgrim HealthCare and Harvard Vanguard Medical Associates, Boston, Massachu-setts, USA; §CDC Eastern Massachusetts Prevention Epicenter andHMO Research Network Center for Education and Research in Thera-peutics, Boston, Massachusetts, USA; and ¶Massachusetts Depart-ment of Public Health, Boston, Massachusetts, USA
R
RESEARCH
754 Emerging Infectious Diseases • Vol. 8, No. 8, August 2002
a large multispecialty group practice, to record all ambulatory-care encounters, including telephone contacts, regular visits,and urgent-care encounters, but not emergency room visits.The practice serves approximately 250,000 members, repre-senting approximately 10% of the population of eastern Mas-sachusetts.
The automated record system is a commercial product(Epicare; Epic Systems Corporation, Madison, Wisconsin;available from: URL: http://www.epicsys.com) used by manylarge medical groups. It represents a valuable source of sur-veillance data because it operates in real time (i.e., records areupdated as information is entered). Additionally, to the extentthat practices engage in some form of prepaid care, the popula-tion served can be explicitly enumerated; the surveillancereport described below is restricted to approximately 175,000members of Harvard Pilgrim Health Care, a principal healthmaintenance organization in the region. These persons consti-tute a defined population that receives essentially all its ambu-latory care in this practice. Demographic information andaddresses are available for all these persons. At the time ofconsultation, clinical diagnoses are assigned for each encoun-ter by the clinician, who chooses from lists of terms on theencounter screen; essentially all episodes are coded by the endof the same day on which care is given. Although an unlimitednumber of codes can be chosen, approximately 90% ofencounters have three or fewer codes assigned (8), stored asICD-9 codes. Each night, an extract is created of all encountersrecorded in the previous 24 hours with any of >1,500 ICD-9codes in any of the syndrome categories. The patient's temper-ature is also recorded along with the ICD-9 codes. Demo-graphic data are merged with each record through a link to thepatient’s membership record.
As a way of grouping insured persons into neighborhoods,the addresses of the insured plan members, obtained from theHMO's data, have been coded by Geographic Information Sys-tem (Mapping Analytics, Rochester, NY) to determine the cen-sus tracts of their residences (9,10).
Developing and Defining SyndromesPatient encounters are categorized into syndrome groups
according to the ICD-9 codes assigned at the time of consulta-tion. The surveillance software considers each encounterrecord in turn and merges related ICD-9 diagnosis codes intosyndrome groups by using a modification of a provisionalclassification scheme developed as part of the ESSENCEproject (5). This scheme reduces the complexity of the ICD-9into eight syndrome categories: coma/shock, neurologic, uppergastrointestinal, lower gastrointestinal, upper respiratory,lower respiratory, dermatologic, and sepsis/fever. We madetwo major modifications of the syndrome definitions: the num-ber of ambulatory episodes in the coma/shock category wasalmost zero in 4 years of data we examined, so it was com-bined with the neurologic syndrome category. A new syndro-mic category representing diagnoses of Centers for DiseaseControl and Prevention (CDC) bioterrorism category A agents
(11) (anthrax, botulism, plague, smallpox, tularemia, and hem-orrhagic fever) is reported separately. We also added an addi-tional influenza-like illness category, defined by the CDCsentinel surveillance definition of fever >37.8oC measured inthe office plus cough and/or sore throat in the absence of aknown cause (12).
An individual patient may have multiple encounters asso-ciated with a single episode of illness (e.g., initial consultation,consultation 1–2 days later for laboratory results, and follow-up consultation a few weeks later) (8). To avoid double count-ing from this common pattern of ambulatory care, the firstencounter for each patient within any single syndrome group isreported, but subsequent encounters with the same syndromeare not reported as new episodes until >6 weeks has elapsedsince the most recent encounter in the same syndrome. Wehave reported that grouping respiratory illness visits into epi-sodes reduces the total number of events by 38% in this clini-cal setting (8). This practice of grouping clinical encountersinto episodes of illness occurs independently for different syn-dromes. For example, a patient could qualify for two differentsyndromes on a single visit if codes for cough (lower respira-tory syndrome) and diarrhea (lower gastrointestinal syndrome)are assigned at the same visit; or a lower gastrointestinal syn-drome episode could begin a few days after the start of a lowerrespiratory syndrome episode.
Reporting ResultsA daily surveillance summary report (Tables 1 and 2; Fig-
ure 1) was designed in collaboration with staff from the Mas-sachusetts Department of Public Health and the medicalgroup's administration, which has operated since it was imple-mented on October 25, 2001. The aim of the report was toidentify any unusually large numbers of episodes of illnesswithin the ambulatory-care system. The current version (Table1) shows new episode counts and rates (per 1,000 insured per-sons) for all syndromes combined and for each individual syn-drome, during the previous day. Mean rates are presented forthe same day of the week in the same month of the previous 2years, as well as the statistical probability associated withthese counts derived from a generalized linear mixed model(described in the Models and Analysis section) for the fourmost common syndromes.
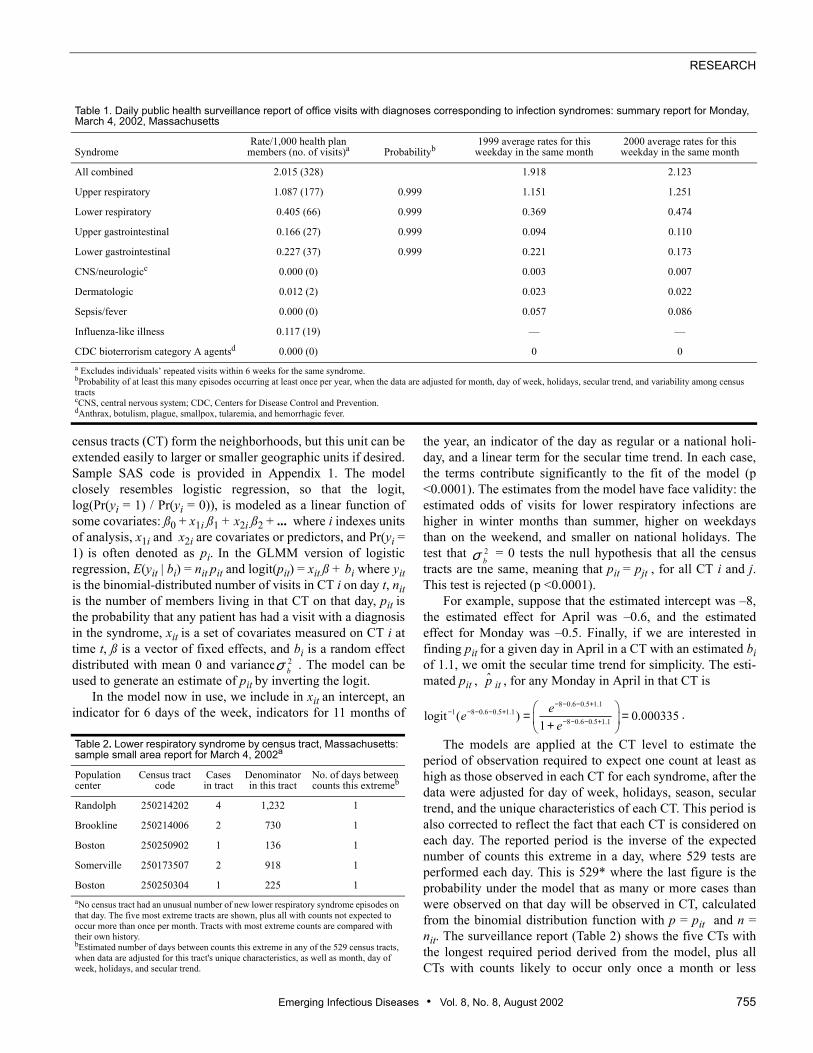
Each day's report also includes a list and maps of the resi-dence locations of cases with respiratory and gastrointestinalsyndromes (Tables 1 and 2; Figure 1). The list and the mapboth show the five census tracts in the region with the mostimprobably large number of new episodes, based on the statis-tical model described. Daily updates are disseminated toauthorized persons through a password-protected area on aSecure Sockets Layer (SSL) (13,14) encrypted website.
Models and AnalysisFor each syndrome, we used a generalized linear mixed
model (GLMM) (15–17) to model the daily counts from localneighborhoods over a 4-year historical period. In our model,
Emerging Infectious Diseases • Vol. 8, No. 8, August 2002 755
RESEARCH
census tracts (CT) form the neighborhoods, but this unit can beextended easily to larger or smaller geographic units if desired.Sample SAS code is provided in Appendix 1. The modelclosely resembles logistic regression, so that the logit,log(Pr(yi = 1) / Pr(yi = 0)), is modeled as a linear function ofsome covariates: ß0 + x1i ß1 + x2i ß2 + ... where i indexes unitsof analysis, x1i and x2i are covariates or predictors, and Pr(yi =1) is often denoted as pi. In the GLMM version of logisticregression, E(yit | bi) = nit pit and logit(pit) = xit ß + bi where yitis the binomial-distributed number of visits in CT i on day t, nitis the number of members living in that CT on that day, pit isthe probability that any patient has had a visit with a diagnosisin the syndrome, xit is a set of covariates measured on CT i attime t, ß is a vector of fixed effects, and bi is a random effectdistributed with mean 0 and variance . The model can beused to generate an estimate of pit by inverting the logit.
In the model now in use, we include in xit an intercept, anindicator for 6 days of the week, indicators for 11 months of
the year, an indicator of the day as regular or a national holi-day, and a linear term for the secular time trend. In each case,the terms contribute significantly to the fit of the model (p<0.0001). The estimates from the model have face validity: theestimated odds of visits for lower respiratory infections arehigher in winter months than summer, higher on weekdaysthan on the weekend, and smaller on national holidays. Thetest that = 0 tests the null hypothesis that all the censustracts are the same, meaning that pit = pjt , for all CT i and j.This test is rejected (p <0.0001).
For example, suppose that the estimated intercept was –8,the estimated effect for April was –0.6, and the estimatedeffect for Monday was –0.5. Finally, if we are interested infinding pit for a given day in April in a CT with an estimated biof 1.1, we omit the secular time trend for simplicity. The esti-mated pit , it , for any Monday in April in that CT is
The models are applied at the CT level to estimate theperiod of observation required to expect one count at least ashigh as those observed in each CT for each syndrome, after thedata were adjusted for day of week, holidays, season, seculartrend, and the unique characteristics of each CT. This period isalso corrected to reflect the fact that each CT is considered oneach day. The reported period is the inverse of the expectednumber of counts this extreme in a day, where 529 tests areperformed each day. This is 529* where the last figure is theprobability under the model that as many or more cases thanwere observed on that day will be observed in CT, calculatedfrom the binomial distribution function with p = pit and n =nit. The surveillance report (Table 2) shows the five CTs withthe longest required period derived from the model, plus allCTs with counts likely to occur only once a month or less
p̂2bσ
8 0.6 0.5 1.11 8 0.6 0.5 1.1
8 0.6 0.5 1.1logit ( ) 0.0003351
eee
− − − +− − − − +
− − − +
= = +
Table 1. Daily public health surveillance report of office visits with diagnoses corresponding to infection syndromes: summary report for Monday, March 4, 2002, Massachusetts
SyndromeRate/1,000 health plan
members (no. of visits)a Probabilityb1999 average rates for this
weekday in the same month2000 average rates for this
weekday in the same month
All combined 2.015 (328) 1.918 2.123
Upper respiratory 1.087 (177) 0.999 1.151 1.251
Lower respiratory 0.405 (66) 0.999 0.369 0.474
Upper gastrointestinal 0.166 (27) 0.999 0.094 0.110
Lower gastrointestinal 0.227 (37) 0.999 0.221 0.173
CNS/neurologicc 0.000 (0) 0.003 0.007
Dermatologic 0.012 (2) 0.023 0.022
Sepsis/fever 0.000 (0) 0.057 0.086
Influenza-like illness 0.117 (19) — —
CDC bioterrorism category A agentsd 0.000 (0) 0 0a Excludes individuals’ repeated visits within 6 weeks for the same syndrome.bProbability of at least this many episodes occurring at least once per year, when the data are adjusted for month, day of week, holidays, secular trend, and variability among census tractscCNS, central nervous system; CDC, Centers for Disease Control and Prevention.dAnthrax, botulism, plague, smallpox, tularemia, and hemorrhagic fever.
Table 2. Lower respiratory syndrome by census tract, Massachusetts: sample small area report for March 4, 2002a
Population center
Census tract code
Cases in tract
Denominator in this tract
No. of days between counts this extremeb
Randolph 250214202 4 1,232 1
Brookline 250214006 2 730 1
Boston 250250902 1 136 1
Somerville 250173507 2 918 1
Boston 250250304 1 225 1aNo census tract had an unusual number of new lower respiratory syndrome episodes on that day. The five most extreme tracts are shown, plus all with counts not expected to occur more than once per month. Tracts with most extreme counts are compared with their own history.bEstimated number of days between counts this extreme in any of the 529 census tracts, when data are adjusted for this tract's unique characteristics, as well as month, day of week, holidays, and secular trend.
.
2bσ
RESEARCH
756 Emerging Infectious Diseases • Vol. 8, No. 8, August 2002
often. We present the model in this fashion so that large num-bers are unusual, rather than the smaller-is-more-unusual for-mat of the p-value. In addition, this format has the advantageof being measured in the time scale rather than the probabilityscale. A map of eastern Massachusetts shows the spatial rela-tionship between CTs highlighted each day (Figure 1).
We also used the model to generate the probability that acount as large or larger than the observed count would be seenover the whole surveillance area, after adjusting for day ofweek, holidays, season, and census tract variation. This adjust-ment is done by the same process as for the individual tractsexcept that the random effects are omitted. These values arealso then adjusted on a yearly basis to account for the fact thatthe probabilities are estimated every day. This estimate is sim-ply the probability that a count as or more extreme as theobserved one would be observed in 365 days. All the statisticalprocessing uses automated SAS (18) programs. The web inter-face was developed by using the Zope web application plat-form (19), which runs a Python (20) program to rewrite theSAS output files as linked web pages.
ValidationIn the absence of known bioterrorism events, one way of
validating the surveillance system is to compare the relation-ship between the substantial seasonal changes in disease inci-dence known to occur in the ambulatory-care setting (8) to theseasonal pattern in a reliable and independent source of datasuch as the hospital system. The lower respiratory syndromeincludes a range of diseases (8) commonly associated withadmission for an acute illness after a variable prodrome, sothis syndrome was chosen for comparison.
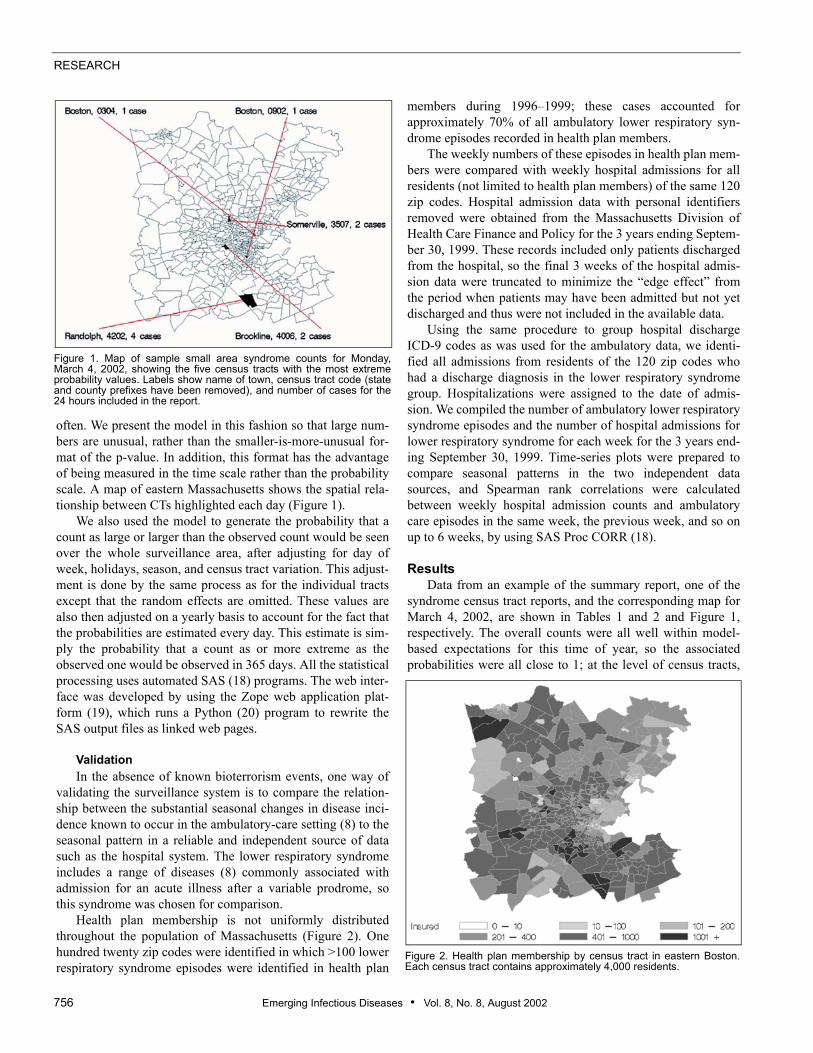
Health plan membership is not uniformly distributedthroughout the population of Massachusetts (Figure 2). Onehundred twenty zip codes were identified in which >100 lowerrespiratory syndrome episodes were identified in health plan
members during 1996–1999; these cases accounted forapproximately 70% of all ambulatory lower respiratory syn-drome episodes recorded in health plan members.
The weekly numbers of these episodes in health plan mem-bers were compared with weekly hospital admissions for allresidents (not limited to health plan members) of the same 120zip codes. Hospital admission data with personal identifiersremoved were obtained from the Massachusetts Division ofHealth Care Finance and Policy for the 3 years ending Septem-ber 30, 1999. These records included only patients dischargedfrom the hospital, so the final 3 weeks of the hospital admis-sion data were truncated to minimize the “edge effect” fromthe period when patients may have been admitted but not yetdischarged and thus were not included in the available data.
Using the same procedure to group hospital dischargeICD-9 codes as was used for the ambulatory data, we identi-fied all admissions from residents of the 120 zip codes whohad a discharge diagnosis in the lower respiratory syndromegroup. Hospitalizations were assigned to the date of admis-sion. We compiled the number of ambulatory lower respiratorysyndrome episodes and the number of hospital admissions forlower respiratory syndrome for each week for the 3 years end-ing September 30, 1999. Time-series plots were prepared tocompare seasonal patterns in the two independent datasources, and Spearman rank correlations were calculatedbetween weekly hospital admission counts and ambulatorycare episodes in the same week, the previous week, and so onup to 6 weeks, by using SAS Proc CORR (18).
ResultsData from an example of the summary report, one of the
syndrome census tract reports, and the corresponding map forMarch 4, 2002, are shown in Tables 1 and 2 and Figure 1,respectively. The overall counts were all well within model-based expectations for this time of year, so the associatedprobabilities were all close to 1; at the level of census tracts,
Figure 1. Map of sample small area syndrome counts for Monday,March 4, 2002, showing the five census tracts with the most extremeprobability values. Labels show name of town, census tract code (stateand county prefixes have been removed), and number of cases for the24 hours included in the report.
Figure 2. Health plan membership by census tract in eastern Boston.Each census tract contains approximately 4,000 residents.
Emerging Infectious Diseases • Vol. 8, No. 8, August 2002 757
RESEARCH
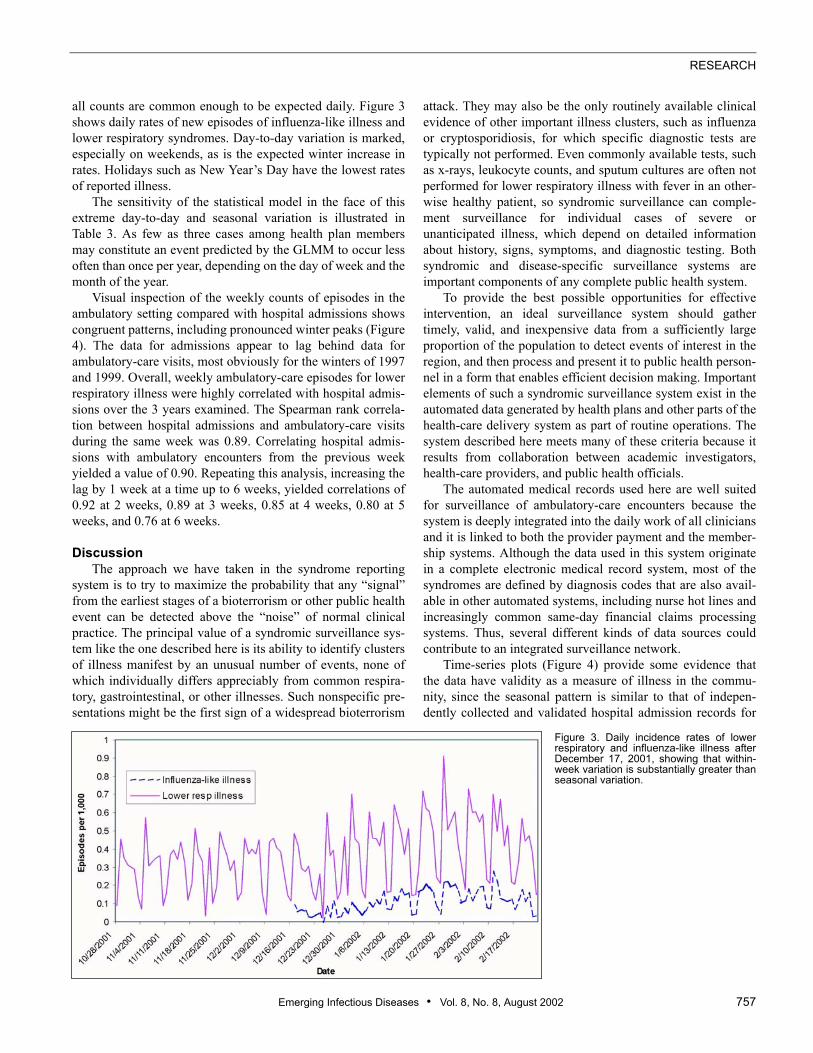
all counts are common enough to be expected daily. Figure 3shows daily rates of new episodes of influenza-like illness andlower respiratory syndromes. Day-to-day variation is marked,especially on weekends, as is the expected winter increase inrates. Holidays such as New Year’s Day have the lowest ratesof reported illness.
The sensitivity of the statistical model in the face of thisextreme day-to-day and seasonal variation is illustrated inTable 3. As few as three cases among health plan membersmay constitute an event predicted by the GLMM to occur lessoften than once per year, depending on the day of week and themonth of the year.
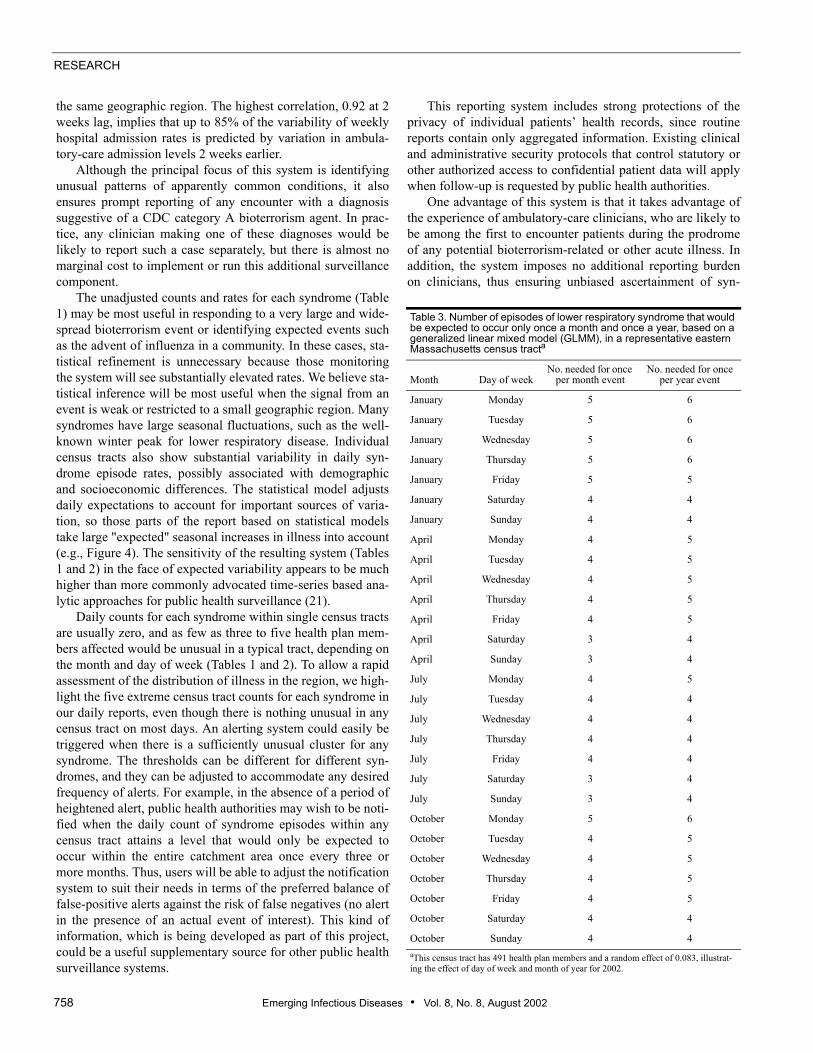
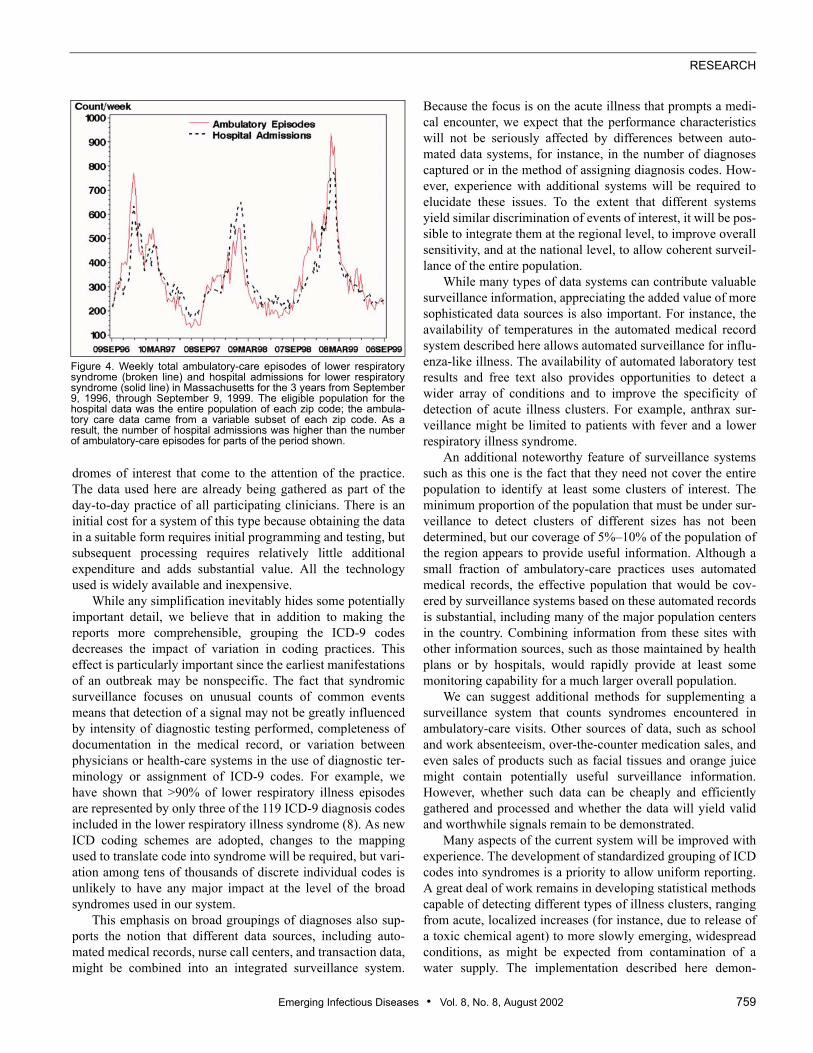
Visual inspection of the weekly counts of episodes in theambulatory setting compared with hospital admissions showscongruent patterns, including pronounced winter peaks (Figure4). The data for admissions appear to lag behind data forambulatory-care visits, most obviously for the winters of 1997and 1999. Overall, weekly ambulatory-care episodes for lowerrespiratory illness were highly correlated with hospital admis-sions over the 3 years examined. The Spearman rank correla-tion between hospital admissions and ambulatory-care visitsduring the same week was 0.89. Correlating hospital admis-sions with ambulatory encounters from the previous weekyielded a value of 0.90. Repeating this analysis, increasing thelag by 1 week at a time up to 6 weeks, yielded correlations of0.92 at 2 weeks, 0.89 at 3 weeks, 0.85 at 4 weeks, 0.80 at 5weeks, and 0.76 at 6 weeks.
DiscussionThe approach we have taken in the syndrome reporting
system is to try to maximize the probability that any “signal”from the earliest stages of a bioterrorism or other public healthevent can be detected above the “noise” of normal clinicalpractice. The principal value of a syndromic surveillance sys-tem like the one described here is its ability to identify clustersof illness manifest by an unusual number of events, none ofwhich individually differs appreciably from common respira-tory, gastrointestinal, or other illnesses. Such nonspecific pre-sentations might be the first sign of a widespread bioterrorism
attack. They may also be the only routinely available clinicalevidence of other important illness clusters, such as influenzaor cryptosporidiosis, for which specific diagnostic tests aretypically not performed. Even commonly available tests, suchas x-rays, leukocyte counts, and sputum cultures are often notperformed for lower respiratory illness with fever in an other-wise healthy patient, so syndromic surveillance can comple-ment surveillance for individual cases of severe orunanticipated illness, which depend on detailed informationabout history, signs, symptoms, and diagnostic testing. Bothsyndromic and disease-specific surveillance systems areimportant components of any complete public health system.
To provide the best possible opportunities for effectiveintervention, an ideal surveillance system should gathertimely, valid, and inexpensive data from a sufficiently largeproportion of the population to detect events of interest in theregion, and then process and present it to public health person-nel in a form that enables efficient decision making. Importantelements of such a syndromic surveillance system exist in theautomated data generated by health plans and other parts of thehealth-care delivery system as part of routine operations. Thesystem described here meets many of these criteria because itresults from collaboration between academic investigators,health-care providers, and public health officials.
The automated medical records used here are well suitedfor surveillance of ambulatory-care encounters because thesystem is deeply integrated into the daily work of all cliniciansand it is linked to both the provider payment and the member-ship systems. Although the data used in this system originatein a complete electronic medical record system, most of thesyndromes are defined by diagnosis codes that are also avail-able in other automated systems, including nurse hot lines andincreasingly common same-day financial claims processingsystems. Thus, several different kinds of data sources couldcontribute to an integrated surveillance network.
Time-series plots (Figure 4) provide some evidence thatthe data have validity as a measure of illness in the commu-nity, since the seasonal pattern is similar to that of indepen-dently collected and validated hospital admission records for
Figure 3. Daily incidence rates of lowerrespiratory and influenza-like illness afterDecember 17, 2001, showing that within-week variation is substantially greater thanseasonal variation.
RESEARCH
758 Emerging Infectious Diseases • Vol. 8, No. 8, August 2002
the same geographic region. The highest correlation, 0.92 at 2weeks lag, implies that up to 85% of the variability of weeklyhospital admission rates is predicted by variation in ambula-tory-care admission levels 2 weeks earlier.
Although the principal focus of this system is identifyingunusual patterns of apparently common conditions, it alsoensures prompt reporting of any encounter with a diagnosissuggestive of a CDC category A bioterrorism agent. In prac-tice, any clinician making one of these diagnoses would belikely to report such a case separately, but there is almost nomarginal cost to implement or run this additional surveillancecomponent.
The unadjusted counts and rates for each syndrome (Table1) may be most useful in responding to a very large and wide-spread bioterrorism event or identifying expected events suchas the advent of influenza in a community. In these cases, sta-tistical refinement is unnecessary because those monitoringthe system will see substantially elevated rates. We believe sta-tistical inference will be most useful when the signal from anevent is weak or restricted to a small geographic region. Manysyndromes have large seasonal fluctuations, such as the well-known winter peak for lower respiratory disease. Individualcensus tracts also show substantial variability in daily syn-drome episode rates, possibly associated with demographicand socioeconomic differences. The statistical model adjustsdaily expectations to account for important sources of varia-tion, so those parts of the report based on statistical modelstake large "expected" seasonal increases in illness into account(e.g., Figure 4). The sensitivity of the resulting system (Tables1 and 2) in the face of expected variability appears to be muchhigher than more commonly advocated time-series based ana-lytic approaches for public health surveillance (21).
Daily counts for each syndrome within single census tractsare usually zero, and as few as three to five health plan mem-bers affected would be unusual in a typical tract, depending onthe month and day of week (Tables 1 and 2). To allow a rapidassessment of the distribution of illness in the region, we high-light the five extreme census tract counts for each syndrome inour daily reports, even though there is nothing unusual in anycensus tract on most days. An alerting system could easily betriggered when there is a sufficiently unusual cluster for anysyndrome. The thresholds can be different for different syn-dromes, and they can be adjusted to accommodate any desiredfrequency of alerts. For example, in the absence of a period ofheightened alert, public health authorities may wish to be noti-fied when the daily count of syndrome episodes within anycensus tract attains a level that would only be expected tooccur within the entire catchment area once every three ormore months. Thus, users will be able to adjust the notificationsystem to suit their needs in terms of the preferred balance offalse-positive alerts against the risk of false negatives (no alertin the presence of an actual event of interest). This kind ofinformation, which is being developed as part of this project,could be a useful supplementary source for other public healthsurveillance systems.
This reporting system includes strong protections of theprivacy of individual patients’ health records, since routinereports contain only aggregated information. Existing clinicaland administrative security protocols that control statutory orother authorized access to confidential patient data will applywhen follow-up is requested by public health authorities.
One advantage of this system is that it takes advantage ofthe experience of ambulatory-care clinicians, who are likely tobe among the first to encounter patients during the prodromeof any potential bioterrorism-related or other acute illness. Inaddition, the system imposes no additional reporting burdenon clinicians, thus ensuring unbiased ascertainment of syn-
Table 3. Number of episodes of lower respiratory syndrome that would be expected to occur only once a month and once a year, based on a generalized linear mixed model (GLMM), in a representative eastern Massachusetts census tracta
Month Day of weekNo. needed for once
per month eventNo. needed for once
per year event
January Monday 5 6
January Tuesday 5 6
January Wednesday 5 6
January Thursday 5 6
January Friday 5 5
January Saturday 4 4
January Sunday 4 4
April Monday 4 5
April Tuesday 4 5
April Wednesday 4 5
April Thursday 4 5
April Friday 4 5
April Saturday 3 4
April Sunday 3 4
July Monday 4 5
July Tuesday 4 4
July Wednesday 4 4
July Thursday 4 4
July Friday 4 4
July Saturday 3 4
July Sunday 3 4
October Monday 5 6
October Tuesday 4 5
October Wednesday 4 5
October Thursday 4 5
October Friday 4 5
October Saturday 4 4
October Sunday 4 4aThis census tract has 491 health plan members and a random effect of 0.083, illustrat-ing the effect of day of week and month of year for 2002.
Emerging Infectious Diseases • Vol. 8, No. 8, August 2002 759
RESEARCH
dromes of interest that come to the attention of the practice.The data used here are already being gathered as part of theday-to-day practice of all participating clinicians. There is aninitial cost for a system of this type because obtaining the datain a suitable form requires initial programming and testing, butsubsequent processing requires relatively little additionalexpenditure and adds substantial value. All the technologyused is widely available and inexpensive.
While any simplification inevitably hides some potentiallyimportant detail, we believe that in addition to making thereports more comprehensible, grouping the ICD-9 codesdecreases the impact of variation in coding practices. Thiseffect is particularly important since the earliest manifestationsof an outbreak may be nonspecific. The fact that syndromicsurveillance focuses on unusual counts of common eventsmeans that detection of a signal may not be greatly influencedby intensity of diagnostic testing performed, completeness ofdocumentation in the medical record, or variation betweenphysicians or health-care systems in the use of diagnostic ter-minology or assignment of ICD-9 codes. For example, wehave shown that >90% of lower respiratory illness episodesare represented by only three of the 119 ICD-9 diagnosis codesincluded in the lower respiratory illness syndrome (8). As newICD coding schemes are adopted, changes to the mappingused to translate code into syndrome will be required, but vari-ation among tens of thousands of discrete individual codes isunlikely to have any major impact at the level of the broadsyndromes used in our system.
This emphasis on broad groupings of diagnoses also sup-ports the notion that different data sources, including auto-mated medical records, nurse call centers, and transaction data,might be combined into an integrated surveillance system.
Because the focus is on the acute illness that prompts a medi-cal encounter, we expect that the performance characteristicswill not be seriously affected by differences between auto-mated data systems, for instance, in the number of diagnosescaptured or in the method of assigning diagnosis codes. How-ever, experience with additional systems will be required toelucidate these issues. To the extent that different systemsyield similar discrimination of events of interest, it will be pos-sible to integrate them at the regional level, to improve overallsensitivity, and at the national level, to allow coherent surveil-lance of the entire population.
While many types of data systems can contribute valuablesurveillance information, appreciating the added value of moresophisticated data sources is also important. For instance, theavailability of temperatures in the automated medical recordsystem described here allows automated surveillance for influ-enza-like illness. The availability of automated laboratory testresults and free text also provides opportunities to detect awider array of conditions and to improve the specificity ofdetection of acute illness clusters. For example, anthrax sur-veillance might be limited to patients with fever and a lowerrespiratory illness syndrome.
An additional noteworthy feature of surveillance systemssuch as this one is the fact that they need not cover the entirepopulation to identify at least some clusters of interest. Theminimum proportion of the population that must be under sur-veillance to detect clusters of different sizes has not beendetermined, but our coverage of 5%–10% of the population ofthe region appears to provide useful information. Although asmall fraction of ambulatory-care practices uses automatedmedical records, the effective population that would be cov-ered by surveillance systems based on these automated recordsis substantial, including many of the major population centersin the country. Combining information from these sites withother information sources, such as those maintained by healthplans or by hospitals, would rapidly provide at least somemonitoring capability for a much larger overall population.
We can suggest additional methods for supplementing asurveillance system that counts syndromes encountered inambulatory-care visits. Other sources of data, such as schooland work absenteeism, over-the-counter medication sales, andeven sales of products such as facial tissues and orange juicemight contain potentially useful surveillance information.However, whether such data can be cheaply and efficientlygathered and processed and whether the data will yield validand worthwhile signals remain to be demonstrated.
Many aspects of the current system will be improved withexperience. The development of standardized grouping of ICDcodes into syndromes is a priority to allow uniform reporting.A great deal of work remains in developing statistical methodscapable of detecting different types of illness clusters, rangingfrom acute, localized increases (for instance, due to release ofa toxic chemical agent) to more slowly emerging, widespreadconditions, as might be expected from contamination of awater supply. The implementation described here demon-
Figure 4. Weekly total ambulatory-care episodes of lower respiratorysyndrome (broken line) and hospital admissions for lower respiratorysyndrome (solid line) in Massachusetts for the 3 years from September9, 1996, through September 9, 1999. The eligible population for thehospital data was the entire population of each zip code; the ambula-tory care data came from a variable subset of each zip code. As aresult, the number of hospital admissions was higher than the numberof ambulatory-care episodes for parts of the period shown.
RESEARCH
760 Emerging Infectious Diseases • Vol. 8, No. 8, August 2002
strates that existing electronic data developed in the course ofroutine medical care by a wide array of providers and healthplans can yield substantial improvements in current publichealth capabilities for assessment of bioterrorism and otheracute illness clusters.
Acknowledgment We thank J. Pavlin, Department of Defense Global Emerging
Infections System, for providing access to the ESSENCE project.
This project was supported by Grant Award U90/CCU116997from the Centers for Disease Control and Prevention/MassachusettsDepartment of Public Health Public Cooperative Agreement forHealth Preparedness and Response for Bioterrorism.
Dr. Lazarus is visiting associate professor of medicine at Har-vard, on leave from the Faculty of Medicine at the University of Syd-ney, Australia. He is an epidemiologist and information scientist,currently working on bioinformatics research and development inpublic health surveillance and in genome science at Harvard’s Chan-ning Laboratory.
Appendix 1We used this SAS code in fitting the generalized linear mixed
model (GLMM) that generates the parameter estimates used in ourreports. This SAS code relies on the GLIMMIX macro (17), whichhas been distributed by SAS (18) since version 6.12.
%glimmix ( data=test,procopt= noclprint covtest ,stmts=%str(class tract month dayofweek;model lri/pop=month dayofweek holiday day;random int/subject=tract solution type=un;),error=binomial);
The data set is structured to contain a row for each day in the his-torical period for each census tract. In the code, lri is the variable thatcontains the count for census tract tract on day day. Pop contains thenumber of subjects in the tract on that day. Month is the month of theday, dayofweek is the day of week of the day, and holiday indicateswhether the day is a national holiday. Days are standardized to pre-vent numerical difficulties with computation.
References 1. Baxter R, Rubin R, Steinberg C, Carroll C, Shapiro J, Yang A. Assessing
core capacity for infectious disease surveillance. Falls Church (VA): TheLewin Group, Inc., prepared for: Office of the Assistant Secretary forPlanning and Evaluation, Department of Health and Human Services;November 1, 2000.
2. Centers for Disease Control and Prevention. Update: investigation of anthraxassociated with intentional exposure and interim public health guidelines,October 2001. MMWR Morb Mortal Wkly Rep 2001;50:889–93.
3. Wagner M, Tsui F-C, Espino J, Dato V, Sittig D, Caruana R, et al. Theemerging science of very early detection of disease outbreaks. Journal ofPublic Health Management and Practice 2001;7:50–8.
4. Brinsfield K, Gunn J, Barry M, McKenna V, Dyer K, Sulis C. Using vol-ume-based surveillance for an outbreak early warning system. AcadEmerg Med 2001;8:492.
5. U.S. Department of Defense. Annual report, fiscal year 1999. SilverSpring (MD): Walter Reed Army Institute of Research; 1999.
6. Martinez B. Questions of security: healthpartners use reach, speedy datato hold watch for bioterrorism attacks. Wall Street Journal 2001 Nov 1,2001;Sect. A:10.
7. Rodman J, Frost F, Jakuboski W. Using nurse hot lines for disease sur-veillance. Emerg Infect Dis 1998;4:329–32.
8. Lazarus R, Kleinman K, Dashevsky I, DeMaria A, Platt R. Using auto-mated medical records for rapid identification of illness syndromes: theexample of lower respiratory infection. BioMed Central Public Health2001;1:1–9.
9. US Census Bureau. Geographic areas reference manual, chapter 10: cen-sus tracts and block numbering areas. Available from: URL: http://www.census.gov/geo/www/garm.html
10. Diez-Roux AV, Nieto FJ, Muntaner HA, Comstock GW, Shahar E, Coo-per LS, et al. Neighborhood environments and coronary heart disease: amultilevel analysis. Am J Epidemiol 1997;146:48–63.
11. Centers for Disease Control and Prevention. Biological and chemical ter-rorism: strategic plan for preparedness and response. MMWR MorbidMortal Wkly Rep 2000;49(RR-4):1–14.
12. Centers for Disease Control and Prevention. Detection and control ofinfluenza outbreaks in acute-care facilities. Available from: URL: http://www.cdc.gov/ncidod/hip/INFECT/flu_acute.htm
13. Open SSL Project. Open Secure Sockets Layer v. 2 2002. Available from:URL: http://www.openssl.org
14. Apache Software Foundation. Apache HTTP Server; 2002. Availablefrom: URL:http://www.apache.org
15. Breslow NE, Clayton DG. Approximate inference in generalized linearmixed models. J Am Stat Assn 1993;88:9–25.
16. Kleinschmidt I, Sharp B, Clarke G, Curtis B, Fraser C. Use of generalisedlinear mixed models in the spatial analysis of small-area malaria inci-dence rates in KwaZulu Natal, South Africa. Am J Epidemiol2001;153:1213–21.
17. Brown J. GLIMMIX macro. In: 8.0 ed. Cary (NC): SAS Institute; 1992.Available from: URL: http://ewe3.sas.com/techsup/download/stat/glmm800.sas
18. Statistical Analysis System. SAS PC, Version 8. Cary (NC): SAS Insti-tute; 2000.
19. Zope Corporation. Z Objects Programming Environment. Fredericksburg(VA): Zope Corporation, 2002. Available from: URL: http://www.zope.org
20. Rossum Gv. Python: Stichting Mathematisch Centrum, Amsterdam, TheNetherlands; 1990. Available from: URL: http://www.python.org
21. Williamson G, Hudson. A monitoring system for detecting aberrations inpublic health surveillance reports. Stat Med 1999;18:3283–98.
Address for correspondence: Ross Lazarus, Channing Laboratory, 181 Long-wood Ave, Boston, MA 02115, USA; fax: 617-525-0958; e-mail: [email protected]
Related Documents