Use Case Diagrams

Welcome message from author
This document is posted to help you gain knowledge. Please leave a comment to let me know what you think about it! Share it to your friends and learn new things together.
Transcript
Use Case Diagrams

Use cases modeling Overview
Motivation Communication between developers and users
Users don’t know system, developers don’t know users’ work Users’ requirement needs to be clearly defined agreement between user and developer is necessary.
Use case Visual model
both users and developers can easily understand

Use Case Modeling
system modeling from user’s perspective
A way to define functional requirements from user
Easy to understand
Normally done during system analysis step
Implementation issue is not considered
Increase the probability of making a system user really wants

Use Case Use case
A view to system seen from outside User’s requirements on system A set of scenario for an actor to achieve useful
works
Bank client Bank system
Withdraw
Transfer
Balance check
deposit

Basic Concepts
Actor An external person, process or thing interacting with a system,
subsystem, or class User Case
Each describes a possible kind of interaction between an actor and the system
Use cases are actions that a user takes on a system System
The entity that we are going to build Can have subsystems in it
Relationship Connection between actors and use cases or use cases and use cases. The first represents communication, the second represents higher level
relationship

Actors
a user of the system Can be a person or another system Identify the actors in terms of their roles – not
their names Actor is shown with a stick figure

Use Case Use cases are actions users take on the system can be very high level or so fine-grained that they
cannot contain any other functionality Use “verb” or “verb+noun” style naming Notation
Characteristics Describes how a system can be used by an actor Represents services provided by a system User requirements
borrow return
System
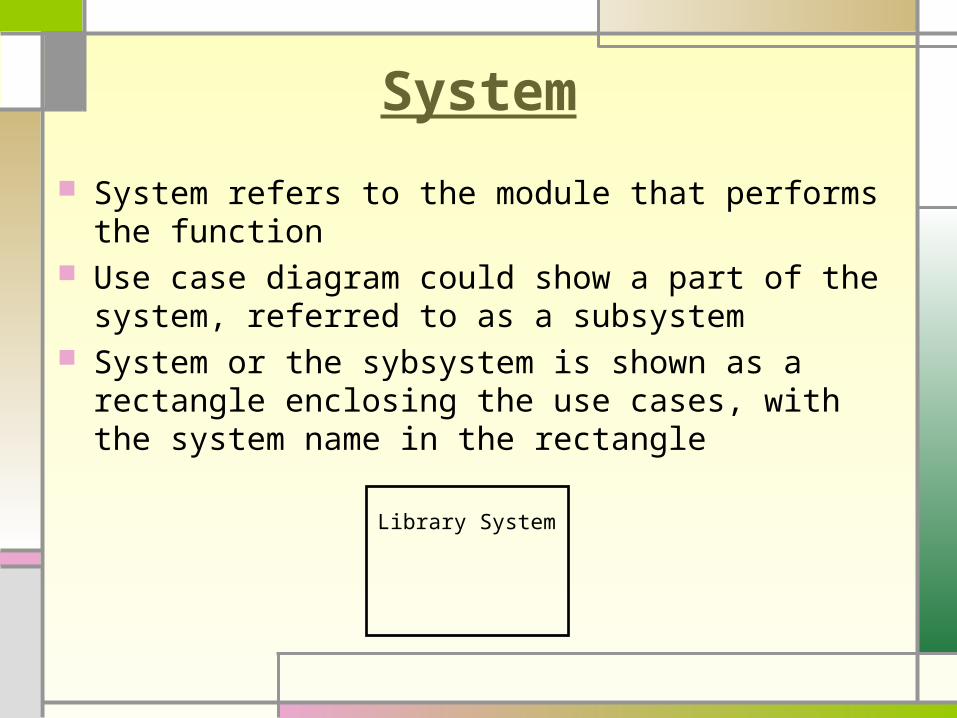
System refers to the module that performs the function
Use case diagram could show a part of the system, referred to as a subsystem
System or the sybsystem is shown as a rectangle enclosing the use cases, with the system name in the rectangle
Library System
Relationship (Use Case Diagram)
There are four kinds of relationships Association Extend Include generalization

Association Relationship
Shown by a line connecting actors to use cases An Actor can relate to many use cases and a use
case can relate to many actors

Include Relationship
Between a use case and another use case use case A includes the functionality of use case
B (has-a relationship)A B<<include>>
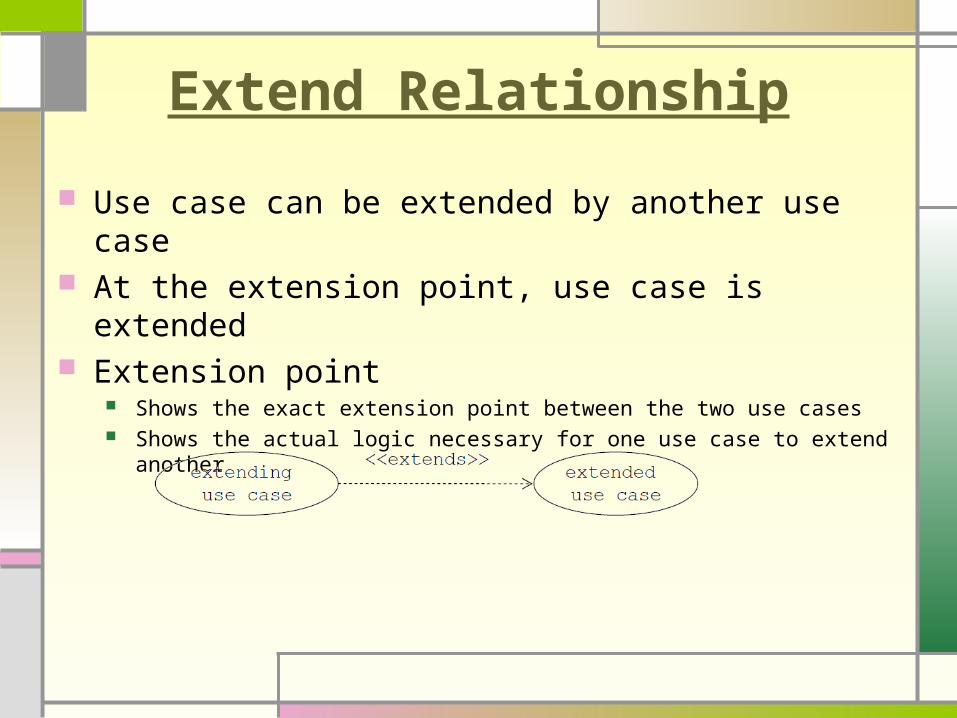
Extend Relationship
Use case can be extended by another use case At the extension point, use case is extended Extension point
Shows the exact extension point between the two use cases Shows the actual logic necessary for one use case to extend another

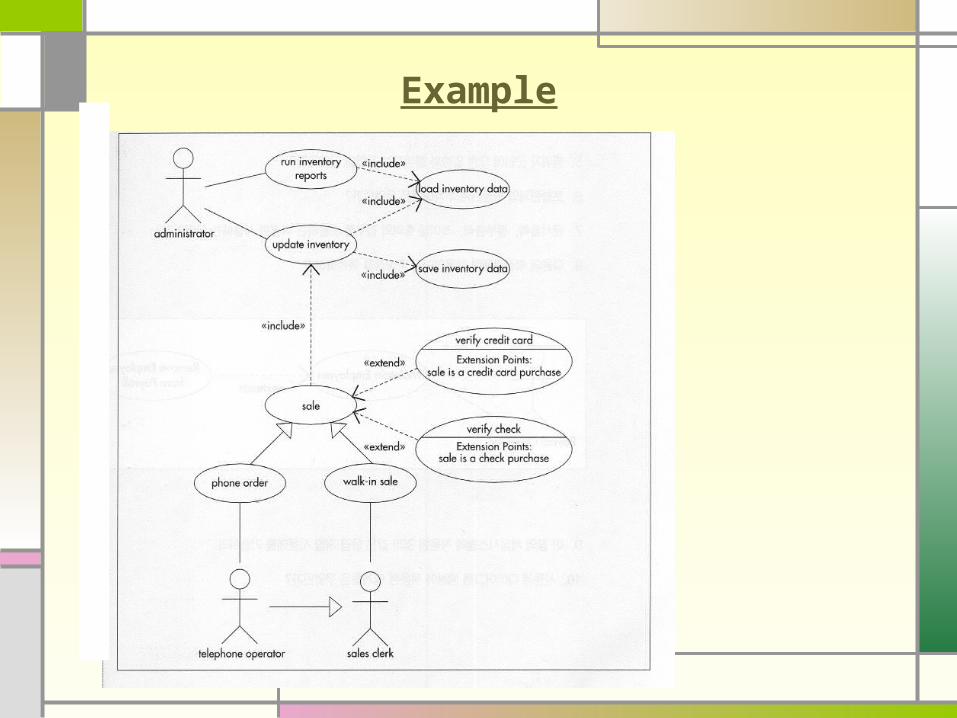
Example : Extend Relationship

Generalization Relationship
Indicate an inheritance of an item in UML Can be applied to actors as well as use cases

Creating Use Case Diagrams
There are five tasks involved in creating use case diagrams
1. Identify actors of the system. Identify use cases of the system. Identify the relationships.
2. Prioritize the use cases if necessary.
3. Detail each use case. Describe Basic flow and Alternative flows for each use case
4. Identify generalizations. Identify include relationships. Identify extend relationships.
5. Create use case diagram.

Example<Include 와 Extend 의 예 >

Example
Example

Example

Activity Diagram
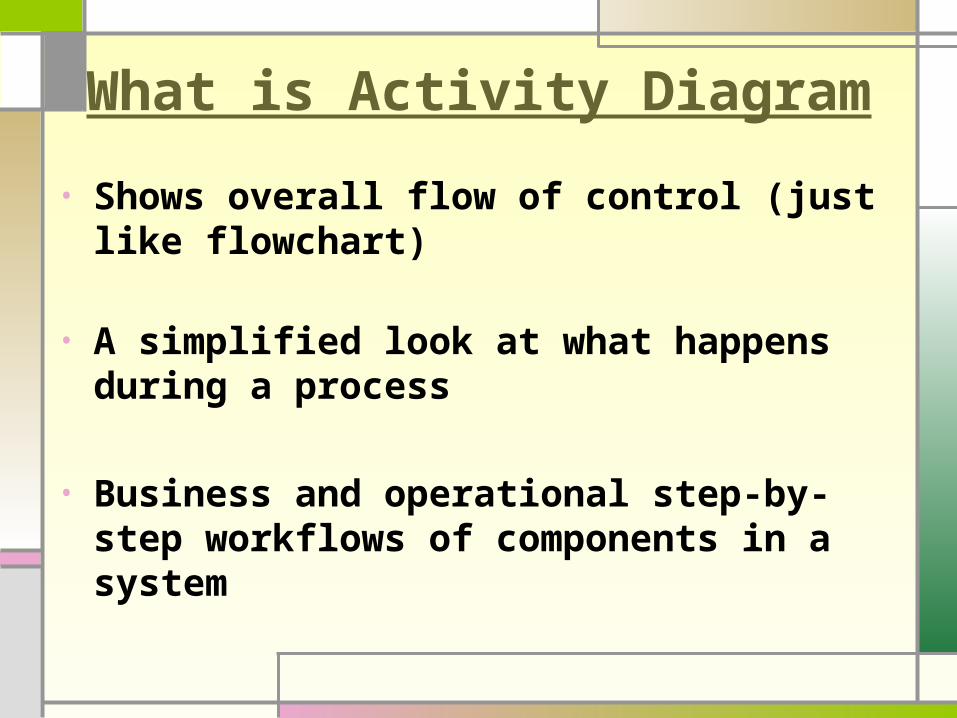
What is Activity Diagram
• Shows overall flow of control (just like flowchart)
• A simplified look at what happens during a process
• Business and operational step-by-step workflows of components in a system

Activity Diagram Notations

Decision
Activity1
Activity2
Wake Up
Eat Breakfast Go Back to Sleep
[hungry] [Not hungry]
Wake Up
Eat Breakfast Go Back to Sleep
[hungry] [Not hungry]
Transition from one activity to another Two ways of showing a decision

Concurrent Path , Signal
Work Out
Shower Relax
Television
Show New Channel
Change (channel)
Press Channel Number
Change(channel)
Remote.keyln(channel)
Watch
Concurrent Path
Signal : when received, the signal causes an activity to take place(send : convex , receive : concave )
Synchronization bar

Example of Activity Diagram
A Process : Creating a Document1. Open the word processing package
2. Create a file
3. Save the file under a unique name within its directory
4. Type the document
5. If graphics are necessary, open the graphics package, create the graphics, and paste the graphics into the document
6. If spreadsheet are necessary, open the spreadsheet package, create the spreadsheet, and paste the spreadsheet into the document
7. Save the file
8. Print a hard copy of the document
9. Exit the office suite

활동 다이어그램
Open Word Processing Package
Create File
Save File
Type the Document
Open and Use Graphics Package
Open and Use Spreedsheet
Save File
Print Hardcopy
Exit Office Suite
[graphics needed]
[graphics not needed]
[tables needed]
[tables not needed]

• show who has responsibility for each activity. (role)
1. A salesperson calls the client and sets up an appointment
2. Onsite appointment(In the consulting firm’s office)- corporate technicians prepare a conference room for a presentation
3. Offsite appointment(at the client’s office)- a consultant prepares a presentation on a laptop
4. The consultant and the salesperson meet with the client at the agreed-upon location and time
5. the salesperson follows up with a letter6. If the meeting has resulted in a statement of a problem,
thebenefit – the activities of each role are clarified
Swimlanes
9

Call client and set up appointment
Prepare a conferenceroom
Prepare a laptop
[appointment onsite] [appointment offsite]
Meet with the client
Send followup letter
Create proposal
Send proposal to client
See the Activity Diagramfor Creating a Document
[statement of problem]
[no statement problem]
10
AD

Call client and set up appointment
Prepare a conferenceroom
Prepare a laptop
[appointment onsite]
[appointment offsite]
Meet with the client
Send followup letter
Create proposal
Send proposal to client
[statement of problem]
[no statement problem]
See the Activity Diagramfor Creating a Document
Sales Person Consultant Corporate Technician
AD with Swimlane

Example

State Diagram
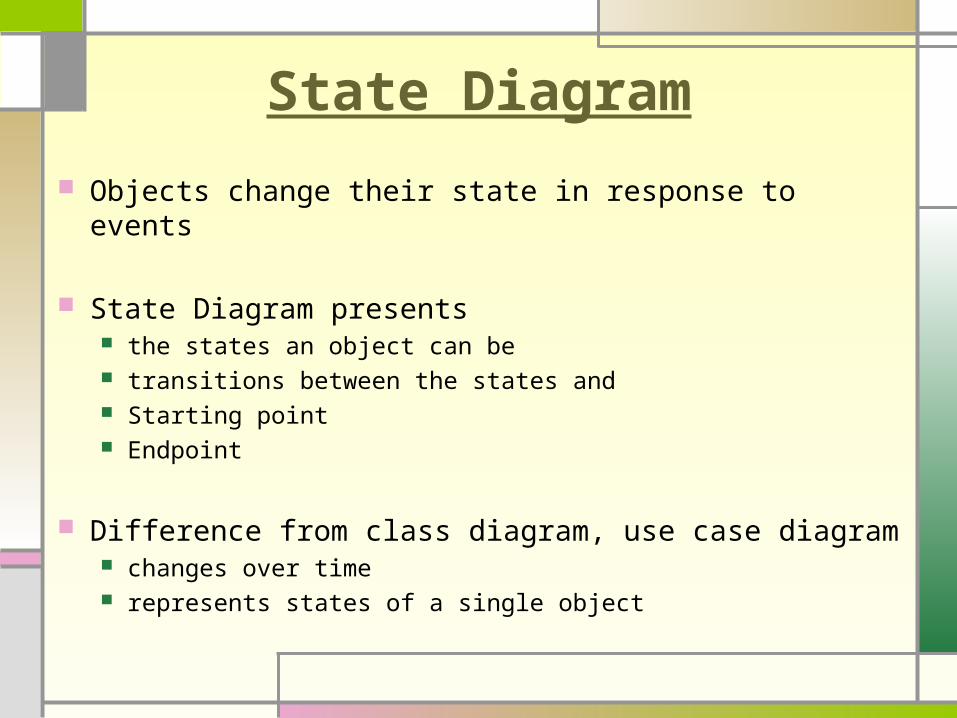
State Diagram
Objects change their state in response to events
State Diagram presents the states an object can be transitions between the states and Starting point Endpoint
Difference from class diagram, use case diagram changes over time represents states of a single object

State Diagram Components
State Icon, Transition, Starting Point, Endpoint
State Icon : State Name(Required), Activity Activity : Event and Action
entry : what happens when the system enters the state exit : what happens when the system leaves the state do : what happens while the system is in the state
Transition : Change states, arrow Occurs in response to trigger event Event and action => separated by ‘/’ triggerless transition guard condition => Boolean expression

Notation
state name
state variable
activity
event / action
or
[guard condition ]
Event / action
or
[guard condition]
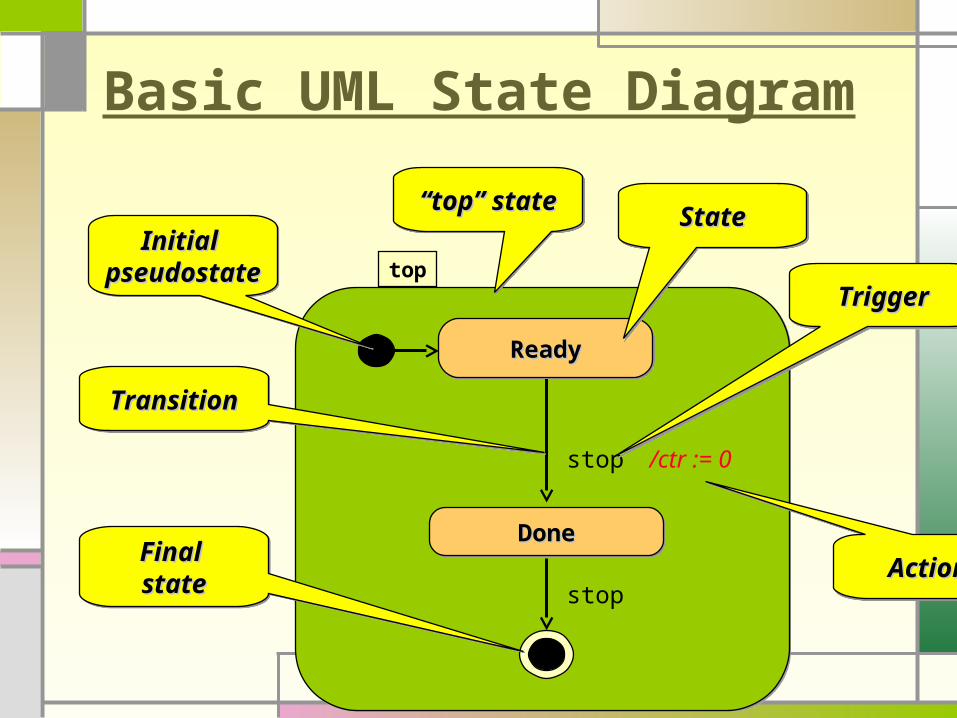
Basic UML State Diagram
top
ReadyReadyReadyReady
stop
/ctr := 0stop
StateStateStateState
TriggerTriggerTriggerTrigger
ActionActionActionAction
Initial Initial pseudostatepseudostate
Initial Initial pseudostatepseudostate
TransitionTransitionTransitionTransition
Final Final statestateFinal Final statestate
DoneDoneDoneDone
““top” statetop” state““top” statetop” state
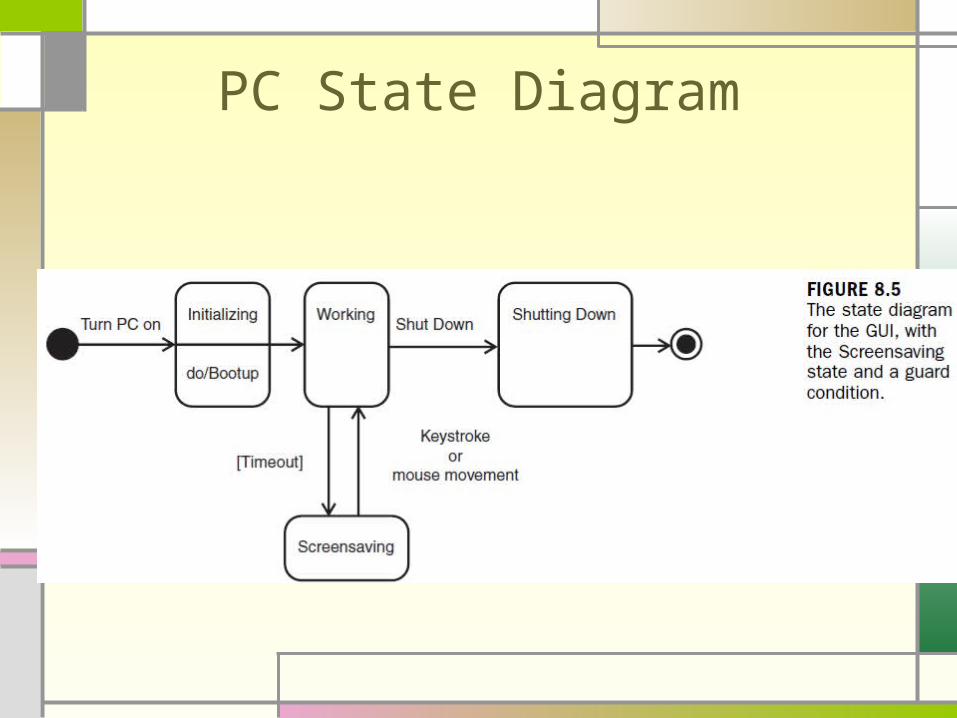
PC State Diagram

Example1 : flashing lamp
LampFlashingLampFlashingLampFlashingLampFlashing
11sec/sec/11sec/sec/
FlashOffFlashOffFlashOffFlashOff
entry/lamp.off()entry/lamp.off()
FlashOnFlashOnFlashOnFlashOn
entry/lamp.on()entry/lamp.on()offoff//
LampOffLampOffLampOffLampOff
entry/lamp.off()entry/lamp.off()
LampOnLampOnLampOnLampOn
entry/lamp.on()entry/lamp.on()
onon//
flashflash//
onon//
Default transition toDefault transition tothe initial pseudostatethe initial pseudostateDefault transition toDefault transition to
the initial pseudostatethe initial pseudostate
Group transitionGroup transitionGroup transitionGroup transition

Example2 : dialing
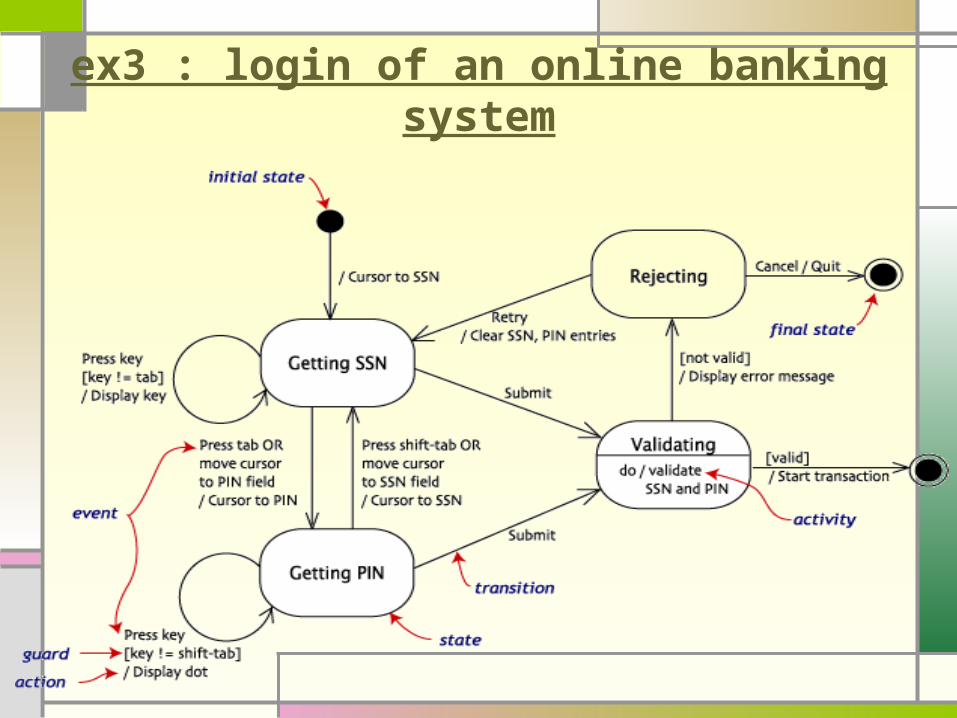
ex3 : login of an online banking system

Substates
Sequential substates
Concurrent substates

Activity Diagram vs State Diagram
State Diagram A clear picture of the changes in the
object’s state in a process
Activity Diagram Flow chart : flow of activity of a process

Sequence Diagram

Purpose of Sequence Diagram
to show the interactions between objects in the sequential order
shows the sequence of messages for a particular task from a use case diagram
Understand how objects in system interact with each other
Understand how use case(scenario) can be refined with detailed information
Use cases are often refined into one or more sequence diagrams

Sequence Diagram
Time, object, and message Lifeline and activation
:NameNotation
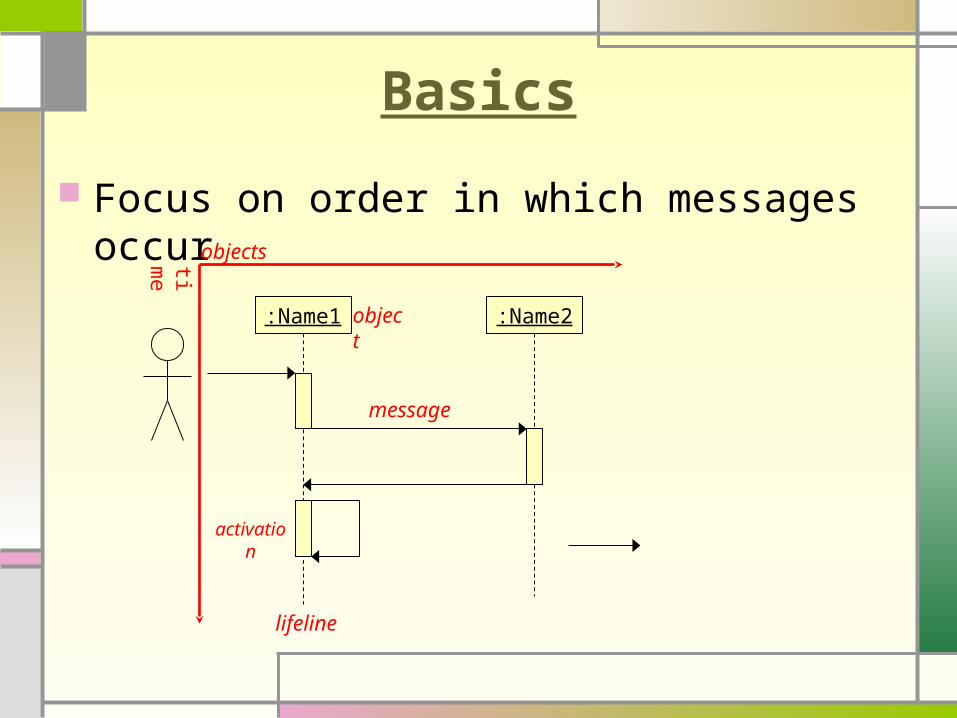
Basics
Focus on order in which messages occur
:Name1 :Name2
lifeline
activation
message
object
objectstime

Messages
The first message starts at the top, typically located on the left side
Subsequent messages are then added to the diagram slightly lower then the previous message
Messages can be sent to itself
: synchronous call operation : method on the arrow
: asynchronous signal
: return message (optional) : return value on the arrow

An example of messages being sent between objects
The system object calling its determineAvailableReports method

Synchronous vs asynchronous

guards
Used when a condition must be met for a message to be sent

Combined fragment
A combined fragment is used to group sets of messages together to show conditional flow in a sequence diagram
Alternatives Options loops

alternatives
Design mutually exclusive choice between two or more message sequences

option
Model a sequence that occur when a certain condition is satisfied

loops
model a repetitive sequence

Sequence diagram example
Object
Message
Activation
Time constraint
Comment
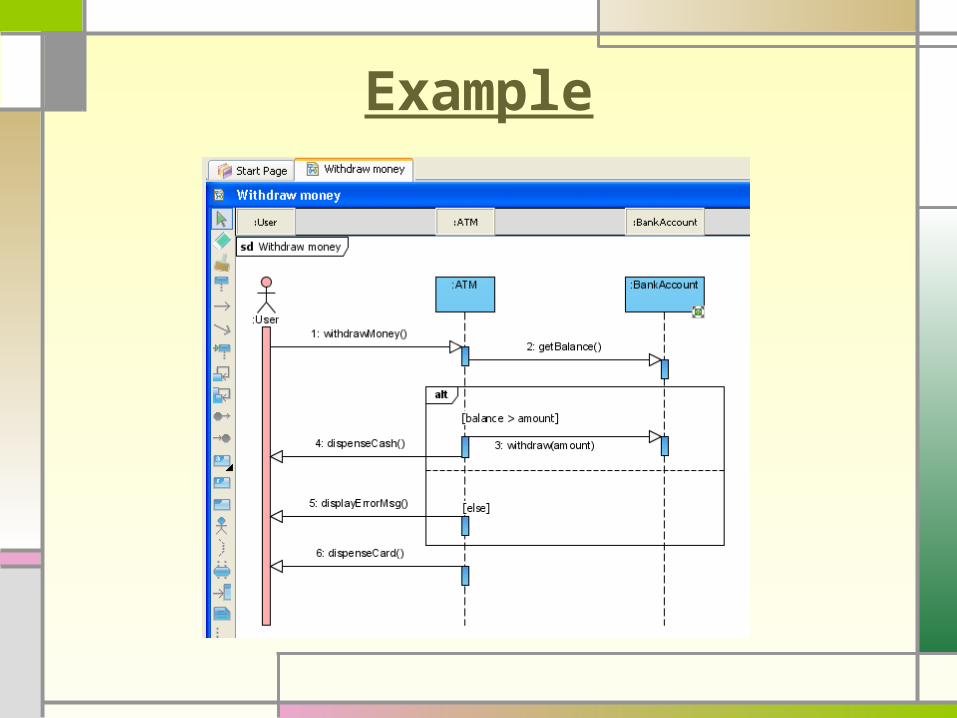
Example

Sequence Diagram : Why Useful?
shows the interaction logic between the objects in the system in the time order that the interactions take place.

Communication Diagram

Communication Diagram Class diagrams indicates what classes are part of our system,
what they offer, how they relate, but they don’t tell us how they communicate.
Communication diagrams show (used to model) how objects interact and their roles.
Similar to Sequence Diagrams. Communication Diagram := Class Diagram + Sequence diagram Sequence Diagrams are arranged according to Time. Communication Diagrams represent the structural
organization of object. Both Sequence and Communication diagrams are called
interaction diagrams
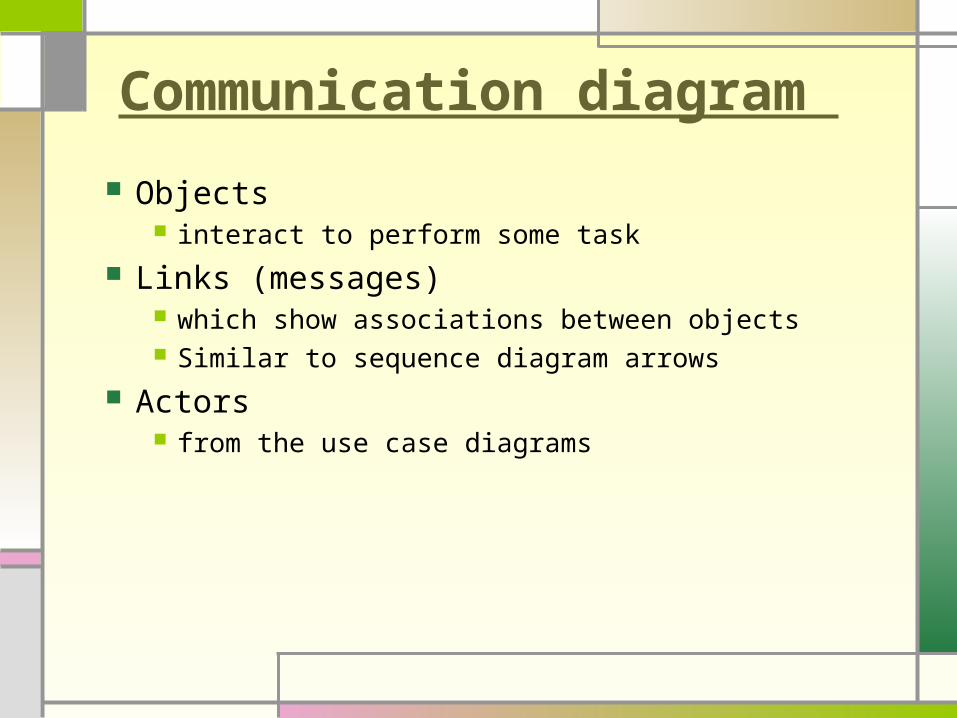
Communication diagram
Objects interact to perform some task
Links (messages) which show associations between objects Similar to sequence diagram arrows
Actors from the use case diagrams

Symbols
:Name1
:Name2
:Name3
1:Add()
2:Modify()
3:Update()
Numbering : The order of messagesex) 1,2,3 , …, 3.1 , 3.2
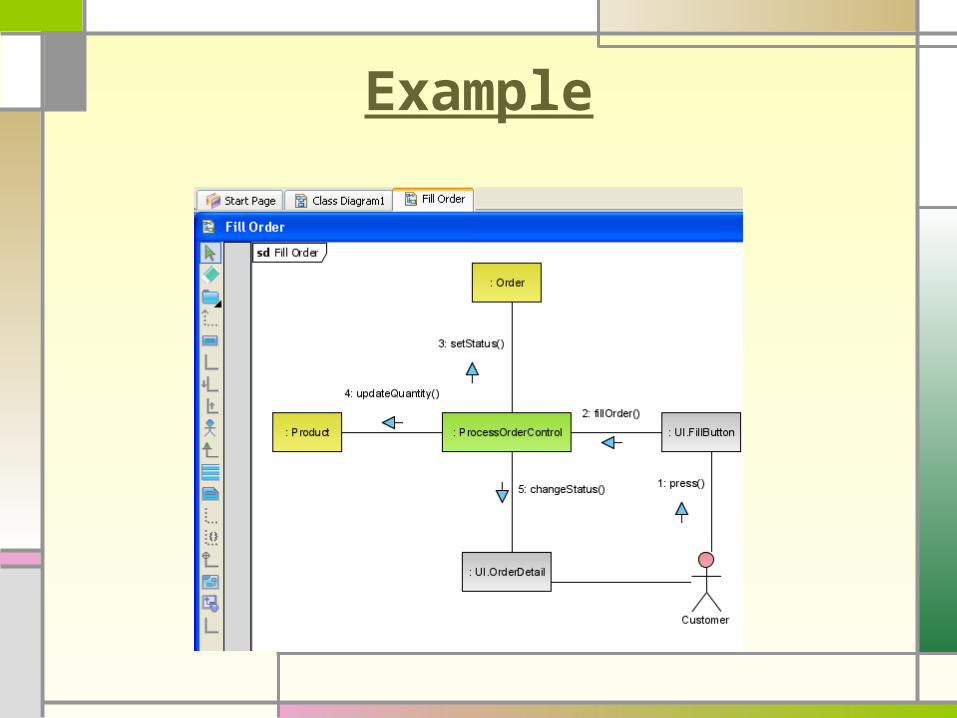
Example

Ex) Soda Machine : Simple Scenario

Ex) Soda Machine : Complex Scenario
Related Documents


