USCOPE: A SCALABLE UNIFIED TRACER FROM KERNEL TO USER SPACE Junghwan Rhee, Hui Zhang, Nipun Arora, Guofei Jiang, Kenji Yoshihira NEC Laboratories America www.nec-labs.com

Welcome message from author
This document is posted to help you gain knowledge. Please leave a comment to let me know what you think about it! Share it to your friends and learn new things together.
Transcript

USCOPE: A SCALABLE UNIFIED TRACER FROM KERNEL TO USER SPACE
Junghwan Rhee, Hui Zhang, Nipun Arora,
Guofei Jiang, Kenji Yoshihira
NEC Laboratories America
www.nec-labs.com
Uscope: A Scalable Unified Tracer from Kernel to User Space
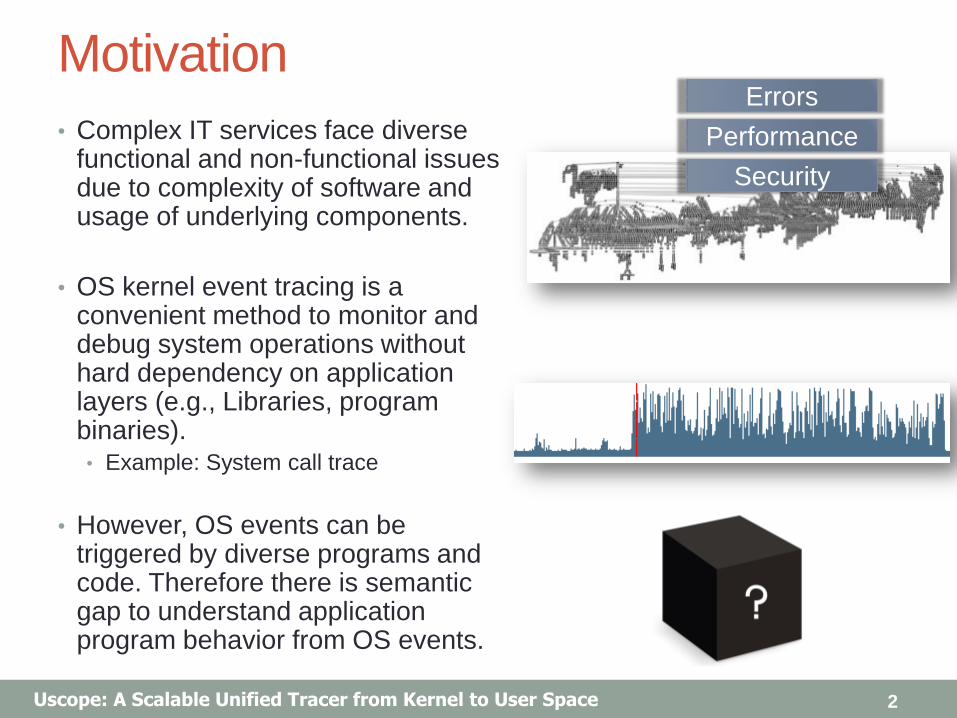
Motivation
• Complex IT services face diverse functional and non-functional issues due to complexity of software and usage of underlying components.
• OS kernel event tracing is a convenient method to monitor and debug system operations without hard dependency on application layers (e.g., Libraries, program binaries). • Example: System call trace
• However, OS events can be triggered by diverse programs and code. Therefore there is semantic gap to understand application program behavior from OS events.
2
Performance
Errors
Security
Uscope: A Scalable Unified Tracer from Kernel to User Space
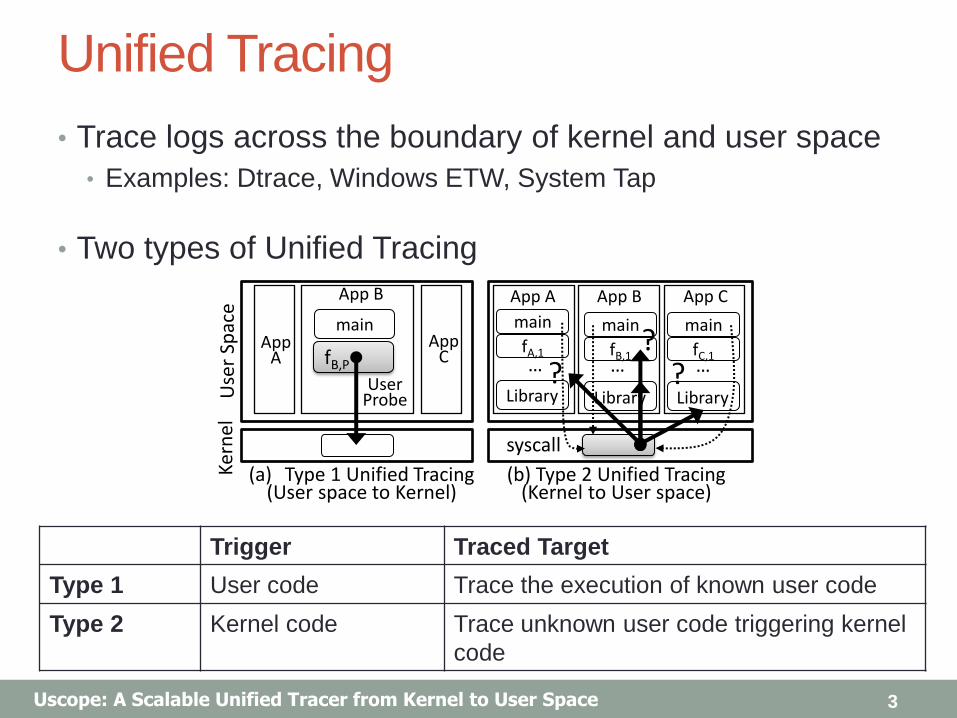
Unified Tracing
• Trace logs across the boundary of kernel and user space
• Examples: Dtrace, Windows ETW, System Tap
• Two types of Unified Tracing
3
Trigger Traced Target
Type 1 User code Trace the execution of known user code
Type 2 Kernel code Trace unknown user code triggering kernel
code
Ker
nel
(a) Type 1 Unified Tracing (User space to Kernel)
(b) Type 2 Unified Tracing (Kernel to User space)
Use
r Sp
ace
…
App A
App C fB,P
App B App A App C App B
? ?
? fA,1
main
syscall
main
User Probe Library
fB,1
main
Library
… …
fC,1
main
Library

Uscope: A Scalable Unified Tracer from Kernel to User Space
Type 2 Unified Tracing
• Service problems can be caused from
any program/layers. Type 2 unified
tracers can cover such unknown cases.
• A typically used technique to collect user
space code information is stack walking.
• Tracer finds the user process stack in the
current context and scan stack frames
from the stack pointer address.
• Examples
• Ustack of Dtrace, Stackwalking of Microsoft
ETW
• These solutions have been generally
used for debugging scenarios. How we
can lower overhead?
4
Type 2 Unified Tracing (Kernel to User space)
…
App A App C App B
? ?
? fA,1
syscall
main
Library
fB,1
main
Library
… …
fC,1
main
Library
Uscope: A Scalable Unified Tracer from Kernel to User Space
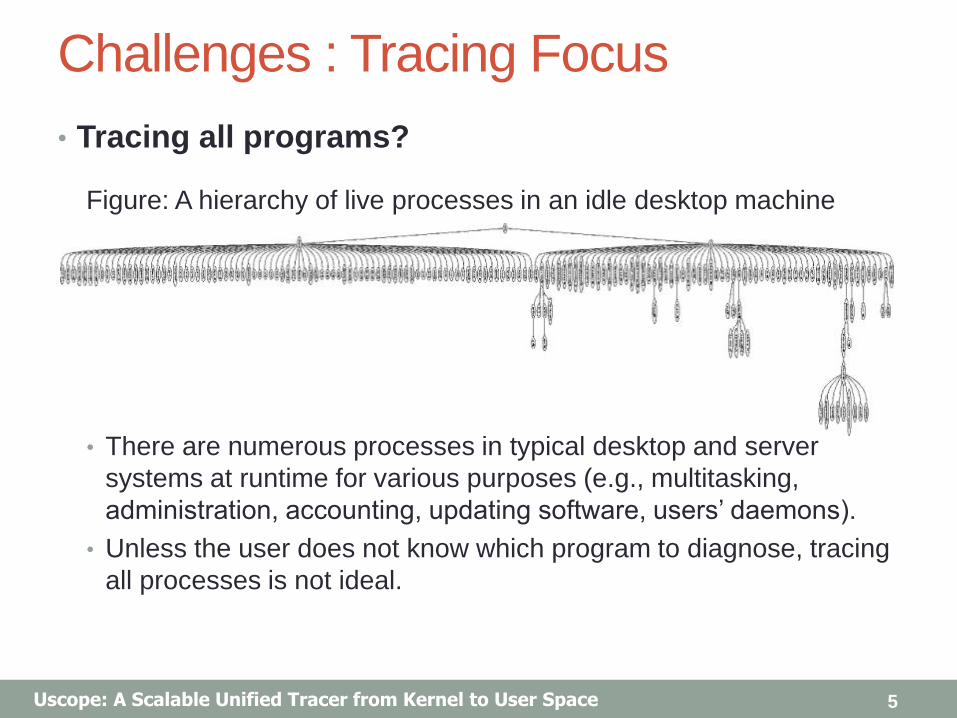
Challenges : Tracing Focus
• Tracing all programs?
• There are numerous processes in typical desktop and server
systems at runtime for various purposes (e.g., multitasking,
administration, accounting, updating software, users’ daemons).
• Unless the user does not know which program to diagnose, tracing
all processes is not ideal.
5
Figure: A hierarchy of live processes in an idle desktop machine
Uscope: A Scalable Unified Tracer from Kernel to User Space
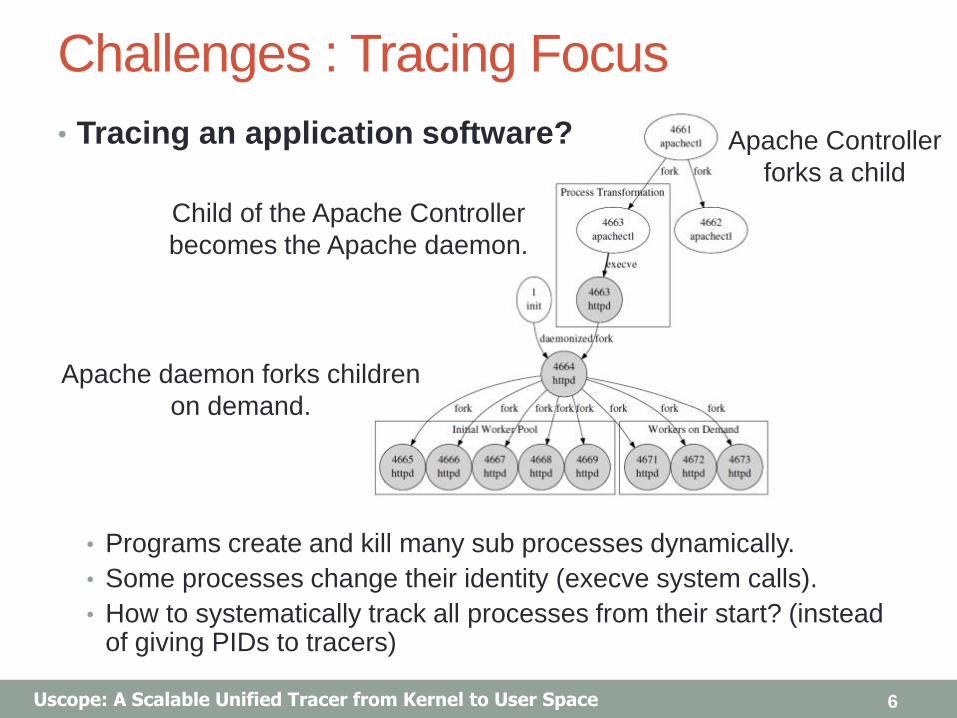
Challenges : Tracing Focus
• Tracing an application software?
• Programs create and kill many sub processes dynamically.
• Some processes change their identity (execve system calls).
• How to systematically track all processes from their start? (instead of giving PIDs to tracers)
6
Apache Controller
forks a child
Child of the Apache Controller
becomes the Apache daemon.
Apache daemon forks children
on demand.

Uscope: A Scalable Unified Tracer from Kernel to User Space
Challenges : Tracing Focus
• Tracing the whole stack?
• Programs may have deep stacks. ECLIPSE project reported that
the collected stack trace ranged from 1 ~ 1024 stack frames.
• A stack includes function call information of multiple software layers
(programs, libraries, middleware, and kernel etc.)
• Not every stack layer may be in users’ interest.
7
LibC
Libraries
Program
Uscope: A Scalable Unified Tracer from Kernel to User Space
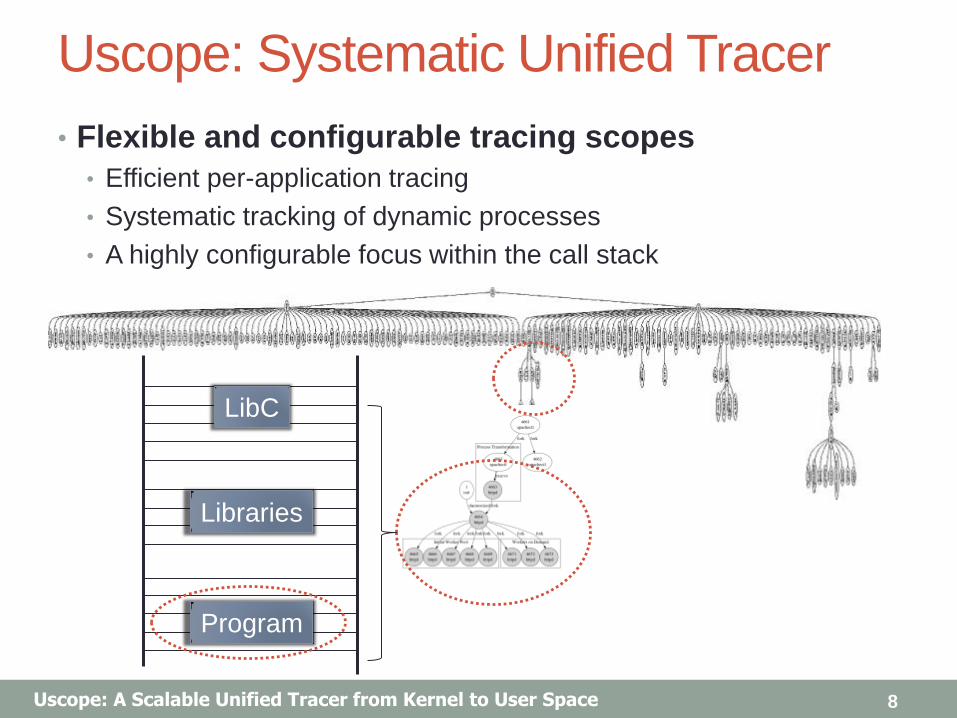
Uscope: Systematic Unified Tracer
• Flexible and configurable tracing scopes
• Efficient per-application tracing
• Systematic tracking of dynamic processes
• A highly configurable focus within the call stack
8
LibC
Libraries
Program
Uscope: A Scalable Unified Tracer from Kernel to User Space
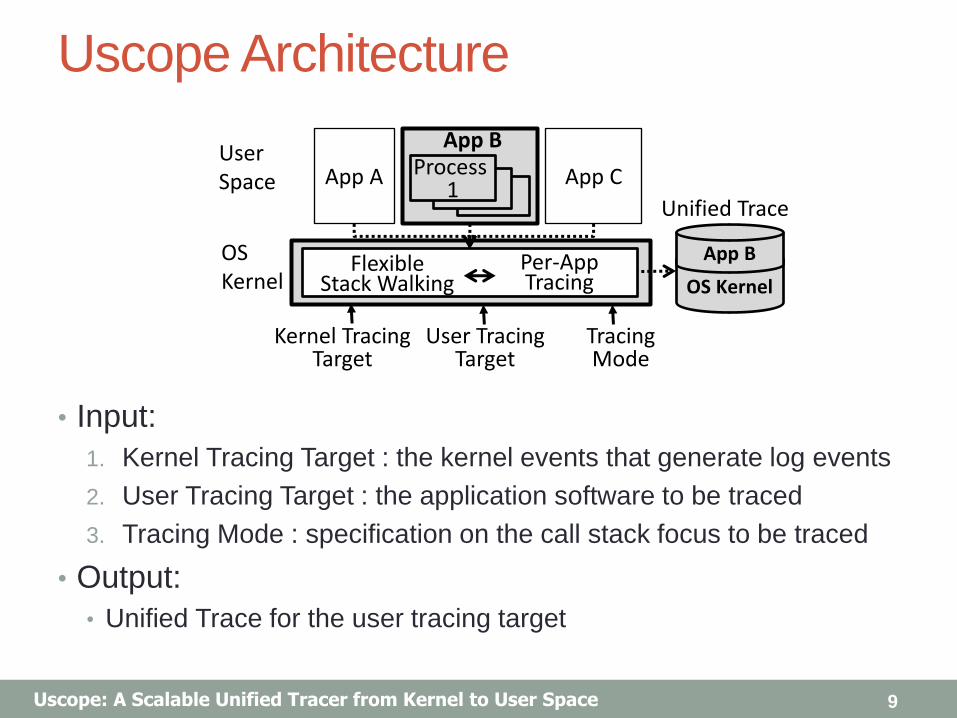
Uscope Architecture
• Input:
1. Kernel Tracing Target : the kernel events that generate log events
2. User Tracing Target : the application software to be traced
3. Tracing Mode : specification on the call stack focus to be traced
• Output:
• Unified Trace for the user tracing target
9
Kernel Tracing Target
OS Kernel
App B
Unified Trace
User Tracing Target
Tracing Mode
OS Kernel
Per-App Tracing
Flexible Stack Walking
User Space App A App C
App B Process
1
Uscope: A Scalable Unified Tracer from Kernel to User Space
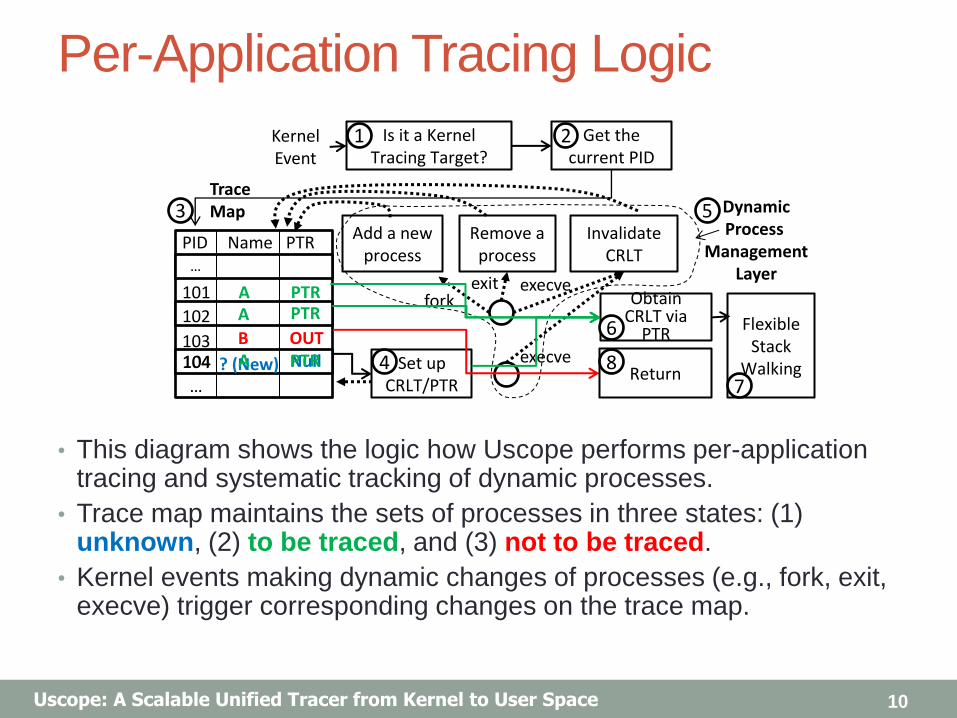
Per-Application Tracing Logic
• This diagram shows the logic how Uscope performs per-application tracing and systematic tracking of dynamic processes.
• Trace map maintains the sets of processes in three states: (1) unknown, (2) to be traced, and (3) not to be traced.
• Kernel events making dynamic changes of processes (e.g., fork, exit, execve) trigger corresponding changes on the trace map.
10
PID Name PTR
…
…
Trace Map 3
Get the current PID
2 Is it a Kernel Tracing Target?
1
Set up CRLT/PTR
4
exit
Add a new process
Remove a process
Invalidate CRLT
fork execve
execve
Kernel Event
Dynamic Process
Management Layer
5
Obtain CRLT via
PTR Flexible
Stack Walking
6
7 Return
8 104 ? (New) Null 104 A PTR
101
102
103
A A
B
PTR
OUT
PTR

Uscope: A Scalable Unified Tracer from Kernel to User Space
Flexible Call Stack Scope
• Uscope provides flexible call stack scopes in tracing.
• Maximum budge S. Further fine control is available.
11
Call stack during
a Syscall
Syscall
…
Recorded call sites during stack walking
Recorded call site
Unrecorded call site
Ck,1
Ck,2 RK Ck,nk
…
Mode 4 (All)
C1,1 C1,2
Ck,1 Ck,2
… C1,n1
Ck,nk
…
…
Mode 3 (Library)
C1,1 C1,2
Ck,1 Ck,2
… C1,n1
Ck,nk
…
…
Mode 1 (App)
C1,1 C1,2
C1,n1
…
Ck,1 Ck,2
…
Ck,nk
…
Mode 2 (App All)
C1,1 C1,2
C1,n1
…
Ck,1 Ck,2
…
Ck,nk
…
C1,1
C1,2 R1 C1,n1
…
Binary config In-Binary config
Mode 1 App binary The last stack frame
Mode 2 App binary All stack frames
Mode 3 All binaries, libraries Last stack frames
Mode 4 All binaries, libraries All stack frames
Stack walking

Uscope: A Scalable Unified Tracer from Kernel to User Space
Implementation
• Tracer
• Implemented by extending SystemTap.
• SystemTap hooks system calls to generate log events.
• Trace map and tracing logic is implemented as a kernel module.
• Redhat Enterprise Linux 5 is supported.
• Input:
1. Kernel Tracing Target : System call events
2. User Tracing Target : Apache webserver (Server workload),
MySQL database (Server workload), Nbench (computation)
• Uscope can be dynamically attached and detached to the
kernel at runtime. When it is detached, there is no
overhead.
12

Uscope: A Scalable Unified Tracer from Kernel to User Space
Runtime Overhead
• Workload • Apache : Apache HTTP Benchmark tool (ab), 100 concurrency, 10^6 requests
• MySQL : MySQL Benchmark suite (alter-table, ATIS, big-tables, connect, create, insert, select, transactions, and wisconsin)
• Nbench : Linux/Unix of BYTE’s Native Mode Benchmarks (verison 2.2.3). “Memory Index”, “Integer Index”, and “FP Index” are used.
• Tracing Modes : 1. Mode 1 : application call stack layer, the last stack frame
2. Mode 2 : application call stack layer, 3 or 5 last stack frames
3. Mode 3 : all layers, the last stack frames up to 5
• Less than 6% overhead in three benchmarking cases
13
Uscope: A Scalable Unified Tracer from Kernel to User Space
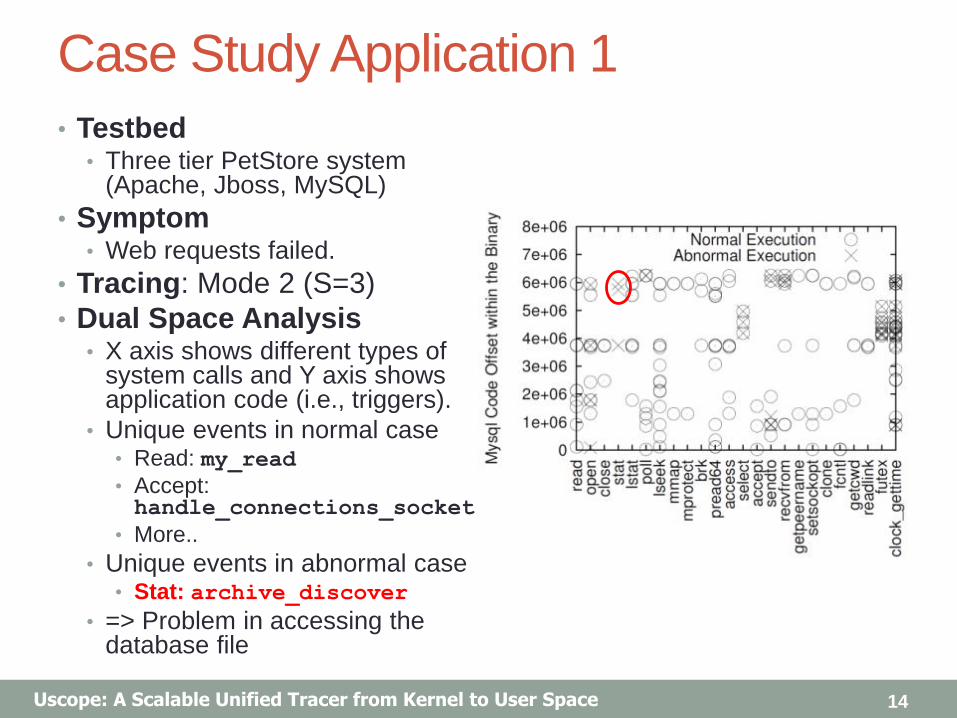
Case Study Application 1
• Testbed • Three tier PetStore system
(Apache, Jboss, MySQL)
• Symptom • Web requests failed.
• Tracing: Mode 2 (S=3)
• Dual Space Analysis • X axis shows different types of
system calls and Y axis shows application code (i.e., triggers).
• Unique events in normal case • Read: my_read
• Accept: handle_connections_socket
• More..
• Unique events in abnormal case • Stat: archive_discover
• => Problem in accessing the database file
14

Uscope: A Scalable Unified Tracer from Kernel to User Space
Case Study Application 2
• Testbed • Apache Webserver
• Symptom • Concurrency error that threads are
in a deadlock condition (Case number: Apache #42031)
• Tracing: Mode 2 (S=5)
• Call Stack Analysis • Call stacks on futex system calls
are captured and analyzed.
• Worker Thread • apr_thread_mutex_call (a
wrapper of pthread_mutex_call)
• Listener Thread • apr_thread_cond_wait (a
wrapper of pthread_cond_wait)
• => Deadlock conditions are identified.
15
LOCK (timeout) . . .
UNLOCK(timeout) . . .
LOCK (idlers) . . .
SIGNAL (waits) . . .
UNLOCK(idlers) . . .
LOCK (timeout) . . .
LOCK (idlers) . . .
COND_WAIT (waits, idlers)
. . . UNLOCK (idlers)
. . . UNLOCK(timeout)
Sys
Cal
ls
. . . futex
. . . futex
Listener Workers
Pro
gram
U
ser
cod
e co
nte
xt
? ?
deadlock
deadlock
Uscope: A Scalable Unified Tracer from Kernel to User Space
Conclusion
• Uscope provides efficient type 2 unified tracing for kernel
and unknown user code.
• Uscope provides per-application tracing, systematic
tracking of dynamic processes, and flexible specification
on call stack scopes to be traced.
• Our prototype has 6% overhead compared to native
execution in several benchmarks.
• Also we showed two case studies illustrating how unified
tracers can be used for diagnosing service systems.
16
Uscope: A Scalable Unified Tracer from Kernel to User Space
Thank you
17
www.nec-labs.com
Related Documents