- 1 - USCG-PVA: 2020 Annual Report USCG-PVA Quality Partnership Annual Report 2018 - 2020 This document presents information reported to the U.S. Coast Guard, which guides the discussions of the USCG‐PVA Quality Partnership. The document provides an overview of the U.S. flag, Inspected Passenger Vessel fleet, as well as information concerning marine casualties and inspections involving U.S. Inspected Passenger Vessels. This report covers calendar years 2018 ‐ 2020 and was developed from information contained in the U.S. Coast Guard Marine Information for Safety and Law Enforcement (MISLE) database. The information was extracted from the MISLE database using the Coast Guard Business Intelligence application. Inspected Passenger Vessel Population Vessel Status and Types Inspected passenger vessels are regulated under Title 46, Code of Federal Regulations (CFR) Subchapters H, K, or T 1 . As indicated in the table below, there are 6,687 inspected passenger vessels recorded in MISLE. This is a decrease of 80 vessels since the last report, and we believe this is a result of vessels not renewing their COI during the pandemic. Table 1 - Passenger Vessels by Inspection Subchapter and Status Vessel Status H K T Totals Active 131 421 5,641 6,193 Destroyed 8 8 Inactive 3 10 217 230 Laid Up 7 18 225 250 Scrapped 5 5 Sunk-Not Recoverable 1 1 Total 141 449 6,097 6,687 The number of vessels in a “Laid Up” status increased substantially from 121 in last year’s report to 250 in the current report. Again, this was most likely a result of decreased passenger vessel operations due to the pandemic in combination with new policy guidance for Laid Up vessels that was issued in September 2020. 1 H: Vessels of 100 gross tons or greater that carry passengers. K: Vessels of less than 100 gross tons that carry more than 149 passengers, or have overnight accommodations for more than 49 passengers. T: Vessels of less than 100 gross tons that carry more than 6 passengers but less than 150 passengers, or have overnight accommodations for 49 or less passengers.

Welcome message from author
This document is posted to help you gain knowledge. Please leave a comment to let me know what you think about it! Share it to your friends and learn new things together.
Transcript

- 1 - USCG-PVA: 2020 Annual Report
USCG-PVA Quality Partnership Annual Report
2018 - 2020
This document presents information reported to the U.S. Coast Guard, which guides the discussions of the USCG‐PVA Quality Partnership. The document provides an overview of the U.S. flag, Inspected Passenger Vessel fleet, as well as information concerning marine casualties and inspections involving U.S. Inspected Passenger Vessels. This report covers calendar years 2018 ‐ 2020 and was developed from information contained in the U.S. Coast Guard Marine Information for Safety and Law Enforcement (MISLE) database. The information was extracted from the MISLE database using the Coast Guard Business Intelligence application.
Inspected Passenger Vessel Population
Vessel Status and Types Inspected passenger vessels are regulated under Title 46, Code of Federal Regulations (CFR) Subchapters H, K, or T1. As indicated in the table below, there are 6,687 inspected passenger vessels recorded in MISLE. This is a decrease of 80 vessels since the last report, and we believe this is a result of vessels not renewing their COI during the pandemic.
Table 1 - Passenger Vessels by Inspection Subchapter and Status
Vessel Status H K T Totals Active 131 421 5,641 6,193 Destroyed 8 8 Inactive 3 10 217 230 Laid Up 7 18 225 250 Scrapped 5 5 Sunk-Not Recoverable 1 1
Total 141 449 6,097 6,687 The number of vessels in a “Laid Up” status increased substantially from 121 in last year’s report to 250 in the current report. Again, this was most likely a result of decreased passenger vessel operations due to the pandemic in combination with new policy guidance for Laid Up vessels that was issued in September 2020.
1 H: Vessels of 100 gross tons or greater that carry passengers. K: Vessels of less than 100 gross tons that carry more than 149 passengers, or have overnight accommodations for more than
49 passengers. T: Vessels of less than 100 gross tons that carry more than 6 passengers but less than 150 passengers, or have overnight
accommodations for 49 or less passengers.

- 2 - USCG-PVA: 2020 Annual Report
Vessel Status and Types (Continued) Table 2 shows the breakdown of Inspected Passenger Vessels by their MISLE Vessel Type. As noted in past reports, some of the passenger vessel population continues to be categorized in the “GENERAL” category within the Coast Guard’s data system. However, through the combined efforts of the Office of Commercial Vessel Compliance (CG-CVC) and USCG field units/inspectors, the number of vessels in this category dropped by over 90% from 3,136 last year to 262 this year. Many of the previously categorized “GENERAL” vessels were moved to the “Excursion/Tour Vessel” (1,184 vessel increase) and “Charter Fishing Vessel” (497 vessel increase) categories. The 6,687 inspected passenger vessels from 2020 are classified into the following vessel types:
Table 2 - Passenger Vessel Types
Vessel Type H K T Total Amphibious Vessel
127 127
Attraction Vessel 1 4 14 19 Balloon Support Vessel
2 2
Charter Fishing Vessel
2 1,005 1007 Crew Boat
382 382
Cruise Ship Launch/Tender
63 63 Diving Vessel (Recreational)
233 233
Excursion/Tour Vessel 6 157 2,248 2,411 Ferry 97 171 351 619 Gaming Vessel 2 3
5
General 31 9 222 262 Harbor Cruise Vessel 1 59 234 294 Ocean Cruise Vessel 1 12 18 31 Parasailing Vessel
204 204
Party/Head Boat (other than fish)
5 36 41 River Cruise Vessel 2 25 117 144 Sailing Vessel
311 311
Special Purpose Ship
43 43 Submersible
8 8
Water Taxi
2 477 479 Waterskiing Vessel
2 2
Total 141 449 6,097 6,687

- 3 - USCG-PVA: 2020 Annual Report
Geographic Distribution of Inspected Passenger Vessels The Fleet of Responsibility to which a vessel is assigned indicates the specific Coast Guard Sector that retains general administrative responsibility for the vessel, such as conducting annual exams, issuing Certificates of Inspection, scheduling hull examinations, etc. This typically correlates to the vessel’s operating area. The following table indicates the number of inspected passenger vessels assigned to each Coast Guard Sector.
Table 3 - Passenger Vessels by USCG Fleet of Responsibility
ATLANTIC AREA DISTRICT - Sector H K T Total
CG ACTIVITIES EUROPE 1 1 Activities Europe 1 1
CGD ONE 40 172 1,079 1,291 Boston 23 217 240 Long Island Sound 8 27 247 282 New York 12 90 209 311 Northern New England 13 13 195 221 SE New England 7 19 211 237
CGD FIVE 29 23 630 682 Delaware Bay 3 5 156 164 Maryland-NCR 13 302 315 North Carolina 22 1 99 122 Virginia 4 4 73 81
CGD SEVEN 4 45 1,244 1,293 Charleston 1 7 221 229 Jacksonville 3 5 140 148 Key West 1 181 182 Miami 12 227 239 San Juan 15 148 163 St Petersburg 5 327 332
CGD EIGHT 28 34 991 1,053 Corpus Christi 68 68 Houston-Galveston 8 76 84 Lower Miss River 2 2 18 22 Mobile 1 5 310 316 New Orleans 13 3 406 422 Ohio Valley 3 10 36 49 Upper Miss River 1 14 77 92
CGD NINE 3 54 345 402 Buffalo 11 67 78 Detroit 1 5 71 77 Lake Michigan 1 24 132 157 Sault Ste Marie 1 14 75 90
PACIFIC AREA DISTRICT - Sector H K T Total
CGD ELEVEN 4 74 648 726 LA - LB 17 278 295 San Diego 2 8 168 178 San Francisco 2 49 202 253
CGD THIRTEEN 25 29 399 453 Portland 1 5 183 189 Seattle 24 24 216 264
CGD FOURTEEN 1 3 439 443 Guam 85 85 Honolulu 1 3 354 358
CGD SEVENTEEN 7 15 321 343 Anchorage 8 147 155 Juneau 7 7 174 188
LANT & PAC Total 141 449 6,097 6,687

- 4 - USCG-PVA: 2020 Annual Report
Note: The percentages of the passenger vessel fleet remained the same since the last report.
USCG Units
D1, 19%
D5, 10%
D7, 19%
D8, 16%
D9, 6%
D11, 11%
D13, 7%
D14, 7%
D17, 5%
Inspected Passenger Vessels by District
D1
D5
D7
D8
D9
D11
D13
D14
D17

- 5 - USCG-PVA: 2020 Annual Report
Reportable Marine Casualties Involving Inspected Passenger Vessels
Marine Casualties Involving Fatalities From 2018 through 2020, the Coast Guard received reports of 153 fatalities onboard U.S. flag inspected passenger vessels2. The table below provides details on the cause of death or “accident type” as determined by the Coast Guard Investigating Officer.
Table 4 - Fatalities involving Passenger Vessels (2018-2020)
Accident Type H K T Total Assault, Homicide, Suicide, or Self-Inflicted Injury 1 1 Diseases- General 2 2 Existing Medical Condition Event 8 38 46 Overexertion Injury- Existing medical condition 3 3 Overexertion Injury- Strain or sprain 1 1 Contact Injury- Crushed between objects 1 1 Contact Injury- Fall into water 3 3 Contact Injury- Fall onto surface 1 1 Noncontact Injury- Asphyxiation 57 57 Noncontact Injury- Diving 22 22 Noncontact Injury- Exposure 1 1 Noncontact Injury- Other 2 1 6 9 Other Injury Type 1 1 Unknown Injury Type 5 5
Total 12 1 140 153 The 153 deaths is a decrease of seven (7) from last year’s report (160 deaths). The STRETCH DUCK 07 (17 deaths) in 2018 and the CONCEPTION (34 deaths) in 2019 account for one-third of the deaths aboard inspected passenger vessels. The deaths from both casualties are a subset of the fatalities highlighted in yellow in the table above. In an effort to focus the work of the partnership, the term “vessel-related” was developed by the USCG and PVA staff so that non-accidental incidents and events occurring off the vessel would be excluded from the data analysis (i.e. murder, suicide, medical condition, and diving-related deaths). As highlighted in green in the table above, 53 of the 153 fatalities were attributed to intentional acts or non-accidental causes. These types of incidents are NOT considered “vessel-related”.
2 An “Inspected Passenger Vessel” is a vessel which carries passengers for hire and subject to the regulations found in 46 CFR Subchapters T, K, or H.
- 6 - USCG-PVA: 2020 Annual Report
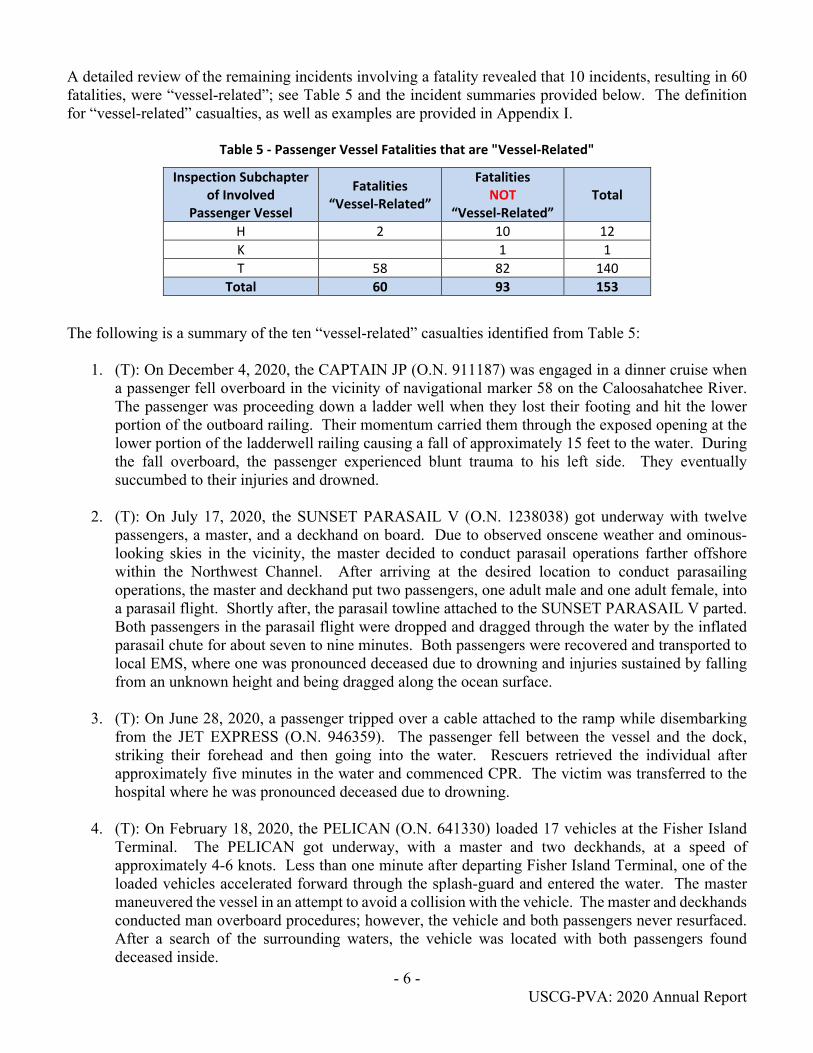
A detailed review of the remaining incidents involving a fatality revealed that 10 incidents, resulting in 60 fatalities, were “vessel-related”; see Table 5 and the incident summaries provided below. The definition for “vessel-related” casualties, as well as examples are provided in Appendix I.
Table 5 - Passenger Vessel Fatalities that are "Vessel-Related"
The following is a summary of the ten “vessel-related” casualties identified from Table 5:
1. (T): On December 4, 2020, the CAPTAIN JP (O.N. 911187) was engaged in a dinner cruise when a passenger fell overboard in the vicinity of navigational marker 58 on the Caloosahatchee River. The passenger was proceeding down a ladder well when they lost their footing and hit the lower portion of the outboard railing. Their momentum carried them through the exposed opening at the lower portion of the ladderwell railing causing a fall of approximately 15 feet to the water. During the fall overboard, the passenger experienced blunt trauma to his left side. They eventually succumbed to their injuries and drowned.
2. (T): On July 17, 2020, the SUNSET PARASAIL V (O.N. 1238038) got underway with twelve passengers, a master, and a deckhand on board. Due to observed onscene weather and ominous-looking skies in the vicinity, the master decided to conduct parasail operations farther offshore within the Northwest Channel. After arriving at the desired location to conduct parasailing operations, the master and deckhand put two passengers, one adult male and one adult female, into a parasail flight. Shortly after, the parasail towline attached to the SUNSET PARASAIL V parted. Both passengers in the parasail flight were dropped and dragged through the water by the inflated parasail chute for about seven to nine minutes. Both passengers were recovered and transported to local EMS, where one was pronounced deceased due to drowning and injuries sustained by falling from an unknown height and being dragged along the ocean surface.
3. (T): On June 28, 2020, a passenger tripped over a cable attached to the ramp while disembarking from the JET EXPRESS (O.N. 946359). The passenger fell between the vessel and the dock, striking their forehead and then going into the water. Rescuers retrieved the individual after approximately five minutes in the water and commenced CPR. The victim was transferred to the hospital where he was pronounced deceased due to drowning.
4. (T): On February 18, 2020, the PELICAN (O.N. 641330) loaded 17 vehicles at the Fisher Island Terminal. The PELICAN got underway, with a master and two deckhands, at a speed of approximately 4-6 knots. Less than one minute after departing Fisher Island Terminal, one of the loaded vehicles accelerated forward through the splash-guard and entered the water. The master maneuvered the vessel in an attempt to avoid a collision with the vehicle. The master and deckhands conducted man overboard procedures; however, the vehicle and both passengers never resurfaced. After a search of the surrounding waters, the vehicle was located with both passengers found deceased inside.
Inspection Subchapter of Involved
Passenger Vessel
Fatalities “Vessel-Related”
Fatalities NOT
“Vessel-Related” Total
H 2 10 12 K 1 1 T 58 82 140
Total 60 93 153

- 7 - USCG-PVA: 2020 Annual Report
5. (H): On October 12, 2019, a passenger on board the U.S. flagged high capacity passenger vessel
PRIDE OF AMERICA (O.N. 1149542) was injured. The 62-year-old female passenger was being assisted out of her wheelchair into bed by her husband when she fell and injured her left leg. Her husband noted abnormal breathing as she slept and contacted the bridge to request emergency assistance. The medical staff responded to the stateroom and performed life saving measures, which ultimately failed, and death was pronounced by the onboard physician. An autopsy was performed and it was concluded the cause of death to be a fat embolism due to acute left leg fracture. Pyelonephritis and hypertensive cardiovascular disease were also contributing factors to her death.
6. (T): On September 2, 2019, the U.S inspected small passenger vessel, CONCEPTION (O.N. 638133) was anchored in Platts Harbor on the north side of Santa Cruz Island when it experienced a fire. There were 39 total persons onboard including six crew and 33 passengers. Five members of the crew were able to escape the vessel while 34 persons were not. All 34 persons that remained on board during the fire perished.
7. (H): On August 13, 2019, a crewmember onboard the BELLE OF CINCINNATI (O.N. 972894) was last seen on camera removing the top portion of a starboard safety railing, where he proceeded to step over the remaining railing and attempt to cross the approximate 5 ft. gap over the water to the B&B Riverboats shore side facility. The security camera shows the crewmember trying to cross the gap where he drops out of view and never reappears on either the BELLE OF CINCINNATI or the facility. The missing crewmember was found deceased two days later near where he entered the water.
8. (T): On October 26, 2018, the passenger vessel PROWLER (O.N. 294465), carrying twenty-nine people following an overnight fishing trip in Mexican waters, collided with the ATTESSA IV (Cayman Islands, IMO 9179830). One passenger from the PROWLER was seriously injured and transported ashore where they later died.
9. (T): On July 19, 2018, the amphibious passenger vessel STRETCH DUCK 07 (O.N. CG248292) suffered rapid flooding and subsequently sank in Table Rock Lake. There were 29 passengers and 2 crew on board, of which 17 perished.
10. (T): On January 14, 2018, the vessel ISLAND LADY (O.N. 1020747) caught fire in the
Pithlachascotee River. The master intentionally grounded the vessel and all passengers, employees, and crew jumped off the bow and walked to shore. One passenger suffered from the effects of inhaling smoke during the fire and died the following day.

- 8 - USCG-PVA: 2020 Annual Report
Marine Casualties Involving Serious, Severe, or Critical Injuries As defined below, there are five injury severity categories used to classify personnel injuries.
From 2018 through 2020, there were 141 incidents that resulted in 149 Serious, Severe, or Critical injuries; 57% (85/149) of these injuries were the result of falls onboard the vessel.
Table 6 - Serious, Severe, or Critical Injuries Occurring Onboard Inspected Passenger Vessels
Accident Type 2018 2019 2020 Total Contact Injury- Fall onto surface 30 40 15 85 Noncontact Injury- Diving 8 5 1 14 Contact Injury- Struck by Moving Object 3 3 Contact Injury- Collision with Fixed Object 7 3 3 13 Contact Injury- Crushed between objects 4 1 2 7 Contact Injury- Other 1 4 1 6 Other Injury Type 2 2 4 Contact Injury- Line handling/caught in lines 1 2 3 Noncontact Injury- Other 2 1 3 Overexertion Injury- Strain or sprain 1 2 3 Contact Injury- Fall into water 2 2 4 Noncontact Injury- Asphyxiation 2 2 Overexertion Injury- Existing medical condition 1 1 Unknown Injury Type 1 1
Total 64 61 24 149

- 9 - USCG-PVA: 2020 Annual Report
As indicated in Table 7, passengers were involved in 112 of the 149 (75.2%) of the personnel casualties that resulted in Serious, Severe, or Critical injuries. The majority of the passenger injuries continue to be the result of falls onboard the vessel; 59.8% (67/112). Similar to passenger injuries, the highest percentage of crewmember injuries is due to falls onboard the vessel; 48.6% (18/37).
Table 7 - Party Relationship & Accident Type for Persons Injured on Inspected Passenger Vessels
Accident Type by Party-Subject Type 2018 2019 2020 Total Contractor Employee 0 0 0 0
None Crewmember (includes Master, Employee, Operator, Owner) 11 22 4 37
Contact Injury- Fall onto surface 2 13 3 18 Overexertion Injury- Strain or sprain 1 2 3 Contact Injury- Crushed between objects 2 1 3 Contact Injury- Line handling/caught in lines 1 2 3 Contact Injury- Other 2 1 3 Other Injury Type 1 1 2 Contact Injury- Collision with Fixed Object 1 1 2 Contact Injury- Fall into water 1 1 Contact Injury- Struck by Moving Object 1 1 Noncontact Injury- Diving 1 1
External Victim (Pilots, Visitors) 0 0 0 0 None
Passenger 53 39 20 112 Contact Injury- Fall onto surface 28 27 12 67 Noncontact Injury- Diving 7 5 1 13 Contact Injury- Collision with Fixed Object 6 2 3 11 Contact Injury- Crushed between objects 2 2 4 Contact Injury- Fall into water 1 2 3 Contact Injury- Other 1 2 3 Noncontact Injury- Other 2 1 3 Contact Injury- Struck by Moving Object 2 2 Noncontact Injury- Asphyxiation 2 2 Other Injury Type 1 1 2 Unknown Injury Type 1 1 Overexertion Injury- Existing medical condition 1 1
Total 64 61 24 149

- 10 - USCG-PVA: 2020 Annual Report
Marine Casualties and Events As indicated in Table 8, inspected passenger vessels were involved in 1,612 reportable marine casualties from 2018 through 2020. Of those, 27.1% (437 of 1,612) of these casualties were classified as “Serious Marine Incidents”3 (SMI).
Table 8 - Reportable Marine Casualties Involving Inspected Passenger Vessels
Inspection Subchapter 2018 2019 2020 Total H Boats
Non-SMI SMI
131 84 47
143 107 36
62 44 18
336 235 101
K Boats Non-SMI SMI
60 47 13
66 55 11
29 25 4
155 127 28
T Boats Non-SMI SMI
398 282 116
459 324 135
264 207 57
1,121 813 308
Total 589 668 355 1,612
3 Serious Marine Incident is defined in 46 CFR 4.03-2

- 11 - USCG-PVA: 2020 Annual Report
Most marine casualties are described as a series of events: a mechanical failure, followed by a loss of propulsion, grounding, and ending with a discharge of oil. In this example, the mechanical failure is the initiating event. The two most common initiating events recorded for passenger vessel marine casualties were “Material Failure/Malfunction” (35.0%) and “Personnel Casualty - Injury” (20.2%).
Table 9 - Initiating Events for Marine Casualties Involving Inspected Passenger Vessels
Initial Event 2018 2019 2020 Grand
Total H K T Total H K T Total H K T Total Material Failure/Malfunction 45 25 138 208 52 30 152 234 33 10 79 122 564 Personnel Casualty - Injury 50 12 65 127 42 14 81 137 17 3 41 61 325 Loss/Reduction of Propulsion/Steering 6 5 36 47 15 7 50 72 2 4 30 36 155 UNSPECIFIED 12 4 31 47 6 5 28 39 2 1 21 24 110 Grounding 4 2 29 35 3 1 34 38 3 1 22 26 99 Allision 2 8 25 35 5 4 21 30 1 3 16 20 85 Personnel Casualty - Death 2 19 21 6 35 41 1 16 17 79 Vessel Maneuver 2 5 7 4 2 12 18 6 6 31 Loss of Electrical Power 3 3 2 8 6 1 3 10 1 3 6 10 28 Collision 5 5 12 12 1 2 3 20 Flooding - Initial 2 7 9 1 5 6 1 2 3 18 Discharge/Release - Pollution 2 7 9 3 3 1 1 13 Fouling 7 7 1 3 4 2 2 13 Wave(s) Strikes/Impacts 5 5 4 4 4 4 13 Personnel Fall into Water 1 2 3 1 1 4 6 1 1 2 11 Set Adrift 5 5 1 1 1 3 4 10 Personnel Entering Water (not Falling) 1 2 3 3 3 4 4 10 Vessel Yawl/Pitch/Roll/Heel 1 1 4 4 1 3 4 9 Fire - Initial 3 3 1 2 3 1 1 2 8 Personnel Casualty - Exposure 1 1 2 2 3 Explosion 1 1 2 2 3 Flooding - Progressive 2 2 2 Personnel Ejected from Vessel 1 1 1 Cargo/Fuel Transfer/Shift 1 1 1 Sinking 1 1 1
Total 131 60 398 589 143 66 459 668 62 29 264 355 1,612
- 12 - USCG-PVA: 2020 Annual Report
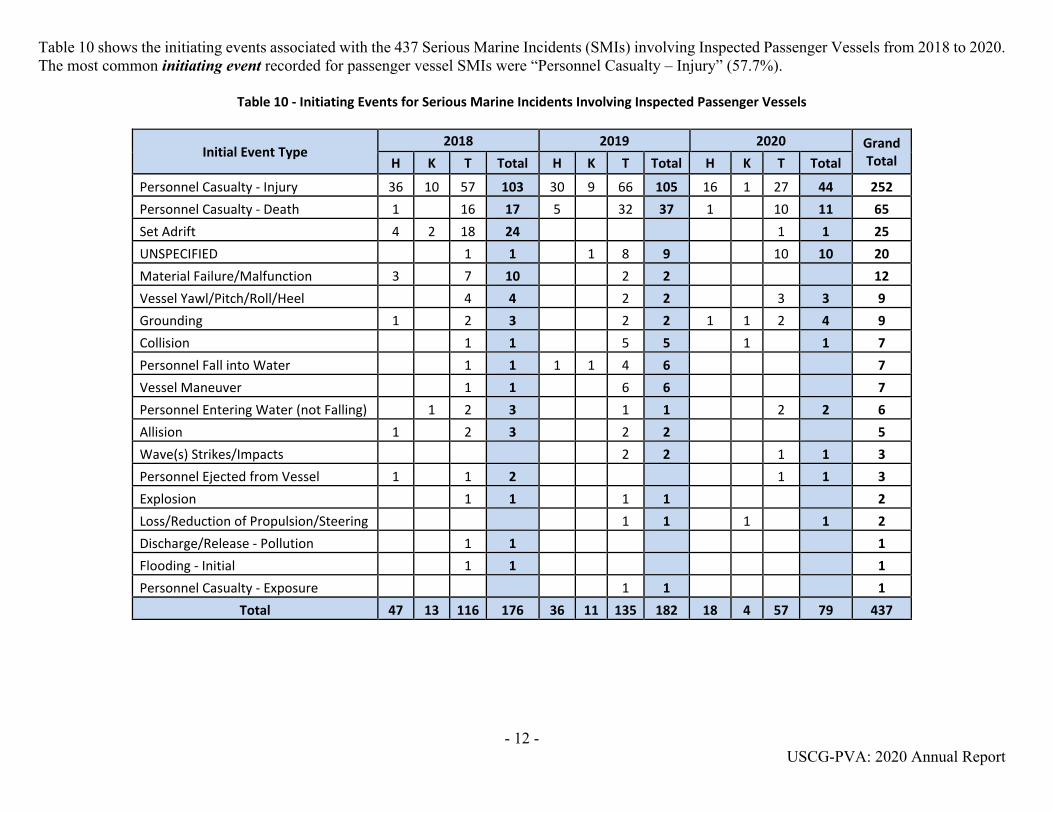
Table 10 shows the initiating events associated with the 437 Serious Marine Incidents (SMIs) involving Inspected Passenger Vessels from 2018 to 2020. The most common initiating event recorded for passenger vessel SMIs were “Personnel Casualty – Injury” (57.7%).
Table 10 - Initiating Events for Serious Marine Incidents Involving Inspected Passenger Vessels
Initial Event Type 2018 2019 2020 Grand
Total H K T Total H K T Total H K T Total
Personnel Casualty - Injury 36 10 57 103 30 9 66 105 16 1 27 44 252 Personnel Casualty - Death 1 16 17 5 32 37 1 10 11 65 Set Adrift 4 2 18 24 1 1 25 UNSPECIFIED 1 1 1 8 9 10 10 20 Material Failure/Malfunction 3 7 10 2 2 12 Vessel Yawl/Pitch/Roll/Heel 4 4 2 2 3 3 9 Grounding 1 2 3 2 2 1 1 2 4 9 Collision 1 1 5 5 1 1 7 Personnel Fall into Water 1 1 1 1 4 6 7 Vessel Maneuver 1 1 6 6 7 Personnel Entering Water (not Falling) 1 2 3 1 1 2 2 6 Allision 1 2 3 2 2 5 Wave(s) Strikes/Impacts 2 2 1 1 3 Personnel Ejected from Vessel 1 1 2 1 1 3 Explosion 1 1 1 1 2 Loss/Reduction of Propulsion/Steering 1 1 1 1 2 Discharge/Release - Pollution 1 1 1 Flooding - Initial 1 1 1 Personnel Casualty - Exposure 1 1 1
Total 47 13 116 176 36 11 135 182 18 4 57 79 437

- 13 - USCG-PVA: 2020 Annual Report
Vessel Inspections, Deficiencies, and Appeals
Vessel Inspections and Deficiencies The majority of the passenger vessel inspections and deficiencies issued involved T-boats due to the size of that fleet. We saw the expected steep declines in all of the metrics, particularly for larger passenger vessels, due to the ongoing pandemic. The reduced operations by inspected passenger vessels, coupled with decreased Coast Guard activities are directly related to these metrics and can explain the drops in each.
Table 11 - Deficiencies Issued to Inspected Passenger Vessels
CY Inspection Activities
Inspection Activities with a
Deficiency Issued
% of Inspection Activities with a
Deficiency Issued
Deficiencies Issued
H-Boats 2018 922 406 44.0% 1,272 2019 844 370 43.8% 1,328 2020 711 307 43.2% 1,113
K-Boats 2018 1,188 622 52.4% 2,014 2019 1,034 537 51.9% 2,346 2020 880 416 47.3% 1,599
T-Boats 2018 10,242 4,243 41.4% 15,343 2019 10,418 4,652 44.7% 19,156 2020 9,634 4,112 42.7% 15,055
As previously agreed, a single vessel deficiency table is now included in the report. Table 12 contains the top 10 systems, where deficiencies were identified and issued to inspected passenger vessels. The table includes the System and Component levels, with associated counts, to provide the greatest clarity in the issued deficiencies. A concern that has been voiced for the past two years is the prevalent use of “Other” values by inspectors within the deficiency hierarchy. Both at the component and system levels. And although these values continue to be present in the lists, their use fell in 2020. This is likely due to the smaller number of deficiencies issued in 2020, coupled with inspectors becoming more familiar with the deficiency hierarchy and available choices.

- 14 - USCG-PVA: 2020 Annual Report
Table 12 - Vessel Deficiencies Issued to Inspected Passenger Vessels by System and Component
Vessel Deficiencies by System/Component 2018 2019 2020 TOTAL 02 - Structural Conditions 1,703 3,759 2,987 8,449
02199 - Other (Structural condition) 353 828 724 1,905 02112 - Hull - corrosion 223 519 415 1,157 02108 - Electrical installations in general 163 473 258 894 02106 - Hull damage impairing seaworthiness 203 391 288 882 02113 - Hull - cracking 154 317 258 729 02111 - Beams, frames, floors-corrosion 116 177 204 497
Vessel Deficiencies by System/Component 2018 2019 2020 TOTAL 13 - Propulsion and Auxiliary Machinery 1,557 3,281 2,556 7,394
13199 - Other (machinery) 534 1147 920 2,601 13101 - Propulsion main engine 469 937 737 2,143 13104 - Bilge pumping arrangements 329 686 516 1,531 13108 - Operation of machinery 83 191 153 427 13102 - Auxiliary engine 87 174 132 393 13103 - Gauges, thermometers, etc. 52 140 89 281
Vessel Deficiencies by System/Component 2018 2019 2020 TOTAL 11 - Life Saving Appliances 1,303 3,256 2,617 7,176
11118 - Lifejackets incl. provision and disposition 350 824 632 1,806 11117 - Lifebuoys incl. provision and disposition 311 769 621 1,701 11199 - Other (life saving) 116 262 211 589 11116 - Distress flares 103 239 222 564 11135 - Maintenance of Life Saving Appliances 76 237 184 497 11129 - Operational readiness of lifesaving appliances 69 201 187 457
Vessel Deficiencies by System/Component 2018 2019 2020 TOTAL 07 - Fire Safety 1,017 2,721 2,003 5,741
07110 - Fire fighting equipment and appliances 226 513 439 1,178 07199 - Other (fire safety) 128 456 347 931 07109 - Fixed fire extinguishing installation 157 343 245 745 07113 - Fire pumps and its pipes 79 159 159 397 07124 - Maintenance of Fire protection systems 60 135 138 333 07116 - Ventilation 61 124 75 260

- 15 - USCG-PVA: 2020 Annual Report
Table 12 - Vessel Deficiencies Issued to Inspected Passenger Vessels by System and Component (cont’d)
Vessel Deficiencies by System/Component 2018 2019 2020 TOTAL 09 - Working and Living Conditions 747 2,510 1,818 5,075
09209 - Electrical 294 1105 787 2,186 09112 - Medical Equipment 84 250 189 523 09298 - Other (accident prevention) 52 133 128 313 09210 - Machinery 38 125 113 276 09203 - Lighting (Working spaces) 14 77 59 150 09233 - Guards - fencing around dangerous machinery 12 70 44 126
Vessel Deficiencies by System/Component 2018 2019 2020 TOTAL 01 - Certificates & Documentation 617 1,525 1,395 3,537
01199 - Other (certificates) 183 482 407 1072 CG001 - Certificate of Inspection (COI) 107 262 479 848 01305 - Log-books/compulsory entries 80 207 122 409 CG003 - USCG Certificate of Documentation (COD) 58 116 108 282 01201 - Certificates for master and officers 26 53 58 137 01203 - Certificates for radio personnel 32 61 32 125
Vessel Deficiencies by System/Component 2018 2019 2020 TOTAL 10 - Safety of Navigation 844 1,230 827 2,901
10109 - Lights, shapes, sound-signals 127 387 289 803 10116 - Nautical publications 119 297 186 602 10111 - Charts 81 254 138 473 10113 - Automatic Identification System (AIS) 403 23 11 437 10199 - Other (navigation) 46 104 67 217 10105 - Magnetic compass 22 64 57 143
Vessel Deficiencies by System/Component 2018 2019 2020 TOTAL 99 - Other 508 1,200 1,069 2,777
99101 - Other (Safety in general) 503 1,184 1,064 2,751 99103 - Other (MARPOL operational) 5 13 4 22

- 16 - USCG-PVA: 2020 Annual Report
Table 12 - Vessel Deficiencies Issued to Inspected Passenger Vessels by System and Component (cont’d)
Vessel Deficiencies by System/Component 2018 2019 2020 TOTAL 03 - Water/Weathertight Conditions 513 1,014 817 2,344
03112 - Scuppers, inlets and discharges 72 147 118 337 03199 - Other (load lines) 71 130 127 328 03109 - Machinery space openings 64 125 119 308 03110 - Manholes/flush scuttles 71 133 79 283 03103 - Railing, gangway and means for safe passage 52 133 95 280 03105 - Covers (hatchway-, portable-, tarpaulins, etc.) 64 118 96 278
Vessel Deficiencies by System/Component 2018 2019 2020 TOTAL 05 - Radio Communications 358 816 635 1,809
05109 - VHF radio installation 63 208 161 432 05199 - Other (radio communication) 90 193 123 406 05111 - Satellite EPIRB 406MHz/1.6GHz 92 161 145 398 05112 - VHF EPIRB 49 89 70 208 05101 - Distress messages: obligations and procedures 12 42 33 87 05116 - Operation/maintenance 10 22 34 66

- 17 - USCG-PVA: 2020 Annual Report
Flag State Detentions involving Inspected Passenger Vessels
Table 13 – Flag State Detentions
Subchapter CY4 Detentions Population Detention Percentage
H 2018 0 145 0.00% 2019 1 144 0.69% 2020 0 141 0.00%
K 2018 3 431 0.70% 2019 13 438 2.97% 2020 3 449 0.67%
T 2018 12 6,059 0.20% 2019 35 6,185 0.57% 2020 10 6,097 0.16%
Tier 1, 2, and 3 Inspections In accordance with CG-CVC Policy Letter 16-05 CH-1, OCMIs may exercise operational flexibility when inspecting Small Passenger Vessels. The following table shows the units that have exercised this discretion along with the inspection tiers.
Table 14 - RBDM for Small Passenger Vessels in 2020
Unit Tier 1 Tier 2 Tier 3 Total Inspections Fleet Size Percentage
of Fleet SECTOR LAKE MICHIGAN 9 15 19 43 157 27.39% SECTOR MARYLAND-NCR 2 59 120 181 315 57.46% SECTOR MOBILE 1 1 2 316 0.63% SECTOR NEW ORLEANS 1 12 3 16 422 3.79% SECTOR SAN DIEGO 5 3 8 178 4.49% SECTOR SAN FRANCISCO 1 18 19 253 7.51% SECTOR SAULT STE MARIE 1 1 90 1.11%
CG‐CVC Appeals involving Inspected Passenger Vessels The following table shows appeals adjudicated by Commandant (CG-CVC).
Table 15 - Appeals to Commandant
CY Received Granted Denied Other 2017 0 0 0 0 2018 3 0 3 0 2019 1 1 0 0 2020 3 1 2 0
4 The flag state detention program was initiated in 2018, as such 2018 contains data for a partial year (April – December).

- 18 - USCG-PVA: 2020 Annual Report
Appendix I
Definition of “Vessel-Related” Marine Casualties To focus the efforts of the USCG-PVA Quality Partnership, the following guidance is provided to determine which incidents are classified as either ‘vessel-related’ or ‘not vessel-related’. This distinction is made to assist in identifying the incidents that are within the control of the operator. NOT VESSEL-RELATED
• Death due to Intentional Acts, especially those of a criminal nature (i.e. suicide or homicide).
• Death resulting from the intentional act of another person (i.e. pushing someone overboard, regardless of intent).
• Death resulting from an intentional jump overboard. • Death due to Pre-Existing Medical Condition(s) or Disease. • Death that occurs onboard a vessel and is attributed to an overdose of medication or use of
a drug, regardless of when the drugs were taken. The only exception is when the death is due to medicine distributed by medical staff attached to a vessel.
• Death that results from choking while eating onboard a vessel. • Death that did not occur onboard a vessel or deaths that did not result from activities on
the vessel. Examples include: o While swimming, snorkeling, or diving, a passenger or crewmember dies in the
water. o While swimming, snorkeling, or diving, a passenger or crewmember goes into
distress and is recovered from the water, then subsequently dies onboard the vessel. o A missing diver/snorkeler. o Passengers or crewmembers that disembark the vessel to use a personal watercraft
(PWC), Jet Ski, kayak, stand-up paddleboard (SUP) or something similar, which are not tethered to the vessel and sustain injuries resulting in death.
• Shark bites, stingray strikes, etc. VESSEL-RELATED
Everything else is considered "Vessel-Related", specifically including: • All parasail accidents. • All accidents occurring on any apparatus tethered to the passenger vessel (i.e. jetlev,
banana boat, water skiing, etc.). • All accidental falls onboard a vessel, regardless of the circumstance(s). • If a person enters the water due to a vessel collision, capsizing, sinking, grounding, allision,
etc., then dies as a result. • If a person is in the water and is run over by a vessel - even if the person was not a passenger
or crewmember aboard the vessel.
Related Documents