USAID V IETNAM C LEAN E NERGY P ROGRAM CONTRACT NUMBER: AID-486-C-12-00008-00 WOODY BIOMASS FOR ENERGY GENERATION IN VIETNAM FINAL REPORT Submitted to United States Agency for International Development Submitted by Winrock International Institute for Agricultural Development in partnership with SNV Netherlands Development Organisation January 2014

Welcome message from author
This document is posted to help you gain knowledge. Please leave a comment to let me know what you think about it! Share it to your friends and learn new things together.
Transcript

USAID V IETNAM CLEAN ENERGY PROGRAM CONTRACT NUMBER: AID-486-C-12-00008-00
WOODY BIOMASS FOR ENERGY GENERATION IN VIETNAM
FINAL REPORT
Submitted to
United States Agency for International Development
Submitted by
Winrock International Institute for Agricultural Development
in partnership with
SNV Netherlands Development Organisation
January 2014

i
This report is made possible by the generous support of the American people through the United States Agency for
International Development (USAID). The contents are the responsibility of Winrock International and do not
necessarily reflect the views of USAID or the United States Government.

ii
Thisstudy iscarriedoutintheframeworkoftheUSAIDVietnam Clean Energy Program by:
SNV Netherlands Development Organisation
Contact person: Dagmar Zwebe
Sector Leader Renewable Energy
6th Floor, Building B, La Thanh Hotel
218 Doi Can, Ba Dinh, Ha Noi
Vietnam
Email: [email protected]
Phone: +84 (0) 1238163324
Report written by:
Nguyen Thi Thu Ha SNV Vietnam Renewable Energy Advisor
Nguyen Thanh Quang SNV Vietnam Renewable Energy Advisor
Dagmar Zwebe SNV Vietnam Sector Leader Renewable Energy

iii
TABLE OF CONTENT
ABBREVIATIONS AND ACRONYMS ................................................................................................................. V
1. INTRODUCTION TO THE STUDY ........................................................................................................... 1
2. WOODY BIOMASS EXPLOITATION IN VIETNAM .................................................................................. 1
2.1 BACKGROUND ON FOREST DEVELOPMENT........................................................................................................ 1 2.2 FOREST HARVESTING AND UTILIZATION ............................................................................................................ 5 2.3 WOOD PROCESSING SECTOR DEMANDS AND STATUS ...................................................................................... 8 2.4 WOODY BIOMASS DEVELOPMENT PLANS ........................................................................................................... 9
3. ENERGY POTENTIAL AND USAGE OF WOOD RESIDUES ................................................................... 10
3.1 FOREST MANAGEMENT – RESIDUES AND POTENTIALS ....................................................................................... 12 3.2 ESTIMATIONS OF THE AVAILABLE RESIDUES FROM THE INDUSTRIAL SECTOR ....................................................... 13
4. FROM WOODY BIOMASS TO ENERGY CARRIERS ............................................................................... 17
4.1 WOODCHIPS ................................................................................................................................................ 18 4.2 WOOD PELLETS ............................................................................................................................................ 21 4.3 WOOD BRIQUETTES ...................................................................................................................................... 25 4.4 CHARCOAL ................................................................................................................................................... 27 4.5 OTHER USES OF WOODY BIOMASS IN VIETNAM ............................................................................................... 29
5. UTILIZATION OF WOODY BIOMASS .................................................................................................... 31
5.1 HEAT GENERATION THROUGH COMBUSTION ................................................................................................. 31 5.2 POWER GENERATION AND/OR CO-GENERATION THROUGH COMBUSTION ...................................................... 34 5.3 GASIFICATION ............................................................................................................................................... 35
6. CONCLUSION AND RECOMMENDATION........................................................................................... 36
REFERENCES ..................................................................................................................................................... 38

iv
LIST OF TABLES
Table 1 The forest distribution in 2012 (MARD, 2013) ___________________________________________ 2 Table 2 The distribution of plantation forest areas in regions (ha) (VNFOREST, 2011) ____________________ 4 Table 3 The natural forest timber harvesting (Vietnam Forestry handbook, MARD 2012, 2013) _____________ 7 Table 4 Forecast for Vietnam’s timber demand (MARD, 2006) _____________________________________ 9 Table 5 Heating Values for several types of Woody Biomass (Residues) (Energy basic, fact sheet 5.8) ________ 10 Table 6 Influence of wood moisture on calorific value (EnergyPedia, 2014) ___________________________ 11 Table 7 Heat value of different woody biomass material (Quynh, 2009) ______________________________ 11 Table 8 Forecasted energy potential generated from wood logging residues __________________________ 13 Table 9 Forecasted residue to energy potential in sawing section __________________________________ 15 Table 10 Residues from Wood processing (IE, 2011) ___________________________________________ 16 Table 11 Energy potential from wood waste in the wood processing industry in Vietnam _________________ 17 Table 12 National wood chip technology manufacturers in Vietnam ________________________________ 19 Table 13 The structure of input material for wood chip production industry in 2011 (Forest trend, 2013) ____ 20 Table 14 The distribution of woodchip production in Vietnam (Forest Trend, 2013) ____________________ 21 Table 15 Woodchip suppliers and its capacityper organisation type (Forest Trends, 2013) ________________ 21 Table 16 Small Scale Woody Residues Pellet Machine Suppliers in Vietnam ___________________________ 22 Table 17 Production cost of biomass pellet (Cuong, 2013) _______________________________________ 22 Table 18 The technical specification of a wood pellet producer in Vietnam ___________________________ 23 Table 19 Low heat value (LHV) of biomass pellets (Cuong, 2013) __________________________________ 23 Table 20 Several large woody pellet producers in Vietnam _______________________________________ 24 Table 21 Production cost of biomass pellet/briquette (Cuong, 2012) ________________________________ 25 Table 22 The technical specification of a wood briquette in Vietnam ________________________________ 26 Table 23 Key properties of woody briquettes (Vietbioenergy website) ______________________________ 26 Table 24 An example of technical specification of charcoal in Vietnam from Artex ThangLong JSC __________ 28 Table 25 Key parameters of charcoals ______________________________________________________ 28 Table 26 MDF production in Vietnam 2012 __________________________________________________ 29 Table 27 Fuel-wood demand, under different scenarios (Million tone) (FAO 2009) _____________________ 30 Table 28 Pulp consumption, production and import of Vietnam during 2007-2011 ______________________ 30 Table 29 The Wood energy and wood waste available in Vietnam (Cuong, 2012) ______________________ 31 Table 30 Several examples of typical woody biomass based heat generation projects in Vietnam ____________ 33 Table 31 Wood waste based boiler suppliers in Vietnam ________________________________________ 33 Table 32 Woody biomass based power plants in Vietnam ________________________________________ 34 Table 33 Gasification stove producers and developers in Vietnam __________________________________ 35
LIST OF FIGURES
Figure 1 The forestry area and coverage in period of 2005 – 2012 ........................................................................................ 2 Figure 2 The country forest standing stock (MARD, 2011) ...................................................................................................... 3 Figure 3 Vietnam wood production output from plantation forest and nature forest (HAWA) .................................... 4 Figure 4 The forest coverage in Vietnam in 2010 ........................................................................................................................ 4 Figure 5 The flow of wood from plantation forest and scatted trees in 2011 (Forest Trends 2013) ............................ 6 Figure 6 The sawn wood demand for furniture production in Vietnam (source MARD) ................................................. 9 Figure 7 The balance material and energy used in wood processing industry in Vietnam (Worner, 2012) ............... 14 Figure 8 Potential conversion steps from biomass to energy (carrier) ................................................................................ 18 Figure 9 Design of a wood chipper from Qingdao Haylite Machinery Co. Ltd.China ...................................................... 19 Figure 10 A sawdust briquette producing line in Viet Phat Bio Corp ................................................................................... 26 Figure 11 Charcoal making kiln from coconut shell ................................................................................................................... 27 Figure 12 Illustration of a biomass based steam generation system [Tin Thanh, 2010] ................................................... 32

v
ABBREVIATIONS AND ACRONYMS
AIST Advanced Institute for Science and Technology
CDM Clean Development Mechanism
CIFOR Center for International Forestry Research
ECN Energy Research Centre of the Netherlands
ENERTEAM Energy Conservation Research and Development Center
EU Europe
FAO Food and Agriculture Organization
FBC Fluidized Bed Combustion
FSR Feasibility Study Report
GIZ Deutsche Gesellschaft für Internationale Zusammenarbeit
HAWA Handicraft And Wood Industry Association
IE Vietnam Institute of Energy
IEA International Energy Agency
JICA Japan International Cooperation Agency
LEAP Long-term Energy Alternative Planning
MARD Ministry of Agriculture and Rural Development
MDF Medium Density Fiberboard
MOEJ The Ministry of the Environment of Japan
MOIT Ministry of Industry and Trade
NWFPs Non-Wood Forest Products
R&D Tech Center of Research and Development for Industrial Technology – Machinery
REED Reducing Emissions from Deforestation and Forest Degradation
RIAM Vietnam Research Institute Agriculture Machinery
SFE State Forest Enterprises
SME Small and Medium Enterprises
SNV SNV Netherlands Development Organization
TBFRA Temperate and Boreal Forest Resources Assessment
TOE Ton of Oil Equivalent
US United States
USAID United Stated Agency for International Development
VCEP Vietnam Clean Energy Program
VIAEP Vietnam Institute of Agriculture Engineering and Postharvest Technology
VNFOREST Viet Nam Administration of Forestry
Woody Biomass for Energy Generation in Vietnam - Final Report
1
1. INTRODUCTION TO THE STUDY
This study provides an overview of the opportunities of woody biomass (residues) for energy
generation, including potential future use as well as an overview of the current use. It is
prepared as part of the USAID Vietnam Clean Energy Program, funded by the USAID, and
with Winrock International as the main implementer.
The main focus of the Vietnam Clean Energy Program, Sub-IR 2.3 is to increase public and
private investment in and piloting of renewable energy technologies. This is split into 3 focus
areas:
Result 2.3.1 Developers have economically viable renewable energy projects
Result 2.3.2 Policy framework for renewable energy facilitates private sector investments
Result 2.3.3 Off-grid poor communities gain access to renewable energy
Woody Biomass is a high potential source of energy for Vietnam. Wood has several important
advantages, mainly related to their characteristics and the fact that it can easily and with high
efficiencies (in general) converted to energy, especially when we talk about wood residues as
this is a renewable source. Substantial amounts of wood residues (waste) are widely used by
households and industries, meanly for cooking and heating on household level whereas
industrial applications range from mineral processing, food and agro processing, metal
processing, and textiles.
Section 2 and Section 3 provide a general view on the woody biomass exploitation in Vietnam
and the energy potential from forestry sector, it also gives an overview of local technology
supply. These two sections provide an insight into all form of wood residues which originated
from forests harvesting activities (direct wood-fuels) and from other wood processing
activities such as sawmills and timber manufactures (indirect wood-fuels).
Section 4 and 5 introduce the current wood energy conversion technologies and equipment
used in Vietnam, ranging from densification technologies like pelletizing to large scale industrial
use of woody biomass. The woody biomass conversion technologies can be classified into
three categories: traditional, state-of-the-art, and emerging technologies.
2. WOODY BIOMASS EXPLOITATION IN VIETNAM In this chapter background information will be provided, based on existing literature and
interviews, on the forestry sector and developments in Vietnam. There is no concistant data
available on the forestry sector, and many different reports and sources give
(sometimesslightly) different figures on forest sizes, wood collection from forest and other
parameters. For this report some key reports have been used, with similar data (but not
identical), but in some cases there might be small differences between the data mentioned due
to the different sources (MARD, 2012), (MARD, Vietnam Forest Development Strategy, 2006-
2020), (FAO, 2009), (FAO, 2002), (SNV, 2012), (VN Forest, 2013) and (Forest Trend, 2013).
2.1 Background on forest development
The forests in Vietnam varied over time, in 1943, Vietnam had 14.3 million hectare of forest
area, with 43% of forest cover. However, the forest area rapidly decreased in period of 1980

Woody Biomass for Energy Generation in Vietnam - Final Report
2
to 1990, losing 100,000 hectare annually, reducing to 9.18 million hectare in 1990 with a forest
cover of only around 27%. From 1990 onwards forest area and coverage has been increasing
as a result of the forest development strategy launched by MARD in 1995 in combination with
a large number of programs to protect forests and increase both the quantity and quality of
forests throughout the country1. In 2006, forest area in Vietnam was 12,874 million ha (38%
forest cover), of which 10.41 million ha were natural forest and 2,464 million ha were
plantation forest. According to the latest update of forestry in 2012 by MARD, there is almost
14 million hectare of land covered by forest (41% forest cover), which is mainly natural forest
(over 10 million ha). The forest distribution has been indicated in table below.
There are several definitions to label forest areas, it is defined by the situation that
resemblances to the condition that would obtain in the complete absence of human
intervention. Forests and other wooded land are characterized as natural (undisturbed by
man), semi-natural (under some degree of management, or evincing past human intervention)
or plantation (under active management) (TBFRA 2000).
TABLE 1: THE FOREST DISTRIBUTION IN 2012 (MARD, 2013)
No Forest type
Area (ha) Belong to 3 forest types2 Out of forest
land (ha) Subtotal (ha) Special-use
forest (ha)
Protective
forest (ha)
Productive
forest (ha)
1 Natural forest 10,423,844 2,021,995 4,023,040 4,415,855 44,641
2 Plantation forest 3,438,200 1,940,309 652,364 2,548,561 155,589
a Dense forest 3,039,756 81,686 576,764 2,253,215 137,558
b Yung forest 398,444 9,467 75,600 295,346 18,031
3 Total 13,862,043 2,021,995 4,675,404 6,964,415 200,230
FIGURE 1: THE FORESTRY AREA AND COVERAGE IN PERIOD OF 2005 – 2012
1Several large programs have been implemented including The Greening of Bare Land Program (Project 327, 1993-1998), the Five Million
Hectare Reforestation Program (1998-2010), the Forestry Extension Program, the National Action Plan for Biodiversity (1995, 2007), the National Action Plan to combat desertification, 2006-2010. On a policy level; National Forestry Development Strategy 2006–2020, Forest Protection and Development Law 2004, The Biodiversity Law 2008 2Vietnam categorises forests by designated use (Source: Circulation 34/2009/TT-BNNPTNT, 10 June 2009 of MARD.):
1. protection forest, reserved for watershed and soil protection, prevention of erosion and desertification, and environmental preservation;
2. special-use forest, designated mainly for natural area preservation, ecological diversity, germplasm conservation and scientific research; and
3. production forest, used mainly for timber production in combination with watershed and environmental protection..
12,616,699 12,530,201
12,837,733
13,118,77313,258,842
13,388,075 13,515,064
13,862,043
11,500,000
12,000,000
12,500,000
13,000,000
13,500,000
14,000,000
2005 2006 2007 2008 2009 2010 2011 2012
Forestry coverage area (ha)

Woody Biomass for Energy Generation in Vietnam - Final Report
3
The additional attention from the Government, supported by multiple donors have resulted in
increasing forest standing stocks. From 751 million m3 in 1997-1999, to 812 million m3 in late
2005 of which natural forest accounted for 93.4% and by 2010 the total timber volume of the
whole country increased up to 935 million m3. The average volume of the growing stock of
intensive plantation forest was measured to be 40.6 m3/ha. The stocks of bamboo and rattan
(non-timber) were high at around 8.5 billion stems distributed in natural forest and some areas
of plantation forest (MARD, 2011).
FIGURE 2: THE COUNTRY FOREST STANDING STOCK (MARD, 2011)
The distribution of the plantation forest is show in the table below. In the Central & Highlands and in
Northeast, forest cover is high at over 40%. In the Southeast forest cover is about 20% whereas in the
Red River Delta and Mekong River Delta, most of the area is used for agriculture and forest cover is
below 10% (VNFOREST, 2011). It is interesting to look deeper into the net rate of forest change, as
indicated below in Box 1.
BOX 1: NET RATE OF FOREST CHANGE 2000 - 2005
A 5-year net rate of forest change of almost zero The REDD and Sustainable Development – Perspective from Viet Nam (SNV, 2010) report shows that the net
rate of forest change in Viet Nam between 2000 and 2005 was relatively close to zero, acknowledging that there
is a large degree of variation throughout the country. Forest cover changed significantly in parts of Viet Nam,
even though increases in some places mask decreases in others when national averages are examined. In some
areas, forest loss was quite drastic between 2000 and 2005. For example, three provinces saw more than 50% of
the forest cover they had in 2000 lost by 2005: An Giang saw its cover decline from 18.48% to 7.68% (a 58%
loss), Tra Vinh from 15.16% to 7.04% (54% loss) Dong Thap from 18.17% to 8.74% (52% loss). Looking at
districts, as would be expected from the low national deforestation rate, most have a relatively low net rate of
forest change (around 0 on the plots below). However, some have quite pronounced rates of forest cover loss.
Vietnam plantation forest continued to increase in recent years, with an average of around
150,000-200,000 ha/year. It is expected that with such an increase in plantation forest in
Vietnam the timber supply for the wood processing industry and the wood chip industry will
also continue to grow.
0
200
400
600
800
1000
1997 - 1999(inventory)
2001 - 2005(inventory)
2010 (reportedby provinces)
75
1.5
81
1.6
93
5.3
30.6 53.4 74.8
Timber Volume Vietnam
Total timber volume(Mill.M3)
Woody Biomass for Energy Generation in Vietnam - Final Report
4
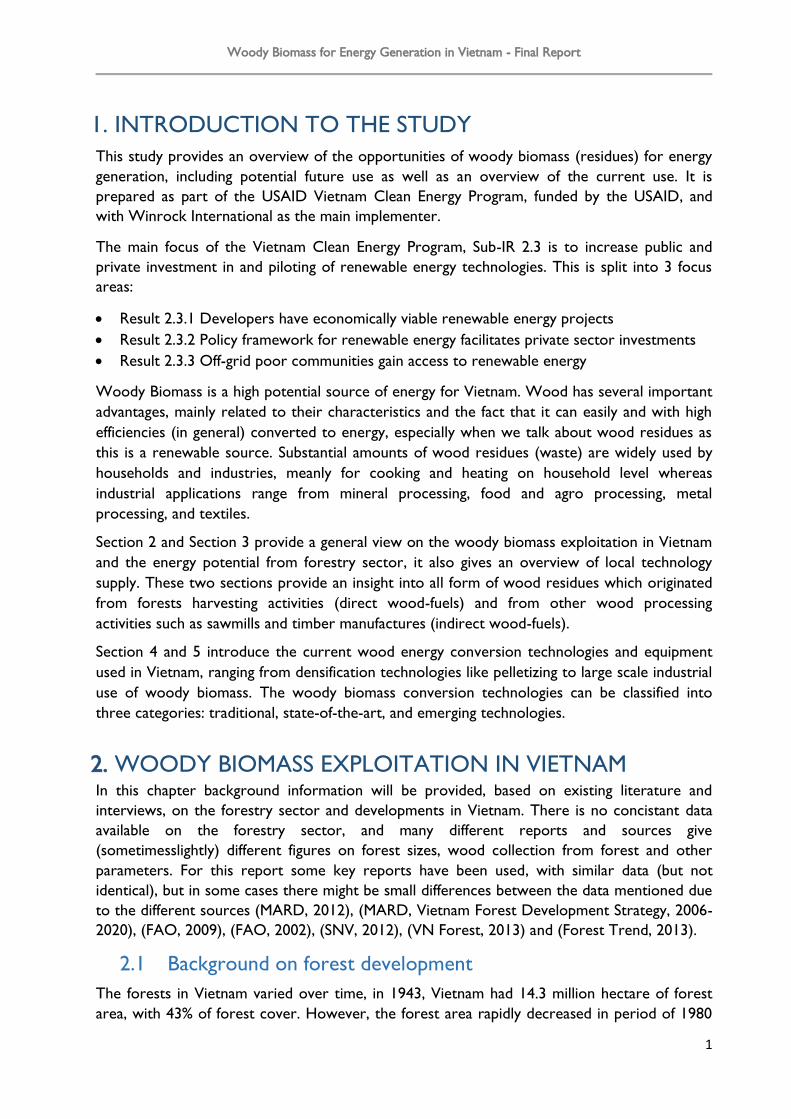
TABLE 2: THE DISTRIBUTION OF PLANTATION FOREST AREAS IN REGIONS (HA)
(VNFOREST, 2011)
Regions 2007 2008 2009 2010 2011
Northeast 116,544 123,863 150,055 152,328 155,394
Northwest 943,899 1,015,266 1,089,600 1.120.793 1,184,844
Red River Delta 47,618 48,547 48,915 48,675 48,701
North Central 576,556 615,443 654,793 679,872 701,160
South Central 342,349 391,892 417,323 491,500 526,117
Highland 157,575 197,324 209,450 220,495 237,366
Southeast 124,448 139,518 133,514 161,840 176,977
Southwest 244,380 238,329 215,886 207,756 199,123
Total 2,553,369 2,770,182 2,919,538 3,083,259 3,229,682*
* numbers are slightly different than in table 1 due to the use of different sources.
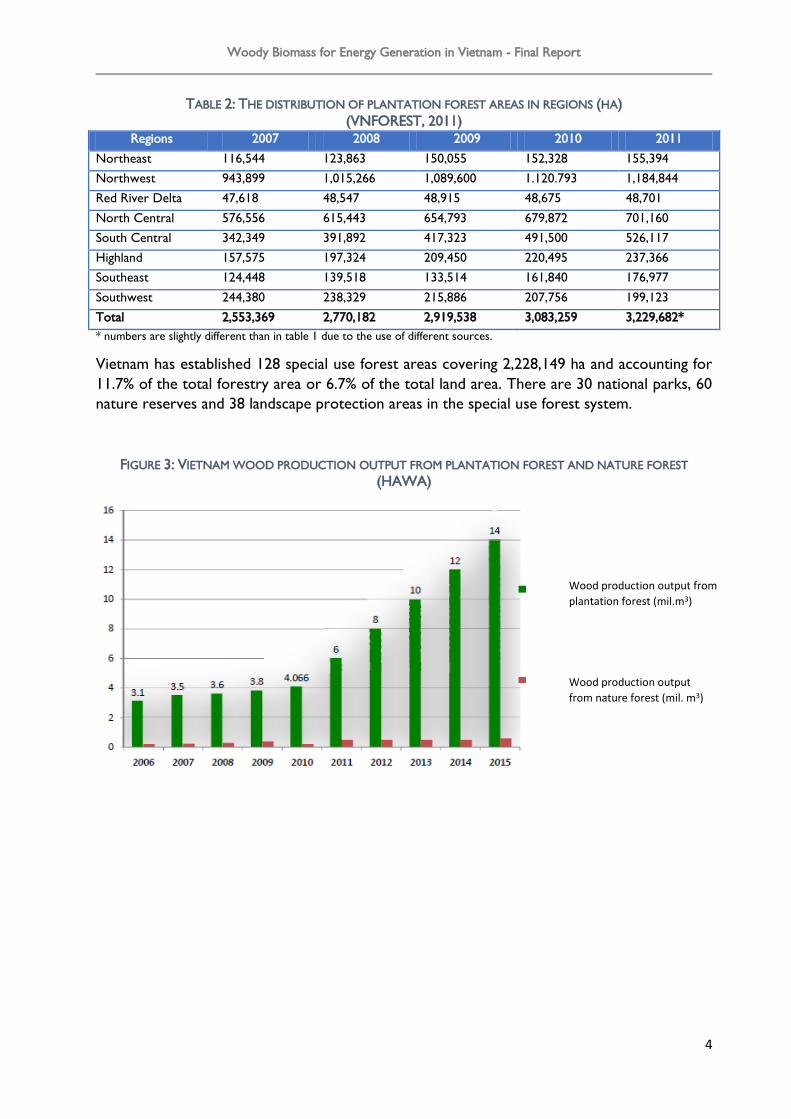
Vietnam has established 128 special use forest areas covering 2,228,149 ha and accounting for
11.7% of the total forestry area or 6.7% of the total land area. There are 30 national parks, 60
nature reserves and 38 landscape protection areas in the special use forest system.
FIGURE 3: VIETNAM WOOD PRODUCTION OUTPUT FROM PLANTATION FOREST AND NATURE FOREST
(HAWA)
Wood production output from
plantation forest (mil.m3)
Wood production output
from nature forest (mil. m3)

Woody Biomass for Energy Generation in Vietnam - Final Report
5
FIGURE 4: THE FOREST COVERAGE IN VIETNAM IN 2010 (SNV)
2.2 Forest harvesting and utilization Forest utilization is in line with forest management regulations under the Decision No. 86/TTg
of the Government and following series of timber and forest products harvesting management
regulations. In 20 May 2011, MARD has issued the Circular No. 35/2011/TT-BNNPTNT on
guiding the implementation of timber and non-timber forest product harvesting and salvaging.
Recently VNFOREST issued the Document No.98/TCLNSDR dated 10/2/2012 to direct
provinces to strengthen their management of timber and timber product harvesting, especially
the harvesting of natural forest timber. The harvesting of plantation forest, processing,
importing, and exporting of timber and timber products have been monitored and examined
thought out country.

Woody Biomass for Energy Generation in Vietnam - Final Report
6
Given consumption trends in recent years, timberharvest from natural forest, scattered trees
and plantation should reach 20-24 million m3/year by 2020 (of which 10 million m3 should be
“big” timber).To achieve adequate supply to the high demand of the wood processing industry,
it will be necessary to improve forest plantation productivity to average more than 15
m3/ha/year. Natural forest growth will be 2-5 m3/ha/year depending on forest status (FAO
2009).
Harvesting from plantation forests
Vietnam has almost 3.5 million ha of plantation forest (MARD, 2011), of which about 75% is
productive forest. This can provide approximately 14.8 million m3 of timber. In addition,
scattered timber and garden trees is also very large, estimated about 2.5 million m3 per year.
Total production of timber from plantations and gardens households estimated 17.3 million m3
in 2011, that is not including about 2 million m3 of wood from the rubber tree disposal
(VNFOREST 2013).
According to estimates, about 63 % of the total amount of timber harvested from plantation
forests are being processed woodchips that are entirely exported to China, Korea, Japan,…to
be used for paper production. The remaining 37 % of total timber harvested go directly to the
pulp and paper, artificial boards, furniture production and construction or fuel-wood as
domestic uses (VNFOREST 2012). The structure of plantation forest timber distribution in the
have been given in the figure below.
FIGURE 5: THE FLOW OF WOOD FROM PLANTATION FOREST AND SCATTED TREES IN 2011
(FOREST TRENDS 2013)
Natural forest The State Forest Enterprises (SFE) manages about 26% of the natural forest for timber
production. Conventional loggings are carried out by SFE or logging contractors. Intensive
logging happened in the period from 1976 to 1980 with 1.62 million m3 /year, many forest
areas have been degraded and the non-commercial crops trees are left in the forest influencing
the biodiversity. However, the amount of timber being harvested from the natural forest has
considerably reduced over the last few years, for example, from 1.2 million m3 in 1992, to
450,000 m3 in 1996-1997 and 300,000 m3 in 2001-2002. From 2005 up to date, the natural

Woody Biomass for Energy Generation in Vietnam - Final Report
7
forest logging are set down to 200,000 m3/year. The changes in the natural forest harvesting
are given in the table below.
TABLE 3: THE NATURAL FOREST TIMBER HARVESTING
(VIETNAM FORESTRY HANDBOOK, MARD 2012, 2013)
Time Nature Forest exploited
volume (m3)
Annual exploited volume
(m3/yr)
1955 - 1960 3,168,160 530,000
1961 - 1965 4,957,000 991,400
1966 - 1975 8,100,000 810,000
1976 -1980 8,100,000 1,620,000
1981- 1985 7, 000,000 1,400,000
1986- 1989 5,289,000 1,300.000
1990- 1998 5,701,000 630,000
1999- 2002 1,200,000 300,000
2003-2004 250,000 250,000
2005 200,000 200,000
20113 359,600 350,600
2012 160,000 160,000
Illegal logging also continues to be a problem in Vietnam, and this is not only due to to the
presence of poor villagers, corrupt local officers, illegal traders or a lack of law enforcement. It
is also because there is a the lack of (or uncertainty of) tenure rights given to local people
living near forests containing valuable timber, thus legally excluding them from forest benefits
including those from timber.
Wood from natural forest is large (diameter of imported wood is from 25 cm to 60cm) which
is usually used for making handicraft, furniture and outdoor furniture. Wood from natural
forests is the major raw materials for these products, taking a high proportion of structural
material of wood processing industry. Vietnam is the second-largest furniture exporter in Asia,
after China, mainly exporting to the US and the EU. The trade is one of the country's top five
export products in monetary value (worth $2.4 billion a year). Currently, wood demand from
natural forests is very high, while domestic materials only meet 20% of demand, the remaining
of 80% must be imported. In 2009, Vietnam had to import 4 million m3 for the wood
processing industry.
Bamboo Bamboo is a local forest product used mainly for handcrafts production at village level for local
markets and for floor production at an industrial scale for export markets. According to
MARD, the harvesting of bamboo reached 55,000 trees in 2011 and 58,000 trees by 2012. The
estimated cultivation area of bamboo in Vietnam is 800,000 hectares of plantations with an
average annual yield of 10 to 13 tones per hectares and 600,000 hectares of mixed forest,
comprised of up to 70% bamboo.
3numbers are slightly different than in the text above due to the use of different sources, and there are a lot of different
numbers, in the different sources.

Woody Biomass for Energy Generation in Vietnam - Final Report
8
Bamboo utilization is focused on three major subsectors in the south; value added processing
(20% for pressed flooring), bulk processing (80% homeware, chopsticks and handicrafts),
construction material (wattles) and emerging bamboo shoots sector at local level. Presently
the demand for bamboo in Vietnam is larger than supply. Bamboo production faces land
pressure issues due to the diverse demand for other forest species and forest protection
enforcements. (SNV, 2012)
2.3 Wood Processing Sector Demands and Status Timber and forest products have experienced rapid growth in terms of value in Vietnam, the
sector’s has great contribution to the national economy, and Vietnam is the fourth largest
exporter of wood products and its timber industry (CIFOR, 2012), more recent newspaper
articles indicate even the second largest after China (Vietnam.vn, 2013). The General
Department of Forestry says the wood processing industry grew at an annual rate of 41–42%
in the 2005–2010 period, and 20–30% in the last three years. The main wood products include
rough products (sawn wood, plywood panel, composite panel), refined products (wooden
board, wooden beds, etc), and handicraft or artisan products – nevertheless the competitive
woodchip market is competing directly with the demand for wood.
In 2011, the total volume of timber wood processing industry serves some 16 million m3 of
logs, of which 7 million m3was used for chips and paper production, 3 million m3 was used for
the domestic market (processing facilities and furniture) and 6 million m3 for export markets
(Forest trend 2013). The wood materials for the wood processing industry tend to increase
every year.
Wood from plantation forest in Vietnam is is medium and small sized and therefore not
suitable (in general) for the furniture industry and typically used as material for processing
paper, manufacturing artificial wood board (planks, boards chips, fiber plywood). It is estimated
that about 63% is being processed to chips and the remaining 37% goes directly to the pulp
and paper sector, artificial boards, (small amounts to) furniture production and construction
(VNFOREST 2012).
The raw timber from plantations and natural forests in the country for the wood processing
industry is limited, reaching 12,3 million m3 round wood/yr. Each year Vietnam has to import
about 4 million m3 of logs to serve furniture manufacturers, accounting for approximately 70-
80% of wood materials in the furniture industry (Forest trend, 2013)(CIFOR, 2012). Raw
materials are mainly imported from other countries such as Laos, the U.S., China, Malaysia,
Thai Land, Cambodia. The amount of wood materials imported into Vietnam increased from 1
million m3 in 2003 to about 4 million m3 of logs in 2008-2009. The imported wood material is
mainly sawn timber which account for 55%; 15% is round wood and remaining 30% is MDF and
different type of plywood.
According to MARD’s forecast, the sawn wood demand for wood processing industry in
Vietnam in 2020 will increase to 7 million m3, equivalent to 15 million m3 of round wood, and
Vietnam still has to import raw materials timber till 2020.

Woody Biomass for Energy Generation in Vietnam - Final Report
9
FIGURE 6: THE SAWN WOOD DEMAND FOR FURNITURE PRODUCTION IN VIETNAM (SOURCE MARD)
The domestic wood production during 2001–2009 increased by only 5.9%, whereas imports
increased by 18% in the same period. Vietnam Forestry Development Strategy 2006 – 2020
aims to reduce dependence on international imported timbers (from 80% to 20%) by 2020 by
expanding the area of plantations, developing domestic forest reserves to replace imports,
certifying 30% of national production forests and developing and upgrading the export
processing industry (CIFOR, 2013).
TABLE 4: FORECAST FOR VIETNAM’S TIMBER DEMAND (MARD, 2006)
Wood timber type (1000m3) 2003 2010 2015 2020
Domestic consumption and export timber 7,420 14,004 18,620 22,160
Large timber used for industry 4,561 8,030 10,266 11,993
Small wood used for producing particle board
and wood-based paneling 1,649 2,464 2,992 1,682
Pulpwood 1,150 3,388 5,272 8,283
Pit wood 60 120 160 200
2.4 Woody biomass development plans The forest and forestry objectives for 2020 given in the Vietnam Forestry Development
Strategy to 2020 are focusing on the following:
To establish, manage, protect, develop and use 16.24 million ha of land planned for forestry
and to increase forest cover to 47% by 2020. Growth in the value of forest production
(including forest product processing and environment services) is targeted at between 3.5%
and 4% per year, this goes hand in hand with a GDP from forestry growth, with a goal of 2-3%
of GDP.
To manage, protect, develop and sustainably use 8.4 million ha of production forest —
including 4.15 million ha of plantation forest, 3.63 million ha of natural production forest and
0.62 million ha of rehabilitating natural forest for agro-forestry — 5.68 million ha of protection
forest and 2.16 million ha of special use forest.
Conduct reforestation after harvest of 0.3 million ha per year, plant 200 million scattered tree
per year. While afforesting 1.5 million ha in the period of 2010-2020 and harvesting around 20-
0
5
10
15
20
25
2000 2005 2010 2015 2020 2025
Demand (mil.m3)
Domestic availability (mil.m3)
Import (mil.m3)

Woody Biomass for Energy Generation in Vietnam - Final Report
10
24 million m3/year (of which 10 million m3 are big timber), to meet the material demands from
the forest product processing and pulp industry, and for export.This export of forest products
is expected to reach US$7.8 billion (US$7 billion of timber products and US$0.8 billion of
NWFPs). With the current growth rate of export of forest product at around 20%/year.
Fuel-wood harvest for the rural area to amount to 25÷26 million m3/year. However, forecasts
fuel-wood demand to reach 10.24 million tones by 2020 (FAO, 2009).
Increase in income from forest environmental values through the Clean Development
Mechanism (CDM), eco-tourism and water resource protection will reach US$2 billion by
2020.
3. ENERGY POTENTIAL AND USAGE OF WOOD RESIDUES
The woody biomass residues can be divided groups of products, as show below:
1) Forest residues, often left in the forest – as currently it is often not economically
feasible to transport them out of the forest. This includes stumps, branches, leaves and
bark.
2) Saw mill residues & 3) wood processing industry - this could include bark, woodchips,
sawdust and wood shavings and/or odd-sized chunks.
Besides the above more obvious residues there are also the bamboo residues produced during
processing ranging from 50% to 70% of the total bamboo processed (SNV 2012). The waste
material from bamboo processing is used for making briquette charcoal, such as bamboo
shavings, bamboo particle, bamboo ends, and bamboo sticks in different length.
The heating value of woody biomass has relatively little variation, it depends on the
composition of the wood. Energy content is proportional to the dry-weight of wood; so higher
density woods have higher calorific values. In general, softwoods have higher heating values
than hardwoods and branches have a higher heating value than bark. Moisture content also
affects the potential heating value, the drier the fuel, the higher the heating value. Some
indicators of the compositions are given in the table below, this are just for indication.
TABLE 5: HEATING VALUES FOR SEVERAL TYPES OF WOODY BIOMASS (RESIDUES)
(ENERGY BASIC, FACT SHEET 5.8)
Fuel type
Moisture
content
(%)
Net
heating
value
(MJ/kg)
Net
heating
value
(Kcal/kg)
Ash content
(%)
(ECN, 2014)
Volatile
(%)
Fixed
carbon (%)
Green Wood 50% 9.5 2,27 3.56 35.98 10.46
Seasoned Wood 20% 15.5 3,71 -
Dry Sawdust 13% 16.2 3,87 1.29 72.93 12.78
Wood Pellets 10% 16.8 4,02 0.2 73.98 15.82
Dry Wood (Non-
resinous)
0% 19.0 4,54 2.15 81.02 16.83
Dry Wood (Resinous) 0% 22.5 5,38 -
Dry Stem wood 0% 19.1 4,57 1.7 79.8 18.5
Dry Bark 0% 19.6 4,69 6.8 59,32 13.48
Dry Branches 0% 20.1 4,80
Dry Needles 0% 20.4 4,88 1,5 72.4 26.1

Woody Biomass for Energy Generation in Vietnam - Final Report
11
The moisture content plays a crucial role in determining the calorific value. The moisture
content of wood is around 50 % (of total weight) when first harvested, whereas air-dried
wood contains between 12% to 20% of moisture yielding a calorific value between 14 MJ/kg
and 16 MJ/kg. The depicts the influence that wood moisture has on calorific value is given in
table below.
TABLE 6: INFLUENCE OF WOOD MOISTURE ON CALORIFIC VALUE (ENERGYPEDIA, 2014)
Moisture content
(%) Heat value (MJ/kg) Heat value (Kcal/kg)
0 19.0 4,538
10 16.9 4,036
20 14.7 3,511
30 12.6 3,009
40 10.4 2,484
50 8.2 1,958
60 6.1 1,456
The wood residues in Vietnam has slightly lower quality compared with above data, the
property of wood waste in Vietnam is provided in the table below.
TABLE 7: HEAT VALUE OF DIFFERENT WOODY BIOMASS MATERIAL (QUYNH, 2009)
Woody biomass
/fuels
Moistures content
(%)
Heat value
MJ/Kg Kcal/Kg
1 Wet-Wood 40 10.9 2,604
2 Dried wood (not in good
storage condition)
20 15.5 3,703
3 Dried wood 15 16.6 3,965
4 Dried up wood 0 20.0 4,778
5 Sawn dust 12 - 20 18.5 -19.0 4,420 - 4,778
Wood residues can be used as energy or input materials for other energy products type such
as wood pellet, charcoal. In which, sawdust is mostly used as feedstock for pellet production
because of its small size (it doesn’t required additional preprocessing like crushing). Meanwhile
the branches and other big wood waste collected from forest are used for charcoal
production or firewood. The bark waste is not widely used as fuel in industry because of its
low volatile content. Moreover, bark is bulky waste that is not effective in transportation. Bark
waste normally collected by local people and used for cooking purposes.
The sources of wood residues include both forests and non-forest lands. Forests include
natural forests, plantation forests, other woodlands including shrub lands. Non-forest lands can
include village woodlots and small tree farms, agro-forestry systems, home gardens, crop lands,
and scattered and line trees on roads, rivers, canals and areas considered as wastelands.
Vietnam has enormous potential for fuel-wood development and scientists have estimated that
natural forests are likely to provide about 41 million tones of fuel-wood/year, plantation forest
1-2 million tones/year and scattered trees 8-10 million tones/year with a total of 70 ÷ 80
million tones per year (26 ÷ 28 million TOE).

Woody Biomass for Energy Generation in Vietnam - Final Report
12
3.1 Forest management – residues and potentials Forest residues consist of everything that is not taken from the forest when the logs are taken
out, the rate of materials taken out of the forest depends on the diameter and quality of the
log. Of the log input, the main forms of waste are log ends and trims (7%), bark (5%), log cores
(10%), green veneer waste (12%), dry veneer waste (8%), trimmings (4%) and rejected
plywood (1%) (FAO, 1990).
Recovery rates vary considerable depending on local conditions and on the type of forest it
can be anywhere between 40% and 60%. The ratio 50/50 is often found in the literature e.g.
for every cubic meter of log removed, a cubic meter of waste remains in the forest. In case
logging is carried out for export purposes, values can go up to 2 cubic meter of residues for
every cubic meter of log extracted.
In Vietnam, most of the wood residues are left in the forest to rot, in particular in sparsely
populated areas where demand for wood fuels is low. In some cases the residues are
converted into charcoal or the local people living nearby the forest come and collect the fuel-
wood for their cooking purposes. For Vietnam the assumption based on literature has been
made that about 60% of the materials taken from the forest is utilized and about 40% stays
behind.
Estimated amount of residues from logging is 2.2 million tones (2009), based on a wood yield
of 40% from logging (FAO, 1997). In 2010, 4.7 million tones of logged wood processed (0.7
tone/ m3). There is a considerable recovery of logging residues through collection or
production of wood chips for industrial use, or by collection by households for domestic
purposes. Bigger residues are converted into charcoal, which is then sold to the industrial
sector.
It is estimated in the same report that the distances in which fuel-wood transport is still
economically viable is around 100 km (this is estimated at around 50km in Europe), this implies
that fuel-wood may be available in interior and mountain regions and mainly serve the needs of
local communities as residential fuel-wood. The difficulty in using residues from logging is that
the transportation cost is relative high compared with the selling price due to the fact that you
are transporting a lot of water and air instead of heating value.
Based on the wood yield of 40% from logging, as the timber demand forecast given in Table 8
(section 2.3), the volume of wood waste drived from logging is calculated in the same table.
The residues from logging is mainly wet wood that applying the heat value of wet wood of 10.9
MJ/kg, wood residues from logging in the year of 2003 – 2020 would generate a potential
energy source as in table below. This is the potential before the actual conversion of the
residue into energy, for example when converting it in standard boilers another 10-20% loss of
energy value will take place, when further converted into electricity more losses will occur. All
potentials shown in the next few paragraphs are the theoretical potentials. Also the potential is
based on the heating values with 40-50% moisture content through natural (sun) drying and
the density of wood applied 0.7 tone/m3.

Woody Biomass for Energy Generation in Vietnam - Final Report
13
TABLE 8: FORECASTED ENERGY POTENTIAL GENERATED FROM WOOD LOGGING RESIDUES4
Wood type Unit 2003 2010 2015 2020
Timber demand (60%) 1000m3 7,420 14,004 18,620 22,160
The logging wood waste (40%
of timber demand))
1000 m3 4,947 9.336 12,413 14,773
1000 tones 3,463 6,535 8,689 10,341
Wet wood heat value MJ/kg 10.9
Energy potential TJ 37.743 71.234 94.714 112.720
There are no economic figures on the costs it would take to transport such forest residues
from the forest (or after chipping) to a nearby village for economic or energy use. Currently
such residues, if collected, are used on household level only. All literature review available in
Vietnam indicates that it is not economically interesting to collect such residues from the
forest for energy use – nevertheless no financial figures have been given to support these
assumptions. It is recommended that a in-field survey is executed to make clear estimations of
such costs.
One source (Yoshida, Suzuki, 2010) giving figures on the collection of forest residues from
rubber plantations after cutting (tops or branches) in Cambodia (about 30% of the cut volume)
can be done relatively affordable, the cost price is around US $5–7/ m3, including the
transportation cost to the customer. The residues in this case are used as fuel for kilns at
neighboring brick factories. Another example from the same article but for Malaysia gives
examples of cost prices for collection between 16 and 20 USD per m3, where the selling price
is as low as 3 to 5 USD/ m3.
Scattered trees are the small uneconomical trees left behind with the logging residues. It is
estimated there is more than 200 million scattered trees per year in Vietnam, equivalent to
100,000 hectare of plantations (VNFOREST, 2011). A fuel wood yield of 0.4-0.5 tone/ha/year is
expected, therefore, the fuel wood potential is about 50,000 tones per year (FSIV, 2009).
Collection of these scattered trees and other forest residues can only be done based on
sustainable forest management planning (to make sure sufficient material stays behind, for
nutritious and biodiversity reasons). In 2005, some 3.45 billion scattered trees were planted,
which is equivalent to 3.45 million ha planted at the density of 1,000 per ha. Scattered trees
produced 6.04 million tones of fuel wood in 2005. In the period 2006-2020, about 200 million
trees are planned to be planted every year. As a result, the amount of fuel wood to be
harvested by 2010 was expected to reach 7.79 million tones.
3.2 Estimations of the available residues from the industrial sector The Green Growth Forestry Strategy of Vietnam stimulates the (1) the use of sustainable raw
material, (2) the use of wood waste for energy production and (3) the development of
sustainable product. The use of wood waste (or residues) of the processing and forestry
sector could be for the products as written in Chapter 2.4.
Currently in Vietnam the industry is not using the full potential of wood residues. It is
reported that 20% of the wood remaining (branches etc.) after harvest is collected and
4To simplify the calculation, the same heating value is used for all residues (the 40%), therefore it is slightly over estimated.

Woody Biomass for Energy Generation in Vietnam - Final Report
14
traded/used by local people and/or the processors. An estimated 30% of biomass by-products
or waste is used for energy production, which means that the utilization of waste materials for
energy purposes is really small (Worner, 2012). An overview given by the same source give a
clear indication of the opportunities (a mass balance for wood processing industry).
FIGURE 7: THE BALANCE MATERIAL AND ENERGY USED IN WOOD PROCESSING INDUSTRY IN VIETNAM
(WORNER, 2012)
It is given the figure that 100% of round wood will generate 45% of wood waste in sawing
section, that include about 62% of slap shapes and 38% of sawdust at high moisture content.
The 55% of sawn timber goes into drying section and ready for the processing section. The
wood waste from sawing section will be reused about 20% for particle boards, fiber board
production and others; 30% will be utilized as fuel-wood for drying section and the remaining
50% will be sold to the market for multi-use purposes (for fuel for other industries, paper
production, packing material etc.).
The energy potential from wood waste in this chapter will be calculated based on the forecasts
for demand of Vietnam’s timber and forest product that has been issued by MARD (2006),
based on the emerging growth in demand for timber (see also more in Chapter 2.3).
Saw mills – residues and potentials Wood sawmills play an important intermediary role in wood processing industry that
connecting the raw material harvesting from forestry to the furniture manufacturing. In the
ongoing developments in the wood processing industry, many sawmill have appeared country
wide like for example in Ha Tinh (300 workshops), Quang Nam (717 workshops), Quang Binh
(384 workshops), Yen Bai (230 workshops) and Phu Tho (400 workshops). In addition, many
sawmills are not registered in the official statistics of Vietnam like additional ones in Quang
Binh, Kon Tum, Dak Lak, Nghe An etc. The capacity of these sawmills ranging from 300 m3 to
Sawing section
20% reuse
Final product Wood processing Drying section
40%
product
100% input of sawn timber
100% dries sawn
timber
100%
output 100% sawn timber input
55%
sawntimb
er
60%
wood
waste
Firewood 100% round
timber input 62% slab
30% 30% 45% wood
waste
38%
sawdust 20% reuse
50%
sale
50%
sale
60%
wood
waste

Woody Biomass for Energy Generation in Vietnam - Final Report
15
2000 m3 round wood/year, provide sawn timber mainly for the domestic use (Forest trend
2011). Saw mills can either be directly connected to the processing plant, or can operate
independently and feed into the processing plants.
The wood residues from sawmill include on average 12% bark, while slabs, edgings and
trimmings come up to a total 34% while sawdust is another 12% of the log input. After kiln-
drying the wood, further processing may take place resulting in another 8% waste (of log
input) in the form of sawdust and trim end (2%) and planer shavings (6%). For calculation
purposes a yield factor of 50% has been used of wood entering the sawmilling process (38%
solid wood waste and 12% sawdust).In 2010, the amount of wood residues from saw milling
was estimated about 2.35 million tones and the price of sawdust was about 250 – 400 VND/kg
(Forest Trend 2013).
In large sawmills these wood residues are typically used for providing process heat for timber
drying purposes, whereas the waste from small mills is typically used locally for domestic
cooking or collected for other purposes like energy for brick or lime factories, small industrial
application and/or as a source for parquet making (see also the chapter on pellets,
Chapter4.2). Some facilities additionally utilize sawdust by mixing with binding material to
produce particleboard (Quyen, 2006). In some cases sawdust is used for insect repellent
making. Sawdust sometimes is briquetted and carbonised and sold as a high-grade charcoal,
which commands a higher price than normal charcoal. Considerable quantities are also used to
cover charcoal mound kilns.
The energy potential of residues from saw mills is large. The wood residues as indicated above
are woodchip (shavings), slap wood (62%) and sawdust (32%) which totally account for 45% of
input material (Figure 7). Stationary mill chippers are often used to screen and re-chip some of
the residues to make the product more uniform in size and quality. A good quality mill chip is
considered a high-grade product, both for combustion systems and as a feedstock for paper
mills, particle boards, fiber board manufacture.
The energy potential from wood waste generated during sawing section will be calculated
based on the annual timber demand and assuming waste generation ratios of slap wood and
sawdust and its heat value given above. As the sawing section is before the drying section, the
wood residues from sawmills still contain a high moisture content.
TABLE 9: FORECASTED RESIDUE TO ENERGY POTENTIAL IN SAWING SECTION
Wood type Unit 2003 2010 2015 2020
Timber demand (100%) 1000 m3 7,420 14,004 18,620 22,160
Sawing wood waste (45% of timber
demand) 1000 m3 3,339 6,301 8,379 9,972
Slap wood waste (62% of sawing wood
waste)
1000 m3 2,070 3,907 5,195 6,183
1000 tones 1,449 2,735 3,636 4,327
Sawdust (32% of sawing wood waste) 1000 m3 1,269 2,395 3,184 3,789
1000 tones 888 1,676 2,229 2,653
Wet wood heat value MJ/kg 10.9
Wet sawdust heat value MJ/kg 10.9
Moisture content % 40-50%
Energy potential of slap wood waste TJ 15,795 29,811 39,637 47,173
Energy potential of sawdust TJ 9,681 18,271 24,294 28,912
Total TJ 25,476 48,082 63,931 76,086

Woody Biomass for Energy Generation in Vietnam - Final Report
16
The residues in the sawing section will be utilized for timber drying section and therefore 50%
will already be used within the process, the other 50% can be sold or utilized otherwise
(current destinations for this are unknown). Sawmills in remote areas have difficulties with
transporting the wood residues and are therefore the wood residues are normally (when not
fully collected by local people).
Wood processing industry – residues and potentials In the wood processing sector, the rate of wood residue depends very much on the
processing technology, the type of input material and the type of products that are made.
However, due to the old fashion techniques used in Vietnam it is known that only a small
volume of wood material is utilized as final product by the wood manufactures, about 40% of
the timber (Figure 7). Therefore, wood waste volume is large (about 60% of input material).
Woodchips after wood processing is various in sizes and types. Therefore, it requires
separation for treatment and processing, something that not all factories are willing to do.
Nevertheless homogeneous waste products have higher market prices. When the woodchips
are sorted they can be used to make particle boards, fiber boards (MDF) and wood-wool – it
could also be used to fuel to processes if heat is required in the wood processing industry
itself (drying - mainly in the large industries).
The usage of the residues from this sector are very similar to the usage of the residues from
the sawmill sector. Large amounts of residues are also sold to (nearby) households for cooking
purposes, with the rising living standard the demand reduces over the years. Instead of using
these wood chips, people use long wood pieces for burning because of its convenience in
transportation and combustion, and because it requires less attention during cooking tasks.
Wood chips from large scale factories, are often being recycled and used for producing
particle boards, fiber boards, or used for energy purposes for wood drying (ENERTEAM,
2012).
TABLE 10: RESIDUES FROM WOOD PROCESSING (IE, 2011)
Sources of wood waste Wood waste useful for energy production (million
tones in 2010)
Butt ends and tree bark 5.58
Sawdust and shavings 1.12
Building (timber formwork and house repairs) 0.80
Total 7.50
The wood residues from wood processing industry have been calculated based on the volume
of timber consumed and the ratios of residues generated during processing with sawdust (10%
wood material) and woodchip (50% wood material) as totally of 60% and its heat values (GiZ,
2011)
In 2010, about 16 million m3 was processed to produce 6.5 million m3 of sawn wood, the
wood residues was calculated to be 9.5 million m3, equivalent to 6.7 million tones (including
5.58 million tones of wood waste and 1.12 million tones of sawdust).
Woody Biomass for Energy Generation in Vietnam - Final Report
17
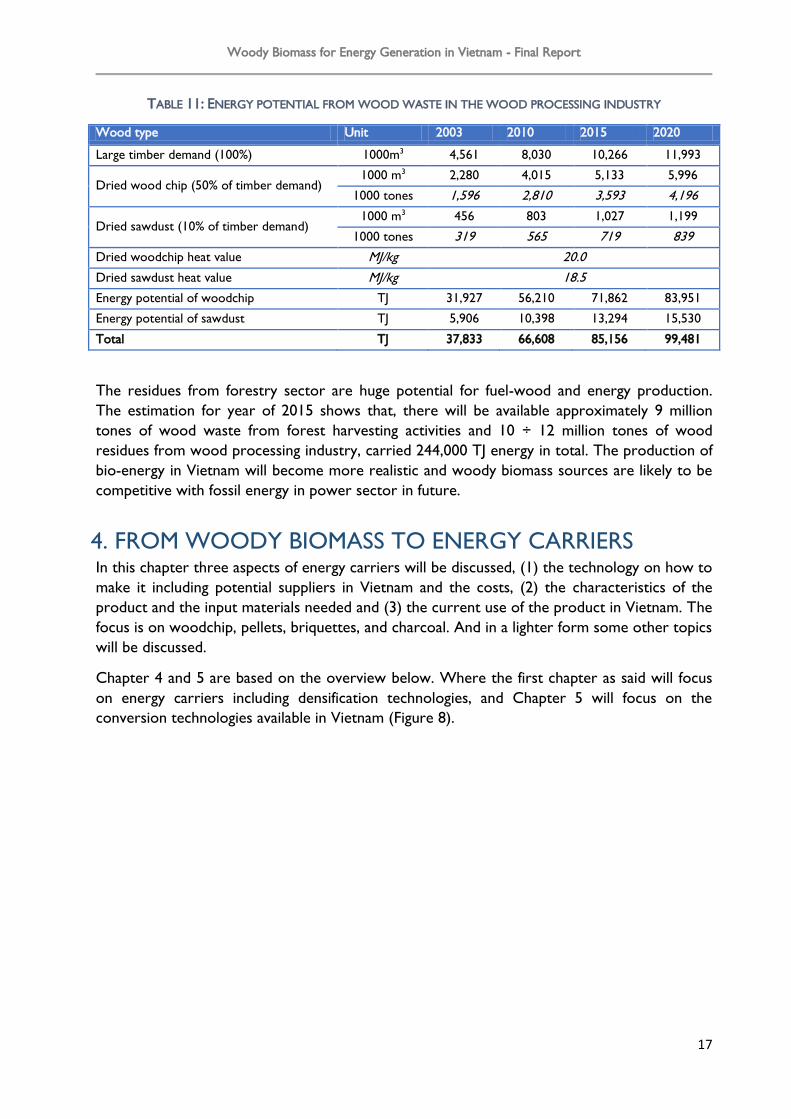
TABLE 11: ENERGY POTENTIAL FROM WOOD WASTE IN THE WOOD PROCESSING INDUSTRY
Wood type Unit 2003 2010 2015 2020
Large timber demand (100%) 1000m3 4,561 8,030 10,266 11,993
Dried wood chip (50% of timber demand) 1000 m3 2,280 4,015 5,133 5,996
1000 tones 1,596 2,810 3,593 4,196
Dried sawdust (10% of timber demand) 1000 m3 456 803 1,027 1,199
1000 tones 319 565 719 839
Dried woodchip heat value MJ/kg 20.0
Dried sawdust heat value MJ/kg 18.5
Energy potential of woodchip TJ 31,927 56,210 71,862 83,951
Energy potential of sawdust TJ 5,906 10,398 13,294 15,530
Total TJ 37,833 66,608 85,156 99,481
The residues from forestry sector are huge potential for fuel-wood and energy production.
The estimation for year of 2015 shows that, there will be available approximately 9 million
tones of wood waste from forest harvesting activities and 10 ÷ 12 million tones of wood
residues from wood processing industry, carried 244,000 TJ energy in total. The production of
bio-energy in Vietnam will become more realistic and woody biomass sources are likely to be
competitive with fossil energy in power sector in future.
4. FROM WOODY BIOMASS TO ENERGY CARRIERS In this chapter three aspects of energy carriers will be discussed, (1) the technology on how to
make it including potential suppliers in Vietnam and the costs, (2) the characteristics of the
product and the input materials needed and (3) the current use of the product in Vietnam. The
focus is on woodchip, pellets, briquettes, and charcoal. And in a lighter form some other topics
will be discussed.
Chapter 4 and 5 are based on the overview below. Where the first chapter as said will focus
on energy carriers including densification technologies, and Chapter 5 will focus on the
conversion technologies available in Vietnam (Figure 8).

Woody Biomass for Energy Generation in Vietnam - Final Report
18
FIGURE 8: POTENTIAL CONVERSION STEPS FROM BIOMASS TO ENERGY (CARRIER)
4.1 Woodchips
Technology, suppliers and costs One of the main challenging characteristics of biomass is the moisture content and the size.
When transporting biomass you are also transporting large amounts of water and air. Another
problem is the transport of logs and/or branches from the forest to the desired location.
Through chipping transport issues can be overcome, this will not solve the moisture challenges
– even though chips can be additionally dried before transported. This can take place either on
a small scale –often in the forest with portable machines as shown in Figure 9 (for smaller
trees and branches) or on a larger scale where whole logs can be processed.

Woody Biomass for Energy Generation in Vietnam - Final Report
19
FIGURE 9: DESIGN OF A WOOD CHIPPER FROM QINGDAO HAYLITE MACHINERY CO. LTD.CHINA5
Even though Vietnam is a leading woodchip production and exporting country, Vietnam is still
importing the technologies mainly from Taiwan and China for the large scale production.
National manufacturers developed and produce small chipping machines. Domestic
woodchipper capacity is observed to be from 30-35tones/h, and investment costs are between
2,500 and 3,000 USD depending on its capacity (Table 12).
TABLE 12: NATIONAL WOOD CHIP TECHNOLOGY MANUFACTURERS IN VIETNAM
Name of supplier Capacity Type of
biomass
Remark
Vietnam Pellet Machine (VPM) Ltd. 2-27 m3/h Woodchip www.vietnampelletmill.com.vn
Van Phu Equipment Ltd - Woodchip www.thietbicongnghiepvanphu.com
Phuong Tam Group 30-35 tones/h Woodchip www.maybam.vn
Phuong Quan U& I 25tones/h Woodchip www.mayepcuivien.com
COSACO Engineering & Machinery 10-30 m3/h Woodchip www.cosacovietnam.com
5Design just used for information purposes, it is not a local design nor used in Vietnam yet.

Woody Biomass for Energy Generation in Vietnam - Final Report
20
Woodchip export from Vietnam has been mainly to China, Japan and Korea, with price ranges
between 85USD and 138USD/ton. According to Vietnam Customs (Son Duong, 2013)
Vietnam has exported 1.6million tones of woodchip in the first quarter of 2013. This high
demand and better prices from abroad has created a situation where the domestic pulp and
paper producers face difficulties in sourcing their materials. The Vietnam pulp-paper
association has proposed to increase export tariff to 5% in order to limit the exploitation of
the young forest for woodchip production for export and for keeping the woodchip sources
for domestic paper production (see also chapter 0).
Wood chips properties Woodchips are a medium-sized solid material made by cutting, or chipping, larger pieces of
wood. Woodchips may be used as a biomass solid fuel and are raw material for producing
wood pulp.
Moisture contents can differ a lot depending on the freshness of the wood and the processing
steps taken. Moisture contents can be from 10 to 50% (ECN, 2014). All other characteristics
are equal to that provided in Chapter 3, as it is a forest product. Wood chips may have a bulk
energy density of about 50%. Wood chips for energy applications should meet an appropriate
quality standard if they are to be used reliably in combustion equipment, especially small scale
and domestic equipment – they should be homogeneous of size, especially when fed into
furnaces for energy generation (for optimal combustion). Physical parameters, such as
maximum size and absence of slivers or fines (sawdust), and maximum moisture content are
important to allow reliable operation and prevent feed blockages.
Woodchip production and use in Vietnam Woodchip production industry has grown explosively in the recent years. In 2009, there were
47 plants in Vietnam with woodchips export figures around 2.3 million tones. By 2012, this
increased to 112 plants with a total design capacity of approximately 8 million tones/year, and
with woodchip export figures that increased to 6.2 million tones (Table 14) (equivalent to 12.4
million m3 of round woof from plantation forest), 20% of global trading amount. Currently,
Vietnamese woodchip are mainly exported to China, Japan, Korea and Taiwan for the pulp-
paper production industry.
Most plants are under operation located in North Central and coastal provinces. The
explosion of woodchip industry could be explained by quick profits derived from woodchip
export; low investment cost, and especially in the increased available input material from
plantation forest.The wood chips in Vietnam is mainly from Acacia and Eucalyptus with small
amount of Cu mainly plated in the South.
TABLE 13: THE STRUCTURE OF INPUT MATERIAL FOR WOOD CHIP PRODUCTION INDUSTRY IN 2011 (FOREST
TREND, 2013)
Tree Volume (m3) Percentage (%)
Acacia 7,684,600 70
Eucalyptus 2,964,060 27
Cajuput 329,340 3
Total (m3) 10,978,000
Another 18 woodchip plants with a capacity of approximately 0.8 million dry tones/year were
expected to be put into operation in 2013. The woodchip plants normally operating with

Woody Biomass for Energy Generation in Vietnam - Final Report
21
approximately 60-70% of design capacity. Once fully in operations, the woodchip industry will
require about 18 million m3 of round wood as input material from the plantation forest of
eucalyptus and acacia. Given the current status of plantation forest, Vietnam will not have
enough inputs to provide those woodchip plants in the future. In 2012 the material was
provided by individual households (50%), state-owned enterprises and cooperatives (15%) and
private enterprises (35%).
TABLE 14: THE DISTRIBUTION OF WOODCHIP PRODUCTION IN VIETNAM
(FOREST TREND, 2013)
TABLE 15: WOODCHIP SUPPLIERS AND ITS CAPACITY PER ORGANISATION TYPE (FOREST TRENDS, 2013)6
Form of business Quantity Installed capacity (tones dry mass/year)
Limited companies 60 4.536.000
Joint stock companies 20 1.338.000
Private companies 12 385.000
Joint venture companies 18 1.650.000
Foreign companies 2 160.000
TOTAL 112 8.069.000
4.2 Wood Pellets
Technology, suppliers and costs The pelletizing of biomass such as sawdust, shavings from wood processing industry or from
forest residues, helps solving the relativelow -density problem of wood wastes. Wood pelletis
a type of biofuel made by compressing woody sawdust (from saw mills / wood processing
factories) as small pellets with diameter of about 4mm and moisture of lower 10%, which
makes it a very efficient for combustion.
Vietnam has limited experienced with pelletizing technology and imports wood pelleting
technology (i.e from Japan, German or Taiwan). Some domestic companies and research
centres have started studying and developing woody pelleting machines to adopt to
6 This survey is missing data from the Northwest and the Highlands
No Location Plant Design Capacity
(max tones/yr) Export output
(Tones/yr)
1 Red River Delta 3 270.000 226.000
2 North East - - -
3 North West 16 1.048.000 900.000
4 North Central 21 1.750.000 1.500.000
5 South Central 55 4.011.000 3.000.000
6 Highlands - - -
7 Southeast 6 590.000 400.000
8 Mekong River Delta 7 400.000 200.000
Total 112 8.069.000 6.226.000

Woody Biomass for Energy Generation in Vietnam - Final Report
22
Vietnamese condition such as Vietnam Institute of Agriculture Engineering and Postharvest
Technology (VIAEP) and Vietnam Energy of Institute. An overview is given in Table 16 on local
technologies available.In most cases the raw materials are collected from surrounding
households, sawmills and processers as input materials for the production processes.
TABLE 16: SMALL SCALE WOODY RESIDUES PELLET MACHINE SUPPLIERS IN VIETNAM
Name of supplier Compressing
capacity
Type of pelletized
biomass
Remark
Vietnam Research Institute
Agriculture Machinery (RIAM)
1-3 tones/h Biomass residues (rice
husk, coffee shell,
corncob, sawdust…)
www.riam.com.vn
Vietnam Institute of Agriculture
Engineering and Post-harvest
Technology (VIAEP)
- Biomass residues (rice
husk, coffee shell,
corncob, sawdust…)
www.viaep.org.vn
Vietnam Pellet Machine (VPM)
Limited
0.5-4 tones/h Woody wastes www.vietnampelletmill.com.v
n
Hatech Energy Corp 1,000 tones/h Woody wastes www.escohatech.com
Phuong Quan U&I Ltd 500-800kg/h Woody wastes www.mayepcuivien.com
Hoang Phi Limited 250-500kg/h Rice husk www.mayepcuitrau.com
Phuong Tam Group 500kg/h Woody wastes www.mayepcui.net
VPM Equipment & Technology 0.8-1.2 tones/h Woody wastes www.thietbivpm.com
Thanh Danh D.N Ltd 350kg/h Woody wastes www.thanhdanhdn.com
Nhat Phu Thai Ltd 1-1.8 tones/h Woody wastes www.nhatphuthai.vn
Che Tao Viet JSC - Woody wastes www.chetaoviet.vn
Van Phu Equipment Ltd - Woody wastes www.thietbicongnghiepvanph
u.com
The Institute of Energy (Cuong, 2013) has estimated productioncosts of pelletizing in Vietnam as the
table below.
TABLE 17: PRODUCTION COST OF BIOMASS PELLET (CUONG, 2013)
Type of applied technology Type of biomass Production cost (VND/kg)
Pelleting
Rice husk 1.968
Bagasse 1.467
Mixed bagasse and rice husk 1.532
Wood pellet properties The feedstock necessary to make this biomass fuel has anoptimal moisture content of less than
10% (a drying step is a standard stage of the pellet making process). Wood pellet production
has rapidly developed in Vietnam recently, following the ongoing trend of Renewable Energy in
general. Pellets are easier to store and can be handled automatically. Pellet production
systems are usually simpler and less expensive to install. The application of fuel pellets are
quite diverse, including: livestock, industry, in power, in domestic as for cooking. Some specific
specifications of wood pellets in Vietnam are given in Table 18. Official reporting by IE has
indicated nevertheless that the average heatingvalueof pellets from Vietnam is between 14.5
and 15 GJ/tone (Table 19, compared to –for example- 16.9GJ/tone for Canadian wood pellets.

Woody Biomass for Energy Generation in Vietnam - Final Report
23
TABLE 18: THE TECHNICAL SPECIFICATION OF A WOOD PELLET PRODUCER IN VIETNAM
Technical specification Pellet from sawdust* Wood pellet from
woodchip*
Wool pellet from rubber7
Diameter 8 mm x 10 - 15 mm 6 – 8mm x 10 – 50 mm 6mm
Density - 650 – 700 kg/m3 -
Heat value 4600 Kcal/kg > 4500 Kcal/kg 17.84 MJ/kg / 4260 kcal/kg
Moisture content 6 - 8% < 6% 8.08%
Ash content 1,5 - 2% < 1.2% 1.17%
Sulfate content < 0,03% 0.023% -
Carbon content < 15% - -
TABLE 19: LOW HEAT VALUE (LHV) OF BIOMASS PELLETS (CUONG, 2013)
Type of pelletized biomass Low heat value-LHV (MJ/kg) Low heat value-LHV (Kcal/kg)
Woody residues 14.5-15 3,463 – 3,582
Bagasse 7.8-8 1,862 – 1,910
Rice husk 12.5-13 2,985 – 3,104
Rice straw 11.5-12 2,746 – 2,866
* examples from TTK Wood Pellets Company
The European market has quite strict norms for the production of pellets, the most commonly
used norms are the DIN 51731 or Ö-Norm M-7135, with less than 10% water content and a
uniform density level (higher than 1 tone per cubic meter8). When produced by hammer mills
there is almost no difference in finished product even if different wood types are used – this is
heavily dependent though on the equipment used for production. The European market also
has a special sustainability label for wood pellets called the "EN-plus" label. This makes that no
pellets are currently transported to Europe. Nevertheless the Korean market is desperately
looking to import pellets from the Asia region their domestic supply is only 30% or less than
their demand9. The Korean market has no strict rules or standards on quality of the pellets,
even though prices for higher qualities are slightly higher.
BOX 2: POTENTIAL BUSINESS CASE FOR PELLETS - MANH THONG J.S.C. (SNV, 2012)
Manh Thong J.S.C. is a wood processing company; with 2500 Ha own concessionaries, making products from the
Hybrid Acacia tree, one of the most common trees in Vietnam.
During this process large amounts of residues are produced, as shave-wood, bark, sawdust (estimated in 10%
humidity, around 125MT / working day). They are planning on constructing three Completed Wood Pellet Plants
with 2 - 4 MT/Hr each plant on their plantation in Daknong Province and their Sawmill in Binh Duong Province.
After obtaining quotations, and visiting providers, in several countries among them, US, Italia, Germany and China,
Manh Thong is still looking for support in technology and financing, even though they are ready to invest
themselves. Feasibility studies show acceptable payback times as potential prices are below the current market
value of wood pellets. Furthermore the (co)ownership of Manh Thong of the concessionaries, wood processing
7 The rubber wood pellet qualify test control sample, product of Tan Phat company, certified by SGC 8 This means it sinks in water. Bulk density about 0.6-0.7 ton per cubic meter. 9 Interview with VinaWoodPellets
Woody Biomass for Energy Generation in Vietnam - Final Report
24
and pellet production plant will give multiple benefits, secured feedstock supply is the most important one.
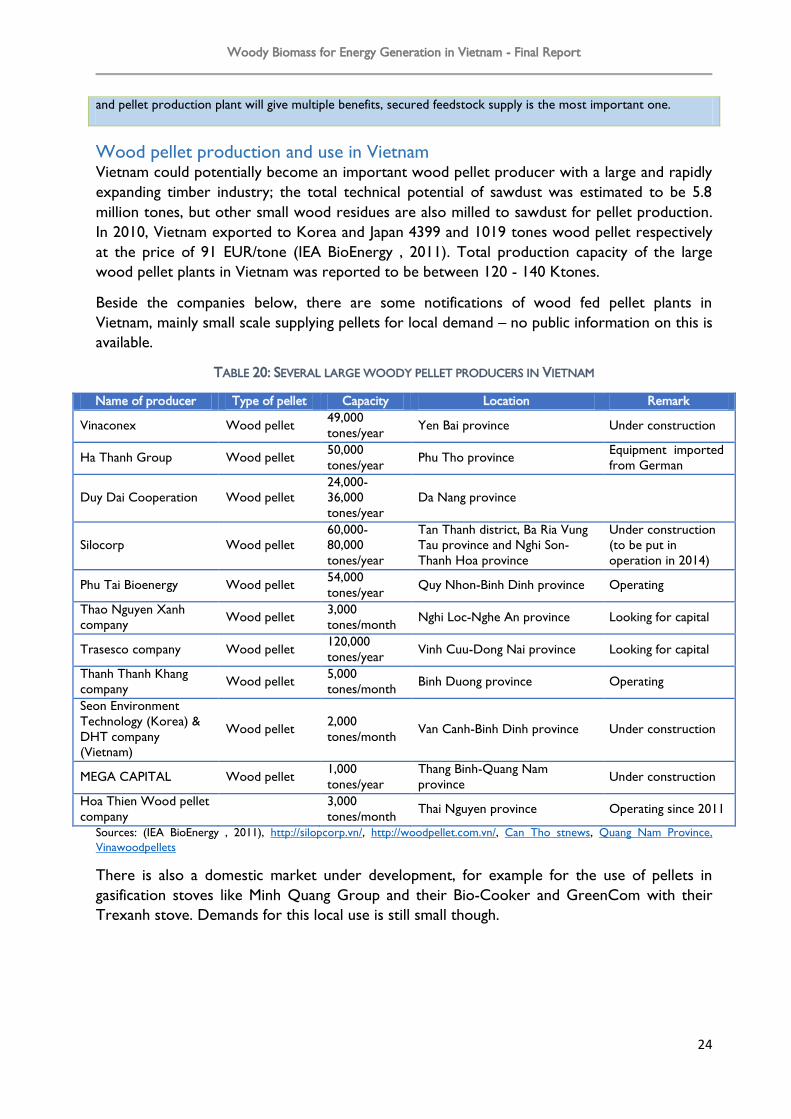
Wood pellet production and use in Vietnam Vietnam could potentially become an important wood pellet producer with a large and rapidly
expanding timber industry; the total technical potential of sawdust was estimated to be 5.8
million tones, but other small wood residues are also milled to sawdust for pellet production.
In 2010, Vietnam exported to Korea and Japan 4399 and 1019 tones wood pellet respectively
at the price of 91 EUR/tone (IEA BioEnergy , 2011). Total production capacity of the large
wood pellet plants in Vietnam was reported to be between 120 - 140 Ktones.
Beside the companies below, there are some notifications of wood fed pellet plants in
Vietnam, mainly small scale supplying pellets for local demand – no public information on this is
available.
TABLE 20: SEVERAL LARGE WOODY PELLET PRODUCERS IN VIETNAM
Name of producer Type of pellet Capacity Location Remark
Vinaconex Wood pellet 49,000
tones/year Yen Bai province Under construction
Ha Thanh Group Wood pellet 50,000
tones/year Phu Tho province
Equipment imported
from German
Duy Dai Cooperation Wood pellet
24,000-
36,000
tones/year
Da Nang province
Silocorp Wood pellet
60,000-
80,000
tones/year
Tan Thanh district, Ba Ria Vung
Tau province and Nghi Son-
Thanh Hoa province
Under construction
(to be put in
operation in 2014)
Phu Tai Bioenergy Wood pellet 54,000
tones/year Quy Nhon-Binh Dinh province Operating
Thao Nguyen Xanh
company Wood pellet
3,000
tones/month Nghi Loc-Nghe An province Looking for capital
Trasesco company Wood pellet 120,000
tones/year Vinh Cuu-Dong Nai province Looking for capital
Thanh Thanh Khang
company Wood pellet
5,000
tones/month Binh Duong province Operating
Seon Environment
Technology (Korea) &
DHT company
(Vietnam)
Wood pellet 2,000
tones/month Van Canh-Binh Dinh province Under construction
MEGA CAPITAL Wood pellet 1,000
tones/year
Thang Binh-Quang Nam
province Under construction
Hoa Thien Wood pellet
company
3,000
tones/month Thai Nguyen province Operating since 2011
Sources: (IEA BioEnergy , 2011), http://silopcorp.vn/, http://woodpellet.com.vn/, Can Tho stnews, Quang Nam Province,
Vinawoodpellets
There is also a domestic market under development, for example for the use of pellets in
gasification stoves like Minh Quang Group and their Bio-Cooker and GreenCom with their
Trexanh stove. Demands for this local use is still small though.

Woody Biomass for Energy Generation in Vietnam - Final Report
25
BOX 3: PELLET PRODUCTION AT HOA THIEN FACTORY IN THAI NGUYEN (HTTP://VINAWOODPELLET.WORDPRESS.COM/)
Hoa Thien is a pellet production company with installed capacity of 2,000 – 3,000 tones/month, using Chinese
Technology. The factory stated operating since 2011 with 10 pellet production lines. The investment cost
was around 2 million US$, party financed with commercial bank loans.
The sawdust is the main input material for pellet production that collected from sawmills and wood
manufactures around, the sawdust input with the moisture content of 40 – 50% buy at the price 15 - 60
US$/tone depend very much on the season. To ensure the sufficient input sawdust material for production,
Hoa Thien has sent the crushing machines to the local wood processing factories to crush the larger wood
material in to smaller powder to use for the wood pellet production. The moist sawdust need to be dried up
to 8 - 10% and then pelletized. The dryer system utilizes 100% the firewood as material that purchased locally
from processing factories or collecting from forest to produce steam for input material drying. .
Hoa Thien exports their pellet product mostly to Korea market at the FOB price of up to 125 $/ton. The
payback period is expected to be 3- 5 years.
4.3 Wood briquettes
Technology, suppliers and costs Wood briquettes are made from wood chips, shavings or dust and are pressed together under
high pressure (no binder necessary), this has multiple advantages as already mentioned in the
above chapter on pellets, this is especially related to the transportation of biomass (higher
density, higher caloric value, less moisture).
The wood briquetting machine making is even less developed than the pellet sector in
Vietnam. In of 2011, the Vietnam Energy of Institute (GiZ, 2011) has imported from Thailand
a fuel briquetter to try on the domestic feedstock of woody sawdust, rice husk, coffee shell
and bagasse. Based on the experiment results, IE has identified the need to improve this screw-
model briquetter and offered some improvements for this equipment. Research also went into
lengthen the longevity of the screw. The improved version was then substantiated at different
places nationwide for widespread promotion to people and training was provided to the
business and technicians.
The Institute of Energy has estimated productioncosts briquetting in Vietnam.
TABLE 21: PRODUCTION COST OF BIOMASS PELLET/BRIQUETTE (CUONG, 2012)
Type of applied technology Type of biomass Production cost
(VND/kg)
Briquetting
Rice husk 761
Coffee husk 797
Sawdust 820
Bagasse 1.093
Wood briquettes properties Wood Sawdust can be directly used for briquetting. Sawdust briquettes is produced with two
distinct types: briquette with holes through the centre, and solid briquettes. A solid briquette
is manufactured using a piston press and ones with a hole are produced using a screw press.It
is a very similar process to forming a wood pellet but on a larger scale. Under heating at high

Woody Biomass for Energy Generation in Vietnam - Final Report
26
temperature, the natural lignin in the wood binds the particles of wood together to form a
solid. Burning a wood briquette is far more efficient than burning firewood. Sawdust briquettes
is used as fuel for boiler, replacing for other type of fuel as coal.
TABLE 22: THE TECHNICAL SPECIFICATION OF A WOOD BRIQUETTE IN VIETNAM
Technical specification Wood briquette from sawdust*
Diameter 70 mm, 80mm, 90mm
Density 1.2 – 1.4 kg/dm3
Heat value 4,400 – 4,600 Kcal/kg
Moisture content 5.8%
Ash content 1.2%
According to testing results done by SGS Certification Company for the woody briquettes
produced Viet Phat Bio Corp key properties of woody briquettes are as flows
TABLE 23: KEY PROPERTIES OF WOODY BRIQUETTES (VIETBIOENERGY WEBSITE)
Key properties Unit Briquette size
(L* W * H = 150 * 60 *
92 mm)
Briquette size
(L* W * H = 185 * 75 * 115
mm)
Total moisture %, wet basic 7.5 7.57
Volatile mater %, dry basic 83.55 81.80
Ash content %, dry basic 0.83% 1.45
Fixed carbon %, dry basic 15.62 16.75
Gross calorific value Kcal/kg, dry basic 4,683 4,625
Sulfur %, dry basic 0.0176 0.0257
Bulk density Kg/m3 978.2 944.6
Wood briquettes production and use in Vietnam In Vietnam, woody briquettes are mainly produced by using sawdust, pine wood, rubber wood
and acacia or a mixture of these. It has a wide range of application and can be used for all kilns,
furnaces, stoves and especially in industrial boiler systems. Currently, there are many
companies producing woody briquettes such as Viet Phat Bio Cooperation, Gia Gia Nguyen
Ltd, Nhat Hanh Ltd, Cuu Long Company and Wood Pellets Vietnam. Most these companies
are based in the South of Vietnam. The producers of the wood briquette making machines are
the same as the companies that make the wood pellet machines (as it is very similar) – see also
Table 16.
FIGURE 10: A SAWDUST BRIQUETTE PRODUCING LINE IN VIET PHAT BIO CORP

Woody Biomass for Energy Generation in Vietnam - Final Report
27
As observed the briquette supply capacity of domestic companies can be up to 7,000
tons/month and the free-on-board (FOB) price being traded on the market is around 100-
140USD/ton.
4.4 Charcoal
Technology, suppliers and costs In Vietnam, charcoal is produced mainly from wood, coconutshells and bamboo residues.
Charcoal is produced through a carbonization process. Types of charcoal kilns used in Vietnam
are simple (inefficient) earth mound kilnsthat are polluting the environment due to heavy
smoke development. The conversion efficiency of this type of kiln is typically about 10-15%
(BTG, 2013). Recently, some domestic companies such as Biffa have adopted charcoal
production technology from Japan (similar to brick kiln, often with higher efficiencies up to
30%) to make charcoal production more clean, they are using branches and top of acacia, and
the production is aimed at export to Japan at 1-1.4 USD/kg (DoST Binh Dinh, 2013). It is
reported that there are about 100 of these new kilns built in Binh Dinh province to provide
about 300 tones charcoal per year.
Bamboo residues cause environmental problems due to dumping and due to unsustainable use
(SNV, 2012) this can be prevented by using this for charcoal making as well. This is getting
more attention by scientists in Vietnam recently. In Thanh Hoa province -where there are
about 49 bamboo processing workshops that annually generate about 76,000 tons of bamboo
wastes- a pilot project which utilises bamboo residues for charcoal making was implemented
and the results showed that 1kg bamboo residue can be converted into 76gram charcoal
(MONRE, 2008). Besides, charcoal sourced from coconut shell is popular in Southeast of
Vietnam. It is made by using closed brick kilns to carbonise coconut shell in anaerobic
condition. However, these kilns are not equipped with heat recovery system for utilization and
smoke is being emitted into the atmosphere which makes it environmentally polluting.
FIGURE 11: CHARCOAL MAKING KILN FROM COCONUT SHELL
The highest and most consistent carbonisation efficiencies can be achieved using (semi-)
industrial retorts not yet available in Vietnam, and also have a higher investment costs (BTG,
2013). Also to achieve higher conversion efficiencies and improved environmental

Woody Biomass for Energy Generation in Vietnam - Final Report
28
performance the implementation of chimneys and of tar and methane recovery facilities is
worth investigating.
The market price of charcoal is changing time to time and depending on the nature and quality
of charcoal and is normally ranged from 500-800 USD/tone. To evaporate one kilogram of
water takes about 2.5 MJ. In the case of charcoal, the calorific value is around 30 MJ/kg. In its
statistics, the FAO uses a conversion factor of 165 kg of produced charcoal from one cubic
meter of fuelwood (see more in 4.4.2).
Charcoal properties There are many type of charcoal that made from different input material. Charcoal could be
made from wood collected from forest such as the whole tree wood or branches. Charcoal
also can be made from peanut shell, coconut shell or rice husk/sawdust briquette. The current
status information of charcoal production in Vietnam is only limited available, however, it is
reported that charcoal is mainly produced at households scale. The specification of a charcoals
producer in Vietnam has been given in Table 24 and Table 25.
TABLE 24: AN EXAMPLE OF TECHNICAL SPECIFICATION OF CHARCOAL IN VIETNAM FROM ARTEX
THANGLONG JSC
Specification Wood charcoal Mangrove charcoal Coconut sheel
Moisture content 1.75% 2.39% 3.57%
Ash content 2.72% 2.04% 2.67%
Volatile matter content 28.17% 21.95% 15.02%
Fixed carbon content 69.11% 76.01% 82.31%
Calorific value 7216 Kcal/kg 7905 Kcal/kg 7930 Kcal/kg
TABLE 25: KEY PARAMETERS OF CHARCOALS
Parameter Coconut shell based charcoal
(http://www.vietcoconut.com.vn/) Acacia based
charcoal
Charcoal sourced from
bamboo(www.gret.vn.com)
Ash content 5-15% 3.5% < 6%
Volatile content 25% - -
Calorific value 5,000-7,000kcal/kg 7,000kcal/kg 7,500kcal/kg
Moisture content 5-7% 9% -
Charcoal production and use in Vietnam The charcoal production and utilization are concentrated in North-East-South zone, Mekong
River Delta and several provinces of South-Central Coast zone. However, charcoal making is
still executed in traditional ways with extreme low efficiencies, causing many environmental
and social impacts. The capacity of kilns is about 25-50 tones of charcoal with an average wood
conversion efficiency of 22-25% and fuel end use efficiency about 45-46%. In more efficient
systems this could be as high as 40% (BTG, 2013).The yields are dependent on many variables,
such as geographic location, moisture content of wood input; size of material and the
experience of the operators. The charcoal is mostly used for domestic cooking, food vending,
tea drying, or can be used for non-energy purposes such as water purification, for soil texture
improvement, and in chemical and steel industries.
Charcoal in Vietnam comes mainly especially from Mangrove wood. Wood material is
collected from forest with an optimal diameter of above 15cm and below 30cm, since this size
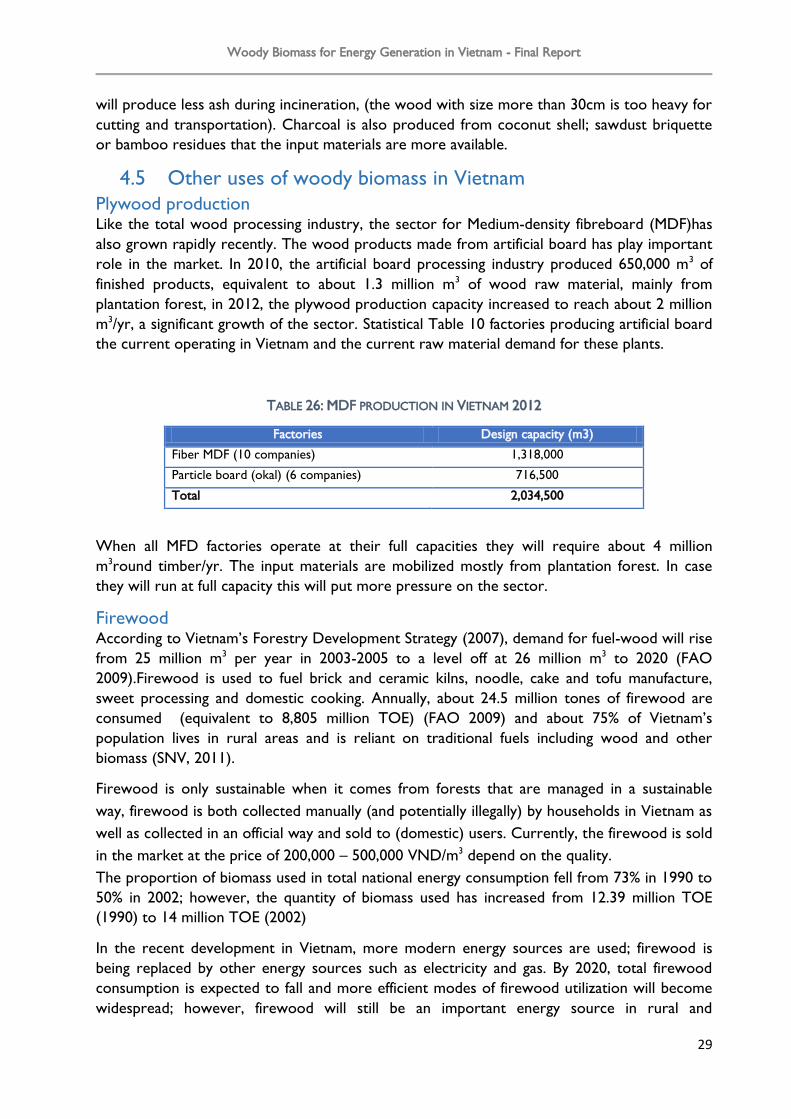
Woody Biomass for Energy Generation in Vietnam - Final Report
29
will produce less ash during incineration, (the wood with size more than 30cm is too heavy for
cutting and transportation). Charcoal is also produced from coconut shell; sawdust briquette
or bamboo residues that the input materials are more available.
4.5 Other uses of woody biomass in Vietnam
Plywood production Like the total wood processing industry, the sector for Medium-density fibreboard (MDF)has
also grown rapidly recently. The wood products made from artificial board has play important
role in the market. In 2010, the artificial board processing industry produced 650,000 m3 of
finished products, equivalent to about 1.3 million m3 of wood raw material, mainly from
plantation forest, in 2012, the plywood production capacity increased to reach about 2 million
m3/yr, a significant growth of the sector. Statistical Table 10 factories producing artificial board
the current operating in Vietnam and the current raw material demand for these plants.
TABLE 26: MDF PRODUCTION IN VIETNAM 2012
Factories Design capacity (m3)
Fiber MDF (10 companies) 1,318,000
Particle board (okal) (6 companies) 716,500
Total 2,034,500
When all MFD factories operate at their full capacities they will require about 4 million
m3round timber/yr. The input materials are mobilized mostly from plantation forest. In case
they will run at full capacity this will put more pressure on the sector.
Firewood According to Vietnam’s Forestry Development Strategy (2007), demand for fuel-wood will rise
from 25 million m3 per year in 2003-2005 to a level off at 26 million m3 to 2020 (FAO
2009).Firewood is used to fuel brick and ceramic kilns, noodle, cake and tofu manufacture,
sweet processing and domestic cooking. Annually, about 24.5 million tones of firewood are
consumed (equivalent to 8,805 million TOE) (FAO 2009) and about 75% of Vietnam’s
population lives in rural areas and is reliant on traditional fuels including wood and other
biomass (SNV, 2011).
Firewood is only sustainable when it comes from forests that are managed in a sustainable
way, firewood is both collected manually (and potentially illegally) by households in Vietnam as
well as collected in an official way and sold to (domestic) users. Currently, the firewood is sold
in the market at the price of 200,000 – 500,000 VND/m3 depend on the quality.
The proportion of biomass used in total national energy consumption fell from 73% in 1990 to
50% in 2002; however, the quantity of biomass used has increased from 12.39 million TOE
(1990) to 14 million TOE (2002)
In the recent development in Vietnam, more modern energy sources are used; firewood is
being replaced by other energy sources such as electricity and gas. By 2020, total firewood
consumption is expected to fall and more efficient modes of firewood utilization will become
widespread; however, firewood will still be an important energy source in rural and

Woody Biomass for Energy Generation in Vietnam - Final Report
30
mountainous areas (as indicated above) rural population will still rely on biomass for cooking
needs and as an important energy source for local industries.
The LEAP (Long-term Energy Alternative Planning) 2002 had developed a number of scenarios
based on economic development forecast and found that the timber consumption for
commercial energy demand will be decrease in the economic development. The timber
consumption as fuel-wood for different levels use of household, industries, agriculture and
service has been forecasted as table below.
TABLE 27: FUEL-WOOD DEMAND, UNDER DIFFERENT SCENARIOS (MILLION TONES) (FAO 2009)
Scenario 1995 2000 2010 2020
Baseline Scenario: Sectors using wood energy included in future
calculations are households, industry, agriculture and services.
23.77 24.50 25.28 23.93
Scenario 1: Baseline + replacing fuel-wood with other alternative
fuel at different levels of households, industry, agriculture and
services
23.77 22.87 19.19 12.83
Scenario 2: Scenario 1 + 5% of urban households, 15% of rural
households are using advanced kitchens for cooking, by 2020
23.77 22.79 18.10 10.76
Scenario 3: Scenario 2 + industrial tree planting and a scattered
tree planting program
23.77 22.79 17.82 10.24
Paper / Pulp production and needs In 2011, the pulp and paper industry in Vietnam has reached 353,500 tones of final product, this is
equivalent to 1.76 million m3 of input timber consuming. The actual demand for pulp and paper
products is greater than domestic production, therefore Vietnam imports about 30% of the total input
pulp material for the paper industry. The table below shows actual production and consumption of pulp
paper in Vietnam.
TABLE 28: PULP CONSUMPTION, PRODUCTION AND IMPORT OF VIETNAM DURING 2007-2011
Pulp paper 2007 2008 2009 2010 2011
Domestic
production 353.698 316.914 311.246 345.875 353.500
Import 131.590 134.454 99.800 106.477 132.000
Actual
consumption 485.288 451.368 411.046 452.352 485.500
The shortages caused by the explosive development of woodchip industry as described above.
The pulp sector cannot compete with woodchip industry on the input material which has led
to import pulp and paper material from abroad, causing high production cost. It is interesting
to observe that large amounts of woodchips are now exported, while input materials for the
pulp industry are imported. As local producers identified this, and would like to reduce the
production cost, the pulp and paper sector has requested the Government to introduce an
export tax for woodchip export (Forest trend 2013).To avoid exploiting young timber and
reserve wood material for domestic production, this request has been officially be hand in by
MOIT to the Ministry of Finance requesting a woodchip export tax of 5%. This tentative
scheme is now under negotiation process (Vietnam News. 2013).

Woody Biomass for Energy Generation in Vietnam - Final Report
31
5. UTILIZATION OF WOODY BIOMASS
Energy is one of the main applications of woody biomass and forest residues. While there are
figures on the domestic demand for fuel wood (as indicated above) the amount of fuel-wood
used for energy production has not been assessed by any study or research, when studying the
individual technologies and opportunities it can nevertheless be assumed that the usages for
energy purposes –besides domestic cooking- is limited. According to Cuong (2012), the
potential of wood energy is about 43million tones, mostly waste from the forest (53%). The
wood energy potential has been indicated as table below.
TABLE 29: THE WOOD ENERGY AND WOOD WASTE AVAILABLE IN VIETNAM (CUONG, 2012)
Woody biomass resource Amount for energy usage (million tones)
Natural forest 14.07
Plantation forest 9.07
Bare land 2.47
Industrial perennial 2.0
Fruit tree 0,41
Scattered tree 7,79
Woodchip 5.58
Sawdust and shaving 1,12
Reused from construction 0,8
Total 43.31
The Government has implemented programs to plant forest not only for industries and
environmental purposes but also to meet the huge demand for fuel-wood. Besides formal
programs, there are about 200 million scattered trees planted in the country each year. These
trees could provide about 5 million m3 of small wood and fuel-wood and 15 million m3 of
firewood for construction and energy needs in rural areas and reduce pressure on natural
forest (MARD, 2006). More on the use of woody biomass for energy purposes can be found in
the Chapters 4.4 to 4.6.
5.1 Heat generation through combustion Vietnam has a large scale demand of heat for drying purposes, this can be in the wood
processing industry but also in many other sectors like the agricultural sector, brick making,
cement industry, beer breweries, pottery etc. Traditionally often inefficient furnaces are being
used, resulting in steam and/or hot air used to dry the agricultural or other products such as
firewood fired furnaces or co-firing coal and firewood are used to provide the hot air for
drying green tea. In new installations constructed over the last 5 years, it is observed that the
popular boiler technology applied for steam generation using biomass wastes are Fluidized Bed
Combustion (FBC) and produced locally by Vietnamese mechanical companies.
Since 2009 an increasing number of Vietnamese industries are switching to renewable energy
for the generation of their process heat. Those companies have traditionally generated heat
using boilers fired with diesel, natural gas or fuel oil but now switch to biomass through energy
service providers. The energy service providers are specialized companies that finance, build,

Woody Biomass for Energy Generation in Vietnam - Final Report
32
own and operate the biomass boiler plant and sell the energy to the adjacent manufacturing
facilities. The energy is typically sold at a discount of 20% or more compared to energy
generated using fossil fuels. The biomass fuel is normally wood residues, such as sawdust,
wood shavings and other waste from wood processing enterprises.
In Vietnam there are about 5 enterprises that act as energy service providers. Tin Thanh
Industrial Steam and Electricity Company and Green Energy Joint Stock Company (both based
in Ho Chi Minh City) are market leaders in this field. Both companies have more than 20
biomass boilers operating. All projects involve biomass boilers (chain grate and circulating
fluidized bed) that generate steam. No electricity is (co)generated. Their projects are located
adjacent to food and beverage, rubber and paper mills. The investment cost is about 1.5
million USD per project, or 100,000 USD per MWth. Both companies develop between 5 and
10 new biomass boiler projects per year.
FIGURE 12: ILLUSTRATION OF A BIOMASS BASED STEAM GENERATION SYSTEM [TIN THANH, 2010]
Each biomass boiler project requires between 1,000 and 5,000 m2 of land. Therefore, most
biomass boiler projects supply energy to plants that are located in industrial zones. However,
Tin Thanh Industrial Steam and Electricity Company is now also piloting technologies that
require less space, including gasifies and boilers equipped with biomass burners.
It has recently signed a contract to supply steam to Southeast Asia Breweries in the center of
Hanoi. The contract involves the installation of a boiler with sawdust burner. The entire facility
occupies approximately 100 m2 and will be integrated into the existing brewery. The
investment cost of this plant is approximate 80,000 USD per MWth.

Woody Biomass for Energy Generation in Vietnam - Final Report
33
TABLE 30: SEVERAL EXAMPLES OF TYPICAL WOODY BIOMASS BASED HEAT GENERATION PROJECTS IN VIETNAM
Name of
project
Type of
biomass
Boiler
capacity
Applied boiler
technology Location Energy customer Developer
Masan Biomass
Boiler Project
Sawdust
wastes 20 TPH
Fluidized Bed
Combustor
(FBC)
Di An-Binh
Duong
province
Masan Industrial
Corp
Tin Thanh
Industrial Ltd
Tin Thanh
Biomass Boiler
Project No. 1
Sawdust
briquette 25TPH
Fluidized Bed
Combustor
(FBC)
Hue city Hue Brewery
Company Limited
Tin Thanh
Industrial Ltd
Tin Thanh
Biomass Boiler
Project No. 2
Wood
waste
residues
30TPH
Fluidized Bed
Combustor
(FBC)
Da Nang city
Da Nang Rubber
Joint Stock
Company
Tin Thanh
Industrial Ltd
Tin Thanh
Biomass Boiler
Project No. 3
Sawdust
wastes
10TPH
& 15
TPH
Fluidized Bed
Combustor
(FBC)
Binh Duong
province &
Binh Dinh
province
Sai Gon Mien Trung
Beer Joint Stock
Company&Sai Gon
Binh Tay Beer Joint
Stock Company
Tin Thanh
Industrial Ltd
Tin Thanh
Biomass Boiler
Project No. 4
Woody
biomass 30TPH
Fluidized Bed
Combustor
(FBC)
Dong Nai &
Ba Ria-Vung
Tau provinces
Vinacafe Bien Hoa
Joint Stock
Company
Tin Thanh
Industrial Ltd
Biomass based
steam supply
projects for
Vinamilk
Biomass - Adopted from
Japanese
technologies
Da Nang Vinamilk group Green Energy
JSC part of
SSG Group
TABLE 31: WOOD WASTE BASED BOILER SUPPLIERS IN VIETNAM
Name of manufacturer Type of boiler technology Type of fuels
Nhiet Nang Joint Stock Company Fluidized Bed Combustion (FBC) Biomass wastes
Vietnam Boiler JSC Dump-grate or fixed grate Bagasse
Truong Quang II Company Limited Fluidized Bed Combustion (FBC) Biomass wastes
Mien Trung Energy andBoiler Joint
StockCompany
Fluidized Bed Combustion (FBC) Biomass briquette
Hoa Phu Refrigeration Electrical
Engineering Joint Stock Company
Fluidized Bed Combustion (FBC) Biomass briquette
Dong Anh Boiler JSC Fluidized Bed Combustion (FBC) Biomass briquettes & rice
husk
Dai Phat Mechanical Engineering and
Energy Company Limited
Fluidized Bed Combustion (FBC) Biomass briquettes
Vietnam Institute of Agriculture
Engineering and Post-harvest Technology
(VIAEP)
Fluidized Bed Combustion (FBC) Biomass wastes (rice husk,
coffee husk, corncob,
cassava trash…)
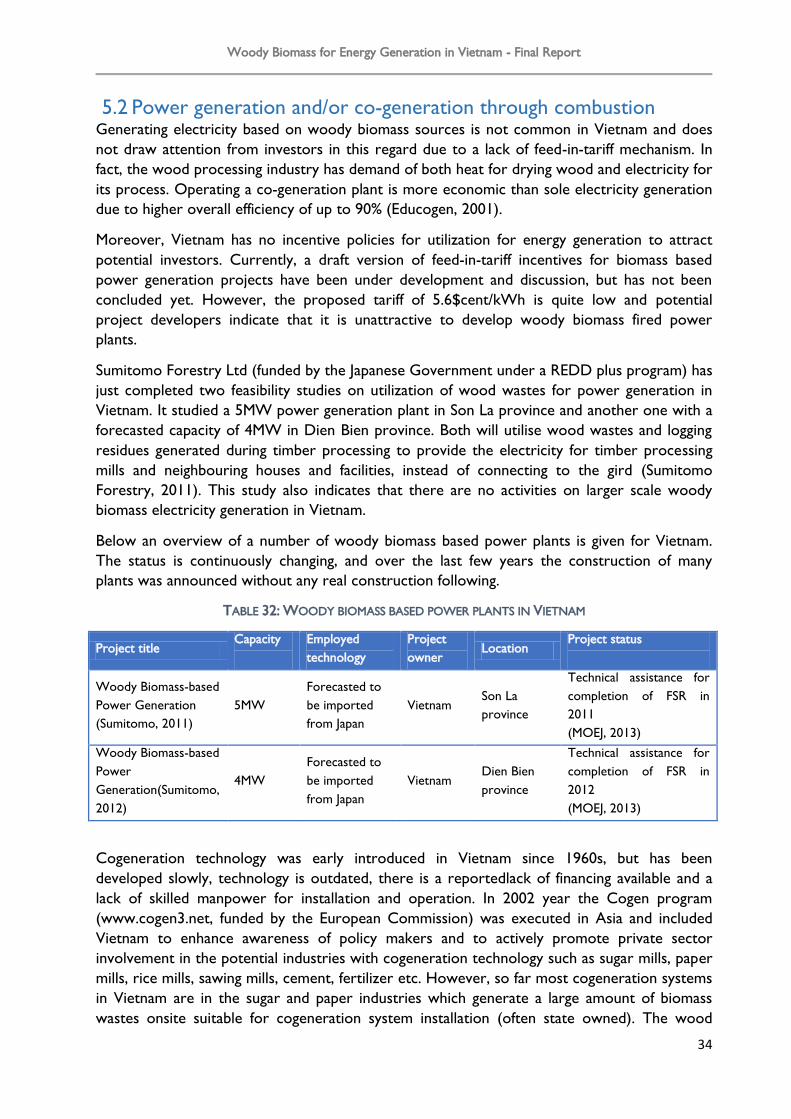
Woody Biomass for Energy Generation in Vietnam - Final Report
34
5.2 Power generation and/or co-generation through combustion Generating electricity based on woody biomass sources is not common in Vietnam and does
not draw attention from investors in this regard due to a lack of feed-in-tariff mechanism. In
fact, the wood processing industry has demand of both heat for drying wood and electricity for
its process. Operating a co-generation plant is more economic than sole electricity generation
due to higher overall efficiency of up to 90% (Educogen, 2001).
Moreover, Vietnam has no incentive policies for utilization for energy generation to attract
potential investors. Currently, a draft version of feed-in-tariff incentives for biomass based
power generation projects have been under development and discussion, but has not been
concluded yet. However, the proposed tariff of 5.6$cent/kWh is quite low and potential
project developers indicate that it is unattractive to develop woody biomass fired power
plants.
Sumitomo Forestry Ltd (funded by the Japanese Government under a REDD plus program) has
just completed two feasibility studies on utilization of wood wastes for power generation in
Vietnam. It studied a 5MW power generation plant in Son La province and another one with a
forecasted capacity of 4MW in Dien Bien province. Both will utilise wood wastes and logging
residues generated during timber processing to provide the electricity for timber processing
mills and neighbouring houses and facilities, instead of connecting to the gird (Sumitomo
Forestry, 2011). This study also indicates that there are no activities on larger scale woody
biomass electricity generation in Vietnam.
Below an overview of a number of woody biomass based power plants is given for Vietnam.
The status is continuously changing, and over the last few years the construction of many
plants was announced without any real construction following.
TABLE 32: WOODY BIOMASS BASED POWER PLANTS IN VIETNAM
Project title Capacity
Employed
technology
Project
owner Location
Project status
Woody Biomass-based
Power Generation
(Sumitomo, 2011)
5MW
Forecasted to
be imported
from Japan
Vietnam Son La
province
Technical assistance for
completion of FSR in
2011
(MOEJ, 2013)
Woody Biomass-based
Power
Generation(Sumitomo,
2012)
4MW
Forecasted to
be imported
from Japan
Vietnam Dien Bien
province
Technical assistance for
completion of FSR in
2012
(MOEJ, 2013)
Cogeneration technology was early introduced in Vietnam since 1960s, but has been
developed slowly, technology is outdated, there is a reportedlack of financing available and a
lack of skilled manpower for installation and operation. In 2002 year the Cogen program
(www.cogen3.net, funded by the European Commission) was executed in Asia and included
Vietnam to enhance awareness of policy makers and to actively promote private sector
involvement in the potential industries with cogeneration technology such as sugar mills, paper
mills, rice mills, sawing mills, cement, fertilizer etc. However, so far most cogeneration systems
in Vietnam are in the sugar and paper industries which generate a large amount of biomass
wastes onsite suitable for cogeneration system installation (often state owned). The wood
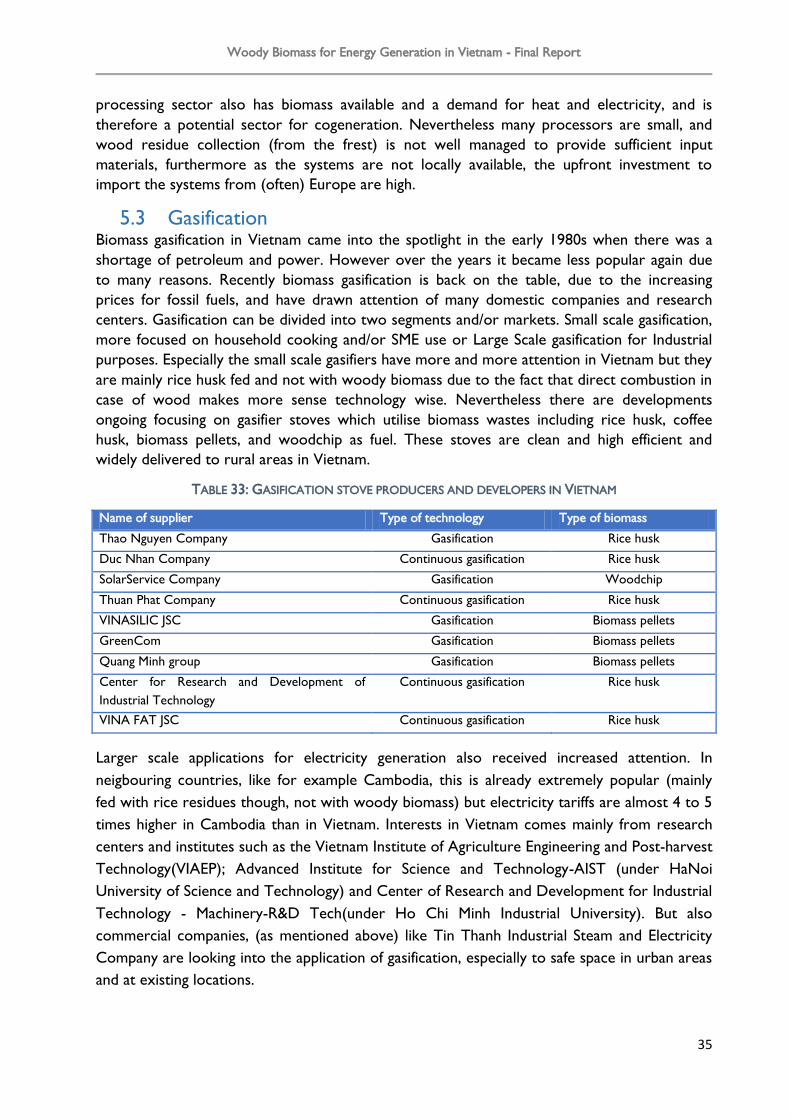
Woody Biomass for Energy Generation in Vietnam - Final Report
35
processing sector also has biomass available and a demand for heat and electricity, and is
therefore a potential sector for cogeneration. Nevertheless many processors are small, and
wood residue collection (from the frest) is not well managed to provide sufficient input
materials, furthermore as the systems are not locally available, the upfront investment to
import the systems from (often) Europe are high.
5.3 Gasification Biomass gasification in Vietnam came into the spotlight in the early 1980s when there was a
shortage of petroleum and power. However over the years it became less popular again due
to many reasons. Recently biomass gasification is back on the table, due to the increasing
prices for fossil fuels, and have drawn attention of many domestic companies and research
centers. Gasification can be divided into two segments and/or markets. Small scale gasification,
more focused on household cooking and/or SME use or Large Scale gasification for Industrial
purposes. Especially the small scale gasifiers have more and more attention in Vietnam but they
are mainly rice husk fed and not with woody biomass due to the fact that direct combustion in
case of wood makes more sense technology wise. Nevertheless there are developments
ongoing focusing on gasifier stoves which utilise biomass wastes including rice husk, coffee
husk, biomass pellets, and woodchip as fuel. These stoves are clean and high efficient and
widely delivered to rural areas in Vietnam.
TABLE 33: GASIFICATION STOVE PRODUCERS AND DEVELOPERS IN VIETNAM
Name of supplier Type of technology Type of biomass
Thao Nguyen Company Gasification Rice husk
Duc Nhan Company Continuous gasification Rice husk
SolarService Company Gasification Woodchip
Thuan Phat Company Continuous gasification Rice husk
VINASILIC JSC Gasification Biomass pellets
GreenCom Gasification Biomass pellets
Quang Minh group Gasification Biomass pellets
Center for Research and Development of
Industrial Technology
Continuous gasification Rice husk
VINA FAT JSC Continuous gasification Rice husk
Larger scale applications for electricity generation also received increased attention. In
neigbouring countries, like for example Cambodia, this is already extremely popular (mainly
fed with rice residues though, not with woody biomass) but electricity tariffs are almost 4 to 5
times higher in Cambodia than in Vietnam. Interests in Vietnam comes mainly from research
centers and institutes such as the Vietnam Institute of Agriculture Engineering and Post-harvest
Technology(VIAEP); Advanced Institute for Science and Technology-AIST (under HaNoi
University of Science and Technology) and Center of Research and Development for Industrial
Technology - Machinery-R&D Tech(under Ho Chi Minh Industrial University). But also
commercial companies, (as mentioned above) like Tin Thanh Industrial Steam and Electricity
Company are looking into the application of gasification, especially to safe space in urban areas
and at existing locations.

Woody Biomass for Energy Generation in Vietnam - Final Report
36
Also, the AIST showed its study results on Potential for biomass gasification based electricity
generation in Vietnam using Geospatial Software. The study was focused on agricultural
biomass such as rice crop, corn crop, peanut crop, and sugar cane crop and cassava crop
residues and applied with small scale syngas and diesel fuel dual engine for off-grid
communities. The outcomes showed that the levied cost for the electricity generation using
biomass is about 0.217$USD/kwh, while this using diesel is about 0.343$USD/kwh. If the
technology functions with a difficult feedstock like rice residues it will be no problem at all to
run on woody biomass, like woodchips. Nevertheless production costs will be much higher
due to the prices of the input materials (there is not sufficient information available to provide
an example calculation for the Vietnamese context).
Generally, biomass gasification remains new to Vietnam and Vietnam has little experience in
this respect. All biomass gasification based electricity generation projects are at lab or piloting
scale, there have been not any biomass gasification based electricity generation plants at
commercial scale appeared in Vietnam. One of the reasons for this, is that with the current
electricity prices and the lack of feed in tariffs or other incentives, there is no strong driving
factor to move into woody biomas gasification (vs direct combustion).
6. CONCLUSION AND RECOMMENDATION Vietnam has a large number of forest program’s all aiming for sustainable forest management,
and to reduce forest degradation and deforestation. Even though some successes have been
booked, there is still a lot of work to do to reach Vietnam’s goals as set out in their strategy
documents. With almost 14 million hectares of forest in Vietnam, both natural and plantation
forest, and at the same time a blooming wood processing sector as well as a big demand for
wood pellets and chips, it is a dynamic sector. Unfortunately woody biomass to electricity is
not one of the thriving sectors. The use of woody materials is mainly limited to the domestic
cooking sector and the use for small industries for heat – often produced inefficiently.
Woody biomass has been grouped in 3 groups, forest residues (often left in the forest, not
economically feasible often to collect, includes stumps, branches, leaves and bark), saw mill
residues and wood processing industry. In this report forest growing for energy use is not
taken into account. A focus is on the residues and / or the waste materials, also assuming that
when collecting from the forest this is done as part of a wider, sustainable forest management
plan to secure sufficient materials stay behind.
With a rapidly growing saw and wood processing sector, the amount of residues available is
also rapidly growing. This is either locally used for drying purposes, but this is also great input
materials for the production of wood pellets, wood chips and/or charcoal. There is already an
existing woodchip market in Vietnam, even though the local demand from the pulp and paper
sector for woodchips is large, and prices are higher, the majority of the chips is exported for
foreign markets for either energy use or for paper production. Woodchip production can be
on a small scale, with portable chippers or on a larger scale for more homogeneous and larger
amount of products. There are in Vietnam 120 woodchip plants with a total capacity of 8
million tones/yr, they produce and export annually 6.2 million tones woodchips. Currently a
new law for a tax on the export of woodchips is under negotiation to protect the local
market.

Woody Biomass for Energy Generation in Vietnam - Final Report
37
The production of wood pellets is also becoming more well-known in Vietnam, although the
amounts produced are still small. Pellets are mainly used for exports, with reported prices
between 91 and 125 USD per tone. There are several pellet machine suppliers in Vietnam.
Pellet’s don’t reach the European market due to the strict standards, most of the pellets are
exported to Korea and Japan. The wood briquette market is relatively small compared to chips
and pellets, while the charcoal making is also mainly for domestic and SME use.
Woody biomass use for power, heat or cogeneration on a large scale is very rare in Vietnam –
beyond the use as heat for small businesses through furnaces. There are no supporting policies
in Vietnam like Feed-In-Tariffs or other incentives, while upfront investments are high. Several
biomass projects are developed on paper but are waiting for such support mechanisms. There
is a large potential, but it is not utilized due to these policy reasons, lack of knowledge and
limited access to financing.
It is recommended to increase the (local) knowledge levels on biomass conversion
technologies. Creating more local awareness for potential smaller scale, more efficient
solutions for biomass conversion to energy. Many local processes, furnace application, charcoal
making are still using low efficient technologies. This would also involve improved (biomass to)
energy planning by the local government. Furthermore it is important that the initiative to
introduce financial incentives for Renewable Energy continue, and that the current FIT
proposal (5,6 cUSD/kWh) is reconsidered as it might not be able to cover the costs for
bioenergy production.

Woody Biomass for Energy Generation in Vietnam - Final Report
38
REFERENCES
ATIBT forum, 2012, How to reach green growth in the Vietnam timber sector? Heiko Wörner
Vietnamese - German Forestry Programme.
BTG, 2013, Charcoal production from alternative feedstocks.
CIFOR, 2012, Energy from biomass and biogas in
Vietnamhttp://www.cifor.org/publications/pdf_files/OccPapers/OP-75.pdf
Cuong, N.D, 2012, Development and demonstration of Multi-biomass fuel supply chain for power
plants and industrial boilers in Vietnam, 3rd EEP Mekong Regional Forum.
Cuong, N.D, 2013, the potential of Biogas and Biomass from Agriculture and Agro-industry for Power
and Heat generation in Vietnam, Presentation.
Dinh Hai, 2012, Nhà máy đồng phát nhiệt điện đót trấu - kinh nghiệm phát triển điện trấu ở đồng bằng
sông cửu long. Presentation at EnergyEXPO 2012.http://enerexpo.com.vn/images//7V-Truong-Dinh-Hai-
Dien-trau.pdf
DoST Binh Dinh, 2013, Sản xuất than hoạt tính từ cành, ngọn cây bạch đàn, keo lai, last visited on 28th
of January 2014
ECN, 2014, Phyllis2.
Educogen, 2001, A Guide to Cogeneration.
Energy basic, fact sheet 5.8. http://www.forestbioenergy.net/training-materials/fact-sheets/module-5-
fact-sheets/fact-sheet-5-8-energy-basics
ENERTEAM, 2012, EEP Mekong Project 2-R-074, Overview of solid biomasses volumes and availability
in Vietnam.
FAO, 2002, Vietnam Wood fuel and Energy Sectoral review
FAO, 2009, Vietnam Forestry Outlook Study
Forest Trends, 2013, Report on Vietnam woodchip industry
GIZ, 2011, Report on Identification of Biomass Market Opportunities in Vietnam
IEA Bioenergy, 2011, Global Wood Pellet Industry Market and Trade Study, Task 40- Sustainable
International Bioenergy Trade.
MARD, 2006, Forest Sector Support Partnership, Handbook of Forestry Sector, Chapter of Woody
processing industry in Vietnam.
MARD, 2011, Forest sector development report
MOEJ, 2013, Initiatives on Joint Crediting Mechanism for Mitigating Climate Change. Office of Market
Mechanisms Ministry of the Environment, Japan (MOEJ).
MONRE, 2008, Sản xuất than hoạt tính từ luồng phế thải, last visited on 28th of January 2014
Prime Minister, 2007, Vietnam’s Forestry Development Strategy period of 2006-2020
SNV, 2010, the REDD and Sustainable Development – Perspective from Viet Nam
SNV, 2011, Improved Cookstoves (ICS) Report

Woody Biomass for Energy Generation in Vietnam - Final Report
39
SNV, 2012, Biomass Business Opportunities Vietnam
Son Duong. (2013). http://sonduong.vn/tin-tuc/1918-tong-quan-nganh-cong-nghiep-dam-go-trong-quy-1-
2013.html Last visited on 25 January 2013
Sumitomo Forestry, 2011, New Mechanism Feasibility Study 2011 – Final Report. New Mechanism
Feasibility Study for REDD+ through Re-vegetation at Denuded Lands and Woody Biomass-based
Power Generation in Son La Province, Viet Nam.
Sumitomo Forestry, 2012, JCM/BOCM Feasibility Study 2012-Final report. REDD+ through Forest
Management Scheme, and Biomass-based Power Generation using Timber Industry Waste in Dien Bien
province, Vietnam.
Tran Thi Quynh, 2009, Agricultural residues potential assessment and utilization scenarios in Hai
Duong province.
UN-Economic Commission for Europe and FAO, Temperate and Boreal Forest Resources Assessment
(TBFRA 2000)
Vietnam Investment Review (VIR), 2014, Hau Giang plants seeds for rice-husk power plant. Vietnam
Investment Review. Last visited 21 January 2014.
Vietnam.vn, 2013, Authority of Foreign Information Service, http://en.vietnam.vn/Spotlightview/Wood-
Exports-To-Pick-Up.html
VietnamNews, 2013, Ministry of Finance may increase export tax on woodchips.
http://vietnamnews.vn/economy/240476/mof-may-increase-export-tax-on-woodchips.html last visited
25th of January 2014.
VNFOREST, 2011, Introduction of forests and forest sector of Viet Nam
Yoshida, T., Suzuki, H, 2010, Current Status of Woody Biomass Utilization in ASEAN Countries.
Related Documents