USAID BUDGET PROCESS USAID BUDGET PROCESS February 2002

USAID BUDGET PROCESS February 2002. Objective By the end of this presentation, you should explain the complexity of the USAID budget process, the directives.
Dec 14, 2015
Welcome message from author
This document is posted to help you gain knowledge. Please leave a comment to let me know what you think about it! Share it to your friends and learn new things together.
Transcript

USAID BUDGET PROCESSUSAID BUDGET PROCESS
February 2002
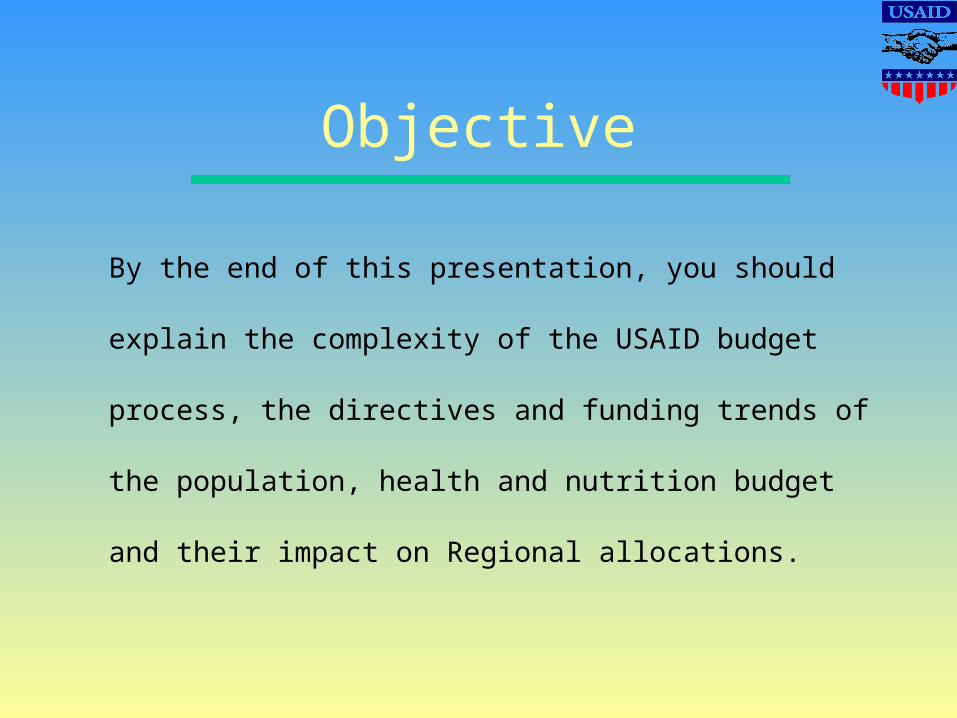
Objective
By the end of this presentation, you should explain the
complexity of the USAID budget process, the
directives and funding trends of the population, health
and nutrition budget and their impact on Regional
allocations.

Role of Congress
• Legislates annual appropriations
• Sets significant earmarks and directives
• May apply restrictions to funding
Congressional earmarks and directives may not
always correspond to White House priorities

Federal Budget Managed by OMB
• The federal budget consists of 18 functional funding “accounts”
• USAID programs are part of the “150” or “International Affairs” account
• Other 150 programs include State, Peace Corps, multilaterals, military assistance
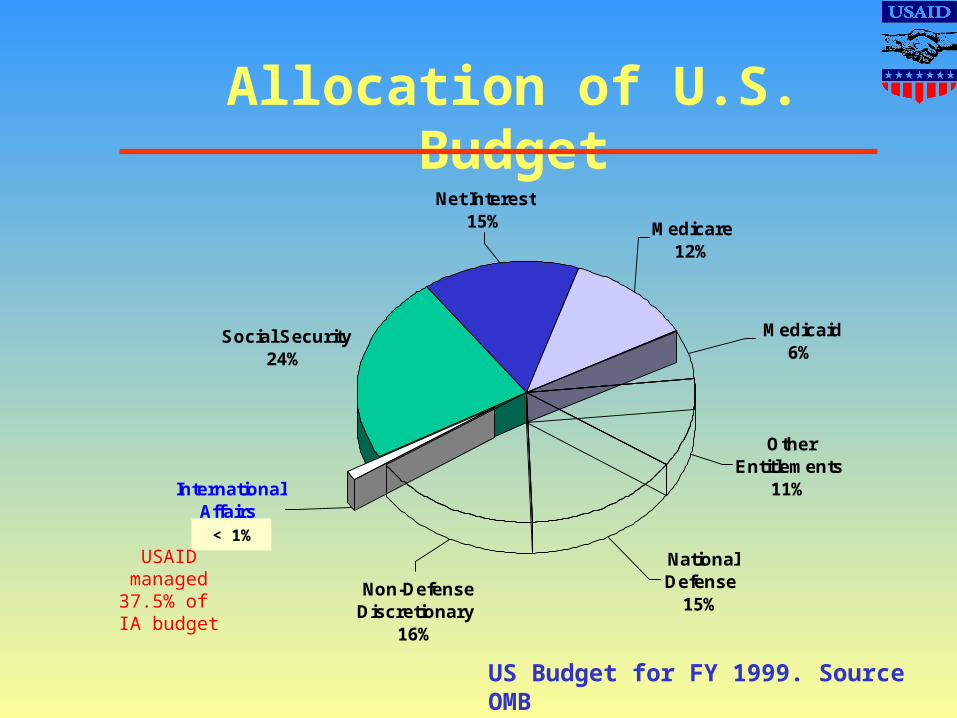
National Defense
15% Non-Defense Discretionary
16%
International Affairs
1%
Other Entitlements
11%
Medicaid6%
Medicare12%
Net Interest15%
Social Security24%
Allocation of U.S. Budget
USAIDmanaged37.5% of IA budget
US Budget for FY 1999. Source OMB
< 1%

Accounts Managed by USAID• Development Assistance (DA) (included family planning and reproductive
health through 2001)
• Child Survival and Diseases (CSD)• Child Survival Health (CSH) in 2002 (includes family planning and
reproductive health)
• Economic Support Funds (ESF)• Others, such as
– International Disaster Assistance
– P.L. 480 Title III sales proceeds
– FSA (Freedom Support Act, ex.-Soviet Union)
– AEEB (Support Eastern Europe Democracy)
– Operating Expenses
– Development Credit Authority

USAID Budget Process
Mission/BureauRequests
(within parameters)
Stat Annex/Notifications
Obligations
CongressionalAppropriation
Administration'sRequest
Hearing/
House/ SenateMark-up
OMB Submission
Operational Year Budget
Set
USAID Congress
July July
April April
Jan.Jan.
Sept. Sept.

• Below is a month-by-month breakout of the events in the program and budget cycles*. Events described cover three budget years and four budget stages: FY 2001 (October 2000 - September 2001) the current operating year (OYB), FY 2002 (October 2001 - September 2002) the proposed budget year and FY 2003 (October 2002 - September 2003) the request year. Thus, during 2001, Formulation involves the request year (FY 2003); Justification deals with the proposed year (FY 2002); and Implementation covers completion of the current operating year (FY 2001) and the beginning of the subsequent operating year (FY 2002).
• CY 2001 Formulation Justification Implementation• (FY 2003) (FY 2002) (FY 2001/FY 2002)
• January Strategic PlansFY 2002 Pres. Budget Implement FY 2001 OYB
• February Strategic PlansFY 2002 CBJ to Congress Implement FY 2001 OYB
• March Agency Guidance• on FY 2003• Results Review FY 2002 Hearings Implement FY 2001 and Resource• Request (R-4)• April Bureau FY 2003 FY 2002 Hearings Implement FY 2001 OYB• guidance (R4)
• May Operating Units Congressional Budget• Prepare FY 2003 R-4s Resolution FY 2002 Implement FY 2001 OYB•
• July FY 2003 BPBS Cong. Mark-up Implement FY 2001 OYB• Submitted floor action
• August FY 2003 Budget Congressional • Reviews Recess until Labor Day Implement FY 2001 OYB• September FY 2003 OMB Complete FY 2002 Wrap-up FY 2001 OYB• Submission appropriations
• October OMB ReviewsNew Appropriation Set FY 2002 OYB of 2003 request Bill on Continuing 653 (a) report• Resolution• November FY 2003 OMB Implement FY 2002 OYB• Passback
• December FY 2003 appeal and Implement FY 2002 OYB• President’s Mark.• Begin FY 2003 CBJ
• Mark. Begin FY 2003 CBJ
•
• * Note: These time frames reflect the ideal, but may be adjusted to reflect reality.
ILLUSTRATIVE PROGRAM BUDGET CYCLE 1

• June Operating Units Cong. Mark- up Implement FY 2001 OYB,
• Submit R4s to of FY 2002 Request Green Book
• Bureau
• July FY 2003 BPBS Cong. Mark-up Implement FY 2001 OYB
• Submitted floor action
• August FY 2003 Budget Congressional
• Reviews Recess until Labor Day Implement FY 2001 OYB
• September FY 2003 OMB Complete FY 2002 Wrap-up FY 2001 OYB
• Submission appropriations
• October OMB Reviews New Appropriation Set FY 2002 OYB of 2003 request Bill on Continuing 653 (a) report
• Resolution
• November FY 2003 OMB Implement FY 2002 OYB
• Passback
• December FY 2003 appeal and Implement FY 2002 OYB
• President’s Mark.
• Begin FY 2003 CBJ•
• * Note: These time frames reflect the ideal, but may be adjusted to reflect reality.
ILLUSTRATIVE PROGRAM BUDGET CYCLE 2

Funding Trends for PHN
0
100
200
300
400
500
600
700
95 96 97 98 99 00 01 02 03
Fiscal Year
$ M
illio
ns
Family Planning Reproductive Health Child Survival
HIV/AIDS Infectious Diseases
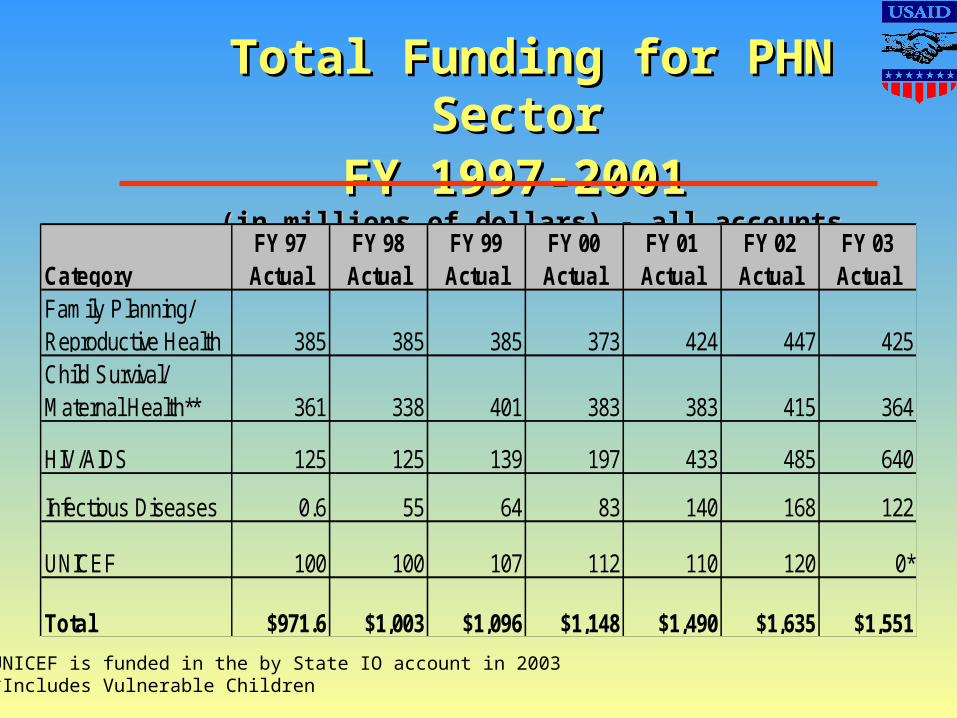
Total Funding for PHN Total Funding for PHN Sector Sector
FY 1997-2001FY 1997-2001 (in millions of dollars) - all accounts(in millions of dollars) - all accounts
CategoryFY 97 Actual
FY 98 Actual
FY 99 Actual
FY 00 Actual
FY 01 Actual
FY 02 Actual
FY 03 Actual
Family Planning/ Reproductive Health 385 385 385 373 424 447 425Child Survival/ Maternal Health** 361 338 401 383 383 415 364
HIV/AIDS 125 125 139 197 433 485 640
Infectious Diseases 0.6 55 64 83 140 168 122
UNICEF 100 100 107 112 110 120 0*
Total $971.6 $1,003 $1,096 $1,148 $1,490 $1,635 $1,551
*UNICEF is funded in the by State IO account in 2003**Includes Vulnerable Children

Total= 1.55 Billion
Population, Health and Nutrition FY 2003 - All
AccountsChild Survival/ Maternal Health
22%
Vulnerable Children
1%
HIV/AIDS42%
Other Infectious Diseases
8%
Family Planning/ Reproductive Health
27%

PHN & DA Funding Trends
0200400600800
1,0001,2001,4001,600
90 91 92 93 94 95 96 97 98 99 00 01 02 03
Fiscal Year
$ M
illio
ns
Health/ Nutrition Population Other Development Assistance

Setting Region andCountry Levels
• Mission requests, within parameters (based on history)
• Congress sets some country levels (impacts on other countries)
• State sets ESF, FSA, and AEEB country levels• Some broad strategic input (largely at the
regional level)• Country levels are not always driven by
strategic choices

FY 2001 PHN Funding by Region
Central Programs
29%
AFR (23 countries)
30%
ANE (16 countries)
24%
LAC (14 countries)
13%
E&E (14 countries)
6%
$351
$355
$282
$66
$154

Top 20 PHN Funded CountriesFY 2001
0
5
10
15
20
25
30
35
40
45
Country
Millio
ns

PHN Sector Budget Allocation FY 2001
Field Support/MAARDS $362million
Region Missions $593 million
Central Bureaus
$351 million

HIV/AIDS BudgetFY 2000
*Global managed includes central CA expenditures incurred via long-term technical assistance; sub-agreements; equipment, supplies, commodities, publications used in-country; training for host country participants; and total condom shipments for HIV/AIDS prevention. Field support provided by Missions to G/PHN is included under global managed..
**Some mission-managed HIV/AIDS activities may be directly financed by missions through grants and contracts with US-based cooperating agencies.
Total Budget: $126 million
Mission Managed**
43%
Global Managed*
57%
Other42%
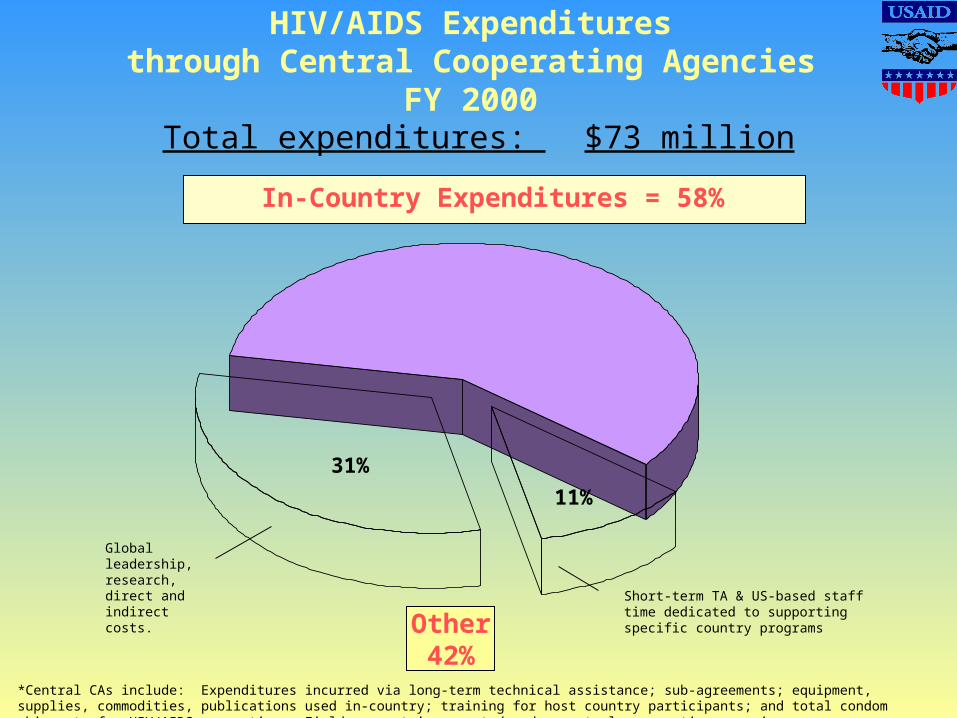
HIV/AIDS Expendituresthrough Central Cooperating Agencies
FY 2000
In-Country Expenditures = 58%
*Central CAs include: Expenditures incurred via long-term technical assistance; sub-agreements; equipment, supplies, commodities, publications used in-country; training for host country participants; and total condom shipments for HIV/AIDS prevention. Field support is reported under central cooperating agencies.
Short-term TA & US-based staff time dedicated to supporting specific country programs
Total expenditures: $73 million
Global leadership, research, direct and indirect costs.
11%
31%

LAC Countries CS-MH funding
0
1,000
2,000
3,000
4,000
5,000
6,000
7,000
8,000
El Salvador Peru LAC Regional Nicaragua Guatemala Bolivia Honduras DominicanRepublic
Jamaica

LAC countries HIV funding
0
500
1,000
1,500
2,000
2,500
3,000
3,500
4,000
4,500
5,000

LAC countries ID funding
0
500
1,000
1,500
2,000
2,500
3,000
3,500
4,000
4,500
Mexico LACRegional
Brazil Bolivia Peru DominicanRepublic
El Salvador Haiti Honduras Nicaragua

LAC Region CSD funding
0
2000
4000
6000
8000
10000
12000

LAC countries POP funding
0
2,000
4,000
6,000
8,000
10,000
12,000
14,000
16,000
Peru Bolivia Haiti Guatemala Honduras ElSalvador
Nicaragua DominicanRepublic
Paraguay Jamaica Ecuador LACRegional

LAC Region Total PHN funding per country
0
5000
10000
15000
20000
25000

LAC Region funding per program
15%
0%
12%
8%
36%
28%
1%
CS/MH
POLIO
HIV
ID
Total CSD
POP
DCOF/VUL
Related Documents