Alexei Krindatch, Research Coordinator ([email protected]) Assembly of Canonical Orthodox Bishops of North and Central America Usage of English Language, Ethnic Identity and Ethnic Culture in American Orthodox Christian Churches. Content: Introduction p.2 Usage of English Language in Church Services p.3 Strength of Ethnic Identity in US Orthodox Parishes p.6 Strength of Ethnic Culture in US Orthodox Parishes p.9 Impact of Ethno‐Linguistic Situation in the Parishes on Church Attendance p.13 “Geography” of Ethnic Culture in American Orthodox Parishes: State by State Differences p.17 Maps p.23 Map 1. State‐by‐State Average Percentage (%) of the English Language Used in the Orthodox Parishes as the Language of Liturgy p.23 Map 2. State‐by‐State Average Percentage (%) of the English Language Used in the Orthodox Parishes as the Language of Sermon p.24 Map 3. State‐by‐State Index of Strength of Ethnic Identity in Orthodox Parishes p.25 Map 4. State‐by‐State Index of Strength of Ethnic Culture in Orthodox Parishes p.26 Appendix p.27 Tab. A. Average Percentage of Usage of English in the Parishes of Various Orthodox Jurisdictions p.27 Tab. B. Strength of Ethnic Identity in the Parishes of Various Orthodox Jurisdictions p.28 Tab. C State‐by‐State Average Percentage (%) of Usage of English in Worship Services p.29 Tab. D State‐by‐State Index of Strength of Ethnic Identity in Orthodox Parishes p.30 Tab. E State‐by‐State Index of Strength of Ethnic Culture in Orthodox Parishes p.31 1

Usage of English Language, Ethnic Identity and Ethnic Culture in … · 2014-10-13 · Alexei Krindatch, Research Coordinator ([email protected]) Assembly of Canonical Orthodox Bishops
Jul 10, 2020
Welcome message from author
This document is posted to help you gain knowledge. Please leave a comment to let me know what you think about it! Share it to your friends and learn new things together.
Transcript

Alexei Krindatch, Research Coordinator ([email protected])
Assembly of Canonical Orthodox Bishops of North and Central America
Usage of English Language, Ethnic Identity and Ethnic Culture
in American Orthodox Christian Churches.
Content:
Introduction p.2
Usage of English Language in Church Services p.3
Strength of Ethnic Identity in US Orthodox Parishes p.6
Strength of Ethnic Culture in US Orthodox Parishes p.9
Impact of Ethno‐Linguistic Situation in the Parishes on Church Attendance p.13
“Geography” of Ethnic Culture in American Orthodox Parishes: State by State Differences p.17
Maps p.23
Map 1. State‐by‐State Average Percentage (%) of the English Language Used in the Orthodox
Parishes as the Language of Liturgy p.23
Map 2. State‐by‐State Average Percentage (%) of the English Language Used in the Orthodox
Parishes as the Language of Sermon p.24
Map 3. State‐by‐State Index of Strength of Ethnic Identity in Orthodox Parishes p.25
Map 4. State‐by‐State Index of Strength of Ethnic Culture in Orthodox Parishes p.26
Appendix p.27
Tab. A. Average Percentage of Usage of English in the Parishes of Various
Orthodox Jurisdictions p.27
Tab. B. Strength of Ethnic Identity in the Parishes of Various Orthodox Jurisdictions p.28
Tab. C State‐by‐State Average Percentage (%) of Usage of English in Worship Services p.29
Tab. D State‐by‐State Index of Strength of Ethnic Identity in Orthodox Parishes p.30
Tab. E State‐by‐State Index of Strength of Ethnic Culture in Orthodox Parishes p.31
1

Introduction
The question to what extent the various American Orthodox Churches can still be seen as “ethnically based”
religious communities remains open. Further, this subject continues to be hotly debated by Orthodox church
leadership and by the “rank and file” clergy and laity. That is for good reason. Indeed, the inquiry in this
question leads to many issues which have significant implications for church life such as the usage of English
versus “ethnic” languages in church, the presence and role of converts, the openness of Orthodox parishes to
the ethnically and culturally “others,” the preference of younger generation of faithful for either keeping their
ethnic heritage and identity or for “blending” with mainstream America – the list of these “big” questions is
endless.
The membership of the present‐day Orthodox Christian Churches in the United States consists of four very
distinct demographic groups:
US‐born descendants (second, third, fourth, fifth generations) of the original Greek, Slavic or Arab
immigrants;
Newly arrived immigrants who emigrated to United States from Eastern Europe or Middle East in
recent decades;
American converts to Orthodox Christianity – the former Protestants or Roman Catholics;
The children of American converts: the persons who were born and raised in the Orthodox Church, but
have no Orthodox “ethnic” heritage themselves.
The presence of these four groups varies significantly from jurisdiction to jurisdiction and – within each
jurisdiction ‐ from parish to parish. As a result, there exists great diversity among local Orthodox communities
in terms of how strong various ethnic elements in their religious and social lives are expressed.
This report provides several insights into the subject of strength of ethnic identity and ethnic culture in US
Orthodox Christian Churches at the beginning of the third millennium. Our goal was to examine this issue
both jurisdiction by jurisdiction (i.e. comparing various national Orthodox Church bodies) and state by state
(i.e. comparing various geographic areas on US territory).
Data presented on the following pages were obtained in the national survey conducted in 2011 under the
auspices of Assembly of Canonical Orthodox Bishops of North and Central America. In this survey, each
Orthodox parish which belongs to the Assembly of Canonical Orthodox Bishops was asked to respond four
questions:
2

Please, estimate the percentage of the English language used in your parish on a typical Sunday as
the language of the Divine Liturgy (from 0% ‐ “no English used” to 100% ‐ “exclusively English
used”);
Please, estimate the percentage of the English language used in your parish on a typical Sunday as
the language of sermon(s) (from 0% ‐ “no English used” to 100% ‐ “exclusively English used”);
Please, estimate the percentage of the English language used in your parish on a typical Sunday as
the language in which church choir or chanters sing (from 0% ‐ “no English used” to 100% ‐
“exclusively English used”);
Do you agree or disagree with the statement “Our parish has a strong ethnic culture and identity
that we are trying to preserve?” Please, select one answer: “Strongly agree,” “Rather agree,”
“Neutral / Unsure,” “Rather disagree,” “Strongly disagree.”
98.6 % of all US Orthodox parishes which are part of the Assembly of Canonical Orthodox Bishops responded
to the survey, thus, making survey results and findings sound and reliable.
Usage of English Language in Church Services
Fig. 1 on the next page and Table A (see Appendix, p.27) furnish information on the usage of the English
language in worship services in the parishes of the various Orthodox jurisdictions. One should keep in mind
that the data in Fig. 1 reflect US national “average” picture for each jurisdiction. Clearly, within each
jurisdiction, there are significant variations in the usage of various languages among individual parishes.
Nevertheless, several important observations can be made.
First, for the entire American Orthodox community ‐ for all parishes and for all Orthodox jurisdictions
combined ‐ English is much more widely used in the church than the other “ethnic” languages. US nationwide,
average proportion of English used as language of liturgy is 73%. In the case of language of sermon, the
national average of the usage of English is even higher: 81%.
3

Fig. 1 Average % of Usage of English Language in the Parishes of Various Orthodox Jurisdictions
45%
85%
25%
47%
52%
77%
63%
66%
68%
85%
49%
94%
96%
73%
57%
57%
23%
69%
87%
100%
85%
68%
97%
81%
58%
86%
0% 20% 40% 60% 80% 100%
All jurisdictions together
Carpatho‐Russian Diocese
Antiochian Archdiocese
Orthodox Church in America
Patriarchal Parishes of Rus. Orth. Church
Bulgarian Diocese
Greek Orthodox Archdiocese
Vicariate for Palestinian Orth. Christian Communities
Ukrainian Orthodox Church
Russian Orth. Ch. Outside of Russia
Serbian Orthodox Church
Albanian Diocese
Romanian Archdiocese
Average % of English used as language of liturgy
Average % of English used as language of sermon
Second, in terms of the usage of English versus non‐English languages, all Orthodox jurisdictions in America
can be divided in three categories. The first group includes three Churches which use almost exclusively
English as the language of liturgy and sermon. These churches are: Carpatho‐Russian Diocese, Antiochian
Archdiocese and Orthodox Church in America (OCA). With regard to the latter, if we exclude from the
analysis three “ethnic” OCA dioceses (Romanian Episcopate, Bulgarian Diocese and Albanian Archdiocese),
4

the rates of the usage of English in the territorial dioceses of OCA are actually higher than Fig.1 shows: 95% as
language of liturgy and 96% as language of sermon.
The second group includes jurisdictions where English dominates in worship services, but other languages
also have a significant presence. This is the case of the Patriarchal Parishes of the Russian Orthodox Church,
Bulgarian Diocese, Greek Orthodox Archdiocese and Vicariate for Palestinian Orthodox Communities.
Finally, the third group consists of four jurisdictions where various non‐English languages remain at least as
important as English or even dominate as languages of liturgy and sermon. These are Ukrainian Orthodox
Church, Russian Orthodox Church Outside of Russia, Serbian Orthodox Church, Albanian Diocese and
Romanian Archdiocese.
Third, Fig. 1 and Tab. A in Appendix indicate a fairly consistent pattern (Romanian Archdiocese being the only
exception): English is more widely used as the language of the sermon than as the language of liturgy. This
makes sense, because in the formal liturgy parish can still use a language which is not understood or spoken
by the some of church members, but delivering homilies on various subjects would make no sense without
clear communication between clergy and people present in the church.
Fourth, as noted, in almost all US Orthodox Churches, English is more frequently used as the language of
sermon than as the language of liturgy, but in two jurisdiction this gap is especially wide: in Greek Orthodox
Archdiocese (66% average usage of English in liturgy versus as much as 87% average usage of English in
sermon) and in Albanian Diocese (45% and 85%). What this wide gap suggests is that compared to the other
jurisdictions, the Albanian Diocese and Greek Orthodox Archdiocese are more attached to the idea of keeping
“traditional ethnic” languages in liturgy as long as possible even if actual language of communication with
church members ‐ i.e. the language of the sermon ‐ is English.
To conclude, survey data tell us that in terms of the languages used in worship services, the majority of
parishes and in most American Orthodox jurisdictions can be described today as predominantly “English
speaking.” The exception from this rule are five jurisdictions where various non‐English languages remain
either as important as English or even dominate in the local church life: Ukrainian Orthodox Church, Russian
Orthodox Church Outside of Russia, Serbian Orthodox Church, Albanian Diocese and Romanian Archdiocese.
5

Strength of Ethnic Identity in US Orthodox Parishes
The fact that English language dominates in American Orthodox church life ‐ both as the language of liturgy
and sermon – may prompt a premature conclusion that today solid majority of American Orthodox parishes
can be described as “all American” congregations. However, survey data show that this is not quite the case.
The last question in the 2011 US national Orthodox parish survey asked: “Do you agree or disagree with the
statement ‘Our parish has a strong ethnic heritage and identity that we are trying to preserve?’” In essence,
this question asked parishes about how they view themselves in terms of being or being not “ethnically based”
and about how important are their “ethnic roots” to them. The answers to this question were given on a five
point scale: “Strongly agree,” “Rather agree,” “Neutral / Unsure,” “Rather disagree,” “Strongly disagree.”
Fig. 3 on the next page and Table B (in Appendix, p.28) show that relative majority (45%) of all US Orthodox
parishes agreed with the statement “Our parish has strong ethnic heritage that we are trying to preserve.”
Only 39% of parishes rejected this statement and 16% responded “neutral or unsure.”
Further, in eight out of twelve jurisdictions, a strong absolute majority of parishes agreed with the statement
about “having strong ethnic heritage and identity.” These jurisdictions are: Albanian Diocese (100% agreement
with the statement), Romanian Archdiocese (87%), Serbian Orthodox Church (82%), Vicariate for Palestinian
Orthodox Communities (78%), Greek Orthodox Archdiocese (63%), Russian Orthodox Church Outside of
Russia (63%), Ukrainian Orthodox Church (61%) and Bulgarian Diocese (58%). By contrast, in only three
jurisdictions (Orthodox Church in America, Antiochian Archdiocese and Carpatho‐Russian Diocese), absolute
majority of parishes rejected statement about “having strong ethnic heritage and identity.” Finally, one
jurisdiction – Patriarchal Parishes of the Russian Orthodox Church – presents an interesting case, when
dominant majority of parishes responded that they are “neutral or unsure.”
6

Fig. 3 Strength of Ethnic Identity in the Parishes of Various Orthodox Jurisdictions:
Do you agree or disagree with the statement “Our parish has a strong ethnic culture and identity that
we are trying to preserve”
% of parishes responding:
45%
100%
87%
82%
78%
66%
63%
61%
58%
35%
35%
31%
17%
16%
3%
12%
18%
13%
16%
16%
55%
14%
16%
15%
39%
10%
6%
22%
16%
24%
23%
26%
10%
51%
53%
68%
0% 20% 40% 60% 80% 100%
All jurisdictions combined
Albanian Diocese
Romanian Archdiocese
Serbian Orthodox Church
Vicariate for Palestinian Orth. Communities
Greek Orthodox Archdiocese
Russian Orth. Church Outside of Russia
Ukrainian Orthodox Church
Bulgarian Diocese
Patriarchal Parishes of Rus. Orth. Church
Orthodox Church in America
Carpatho‐Russian Diocese
Antiochian Archdiocese
Agree (rather or strongly) Neutral / Unsure Disagree (rather or strongly)
To further examine the strength of ethnic identity in US Orthodox Churches we constructed the so‐called
“index of strength of ethnic identity.” To do so, we assigned numbers to each of five possible responses as
follows: “Strongly agree” – 5; “Rather agree” – 4; “Neutral, unsure” – 3; “Rather disagree” – 2; “Strongly
disagree” – 1. The average index of strength of ethnic identity for each jurisdiction was calculated by adding
up numbers reported by the parishes (i.e. 1, 2, 3, 4 or 5) and dividing the obtained sum by the number of
parishes in each jurisdiction.
7

In theory, for each jurisdiction, the index of strength of ethnic identity can vary anywhere between “1”
(assuming that all parishes in the jurisdiction “strongly disagreed” with the statement about having “strong
ethnic identity and heritage”) and “5” (assuming that all parishes in the jurisdiction “strongly agreed” with the
statement about having “strong ethnic identity and heritage”). The value of “3” should be used as a
benchmark to separate jurisdictions which are more likely to agree with the statement about having “strong
heritage and identity” from the jurisdictions which are more likely to reject this statement. Indeed, value “3”
means that parish or jurisdiction is “neutral or unsure” about “having strong ethnic identity and heritage.”
Tab. 1 shows four jurisdictions that clearly stand out in the strength of their ethnic identity (value of index is 4
or higher): Albanian Diocese, Romanian Archdiocese, Serbian Orthodox Church and Vicariate for Palestinian
Orthodox Christian Communities. In addition, the Romanian Episcopate within “Orthodox Church in
America” also has very high index: 4.2.
Tab. 1 Index of Strength of Ethnic Identity:
on the scale from 1 (no ethnic identity) to 5 (very strong ethnic identity)
Jurisdiction
US nationwide for all jurisdictions together 3.1
Albanian Diocese 4.5
Antiochian Archdiocese 2.1
Bulgarian Diocese 3.5
Carpatho‐Russian Diocese 2.8
Greek Orthodox Archdiocese 3.7
Patriarchal Parishes of the Russian Orthodox
Church 3.4
Orthodox Church in America,
including:
‐ Territorial dioceses
‐ Romanian Episcopate
‐ Bulgarian Diocese
‐ Albanian Archdiocese
2.5
2.1
4.2
3.4
3.9
Vicariate for Palestinian Orthodox Christian
Communities 4
Russian Orthodox Church Outside of Russia 3.7
Romanian Archdiocese 4.4
Serbian Orthodox Church 4.3
Ukrainian Orthodox Church 3.6
8

Five further jurisdictions have indexes which are not as high but still above benchmark value of 3: Greek
Orthodox Archdiocese, Russian Orthodox Church Outside of Russia, Ukrainian Orthodox Church, Bulgarian
Diocese and Patriarchal Parishes of the Russian Orthodox Church.
In only three jurisdictions, the indexes of the strength of ethnic identity are below median value of three (i.e.
their parishes are more likely to disagree with the statement about having strong ethnic identity and heritage):
Antiochian Archdiocese, Orthodox Church in America and Carpatho‐Russian Diocese.
In summary, the index of strength of ethnic identity shows that dominance of English language in most of US
Orthodox jurisdictions does not mean that local Orthodox parishes abandon their ethnic identity and
heritage. In fact, if anything, at the beginning of the third millennium, the American Orthodox Churches can
still be described rather as being “ethnically‐centered” than as being “All American” denominations.
Strength of Ethnic Culture in US Orthodox Parishes
The statistical analysis of survey data indicated a sound correlation between degree of usage of English in the
local parishes and their self‐definition as having or not having a “strong ethnic heritage and identity.”
Predictably, the parishes with higher percentage of English used in sermon and liturgy are more likely to deny
that they have “strong ethnic identity.” To the contrary, parishes with the wider usage of various non‐English
languages are more likely to agree with the statement about having “strong ethnic heritage and identity.
Fig. 4 on the next page graphically demonstrates that in jurisdictions with greater usage of various non‐English
languages as language of liturgy, more parishes agree that “Our parish has strong ethnic heritage and identity
that we are trying to preserve.” This relationship seems to be intuitive and even trivial. What is interesting,
however, is that in the case of three Orthodox jurisdictions the correlation between usage of English in worship
services and agreement with the statement about having strong ethnic heritage and identity is relatively weak.
These Orthodox jurisdictions are Carpatho‐Russian Diocese, Serbian Orthodox Church and Greek Orthodox
Archdiocese.
9

Fig. 4 Strength of Ethnic Identity and Usage of non-English Languages in the Parishes of Various
Orthodox Jurisdictions
17%
6%
31%
35%
66%
58%
61%
63%
78%
35%
82%
87%
100%
4%
15%
32%
37%
75%
34%
51%
53%
55%
23%
48%
0% 20% 40% 60% 80% 100%
Albanian Diocese
Romanian Archdiocese
Serbian Orthodox Church
Vicariate for Palestinian Orth. Communities
Greek Orthodox Archdiocese
Russian Orth. Church Outside of Russia
Ukrainian Orthodox Church
Bulgarian Diocese
Patriarchal Parishes of Rus. Orth. Church
Orthodox Church in America
Carpatho‐Russian Diocese
Antiochian Archdiocese
% of parishes agreeing with statement ʺOur parish has strong ethnic heritage that we are
trying to preserveʺAverage % of various non‐English languages used in liturgy
In simple terms, in these three jurisdictions, parishes regard themselves as having “strong ethnic heritage and
identity” to a much greater extent than their actual usage of English would statistically predict. What this
finding suggests is that these three jurisdictions are more strongly ‐ than the other jurisdictions ‐ attached to
the idea of keeping their ethnic culture “intact,” even if changing demography of membership “push” them
towards greater usage of English.
10

In previous section, we also observed that in the overall picture, the American Orthodox Churches maintain
their ethnic identity in a stronger manner than it may appear from the dominance of English in the local parish
life. Therefore, both the language of church services and parish’s ethnic identity are useful indicators to
describe degree of presence of ethnic elements in the local church life, but neither of these indicators is
sufficient on its own: both should be equally taken into account.
Tab. 2 contains data on what we called “Index of Strength of Ethnic Culture.” Statistically, it was constructed
out of two elements: 1. % of English used in each parish as language of liturgy, sermon and church choir; 2.
Parish’s degree of agreement or disagreement with the statement “Our parish has a strong ethnic culture and
identity that we are trying to preserve?” In essence, the index of strength of ethnic culture shows to what
extent various ethnic elements are present in the church life by looking both at “linguistic” component (i.e. %
of English used in the parishes) and “ethnic identity” component (i.e. parish’s agreement/disagreement with
the statement about having “ethnic heritage and identity”).
Tab. 2 Index of Strength of Ethnic Culture: from 0 (no ethnic culture) to 10 (very strong ethnic culture)
Jurisdiction
US nationwide: for parishes of all jurisdictions together 4.0
Albanian Diocese 6.6
Antiochian Archdiocese 1.6
Bulgarian Diocese 4.8
Carpatho‐Russian Diocese 2.4
Greek Orthodox Archdiocese 4.9
Patriarchal Parishes of the Russian Orthodox Church 4.0
Orthodox Church in America,
including:
‐ Territorial dioceses
‐ Romanian Episcopate
‐ Bulgarian Diocese
‐ Albanian Archdiocese
2.6
1.5
7.5
4.5
4.1
Vicariate for Palestinian Orthodox Christian Communities 5.5
Russian Orthodox Church Outside of Russia 5.8
Romanian Archdiocese 8.1
Serbian Orthodox Church 6.7
Ukrainian Orthodox Church 5.6
11

Tab. 2 shows that if we would judge both usage of English in church life and strength of ethnic identity in the
local parishes, three jurisdictions with the greatest presence of ethnic culture in their parishes are: Romanian
Archdiocese (8.1 index value), Albanian Archdiocese (6.6) and Serbian Orthodox Church (6.1). On the opposite
end are Antiochian Archdiocese (index value 1.6), Carpatho‐Russian Diocese (2.4) and Orthodox Church in
America (2.6) ‐ the jurisdictions where various “ethnic elements” in church life are relatively insignificant.
In the case of Orthodox Church in America, Tab. 2 also indicates great internal differences in presence of ethnic
elements in the church life between territorial dioceses of OCA (index as low as 1.5) and its “ethnic dioceses:”
Albanian (4.1), Bulgarian (4.5) and Romanian (7.5).
Is there any relationship between the size (membership) of US Orthodox parishes and the strength of their
ethnic culture? The answer to this question is “yes.” In summary, survey data tell us that Orthodox parishes
with stronger ethnic culture tend to be larger than the more “Americanized” churches. And this is true for
both usage of English in worship services and probability of agreement with the statement “Our parish has
strong ethnic heritage and identity that we are trying to preserve.” Fig. 5.1 indicates that the parishes which
use less English are more likely to be large parishes, while Fig. 5.2 on the next page shows that the parishes
which have higher index of ethnic identity (i.e. higher degree of agreement with the statement about “having
strong ethnic heritage and identity) are also more likely to be large parishes.
Fig. 5.1 Usage of English in Worship Services in the Parishes of Various Size Categories
Average % of English used in church services
80
90
English in Sermon
60
70
30
40
50
1 to 25
26 to 50
51 to 75
76 to
100
101 to 125
126 to 150
151 to
175
176 to
200
201 to 250
251 to 300
301 to
400
401 to 600
601 to 1000
1001 to
2000
2001+
Parish Size: Members
English in Church Choir
English in Liturgy
12

Fig. 5.2 Strength of Ethnic Identity in the Parishes of Various Size Categories
1
1.5
2
2.5
3
3.5
4
1 to 25
26 to 50
51 to 75
76 to 100
101 to 125
126 to 150
151 to 175
176 to200
201 to 250
251 to 300
301 to 400
401 to 600
601 to 1000
1001 to 2000
2001+
Parish Size Category: Members
Average Index of Ethnic Identity
Impact of Ethno‐Linguistic Situation in the Parishes on Church Attendance
We found a statistically sound and strong correlation between strength of ethnic identity of a parish (i.e.
parish’s agreement or disagreement with the statement about having “strong ethnic heritage and identity”)
and the rates of church attendance (i.e. percentage of parishioners who attend church services on a regular
weekly basis). In short, the rates of church attendance are much higher in the parishes which disagree with the
statement “Our parish has strong ethnic heritage that we are trying to preserve,” and they are significantly
lower in the “ethnically based” parishes which agree with this statement. Fig. 6.1 on the next page demonstrate
this finding.
Fig 6.1 shows: in almost half (49%) of the parishes that agree with the statement about having a strong ethnic
heritage, the rates of church attendance are below 30% (i.e. less than 30% of their members attend weekly). In
only one out of ten (11%) “ethnically‐based” parishes the rates of church attendance are 60% or higher. The
situation is very different in the churches which disagree with the statement “Our parish has strong ethnic
heritage and identity that we are trying to preserve.” In 35% of these parishes, more than 60% of parishioners
come to church every Sunday. And in only one out of ten (11%) “non‐ethnic” churches less than 30% of their
members attend on a regular weekly basis.
13

Fig. 6.1 Strength of Ethnic Identity and Church Attendance in US Orthodox Parishes
49%
40%
11%
28%
52%
20%
11%
54%
35%
0%
20%
40%
60%
80%
100%
Parishes which agree
with the statement
Parishes which are
ʺneutralʺ or ʺunsureʺ
Parishes which
disagree with the
statement
Statement: ʺOur parish has strong ethnic heritage and identity that we are trying
to preserveʺ
Church attendance
is 60% or higher
Church attendance
is 30‐59%
Church attendance
is less than 30%
Fig. 6.2 demonstrates that the rates of church attendance decline consistently from 55% on average in parishes
with index of strength of ethnic identity equal 1 (i.e. parishes which strongly disagree with the statement about
having “strong heritage and identity”) to 34% on average in parishes with index of strength of ethnic identity
equal 5 (i.e. parishes which strongly agree with the statement about having “strong heritage and identity”).
Fig. 6.2 Index of Strength of Ethnic Identity and Church Attendance in US Orthodox Parishes
20%
25%
30%
35%
40%
45%
50%
55%
1 2 3 4 5Index of Strength of Ethnic Heritage
Average % of church attendance
14

Fig. 6.2 also shows that the most dramatic drop occurs between values of 2 to 4 of the index of strength of
ethnic identity, while this decline is relatively steady between values 1 and 2 or between 4 and 5. In other
words, the real “dividing line” in terms of church attendance is between parishes which either agree
(“strongly” or “rather” doesn’t matter) or disagree (“strongly” or “rather” doesn’t matter) with the statement
“Our parish has strong heritage and identity that we are trying to preserve.” There is much less difference in
the rates of church attendance between churches which “strongly” and “rather” agree (value 4 or 5) or the
parishes which “strongly” and “rather” disagree with this statement (value 1 or 2).
Similarly to strength of ethnic identity, we also found strong relationship between the usage of the English
language in church services (% of English used by a parish as the language of liturgy) and proportion of
parishioners attending church services regularly. In summary, in the parishes that conduct worship services in
English (or almost exclusively in English), the rates of church attendance are much higher than in the parishes
with significant presence of various non‐English “ethnic” languages. See Fig. 7.1.
Fig. 7.1 Usage of English as the Language of Liturgy and Church Attendance in US Orthodox Parishes
48%
40%
12%
51%
42%
7%
15%
52%
33%
0%
20%
40%
60%
80%
100%
Parishes with less than
40% of English in liturgy
Parishes with 40‐89% of
English in liturgy
Parishes with 90% or more
English in liturgy
Church
attendance is
60% or higher
Church
attendance is
30‐59%
Church
attendance is
less than 30%
In one–third (33%) of the parishes with more than 90% of English used in liturgy, the rates of church
attendance are 60% or higher. In only 15% of these English‐speaking churches, the rates of church attendance
are below 30%. Quite differently, in half of the parishes with less than 90% of English used in liturgy, no more
than 30% of members attend services regularly.
15

Fig. 7.1 also reveals an interesting phenomenon: the relation between proportion of English used in worship
and rates of church attendance is not “linear.” One can see, there is little difference in rates of church
attendance between parishes with less than 40% of English in liturgy and parishes with 40‐89% of English in
liturgy. Rather, church attendance jumps sharply in the parishes where English is used exclusively or almost
exclusively as the language of liturgy (90% or more English in liturgy). In simple words, having somewhat less
or somewhat more of English in worship has little impact on church attendance. But having almost only
English as the language of liturgy correlates strongly with high rates of church attendance.
Fig. 7.2 confirms this observation. After several “ups” and “downs,” the black line (the % of English used in
liturgy) raises sharply, when level of usage of English reaches 90%. For the language of sermon (green line),
the same phenomena occurs at 80%: that is, church attendance jumps in the parishes with more than 80% of
English used as a language of sermon.
Fig. 7.2 Average % of Usage of English in Worship Services
And Rates of Church Attendance in US Orthodox Parishes
0%
10%
20%
30%
40%
50%
10% 20% 30% 40% 50% 60% 70% 80% 90% 100%Average % of English used in worship services
Average % of church attendance
English in liturgy
English in sermon
English in Church choir
16

One more important remark should be made. Clearly, the influence of the strength of ethnic identity on church
attendance (less “ethnic” parishes – better church attendance) and the impact of the English language used in
worship (better attendance in English speaking parishes) are two mutually related patterns. Indeed, as noted
previously, the parishes with higher percentage of English in worship are more likely disagree with the
statement about “having strong ethnic heritage and identity.”
What is interesting, however, is that when we looked only on the parishes which agree with the statement
“Our parishes has strong ethnic heritage and identity” the correlation between higher usage of English in
liturgy and higher rates of attendance continued to exist. That is, even in the case of “ethnically‐based”
parishes, a higher proportion of English used in worship is associated with better rates of church attendance.
This finding is actually relatively easy to explain. One can imagine a parish which – for whatever reason – is
deeply rooted in and maintains its Greek or Slavic or Arabic culture. Yet, even in such an imaginary parish
there can be certain categories of parishioners who do not speak anything but English: young people, spouses
who do not have ethnic ancestry, etc. Consequently, even in the “ethnically based” parishes, having more
English in church life is helpful to bringing these categories of parishioners to the church.
To conclude, the high rates of attendance in American Orthodox parishes are typically associated with high
usage of English in worship services and with churches which do not emphasize their ethnic identity and
heritage.
“Geography” of Ethnic Culture in American Orthodox Parishes: State by State Differences
The particular combination of various Orthodox parishes is unique for each state. In the earlier report on “Ten
Facts about Geographic Patterns of Orthodox Church Life in the United States,” we saw that US states differ
hugely from one another in number of Orthodox parishes and Orthodox church members, in prevalence of
parishes of certain jurisdictions, in geographic density of Orthodox parishes and in number of parishes per
capita of general population.
17

In the last section of this report, we will examine how different are various states in terms of the presence of
the parishes which use either more or less English in their services and which have either stronger or weaker
“ethnic identity.” Our ultimate goal is to identify two very different types of areas on US territory:
the states where various ethnic elements still have strong presence in local Orthodox church life;
the states where most of the Orthodox parishes can be described as “All‐American” churches with
very little (or none) ethnic identity and with exclusive (or almost exclusive) usage of English in
worship services.
Four maps accompanying this section will help to “visualize” main findings and conclusions.
We noted earlier that in the US nationwide and for all Orthodox jurisdictions combined, the average
proportion of usage of English language in Orthodox parishes as a language of liturgy is 73%. In the case of the
usage of English as a language of sermon this proportion is even higher ‐ 81%.
Tab. C in Appendix (p.29) demonstrates how different are these two figures (average proportion of English
used by the local parishes as language of liturgy and sermon) for each state.1 The states with the lowest usage
of English in the liturgy are New York and Nevada: in both states, the local parishes reported only 52% of the
English used in liturgy on average. On the opposite end are eight states where English is almost exclusively
used (more than 90% on average) by the parishes as the language of Divine Liturgy: Kentucky, Mississippi,
Oklahoma, New Mexico, Wyoming, Montana, South Dakota and Delaware.
Map. 1 on p.23 shows that there are two solid regions on US territory (the states colored in yellow and orange)
where the rates of the usage of English as the language of Liturgy are significantly lower than the national
average of 73%. One region consists of four Southwestern states: California, Nevada, Utah, Arizona. The
second region encompasses the Northeastern states of New York, New Jersey, Connecticut, Massachusetts,
New Hampshire, Maine and the national capital ‐ Washington DC. In addition to these macro‐regions, two
individual states – Florida and Illinois – form two “enclaves” on US territory with relatively little usage of
English and relatively strong presence of various non‐English languages in liturgy in the local parishes.
1 In 2011 National Orthodox Parish Survey, each Orthodox parish was asked: “Please estimate the percentage of the English
language used in your parish on a typical Sunday as the language of Divine Liturgy and as the language of sermon (from 0% -
“no English used” to 100% - “exclusively English used”). The average % of English in Liturgy and sermon for each state was
calculated by adding up the figures reported by the parishes and dividing the obtained sum by the number of parishes in each
state.
18

Map 2 on p.24 and Tab. D in Appendix (p.30) show the average percentage of the English used as the language
of sermon in the Orthodox parishes in each state. Essentially, Map 2 resembles Map 1 with only difference that
in many states the colors are “shifted” one level up reflecting typically greater usage of English by parishes as
a language of sermon than as a language of liturgy. Hence, the states that feature either a significantly lower or
a significantly higher presence of English in sermon (compared to the national average of 81%) are the same as
on the Map 1. Two states on the “lowest end” are New York (59% of English used on average by the local
parishes in sermon) and Nevada (54%). On the very “upper end” of usage of English are the states of
Kentucky, Mississippi, Oklahoma, New Mexico, Wyoming, Montana, South Dakota, Alabama and Vermont. In
these 9 states, all local parishes use 100% of English as a language of sermon.
In the section on “Strength of Ethnic Identity in US Orthodox Parishes,” we arrived to the conclusion that the
wide usage and even dominance of English language in most of US Orthodox Churches does not mean
necessarily that local Orthodox parishes abandon their ethnic identity and heritage. That is, many Orthodox
parishes with predominantly English language used in worship services continue to view themselves as
“ethnically based” and responded affirmatively to the statement “Our parish has strong ethnic heritage and
identity that we are trying to preserve.” To better measure the strength of the ethnic identity in US Orthodox
Churches we also constructed and discussed the “index of strength of ethnic identity.”
Tab. E in Appendix (p.31) shows state‐by‐state index of strength of ethnic identity2 in the local Orthodox
parishes while Map 3 on p.25 helps to visualize information provided in Tab. E. The areas colored in light and
dark blue colors are the states where index of strength of ethnic identity is equal or above national average. In
simple, these are the states where majority of Orthodox parishes agree with the statement “Our parish has
strong ethnic identity and heritage that we are trying to preserve.” Differently, the areas colored in light and
dark yellow colors are the states where index of strength of ethnic identity is well below national average:
these are the states where most Orthodox parishes reject statement about “having strong ethnic identity and
heritage.”
2 In 2011 National Orthodox Parish Survey, each Orthodox parish was asked: “Do you agree or disagree with the statement
“Our parish has a strong ethnic culture and identity that we are trying to preserve?” The answers were coded on a five point
scale: “1” - Strongly disagree; “2” – Rather disagree; “3” – Neutral / Unsure; “4” – Rather agree; “5” – Strongly agree.
The average index of ethnic identity for each state was calculated by adding up the coded responses from the parishes (i.e. 1, 2,
3, 4 or 5) and dividing the obtained sum by the number of parishes in each state.
19

Two important observations can be made from Map 3. First, the two regions with low level of usage of English
in worship identified on Map 1 (Southwestern and Northeastern “pockets”) also form the nucleuses of two
solid areas on US territory with high index of strength of ethnic identity in the local Orthodox parishes.
Second, compared to two relatively compact regions with the low usage of English in liturgy, the areas with
high index of strength of ethnic identity have significantly wider geographic expansion and encompass more
states. This pattern is consistent with our earlier conclusion that in overall picture American Orthodox parishes
maintain their ethnic identity in a stronger manner than it may appear from the dominance of English in the
local church life.
Put simply, there are more US states where parishes continue to view themselves as “having strong identity
and heritage” than the states where parishes continue to use widely various non‐English languages in their
worship services.
It was noted previously that both the language of church services and parish’s ethnic identity are useful
indicators to describe degree of presence of various ethnic elements in the local church life. Yet, neither of
these indicators is sufficient on its own: both should be equally taken into account. To do so, we constructed
the so‐called “Index of Strength of Ethnic Culture” – a statistical measure which looks both at “linguistic”
component (i.e. % of English used in the parishes) and “ethnic identity” component (i.e. parish’s agreement /
disagreement with the statement about having “ethnic heritage and identity”).
Tab. E in Appendix (p.31) contains state‐by‐state data on index of strength of ethnic culture while Map 4 on
p.26 pictures data presented in Tab. E. They will help us to summarize our earlier findings on state‐to‐state
differences in usage of English and strength of ethnic identity in the local Orthodox parishes.
Looking on Map 4, one can see three solid macro‐regions and two individual states colored in light and dark
blue colors which highlight the areas with the index of strength of the ethnic culture above US national
average:
Southwest: the states of California, Arizona, Nevada and Utah;
Northeast: the states of New York, New Jersey, Connecticut, Massachusetts, New Hampshire, Rod
Island, Maine along with the national capital – Washington DC;
Midwest: the states of Illinois, Wisconsin, and Michigan (with Indiana having lower scores of index
and somewhat breaking this area in two);
20

The states of Alaska and Florida.
In summary, these blue‐colored states are the areas where many Orthodox parishes continue to view
themselves as having “strong ethnic identity and heritage” and use relatively high proportion of various non‐
English languages in their worship services.3 On the opposite side of the spectrum, two large regions and two
single states are colored in light and dark yellow colors highlighting the areas with index of strength of ethnic
culture significantly below national average:
One region bisects US territory in the middle in the North‐South direction. This region includes the
states of Montana, North and South Dakota, Wyoming, Nebraska, Iowa, Kansas, Missouri,
Oklahoma, New Mexico and Texas;
Second region forms pocket in the Southeast of United States and includes the states of West
Virginia, Virginia, Kentucky, Tennessee, Alabama, Mississippi and South Carolina;
The states of Vermont and Hawaii.
In summary, these yellow‐colored states are the areas where most Orthodox parishes use high proportion of
English language in their worship services and reject the statement “Our parish has strong ethnic heritage and
identity that we are trying to preserve.”
We conclude this chapter with three important observations. First. There are three clearly‐identifiable regions
in the US, where “ethnic elements” (non‐English languages used in worship along with sense of the strong
ethnic identity) have relatively strong presence in the local Orthodox church life and where many parishes can
still be described as “ethnically‐based.” One is Southwestern “corner” consisting of California, Nevada,
Arizona and Utah. The second is Northeastern “corner” including states of New York, New Jersey,
Connecticut, Maine, Massachusetts, New Hampshire, Rode Island and Washington DC. The third Midwestern
area encompasses the states of Illinois, Wisconsin and Michigan (although in the two latter states the usage of
English is close to the national average). In addition to these sprawled multi‐state regions, the state of Florida
also stands out by low level of usage of English in worship services and strong sense of ethnic identity typical
for the local parishes.
3 It should be noted that both percentage of usage of English in worship services in the parishes and their responses to the statement about having strong identity and heritage have statistically equal impact on the aggregate index of strength of ethnic culture. Therefore there are several “blue colored” states where the usage of English in church life is close to the national average (or even slightly higher), but, at the same time, significant proportion of parishes “strongly agree” with the statement about having strong heritage and identity, thus, “pushing” the value of index of strength of ethnic culture above national average.
21

Second. The actual “geography” of the ethnic culture in US Orthodox parishes which was discussed in this
section debunks one of the commonly shared stereotypes – the notion that the Orthodox parishes in the West
tend to be more “Americanized,” while the churches in East tend to remain more ethnic. As we saw, the reality
is more complex. On the one hand, the Western part of United States has a huge enclave with strong ethnic
culture in the local parishes: the Southwestern “pocket” of California, Nevada, Arizona and Utah. On the other
hand, in the Eastern part of the country, the area with significant presence of the “ethnically‐based” parishes is
limited to the Northeast corner including New York, New Jersey, Connecticut, Maine, Massachusetts, New
Hampshire, Rode Island and Washington DC.
Third. Out of 50 US states, only 16 along with Washington DC have indexes of the strength of the ethnic
culture above the national average. Map 4 shows that geographically these 16 blue-colored states cover
relatively small portion of US territory. At the same time, 53% of all US Orthodox parishes are located in these
states and 66% (almost two thirds) of all Orthodox Church members live there. In other words, strong majority
of all US Orthodox Church members live in the areas where various ethnic elements still have significant
impact on the local church life.
22

DC
TX
CA
MT
AZ
ID
NV
CO
NM
OR
KS
UT
SD
IL
WY
NEIA
FL
MN
OK
ND
WI
MO
WA
GAAL
AR
PA
LA
MS
MI
NC
NY
IN
TN
KY
VA
OH
SC
ME
WV
VT
NJ
NH
CT
MD
MA
DE
RI
AK
HI
Average Percentage (%) of the English Language Used in the Orthodox Parishesas the Language of Liturgy*
SOURCE OF DATA: 2011 US National Orthodox Parish Survey
conducted by the Assembly of Canonical Orthodox Bishops
Average % of English Language
Used as a Language of Liturgy
Up to 60%
60.1% - 70%
70.1% - 80%
80.1% - 90%
More than 90%
Copyright by Alexei D. Krindatch
(only jurisdictions which are part of the Assembly of Canonical Orthodox Bishops)
Map 1
US nationwide and for all Orthodox Churches
combined the average % of usage of English
as language of liturgy is 73%.
*In 2011 National Orthodox Parish Survey, each Orthodox parish was asked:
Please, estimate the percentage of the English language used in your parish on a typical Sunday as the language of the Divine Liturgy: from 0% - "no English used" to 100% - "exclusively English used."
The average % of English in Liturgy for each state was calculated by adding up the figures reported by the parishesand dividing the obtained sum by the number of parishes in each state.
23

DC
TX
CA
MT
AZ
ID
NV
CO
NM
OR
KS
UT
SD
IL
WY
NEIA
FL
MN
OK
ND
WI
MO
WA
GAAL
AR
PA
LA
MS
MI
NC
NY
IN
TN
KY
VA
OH
SC
ME
WV
VT
NJ
NH
CT
MD
MA
DE
RI
AK
HI
Average Percentage (%) of the English Language Used in the Orthodox Parishesas the Language of Sermon*
SOURCE OF DATA: 2011 US National Orthodox Parish Survey
conducted by the Assembly of Canonical Orthodox Bishops
Average % of English Language
Used as a Language of Sermon
UP to 60%
60.2% - 70%
70.1% - 80%
80.1% - 90%
More than 90%
Copyright by Alexei D. Krindatch
(only jurisdictions which are part of the Assembly of Canonical Orthodox Bishops)
Map 2
US nationwide and for all Orthodox Churches
combined the average % of usage of English
as language of sermon is 81%.
*In 2011 National Orthodox Parish Survey, each Orthodox parish was asked:
Please, estimate the percentage of the English language used in your parish on a typical Sunday as the language of the Sermon: from 0% - "no English used" to 100% - "exclusively English used."
The average % of English in Sermon for each state was calculated by adding up the figures reported by the parishesand dividing the obtained sum by the number of parishes in each state.
24

DC
TX
CA
MT
AZ
ID
NV
CO
NM
OR
KS
UT
SD
IL
WY
NEIA
FL
MN
OK
ND
WI
MO
WA
GAAL
AR
PA
LA
MS
MI
NC
NY
IN
TN
KY
VA
OH
SC
ME
WV
VT
NJ
NH
CT
MD
MA
DE
RI
AK
HI
State-by-State Index of Strength of Ethnic Identity in Orthodox Parishes:*from 1 (no ethnic identity) to 5 (very strong ethnic identity)
SOURCE OF DATA: 2011 US National Orthodox Parish Survey
conducted by the Assembly of Canonical Orthodox Bishops
Index of Strength of Ethnic Identity
Up to 2.0
2.1 - 2.5
2.6 - 3.0
3.1 - 3.5
More than 3.5
Copyright by Alexei D. Krindatch
(only jurisdictions which are part of the Assembly of Canonical Orthodox Bishops)
Map 3
US nationwide and for all Orthodox parishes
combined the average index of strength of
ethnic identity is 3.1.
*In 2011 National Orthodox Parish Survey, each Orthodox parish was asked:
Do you agree or disagree with the statement "Our parishhas a strong ethnic culture and identity that we are tryingto preserve?"
The answers were coded on a five point scale:"1" - Strongly disagree; "2" - Rather disagree; "3" - Neutral/Unsure; "4" -Rather agree; "5" - Strongly agree.
The average index of ethnic identiry for each state was calculated by adding up the coded responses reported by the parishes (1, 2, 3, 4, or 5) and dividing the obtained sum by the number of parishes in each state.
25

DC
TX
CA
MT
AZ
ID
NV
CO
NM
OR
KS
UT
SD
IL
WY
NEIA
FL
MN
OK
ND
WI
MO
WA
GAAL
AR
PA
LA
MS
MI
NC
NY
IN
TN
KY
VA
OH
SC
ME
WV
VT
NJ
NH
CT
MD
MA
DE
RI
AK
HI
State-by-State Index of Strength of Ethnic Culture in Orthodox Parishes:*from 0 (no ethnic culture) to 10 (very strong ethnic culture)
SOURCE OF DATA: 2011 US National Orthodox Parish Survey
conducted by the Assembly of Canonical Orthodox Bishops
Index of Strength of Ethnic Culture
Up to 2.0
2.1 - 3.0
3.1 - 4.0
4.1 - 5.0
More than 5.0
Copyright by Alexei D. Krindatch
(only jurisdictions which are part of the Assembly of Canonical Orthodox Bishops)
Map 4
US nationwide and for all Orthodox parishes
combined the average index of strength of
ethnic culture is 4.0.
*The index of strength of ethnic culture was constructed out of two elements:
1. % of English used in each parish as language of liturgy, sermon, and church choir (three separate questions).
2. Parish's degree of agreement with the statement "Ourparish has a strong ethnic culture and identity that we are trying to preserve."
Statistically, both "linguistic" component and "ethnicidentity" component were equally taken into accountby constructing index of strength of ethnic culture.
26
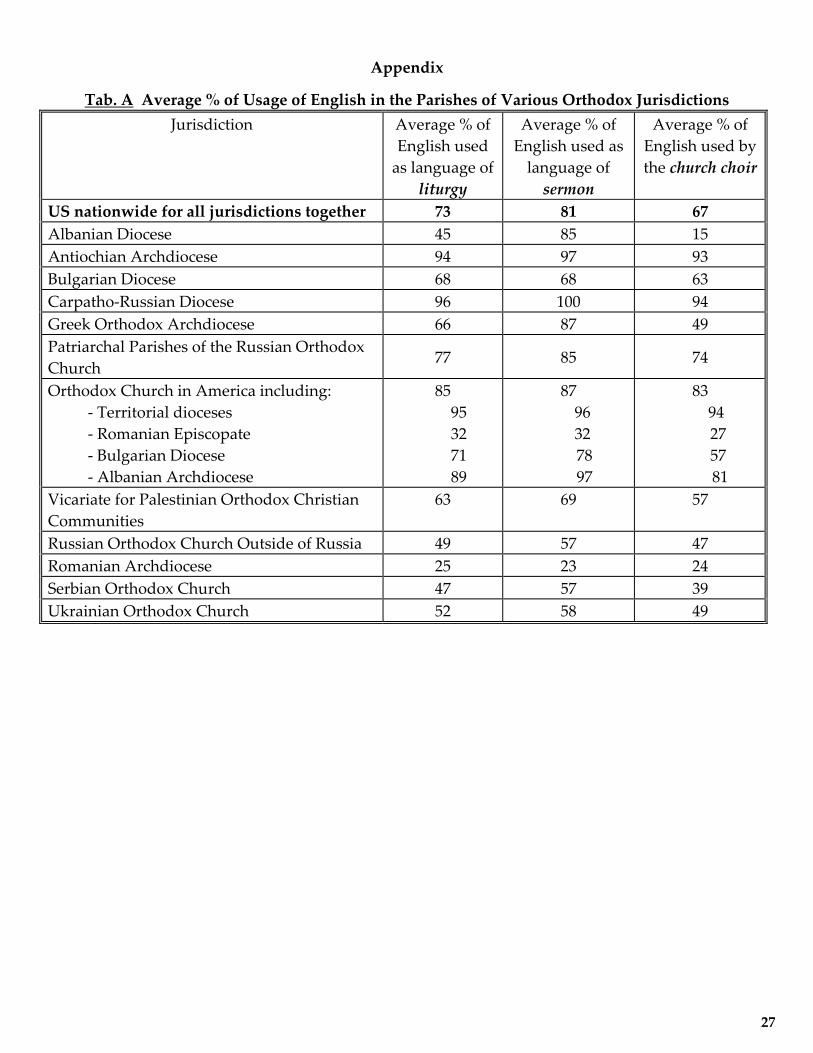
Appendix
Tab. A Average % of Usage of English in the Parishes of Various Orthodox Jurisdictions
Jurisdiction Average % of
English used
as language of
liturgy
Average % of
English used as
language of
sermon
Average % of
English used by
the church choir
US nationwide for all jurisdictions together 73 81 67
Albanian Diocese 45 85 15
Antiochian Archdiocese 94 97 93
Bulgarian Diocese 68 68 63
Carpatho‐Russian Diocese 96 100 94
Greek Orthodox Archdiocese 66 87 49
Patriarchal Parishes of the Russian Orthodox
Church 77 85 74
Orthodox Church in America including:
‐ Territorial dioceses
‐ Romanian Episcopate
‐ Bulgarian Diocese
‐ Albanian Archdiocese
85
95
32
71
89
87
96
32
78
97
83
94
27
57
81
Vicariate for Palestinian Orthodox Christian
Communities
63 69 57
Russian Orthodox Church Outside of Russia 49 57 47
Romanian Archdiocese 25 23 24
Serbian Orthodox Church 47 57 39
Ukrainian Orthodox Church 52 58 49
27

Tab. B Strength of Ethnic Identity in the Parishes of Various Orthodox Jurisdictions
(% of parishes in each category of answers)
Do you agree or disagree with the statement “Our
parish has a strong ethnic culture and identity
that we are trying to preserve” Jurisdiction
Strongly
agree
%
Rather
agree
%
Neutral,
Unsure
%
Rather
disagree
%
Strongly
disagree
%
US nationwide, for parishes of all
jurisdictions 24 21 16 19 20
Albanian Diocese 50 50 0 0 0
Antiochian Archdiocese 8 9 15 22 46
Bulgarian Diocese 47 11 16 0 26
Carpatho‐Russian Diocese 11 20 16 40 13
Greek Orthodox Archdiocese 27 40 17 12 4
Patriarchal Parishes of the Russian Orthodox
Church 16 19
55 7 3
Orthodox Church in America including:
‐ Territorial dioceses
‐ Romanian Episcopate
‐ Bulgarian Diocese
‐ Albanian Archdiocese
14
5
60
25
17
21
7
21
12
58
14
15
6
44
25
24
33
9
19
0
27
40
4
0
0
Vicariate for Palestinian Orthodox Christian
Communities 67 11 0 0 22
Russian Orthodox Church Outside of Russia 35 28 13 20 4
Romanian Archdiocese 64 23 3 10 0
Serbian Orthodox Church 57 25 12 3 3
Ukrainian Orthodox Church 40 21 16 8 15
28

Tab. C State‐by‐State Average Percentage (%) of Usage of English in Worship Services in
Orthodox Parishes (parishes of all Orthodox jurisdictions combined)
State
%
English
used in
Liturgy
%
English
used in
Sermon
% English
used by
Church
Choir
State
%
English
used in
Liturgy
%
English
used in
Sermon
% English
used by
Church
Choir
Alabama 90% 100% 75% Nebraska 89% 98% 82%
Alaska 86% 91% 81% Nevada 52% 54% 50%
Arkansas 75% 78% 73% New
Hampshire 67% 84% 51%
Arizona 68% 72% 64% New Jersey 64% 70% 54%
California 63% 73% 55% New Mexico 92% 100% 92%
Colorado 79% 84% 73% New York 52% 59% 43%
Connecticut 68% 80% 60% North
Carolina 70% 74% 63%
Delaware 95% 98% 95% North Dakota 81% 88% 74%
Florida 63% 73% 57% Ohio 74% 84% 66%
Georgia 75% 83% 66% Oklahoma 92% 100% 83%
Hawaii 76% 76% 76% Oregon 74% 79% 69%
Idaho 81% 81% 73% Pennsylvania 85% 93% 81%
Illinois 64% 71% 55% Rhode Island 77% 88% 55%
Indiana 82% 90% 74% South
Carolina 83% 99% 79%
Iowa 76% 91% 70% South Dakota 95% 100% 95%
Kansas 89% 95% 86% Tennessee 79% 82% 76%
Kentucky 97% 100% 87% Texas 84% 89% 80%
Louisiana 79% 88% 67% Utah 64% 77% 53%
Maine 61% 77% 46% Vermont 90% 100% 88%
Maryland 74% 86% 62% Virginia 83% 92% 75%
Massachusetts 66% 81% 56% Washington 81% 87% 77%
Michigan 71% 82% 66% West Virginia 87% 100% 72%
Minnesota 81% 85% 76% Wisconsin 74% 83% 67%
Mississippi 95% 100% 87% Wyoming 94% 100% 90%
Missouri 84% 97% 71% Wash., DC 65% 83% 53%
Montana 96% 100% 93% US
nationwide 73% 81% 66%
29

Tab. D State‐by‐State Index of Strength of Ethnic Identity (*) in Orthodox Parishes:
on the scale from 1 (no ethnic identity) to 5 (very strong ethnic identity)
(parishes of all Orthodox jurisdictions combined):
State Index of strength
of ethnic identity State
Index of strength
of ethnic identity
Alabama 2.5 Nebraska 2.6
Alaska 3.9 Nevada 3.8
Arkansas 2.7 New Hampshire 3.6
Arizona 3.1 New Jersey 3.4
California 3.3 New Mexico 2.3
Colorado 3.1 New York 3.8
Connecticut 3.4 North Carolina 3.0
Delaware 2.3 North Dakota 2.5
Florida 3.5 Ohio 3.3
Georgia 3.0 Oklahoma 2.7
Hawaii 2.4 Oregon 2.7
Idaho 2.6 Pennsylvania 3.0
Illinois 3.5 Rhode Island 4.5
Indiana 3.0 South Carolina 2.2
Iowa 2.5 South Dakota 2.5
Kansas 1.9 Tennessee 2.4
Kentucky 1.8 Texas 2.4
Louisiana 3.1 Utah 3.4
Maine 3.7 Vermont 2.3
Maryland 3.1 Virginia 2.6
Massachusetts 3.5 Washington 2.8
Michigan 3.3 West Virginia 2.7
Minnesota 2.8 Wisconsin 3.4
Mississippi 2.3 Wyoming 2.2
Missouri 2.9 Washington, DC 3.7
Montana 1.5 US nationwide 3.2
Note: (*) - “Index of Strength of Ethnic Identity” was calculated in following way. In 2011 National Survey of US Orthodox
parishes, each Orthodox parish was asked: “Do you agree or disagree with the statement “Our parish has a strong ethnic
culture and identity that we are trying to preserve?” The answers were provided on a five point scale: “Strongly disagree;”
“Rather disagree;” “Neutral / Unsure;” “Rather agree;” “Strongly agree.” Each of five possible responses was coded as
follows: “Strongly agree” – 5; “Rather agree” – 4; “Neutral, unsure” – 3; “Rather disagree” – 2; “Strongly disagree” – 1.
The average index of ethnic identity for each state was calculated by adding up coded responses from the parishes (i.e. 1, 2, 3,
4 or 5) and dividing the obtained sum by the number of parishes in each state.
30

Tab. E State‐by‐State Index of Strength of Ethnic Culture (*) in Orthodox Parishes:
on the scale from 0 (no ethnic culture) to 10 (very strong ethnic culture)
(parishes of all Orthodox jurisdictions combined):
State Index of strength
of ethnic culture State
Index of strength
of ethnic culture
Alabama 2.3 Nebraska 2.4
Alaska 4.3 Nevada 5.8
Arkansas 3.3 New Hampshire 4.7
Arizona 4.1 New Jersey 4.7
California 4.6 New Mexico 1.9
Colorado 3.7 New York 5.8
Connecticut 4.5 North Carolina 4
Delaware 1.9 North Dakota 2.8
Florida 4.8 Ohio 4
Georgia 3.7 Oklahoma 2.5
Hawaii 2.9 Oregon 3.4
Idaho 3.1 Pennsylvania 3.1
Illinois 4.8 Rhode Island 5.5
Indiana 3.4 South Carolina 2
Iowa 2.8 South Dakota 2
Kansas 1.6 Tennessee 2.7
Kentucky 1.2 Texas 2.6
Louisiana 3.6 Utah 4.8
Maine 5.2 Vermont 2
Maryland 3.8 Virginia 2.7
Massachusetts 4.7 Washington 3.1
Michigan 4.2 West Virginia 2.7
Minnesota 3.2 Wisconsin 4.1
Mississippi 1.9 Wyoming 1.8
Missouri 3 Washington, DC 4.8
Montana 0.7 US nationwide 4.0
Note: (*) - “Index of Strength of Ethnic Culture” was constructed out of two elements: 1. % of English used in each parish as
language of liturgy, sermon and church choir; 2. Parish’s degree of agreement or disagreement with the statement “Our parish
has a strong ethnic culture and identity that we are trying to preserve?” The average index of ethnic culture for each state was
calculated by adding up the indexes of individual parishes and dividing the obtained sum by the number of parishes in each
state.
In essence, the “index of strength of ethnic culture” shows to what extent various ethnic elements are present in the church
life by taking into account both “linguistic” component (i.e. % of English used in the parishes) and “ethnic identity”
component (i.e. parish’s agreement / disagreement with the statement about having “ethnic heritage and identity”).
31
Related Documents