ATL-SOFT-PROC-2018-003 14 July 2018 XXX-X-XXXX-XXXX-X/XX/$XX.00 ©20XX IEEE Usage of CAD Applications as an Open-Use Geometry Modeling Research Software in ATLAS Experiment Alexander SHARMAZANASHVILI Nuclear Engineering Center Georgian Technical University Tbilisi, Georgia [email protected] Davit SHEKILADZE Nuclear Engineering Center Georgian Technical University Tbilisi, Georgia [email protected] Archil SURMAVA Nuclear Engineering Center Georgian Technical University Tbilisi, Georgia [email protected] Shota KOBAKHIDZE Nuclear Engineering Center Georgian Technical University Tbilisi, Georgia [email protected] Abstract— Modern Particle Physics requires very complex experiments to perform the measurements. The detector components are based on state-of-the-art technologies and assembled in a unique and complex way. Data on the geometrical descriptions of detectors (GDD) are of high importance in the experiments. Various Software Applications (SA) in the different phases of the experiments use GDD as input data: in the engineering phase – Construction/Installation SA, in the physics analyses phase – Simulation/Reconstruction SA, and in Outreach – Augmented-reality/Education SA. Our case study of GDD development in the ATLAS experiment at LHC (Large Hadron Collider) at CERN shows the implementation of heterogeneous approach for GDD development. Currently, each SA uses a separate and unique GDD, and there is no inheritance between GDDs. As a result, several negative trends are observed: Huge resources in terms of highly qualified expertise are required, including long-term employed groups of experts GDDs are sometimes non-synchronized and may lack accuracy, which may cause problems for physics analyses. Differences between theoretical GDDs and actual geometry may cause discrepancies between data and simulations GDDs are hard to update These problems can be solved by the implementation of the Inherited Geometry Modelling (IGM) approach, which envisages the existence of a central GDD, so-called Reference Geometry (RG). Thus, instead of creating individual GDDs for a SA, they can be derived from the RG. That will solve the problem of synchronization and updates. In addition, the need of high-qualified expertise for specialized GDD development will be reduced. Computer Aided Design (CAD) geometry models are the most suitable way for the IGM approach and RG development. However, new requirements apply to CAD applications if they are to become an important platform in GDD development life cycle in particle physics experiments. Modern CAD applications have open-use architectures, which enables their customization through the third-party programming approach. Thus, custom applications can be developed and run inside CAD application using all the functionalities of the parent. This paper discusses the case of GDD development in the ATLAS experiment. The CATIA CAD application was customized and integrated into the GDD development loop for simulation and reconstruction tasks. Added functionalities allow considering CATIA as a hub for collecting all GDDs used by Simulation/Reconstruction SAs and export GDDs from the central description into local software applications. The paper describes details of the RG development concept and Simulation/Reconstruction loop based on CATIA. Keywords—CATIA, Geant, Geometry Descriptions I. INTRODUCTION Modern Particle Physics Experiments (PPE) have ambitious and challenging objectives in fundamental research, such as the study of the evolution of the universe and the Big Bang, the matter-antimatter asymmetry, or the discovery new physics. Many PPE are based on Accelerator Technology (AT), where an accelerator collides beams of highly energetic particles with other particles or materials to create new particles that are then detected to learn their characteristics. The center-of-mass energy of the collisions is a key parameter, as a higher energy allows to produce a wider range of new particles in the collision events to discover new features. The largest and most powerful accelerator machine of the world is the LHC (Large Hadron Collider) built at CERN (European Organization for Nuclear Research), Geneva, Switzerland [1]. The LHC accelerates protons in a 27 km circular ring currently up to 13 TeV (Tera Electronic Volt). Protons are colliding in 4 places along the 27 km ring where the detectors - ATLAS, CMS, ALICE and LHCb - are situated. Both the accelerator technology and the requirements of the PPE are unusual and unique and require innovative technical solutions. Both often do not have analogues in other branches and move beyond existing state-of-the-art technology developments. PPE projects thus are often the place of birth for new technologies and innovations.

Welcome message from author
This document is posted to help you gain knowledge. Please leave a comment to let me know what you think about it! Share it to your friends and learn new things together.
Transcript
ATL
-SO
FT-P
RO
C-2
018-
003
14Ju
ly20
18
XXX-X-XXXX-XXXX-X/XX/$XX.00 ©20XX IEEE
Usage of CAD Applications as an Open-Use
Geometry Modeling Research Software in ATLAS
Experiment
Alexander SHARMAZANASHVILI
Nuclear Engineering Center
Georgian Technical University
Tbilisi, Georgia
Davit SHEKILADZE
Nuclear Engineering Center
Georgian Technical University
Tbilisi, Georgia
Archil SURMAVA
Nuclear Engineering Center
Georgian Technical University
Tbilisi, Georgia
Shota KOBAKHIDZE
Nuclear Engineering Center
Georgian Technical University
Tbilisi, Georgia
Abstract— Modern Particle Physics requires very complex
experiments to perform the measurements. The detector
components are based on state-of-the-art technologies and
assembled in a unique and complex way. Data on the
geometrical descriptions of detectors (GDD) are of high
importance in the experiments. Various Software Applications
(SA) in the different phases of the experiments use GDD as input
data: in the engineering phase – Construction/Installation SA,
in the physics analyses phase – Simulation/Reconstruction SA,
and in Outreach – Augmented-reality/Education SA.
Our case study of GDD development in the ATLAS
experiment at LHC (Large Hadron Collider) at CERN shows
the implementation of heterogeneous approach for GDD
development. Currently, each SA uses a separate and unique
GDD, and there is no inheritance between GDDs. As a result,
several negative trends are observed:
Huge resources in terms of highly qualified expertise are
required, including long-term employed groups of experts
GDDs are sometimes non-synchronized and may lack
accuracy, which may cause problems for physics analyses.
Differences between theoretical GDDs and actual geometry
may cause discrepancies between data and simulations
GDDs are hard to update
These problems can be solved by the implementation of the
Inherited Geometry Modelling (IGM) approach, which
envisages the existence of a central GDD, so-called Reference
Geometry (RG). Thus, instead of creating individual GDDs for
a SA, they can be derived from the RG. That will solve the
problem of synchronization and updates. In addition, the need
of high-qualified expertise for specialized GDD development
will be reduced.
Computer Aided Design (CAD) geometry models are the
most suitable way for the IGM approach and RG development.
However, new requirements apply to CAD applications if they
are to become an important platform in GDD development life
cycle in particle physics experiments. Modern CAD applications
have open-use architectures, which enables their customization
through the third-party programming approach. Thus, custom
applications can be developed and run inside CAD application
using all the functionalities of the parent.
This paper discusses the case of GDD development in the
ATLAS experiment. The CATIA CAD application was
customized and integrated into the GDD development loop for
simulation and reconstruction tasks. Added functionalities
allow considering CATIA as a hub for collecting all GDDs used
by Simulation/Reconstruction SAs and export GDDs from the
central description into local software applications. The paper
describes details of the RG development concept and
Simulation/Reconstruction loop based on CATIA.
Keywords—CATIA, Geant, Geometry Descriptions
I. INTRODUCTION
Modern Particle Physics Experiments (PPE) have ambitious and challenging objectives in fundamental research, such as the study of the evolution of the universe and the Big Bang, the matter-antimatter asymmetry, or the discovery new physics. Many PPE are based on Accelerator Technology (AT), where an accelerator collides beams of highly energetic particles with other particles or materials to create new particles that are then detected to learn their characteristics. The center-of-mass energy of the collisions is a key parameter, as a higher energy allows to produce a wider range of new particles in the collision events to discover new features.
The largest and most powerful accelerator machine of the world is the LHC (Large Hadron Collider) built at CERN (European Organization for Nuclear Research), Geneva, Switzerland [1]. The LHC accelerates protons in a 27 km circular ring currently up to 13 TeV (Tera Electronic Volt). Protons are colliding in 4 places along the 27 km ring where the detectors - ATLAS, CMS, ALICE and LHCb - are situated.
Both the accelerator technology and the requirements of the PPE are unusual and unique and require innovative technical solutions. Both often do not have analogues in other branches and move beyond existing state-of-the-art technology developments. PPE projects thus are often the place of birth for new technologies and innovations.
The development of Geometry Descriptions of Detector (GDD) [2] are important for several reasons. GDDs have major influence on various phases of PPE, like conceptual design and construction of facilities, manufacturing, installation, maintenance, physics analyses, outreach & education. This paper describes concept of GDD development and maintenance based on the Inheritance Geometry Modelling (IGM) approach.
II. HETEROGENEOUS GEOMETRY MODELLING (HGM)
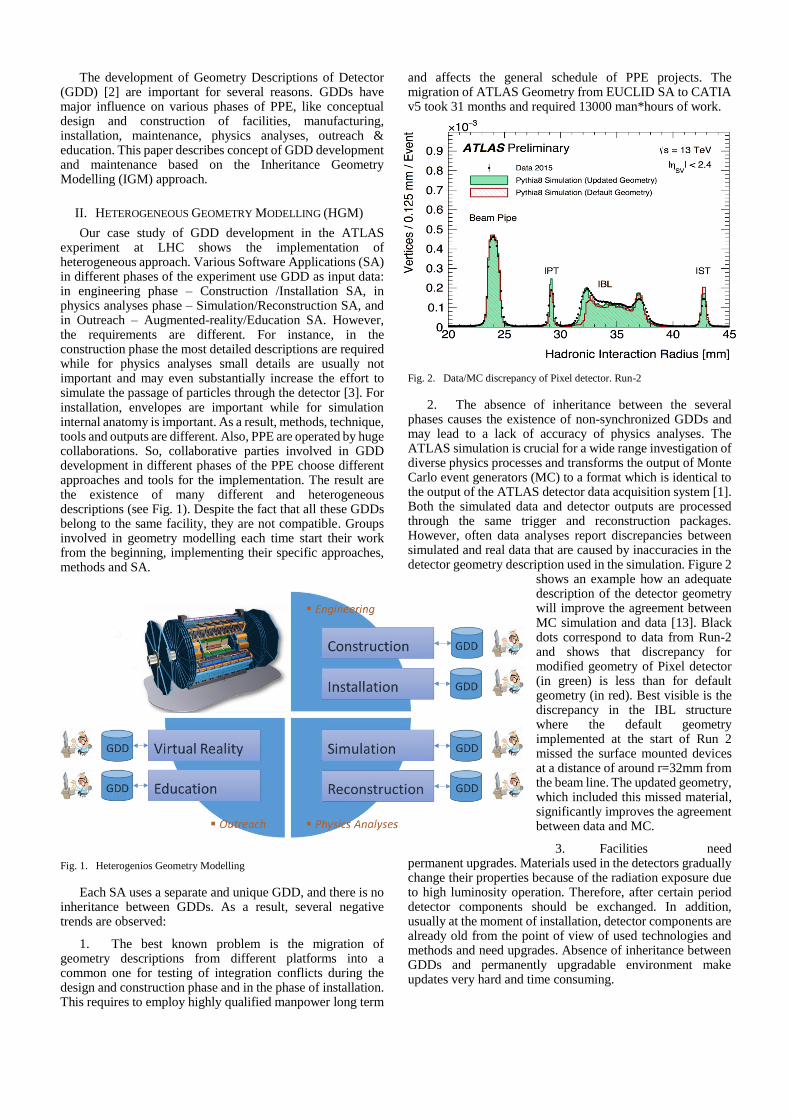
Our case study of GDD development in the ATLAS experiment at LHC shows the implementation of heterogeneous approach. Various Software Applications (SA) in different phases of the experiment use GDD as input data: in engineering phase – Construction /Installation SA, in physics analyses phase – Simulation/Reconstruction SA, and in Outreach – Augmented-reality/Education SA. However, the requirements are different. For instance, in the construction phase the most detailed descriptions are required while for physics analyses small details are usually not important and may even substantially increase the effort to simulate the passage of particles through the detector [3]. For installation, envelopes are important while for simulation internal anatomy is important. As a result, methods, technique, tools and outputs are different. Also, PPE are operated by huge collaborations. So, collaborative parties involved in GDD development in different phases of the PPE choose different approaches and tools for the implementation. The result are the existence of many different and heterogeneous descriptions (see Fig. 1). Despite the fact that all these GDDs belong to the same facility, they are not compatible. Groups involved in geometry modelling each time start their work from the beginning, implementing their specific approaches, methods and SA.
Fig. 1. Heterogenios Geometry Modelling
Each SA uses a separate and unique GDD, and there is no inheritance between GDDs. As a result, several negative trends are observed:
1. The best known problem is the migration of geometry descriptions from different platforms into a common one for testing of integration conflicts during the design and construction phase and in the phase of installation. This requires to employ highly qualified manpower long term
and affects the general schedule of PPE projects. The migration of ATLAS Geometry from EUCLID SA to CATIA v5 took 31 months and required 13000 man*hours of work.
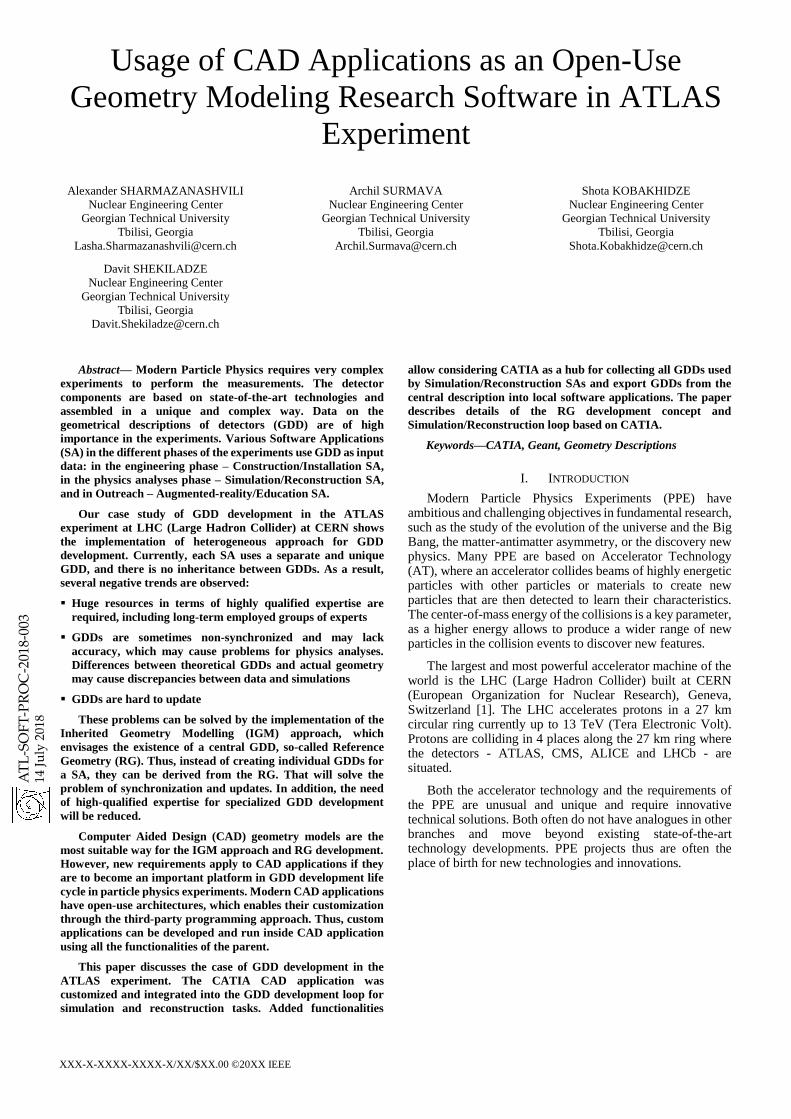
Fig. 2. Data/MC discrepancy of Pixel detector. Run-2
2. The absence of inheritance between the several phases causes the existence of non-synchronized GDDs and may lead to a lack of accuracy of physics analyses. The ATLAS simulation is crucial for a wide range investigation of diverse physics processes and transforms the output of Monte Carlo event generators (MC) to a format which is identical to the output of the ATLAS detector data acquisition system [1]. Both the simulated data and detector outputs are processed through the same trigger and reconstruction packages. However, often data analyses report discrepancies between simulated and real data that are caused by inaccuracies in the detector geometry description used in the simulation. Figure 2
shows an example how an adequate description of the detector geometry will improve the agreement between MC simulation and data [13]. Black dots correspond to data from Run-2 and shows that discrepancy for modified geometry of Pixel detector (in green) is less than for default geometry (in red). Best visible is the discrepancy in the IBL structure where the default geometry implemented at the start of Run 2 missed the surface mounted devices at a distance of around r=32mm from the beam line. The updated geometry, which included this missed material, significantly improves the agreement between data and MC.
3. Facilities need permanent upgrades. Materials used in the detectors gradually change their properties because of the radiation exposure due to high luminosity operation. Therefore, after certain period detector components should be exchanged. In addition, usually at the moment of installation, detector components are already old from the point of view of used technologies and methods and need upgrades. Absence of inheritance between GDDs and permanently upgradable environment make updates very hard and time consuming.
III. INHERITED GEOMETRY MODELLING (IGM)
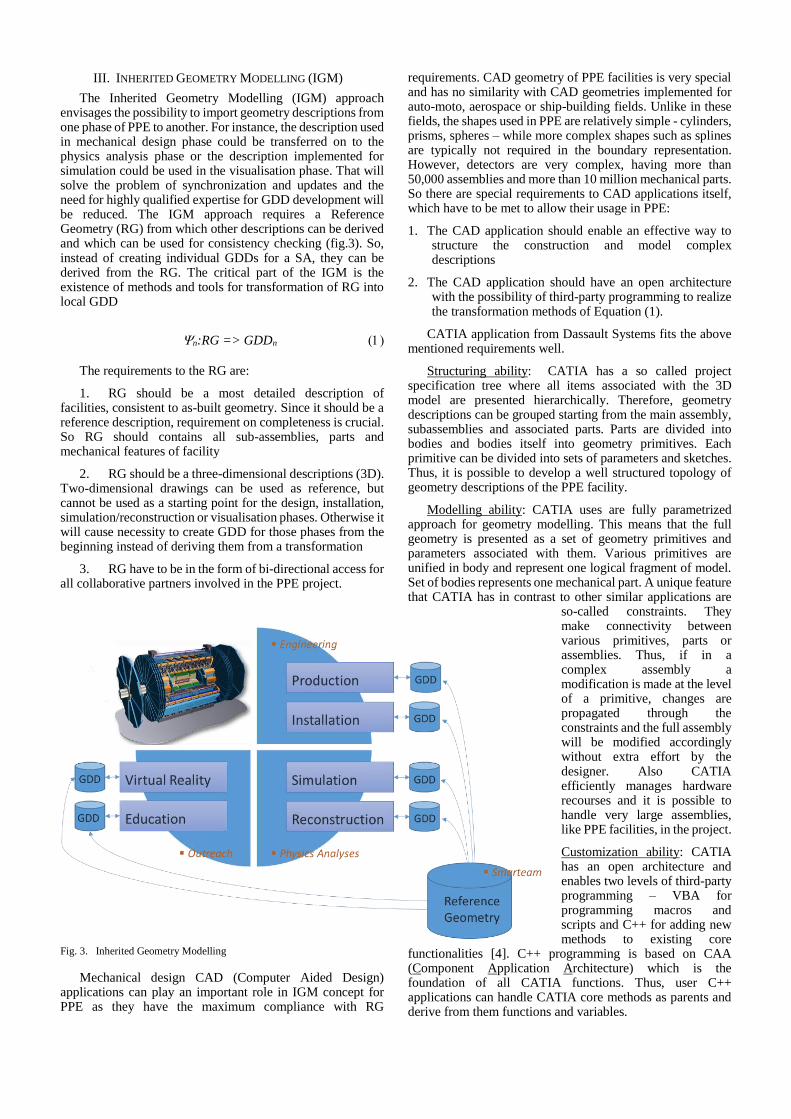
The Inherited Geometry Modelling (IGM) approach envisages the possibility to import geometry descriptions from one phase of PPE to another. For instance, the description used in mechanical design phase could be transferred on to the physics analysis phase or the description implemented for simulation could be used in the visualisation phase. That will solve the problem of synchronization and updates and the need for highly qualified expertise for GDD development will be reduced. The IGM approach requires a Reference Geometry (RG) from which other descriptions can be derived and which can be used for consistency checking (fig.3). So, instead of creating individual GDDs for a SA, they can be derived from the RG. The critical part of the IGM is the existence of methods and tools for transformation of RG into local GDD
n:RG => GDDn
The requirements to the RG are:
1. RG should be a most detailed description of facilities, consistent to as-built geometry. Since it should be a reference description, requirement on completeness is crucial. So RG should contains all sub-assemblies, parts and mechanical features of facility
2. RG should be a three-dimensional descriptions (3D). Two-dimensional drawings can be used as reference, but cannot be used as a starting point for the design, installation, simulation/reconstruction or visualisation phases. Otherwise it will cause necessity to create GDD for those phases from the beginning instead of deriving them from a transformation
3. RG have to be in the form of bi-directional access for all collaborative partners involved in the PPE project.
Fig. 3. Inherited Geometry Modelling
Mechanical design CAD (Computer Aided Design) applications can play an important role in IGM concept for PPE as they have the maximum compliance with RG
requirements. CAD geometry of PPE facilities is very special and has no similarity with CAD geometries implemented for auto-moto, aerospace or ship-building fields. Unlike in these fields, the shapes used in PPE are relatively simple - cylinders, prisms, spheres – while more complex shapes such as splines are typically not required in the boundary representation. However, detectors are very complex, having more than 50,000 assemblies and more than 10 million mechanical parts. So there are special requirements to CAD applications itself, which have to be met to allow their usage in PPE:
1. The CAD application should enable an effective way to structure the construction and model complex descriptions
2. The CAD application should have an open architecture with the possibility of third-party programming to realize the transformation methods of Equation (1).
CATIA application from Dassault Systems fits the above mentioned requirements well.
Structuring ability: CATIA has a so called project specification tree where all items associated with the 3D model are presented hierarchically. Therefore, geometry descriptions can be grouped starting from the main assembly, subassemblies and associated parts. Parts are divided into bodies and bodies itself into geometry primitives. Each primitive can be divided into sets of parameters and sketches. Thus, it is possible to develop a well structured topology of geometry descriptions of the PPE facility.
Modelling ability: CATIA uses are fully parametrized approach for geometry modelling. This means that the full geometry is presented as a set of geometry primitives and parameters associated with them. Various primitives are unified in body and represent one logical fragment of model. Set of bodies represents one mechanical part. A unique feature that CATIA has in contrast to other similar applications are
so-called constraints. They make connectivity between various primitives, parts or assemblies. Thus, if in a complex assembly a modification is made at the level of a primitive, changes are propagated through the constraints and the full assembly will be modified accordingly without extra effort by the designer. Also CATIA efficiently manages hardware recourses and it is possible to handle very large assemblies, like PPE facilities, in the project.
Customization ability: CATIA has an open architecture and enables two levels of third-party programming – VBA for programming macros and scripts and C++ for adding new methods to existing core
functionalities [4]. C++ programming is based on CAA (Component Application Architecture) which is the foundation of all CATIA functions. Thus, user C++ applications can handle CATIA core methods as parents and derive from them functions and variables.
This paper describes the methods to develop an IGM concept for the ATLAS experiment on the basis of the CATIA mechanical CAD application.
IV. RG DEVELOPMENT METHODS
The ATLAS detector is a scientific facility at the LHC, which is situated at CERN near the France-Switzerland border near Geneva. People from 182 collaborative institutes in 38 countries built it during 5 years. The installation was finished in 2008.
Fig. 4. Cut-away view of ATLAS detector at LHC
The detector is 44 meters long and 25 meters high and situated 100 meters underground [5]. The weight of the detector is 7,000 tons (Fig.4).
The facility was designed to detect particles produced in the collisions of protons from the two counter-circulating beams of the LHC. Collisions take place in the center of the detector, called further the Z0 point. A variety of particles are generated in the collisions that move from the Z0 point into all directions in 3D space and cross thereby the detector components. Detector signals generated in this process allow particle detection. This so-called event data is later analysed to learn about the collisions and the particles created in them.
CAD geometry of the ATLAS detector consists of relatively simple parts with shapes which can be described by standard parametrized primitives like – cylinders, tubes, prisms, etc. At the same time many parts are distributed symmetrically around the Z0 central point. All parts are grouped into two main classes:
Barrel – parts, which are crossing Z0 point
End-CAP – parts, which are positioned in opposite side of Z0 alongside with beam.
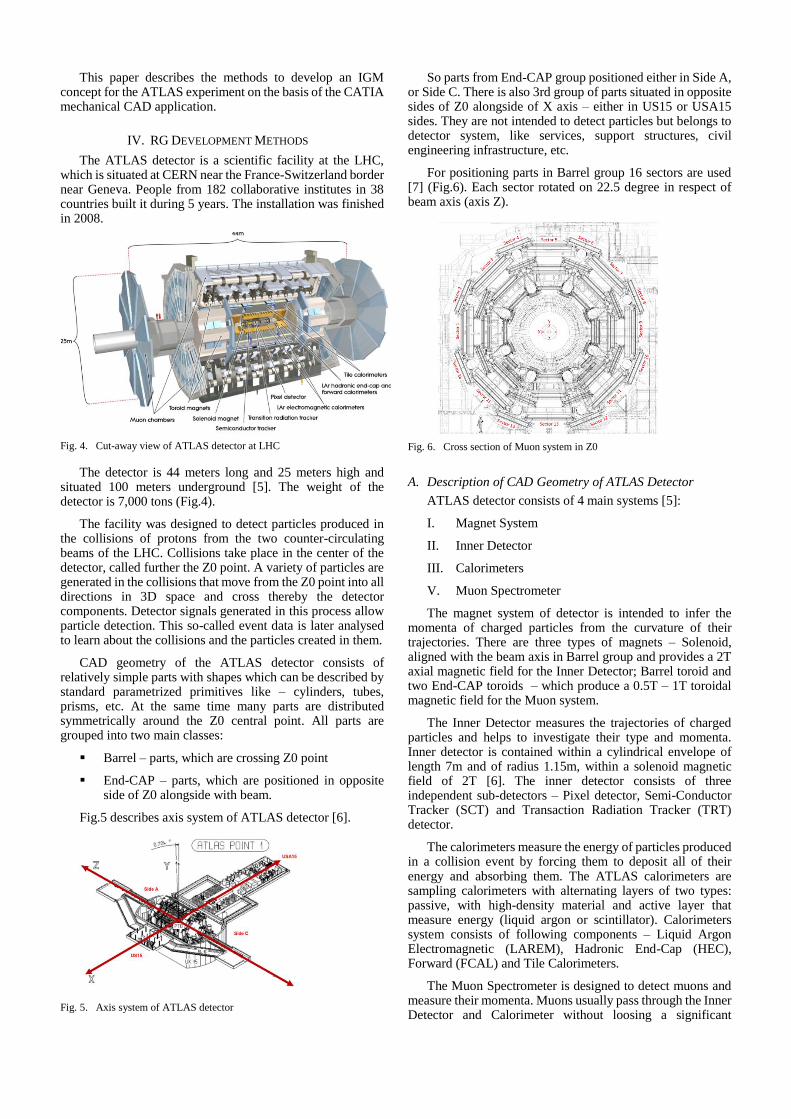
Fig.5 describes axis system of ATLAS detector [6].
Fig. 5. Axis system of ATLAS detector
So parts from End-CAP group positioned either in Side A, or Side C. There is also 3rd group of parts situated in opposite sides of Z0 alongside of X axis – either in US15 or USA15 sides. They are not intended to detect particles but belongs to detector system, like services, support structures, civil engineering infrastructure, etc.
For positioning parts in Barrel group 16 sectors are used [7] (Fig.6). Each sector rotated on 22.5 degree in respect of beam axis (axis Z).
Fig. 6. Cross section of Muon system in Z0
A. Description of CAD Geometry of ATLAS Detector
ATLAS detector consists of 4 main systems [5]:
I. Magnet System
II. Inner Detector
III. Calorimeters
V. Muon Spectrometer
The magnet system of detector is intended to infer the momenta of charged particles from the curvature of their trajectories. There are three types of magnets – Solenoid, aligned with the beam axis in Barrel group and provides a 2T axial magnetic field for the Inner Detector; Barrel toroid and two End-CAP toroids – which produce a 0.5T – 1T toroidal magnetic field for the Muon system.
The Inner Detector measures the trajectories of charged particles and helps to investigate their type and momenta. Inner detector is contained within a cylindrical envelope of length 7m and of radius 1.15m, within a solenoid magnetic field of 2T [6]. The inner detector consists of three independent sub-detectors – Pixel detector, Semi-Conductor Tracker (SCT) and Transaction Radiation Tracker (TRT) detector.
The calorimeters measure the energy of particles produced in a collision event by forcing them to deposit all of their energy and absorbing them. The ATLAS calorimeters are sampling calorimeters with alternating layers of two types: passive, with high-density material and active layer that measure energy (liquid argon or scintillator). Calorimeters system consists of following components – Liquid Argon Electromagnetic (LAREM), Hadronic End-Cap (HEC), Forward (FCAL) and Tile Calorimeters.
The Muon Spectrometer is designed to detect muons and measure their momenta. Muons usually pass through the Inner Detector and Calorimeter without loosing a significant
fraction of their energy. The Muon spectrometer consists of 4 subsystems – Thin Gap Chambers (TGC), Resistive Plate Chambers (RPC), Monitored Drift Tubes (MDT), Cathode Strip Chambers (CSC).
In addition, the ATLAS detector contains several types of support structures, such as feet, platforms and services, racks, cable trays, cryogenic system, Cooling pipes, and alignment systems.
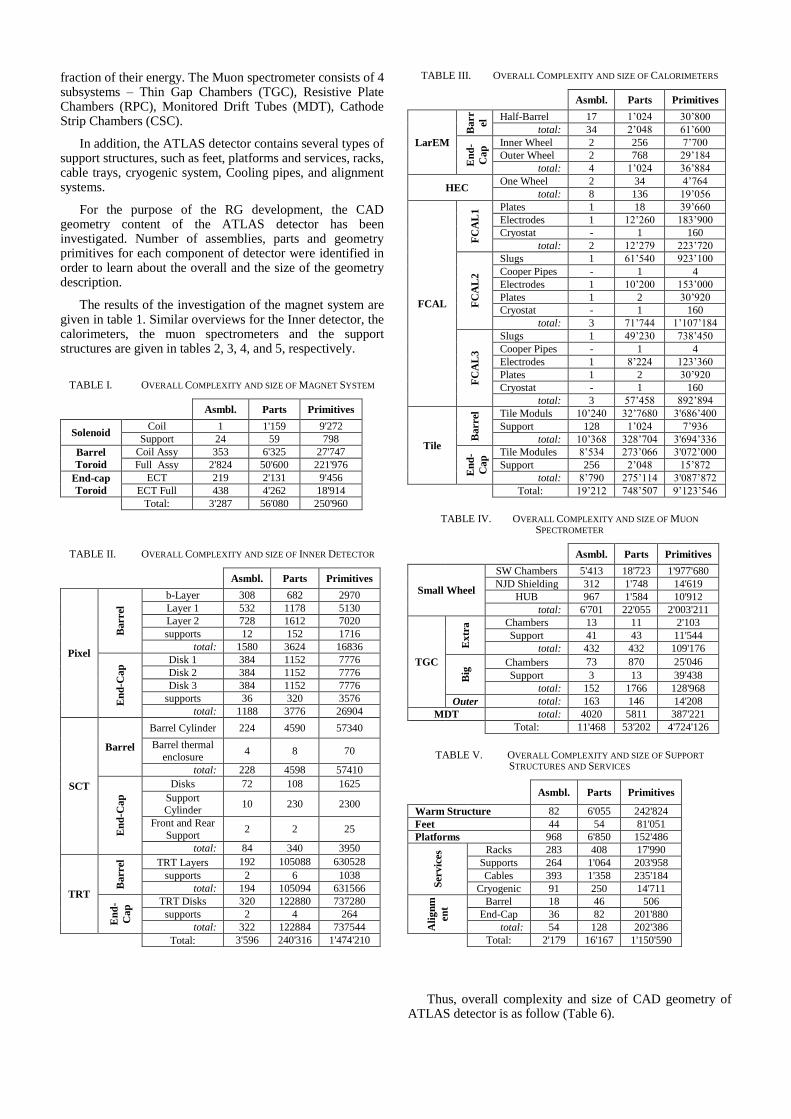
For the purpose of the RG development, the CAD geometry content of the ATLAS detector has been investigated. Number of assemblies, parts and geometry primitives for each component of detector were identified in order to learn about the overall and the size of the geometry description.
The results of the investigation of the magnet system are given in table 1. Similar overviews for the Inner detector, the calorimeters, the muon spectrometers and the support structures are given in tables 2, 3, 4, and 5, respectively.
TABLE I. OVERALL COMPLEXITY AND SIZE OF MAGNET SYSTEM
Asmbl. Parts Primitives
Solenoid Coil 1 1'159 9'272
Support 24 59 798
Barrel
Toroid
Coil Assy 353 6'325 27'747
Full Assy 2'824 50'600 221'976
End-cap
Toroid
ECT 219 2'131 9'456
ECT Full 438 4'262 18'914
Total: 3'287 56'080 250'960
TABLE II. OVERALL COMPLEXITY AND SIZE OF INNER DETECTOR
Asmbl. Parts Primitives
Pixel
Barrel
b-Layer 308 682 2970
Layer 1 532 1178 5130
Layer 2 728 1612 7020
supports 12 152 1716
total: 1580 3624 16836
En
d-C
ap
Disk 1 384 1152 7776
Disk 2 384 1152 7776
Disk 3 384 1152 7776
supports 36 320 3576
total: 1188 3776 26904
SCT
Barrel
Barrel Cylinder 224 4590 57340
Barrel thermal
enclosure 4 8 70
total: 228 4598 57410
En
d-C
ap
Disks 72 108 1625
Support Cylinder
10 230 2300
Front and Rear
Support 2 2 25
total: 84 340 3950
TRT
Barrel
TRT Layers 192 105088 630528
supports 2 6 1038
total: 194 105094 631566
En
d-
Ca
p TRT Disks 320 122880 737280
supports 2 4 264
total: 322 122884 737544
Total: 3'596 240'316 1'474'210
TABLE III. OVERALL COMPLEXITY AND SIZE OF CALORIMETERS
Asmbl. Parts Primitives
LarEM
Barr
el Half-Barrel 17 1’024 30’800
total: 34 2’048 61’600
En
d-
Ca
p Inner Wheel 2 256 7’700
Outer Wheel 2 768 29’184
total: 4 1’024 36’884
HEC One Wheel 2 34 4’764
total: 8 136 19’056
FCAL
FC
AL
1 Plates 1 18 39’660
Electrodes 1 12’260 183’900
Cryostat - 1 160
total: 2 12’279 223’720
FC
AL
2
Slugs 1 61’540 923’100
Cooper Pipes - 1 4
Electrodes 1 10’200 153’000
Plates 1 2 30’920
Cryostat - 1 160
total: 3 71’744 1’107’184
FC
AL
3
Slugs 1 49’230 738’450
Cooper Pipes - 1 4
Electrodes 1 8’224 123’360
Plates 1 2 30’920
Cryostat - 1 160
total: 3 57’458 892’894
Tile
Barrel
Tile Moduls 10’240 32’7680 3'686’400
Support 128 1’024 7’936
total: 10’368 328’704 3'694’336
En
d-
Ca
p Tile Modules 8’534 273’066 3'072’000
Support 256 2’048 15’872
total: 8’790 275’114 3'087’872
Total: 19’212 748’507 9’123’546
TABLE IV. OVERALL COMPLEXITY AND SIZE OF MUON
SPECTROMETER
Asmbl. Parts Primitives
Small Wheel
SW Chambers 5'413 18'723 1'977'680
NJD Shielding 312 1'748 14'619
HUB 967 1'584 10'912
total: 6'701 22'055 2'003'211
TGC
Ex
tra Chambers 13 11 2'103
Support 41 43 11'544
total: 432 432 109'176
Big
Chambers 73 870 25'046
Support 3 13 39'438
total: 152 1766 128'968
Outer total: 163 146 14'208
MDT total: 4020 5811 387'221
Total: 11'468 53'202 4'724'126
TABLE V. OVERALL COMPLEXITY AND SIZE OF SUPPORT
STRUCTURES AND SERVICES
Asmbl. Parts Primitives
Warm Structure 82 6'055 242'824
Feet 44 54 81'051
Platforms 968 6'850 152'486
Servic
es Racks 283 408 17'990
Supports 264 1'064 203'958
Cables 393 1'358 235'184
Cryogenic 91 250 14'711
Ali
gn
m
en
t
Barrel 18 46 506
End-Cap 36 82 201'880
total: 54 128 202'386
Total: 2'179 16'167 1'150'590
Thus, overall complexity and size of CAD geometry of ATLAS detector is as follow (Table 6).

TABLE VI. OVERALL COMPLEXITY AND SIZE OF ATLAS DETECTOR
Asmbl. Parts Primitives
Magnet System 3'287 56'080 250'960
Inner Detector 3'596 240'316 1'474'210
Calorimeters 19’212 748’507 9’123’546
Muon
Spectrometer 11'468 53'202 4'724'126
Supports and
Services 2'179 16'167 1'150'590
total: 60’326 1’114’272 16’723’432
In summary, the ATLAS detector CAD description is very complex with more than 60,000 assemblies, more than 1 million parts and about 17 million geometry primitives.
B. Structurization of CAD Geometry of ATLAS Detector
The CAD geometry of ATLAS detector can presented by following equation
D = { A \ ~6*104, P \ ~1*106, F \ ~1.7*107 } (2)
where, A describes assemblies, P parts and F features.
This represents a large complexity and for the development of a RG it is necessary to structure this by classifying items by features, decomposition and separation of typical structures.
According to the logical connections between components, the structure of ATLAS detector can be described by a hierarchical tree. The decomposition of items into sub items at each level of the hierarchy should be done preserving these systematic features. If the decomposition causes the loss of the systematic feature then the current level of the hierarchy is final and item on that level is so-called Elementary Assembly (EA). The decomposition is performed according to a list of criteria. Reference [8] describes three criteria for the decomposition of the structure of the detector:
1. Functional criteria {}, which characterize system
features of detector components
2. Criteria {}, which characterized distribution of
components in the space
3. Criteria of symmetry {}.
{} criteria can be formed from the functional purpose of
components. However, in most of the cases the set of [EA]
generating by {}, represent complex assemblies, which contain symmetrical parts distributed around the beam axis. Therefore, the next step of decomposition should be done by
{} criteria. As it was mentioned above ATLAS detector has symmetrical sides in respect of collision point Z0. So, after
decomposition by {} criteria and formation of [EA],
decomposition by criteria {} and formation of [EA] and
formation of [EA] array is needed.
Thus, final set [EA] will formed by decomposition sequence (3) and will contain array
:D ->[EA]
:[EA] ->[EA]
:[EA] ->[EA] (3)
[EA][EA][EA]}+{[EA] [EA]}+[EA] (4)
On the first level of decomposition, the components are divided into detector and infrastructure components. The detector components are those participating in the detection of particles while the infrastructure components provide detector
functionality. 2nd level of hierarchy includes main components for particle detection and bending, support structures, services and control system (fig.7). The further decomposition is done according to the ATLAS technical
descriptions.
Fig. 7. Two levels of hierarchies after decomposition by criteria
Thus, 6 levels of hierarchies, 153 items and
[EA]have been formed.
The {} decomposition is done from [EA]according to the sectoral distribution of the ATLAS detector (fig.6). Therefore, additional layer of hierarchy, 54 items and
[EA]=54 added.
The {} decomposition is done from [EA]according to the symmetrical distribution of items in the ATLAS detector, side A, side C, US15, USA15 (fig.5). As a result, additional
layer of hierarchy, 153 items and [EA]=153 added.
Finally, the full CAD description of the ATLAS detector as described by equation (2) is structured as a hierarchical tree with eight levels hierarchical tree with 207 classes and [EA]=247 objects. The corresponding project tree built in CATIA with 247 subassemblies distributed in 207 branches is shown in Figure 8.
Fig. 8. CATIA Project tree of ATLAS detector

C. Geometry Migration Methods
The next step of RG development is to put geometry descriptions into the project tree. This would require the migration of descriptions by the different collaborative partners and institutes of the ATLAS collaboration who develop particular components of detector. Partners use different CAD platforms and methods for the creation of descriptions complicating this migration. This is a well-known and difficult problem in the life cycle of geometry description development. For instance migration of CAD geometry descriptions from CATIA V4-to-CATIA V5 led to 6.1 billion USD additional cost due to years of project delays in production of the Airbus A380 [9]. CAD platforms use different kernels for geometry modelling. As a result, models from different CAD platforms are not compatible and require special migration procedures. Another factor are differences in the geometry modelling methods implemented by different designers and interpreted differently by different CAD platforms. This finally causes inaccurate results when migrating descriptions from one platform into another.
Defects in migrated geometry descriptions can be classified by following cases:
Case#01: Migrated descriptions often contains non-editable components – items without history. This happens when migration software failed in the feature-recognition function and put solids formed from a facet-based visualization model instead. As a result, solids without sketches are presented in descriptions.
Case#02: Migrated descriptions are often incomplete and either miss some parts or contain parts with deformed geometry descriptions. This is also happens because of migration tools failure.
Case#03: Migrated descriptions sometimes have internal conflicts of integration – overlaps and clearance, due to design errors.
Case#04: Migrated descriptions are not detailed enough due to design errors or migration failure.
Case#05: Migrated descriptions contain “foreign” components belonging to other descriptions and usually added by designers as auxiliary descriptions during design.
Case#06: An additional case of conflict case is possible because the migrated descriptions not always correspond to the above considered structuring of Equation (4).
Thus, six criteria of defects analyzes in migrated descriptions formed from above described cases. Descriptions development for RG should include checking phase by those six criteria and consecutive phase of descriptions recovering from defects. Both phases should be realized in CATIA by implementing its powerful modules and methods.
Adding history (Case#01) is possible by projection of non-editable components on planes by “Project 3D Elements” method and creation of sketch with further solid creation.
It is possible to identify how complete the migration of the description is (Case#02) by comparing solid models of the description with facet models. These are derived from different chains of the migration process. Solids are passed through the intelligent feature recognition procedures while facets are just copy visualization model without transformation. Therefore, facet models are more reliable and
free from errors. So, that comparison will identify what is missing in migrated solids. Models can be recovered by adding bodies and parts on CATIA project tree.
Detection of integration conflicts (Case#03) is possible by DMU modules and methods. Adding detalization (Case#04) is possible by modification of sketches and by adding items on CATIA project tree.
Below a case study is described in which the description of the Flexible_Chain_Sector-9 part of the ATLAS detector is checked and recovered by the above considered criteria and
methods. This part is an EA that belongs to the array [EA] (3) and is situated on structure tree on 8th level of hierarchy having been successor of following ancestors {002:Infrastructure}->{023:Cables and Pipe Distribution}->{234:Flexible Chain}-> {234.3: Muon EI FC}. Geometry before and after recovery presented on fig.9.
Fig. 9. Flexible Chain Sector 9 assembly before (a) and after (b) recovering
Description of the complexity before and after the recovery is given in table 7.
TABLE VII. OVERALL COMPLEXITY FLEXIBLE CHAIN SECTOR 9
BEFORE AND AFTER RECOVERY
Before After
Assemblies 11 953
Parts 10 10’819
Bodies 526 16’284
Sketches 601 8’769
Primitives 6’206 55’382
a)
b)
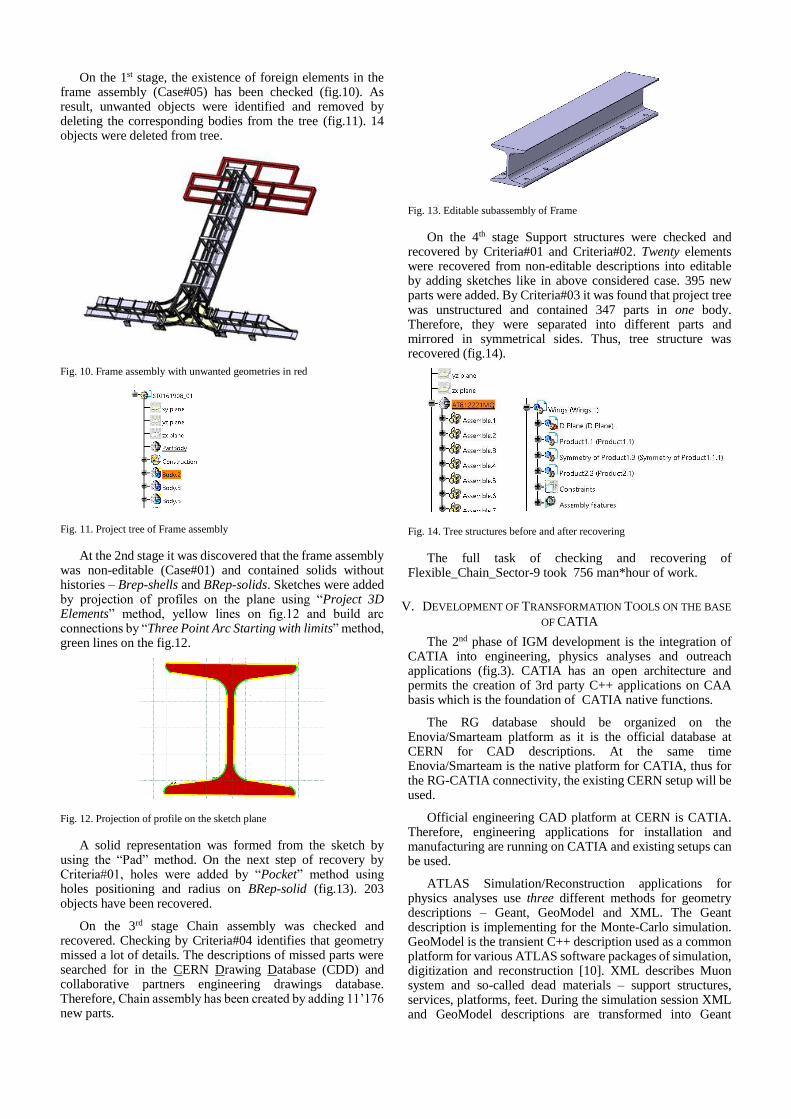
On the 1st stage, the existence of foreign elements in the frame assembly (Case#05) has been checked (fig.10). As result, unwanted objects were identified and removed by deleting the corresponding bodies from the tree (fig.11). 14 objects were deleted from tree.
Fig. 10. Frame assembly with unwanted geometries in red
Fig. 11. Project tree of Frame assembly
At the 2nd stage it was discovered that the frame assembly was non-editable (Case#01) and contained solids without histories – Brep-shells and BRep-solids. Sketches were added by projection of profiles on the plane using “Project 3D Elements” method, yellow lines on fig.12 and build arc connections by “Three Point Arc Starting with limits” method, green lines on the fig.12.
Fig. 12. Projection of profile on the sketch plane
A solid representation was formed from the sketch by using the “Pad” method. On the next step of recovery by Criteria#01, holes were added by “Pocket” method using holes positioning and radius on BRep-solid (fig.13). 203 objects have been recovered.
On the 3rd stage Chain assembly was checked and recovered. Checking by Criteria#04 identifies that geometry missed a lot of details. The descriptions of missed parts were searched for in the CERN Drawing Database (CDD) and collaborative partners engineering drawings database. Therefore, Chain assembly has been created by adding 11’176 new parts.
Fig. 13. Editable subassembly of Frame
On the 4th stage Support structures were checked and recovered by Criteria#01 and Criteria#02. Twenty elements were recovered from non-editable descriptions into editable by adding sketches like in above considered case. 395 new parts were added. By Criteria#03 it was found that project tree was unstructured and contained 347 parts in one body. Therefore, they were separated into different parts and mirrored in symmetrical sides. Thus, tree structure was recovered (fig.14).
Fig. 14. Tree structures before and after recovering
The full task of checking and recovering of Flexible_Chain_Sector-9 took 756 man*hour of work.
V. DEVELOPMENT OF TRANSFORMATION TOOLS ON THE BASE
OF CATIA
The 2nd phase of IGM development is the integration of CATIA into engineering, physics analyses and outreach applications (fig.3). CATIA has an open architecture and permits the creation of 3rd party C++ applications on CAA basis which is the foundation of CATIA native functions.
The RG database should be organized on the Enovia/Smarteam platform as it is the official database at CERN for CAD descriptions. At the same time Enovia/Smarteam is the native platform for CATIA, thus for the RG-CATIA connectivity, the existing CERN setup will be used.
Official engineering CAD platform at CERN is CATIA. Therefore, engineering applications for installation and manufacturing are running on CATIA and existing setups can be used.
ATLAS Simulation/Reconstruction applications for physics analyses use three different methods for geometry descriptions – Geant, GeoModel and XML. The Geant description is implementing for the Monte-Carlo simulation. GeoModel is the transient C++ description used as a common platform for various ATLAS software packages of simulation, digitization and reconstruction [10]. XML describes Muon system and so-called dead materials – support structures, services, platforms, feet. During the simulation session XML and GeoModel descriptions are transformed into Geant
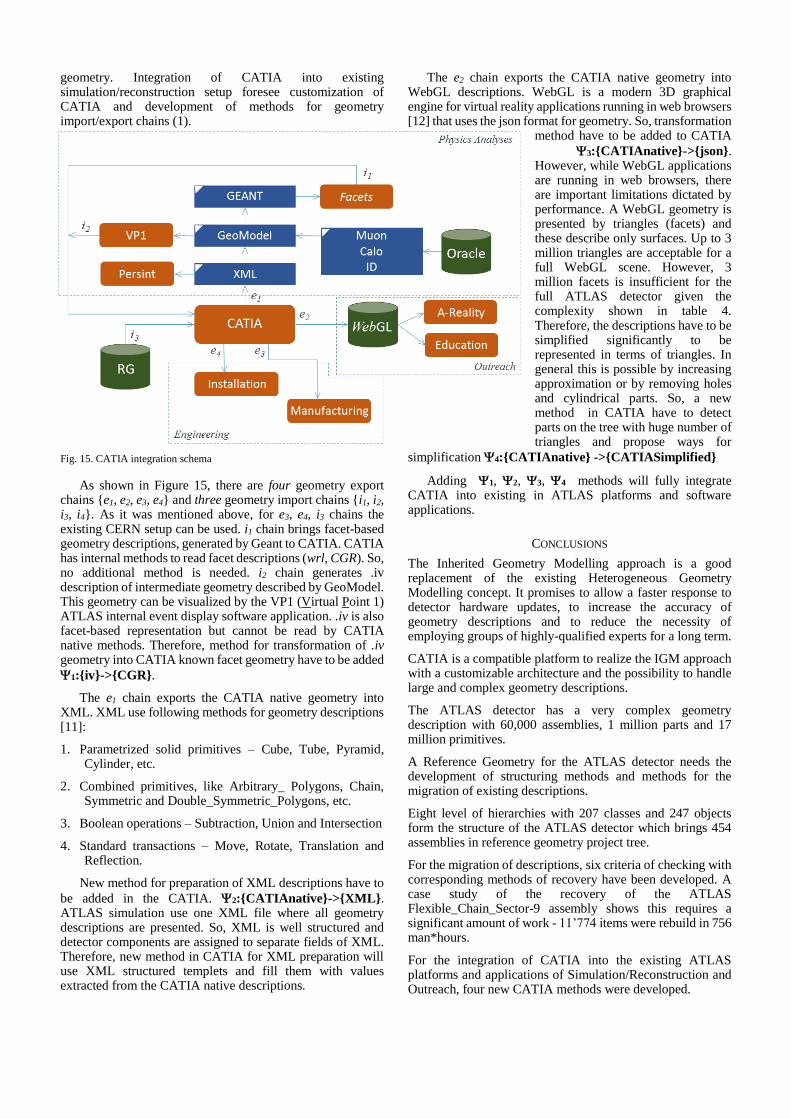
geometry. Integration of CATIA into existing simulation/reconstruction setup foresee customization of CATIA and development of methods for geometry import/export chains (1).
Fig. 15. CATIA integration schema
As shown in Figure 15, there are four geometry export chains {e1, e2, e3, e4} and three geometry import chains {i1, i2, i3, i4}. As it was mentioned above, for e3, e4, i3 chains the existing CERN setup can be used. i1 chain brings facet-based geometry descriptions, generated by Geant to CATIA. CATIA has internal methods to read facet descriptions (wrl, CGR). So, no additional method is needed. i2 chain generates .iv description of intermediate geometry described by GeoModel. This geometry can be visualized by the VP1 (Virtual Point 1) ATLAS internal event display software application. .iv is also facet-based representation but cannot be read by CATIA native methods. Therefore, method for transformation of .iv geometry into CATIA known facet geometry have to be added
1:{iv}->{CGR}.
The e1 chain exports the CATIA native geometry into XML. XML use following methods for geometry descriptions [11]:
1. Parametrized solid primitives – Cube, Tube, Pyramid, Cylinder, etc.
2. Combined primitives, like Arbitrary_ Polygons, Chain, Symmetric and Double_Symmetric_Polygons, etc.
3. Boolean operations – Subtraction, Union and Intersection
4. Standard transactions – Move, Rotate, Translation and Reflection.
New method for preparation of XML descriptions have to
be added in the CATIA. 2:{CATIAnative}->{XML}. ATLAS simulation use one XML file where all geometry descriptions are presented. So, XML is well structured and detector components are assigned to separate fields of XML. Therefore, new method in CATIA for XML preparation will use XML structured templets and fill them with values extracted from the CATIA native descriptions.
The e2 chain exports the CATIA native geometry into WebGL descriptions. WebGL is a modern 3D graphical engine for virtual reality applications running in web browsers [12] that uses the json format for geometry. So, transformation
method have to be added to CATIA
3:{CATIAnative}->{json}. However, while WebGL applications are running in web browsers, there are important limitations dictated by performance. A WebGL geometry is presented by triangles (facets) and these describe only surfaces. Up to 3 million triangles are acceptable for a full WebGL scene. However, 3 million facets is insufficient for the full ATLAS detector given the complexity shown in table 4. Therefore, the descriptions have to be simplified significantly to be represented in terms of triangles. In general this is possible by increasing approximation or by removing holes and cylindrical parts. So, a new method in CATIA have to detect parts on the tree with huge number of triangles and propose ways for
simplification 4:{CATIAnative} ->{CATIASimplified}
Adding 1, 2, 3, 4 methods will fully integrate CATIA into existing in ATLAS platforms and software applications.
CONCLUSIONS
The Inherited Geometry Modelling approach is a good replacement of the existing Heterogeneous Geometry Modelling concept. It promises to allow a faster response to detector hardware updates, to increase the accuracy of geometry descriptions and to reduce the necessity of employing groups of highly-qualified experts for a long term.
CATIA is a compatible platform to realize the IGM approach with a customizable architecture and the possibility to handle large and complex geometry descriptions.
The ATLAS detector has a very complex geometry description with 60,000 assemblies, 1 million parts and 17 million primitives.
A Reference Geometry for the ATLAS detector needs the development of structuring methods and methods for the migration of existing descriptions.
Eight level of hierarchies with 207 classes and 247 objects form the structure of the ATLAS detector which brings 454 assemblies in reference geometry project tree.
For the migration of descriptions, six criteria of checking with corresponding methods of recovery have been developed. A case study of the recovery of the ATLAS Flexible_Chain_Sector-9 assembly shows this requires a significant amount of work - 11’774 items were rebuild in 756 man*hours.
For the integration of CATIA into the existing ATLAS platforms and applications of Simulation/Reconstruction and Outreach, four new CATIA methods were developed.
REFERENCES
[1] L.Evans and Ph. Bryant, “LHC Machine”, Journal of Instrumentation,
vol.3, 2008
[2] A. Sharmazanashvili, “Modeling Aspects of Hyper-Complex Products in Nuclear Engineering Projects”, Proceedings of TMCE 2012, May 7-11, 2012 Karlsruhe, Germany ISBN/EAN 978-90-5155-081-8, 2012
[3] G. Aad, et al, “The ATLAS Simulation Infrastructure”, The European Physical Journal, vol.70, issue 3, 2010, pp. 823-274
[4] Dassault Systems “Advanced drafting and customization”, Instructor guid, V5R19, 2009
[5] G. Aad et al, “The ATLAS Experiment at the CERN Large Hadron Collider”, The ATLAS Collaboration, Published by Institute of Physics Publishing and SISSA, 2010, 407 p.
[6] G. Aad et al, “ATLAS detector and physics performance”, Volume ITechnical Design Report, 1999, 460 p.
[7] G. Aad et al, “Technical Design Report”, ATLAS Technical Co-ordination, 1999, 597 p.
[8] A. Surmava, “Development Analysis and Synthesis of Complete Engineering Geometry Model of ATLAS Detector”, PhD dissertation, Georgian Technical University, 2017, 189 p.
[9] Technical report, “Airbus-A380”, International Project Leadership Academy, retrived 17 June 2015 http://calleam.com/WTPF/?p=4700
[10] J. Boudreau and V. Tsulaia, “The GeoModel toolkit for detector Description”, Computing in High Energy and Nuclear Physics CHEP2004, ed. By A. Aimar, J. Harvey, N. Knoor, Interlaken, Switzerland, Sept. 27 – Oct. 1, 2004
[11] Sharmazanashvili A. et al (2016) “Development of CATIA_2_GEANT Interface for Simulation of High Energy Physics Experiments” Proceedings of TMCE 2016, May 9-13, 2016, Aix-en-Provence France ISBN 978-94-6186-635-6
[12] K. Andrews and B. Wright. FluidDiagrams, “Web-based information vi-sualisation using JavaScript and WebGL”, In N. Elmqvist, M. Kennedy, and J. Hlawitschka, editors, EuroVis—Short Papers. The Eurographics Association, 2014
[13] ATLAS Collaboration “Studies of the ATLAS Inner Detector material using VS=13TeV pp collision data”, ATL-Phys-Pub-2015-050, 29 Nov. 2015, 15p
Related Documents


