USAAVLABS TECHNICAL REPORT 69-32 APPLICABILITY OF THE SOUTHWELL PLOT TO THE INTERPRETATION OF TEST DATA OBTAINED FROM STABILITY STUDIE1i OF ELASTIC COLUMN AND PLATE STRUCTURES By W. N. Norton F. L. Cudari R. W. Johnson November 1971 EUSTIS DIRECTORATE U. S. ARMY AIR MOBILITY RESEARCH AND DEVELOPMENT LABORATORY FORT EUSTIS, VIRGINIA CONTRACT DA 44-177-AMC-258(T) STANFORD UNIVERSITY Roroduco, b STANFORD, CALIFORNIA NATIONAL TECHNICAL INFORMATION SERVICE Sprin,,nold, VA. 22151 Approved for public release; j distribution unlimited.j ) -

Welcome message from author
This document is posted to help you gain knowledge. Please leave a comment to let me know what you think about it! Share it to your friends and learn new things together.
Transcript
USAAVLABS TECHNICAL REPORT 69-32
APPLICABILITY OF THE SOUTHWELL PLOT TO THE INTERPRETATIONOF TEST DATA OBTAINED FROM STABILITY STUDIE1i
OF ELASTIC COLUMN AND PLATE STRUCTURESBy
W. N. NortonF. L. CudariR. W. Johnson
November 1971
EUSTIS DIRECTORATEU. S. ARMY AIR MOBILITY RESEARCH AND DEVELOPMENT LABORATORY
FORT EUSTIS, VIRGINIA
CONTRACT DA 44-177-AMC-258(T)
STANFORD UNIVERSITY Roroduco, b
STANFORD, CALIFORNIA NATIONAL TECHNICALINFORMATION SERVICE
Sprin,,nold, VA. 22151
Approved for public release;j distribution unlimited.j
) -
DISCLAIMERS
The findings in this report are not to be construed as an official
Department of the Army position unless so designated by other authorized
When Government drawings, specifications, or other data are used for any
purpose other than in connection with a definitely related Government
procurement operation, the United States Government thereby incurs no
responsibility nor any obligation whatsoever; and the fact that the
Government may have formulated, furnished, or in any way supplied the
said drawings, specifications, or other data is not to be regarded by
implication or otherwise as in any manner licensing the holder or any
other person or corporation, or conveying any rights or permission, to
manufacture, use, or sell any patented invention that may in any way berelated thereto.
Trade names cited iA this report do not constitute an official endorse-
ment or approval of the use of such commercial hardware or software.
DISPOSITION INSTRUCTIONS iI
Destroy this report when no longer needed. Do not reutrn it to the
origintor.EV
DOC I A . - - -
iNTtHOONVO
UiQ
BY
Wil
Unclassi fied
DOCUMENT CONTRL DAJA. - RS 0
IOIIAIGACTIVITY , ,0f~aar M8 RPT 1C MCLASSIFICATION
Stanford University UnclassifiedStanford, California 24. GROUP
3 F.11PORT TITLE
A REVIEW4 OF THE APPLICABIITY OF THE "SOUTIWELL' PLOTI TO THE INTETATION OF TEST* DATA OBTAINED FROM STABILITY STUDIES OF ELASRTIC COLUMN AND PLATE STRUCTUR] Z
S. %UTHORMI1411 Aiiisim. no-m *miiV4 eer...),,Orton, U. H.Cundari, F. L.Johnson, R. W.
S REPORT DATE M& TOTAS. *0. OP PAGES 17b. 140. or we Is
November 1971 1214&L CONTRACT OR GRANT NO S& ORISIN1ATOR's REPORT NUI4UE8RMB
DA 44-77-A4C-258(T) UIALB ehiclRpr 93b. PROJECT NO. UAVASTcnclRpr 93
Task lF162204A17001C. 96. *?manR "rPORT "0191 (A3.7 Oisf AalloS 11et a7 be AsestIW
d. SUDAPR No. 29610. OISTRIDUTION STATELMENT
Approved for public release; distribution unlimited.
11 SUPLEMENTARY NOTES 12. SPONSORING MILI TARV AC TIVITY
* liustis D~ircctorate, U.S. Arm), Air Mobility
Reeac and Development Laboratory
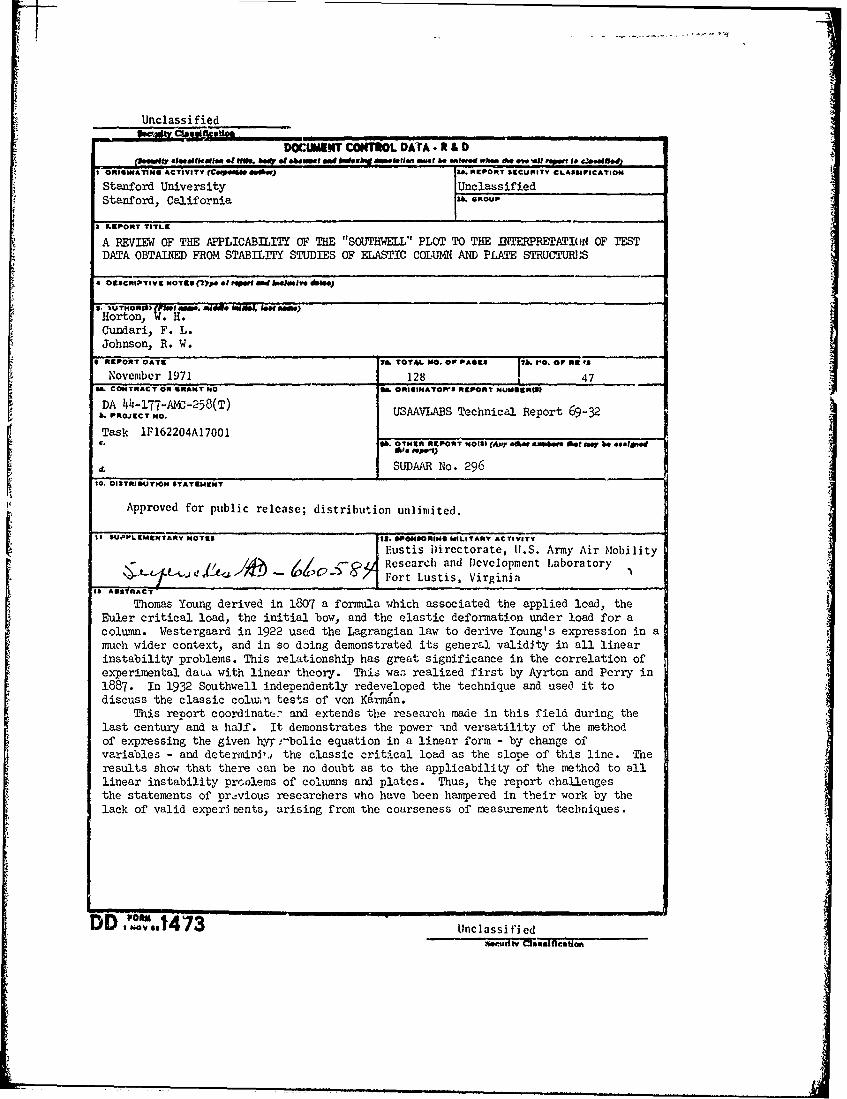
ThoS~R~mas Young derived in 1807 a formula which associated the applied load, the
Euler critical load, the initial bow, and the elastic deformation under load for acolumn. Westergaard in 1922 use~d the Lagrangian law to derive Young's expression in a
* much wider context, and in so doing demonstrated its general validity in all linearinstability problems. This relationship has great significance in the correlation ofexperimental daua with linear theory. This waz realized first by Ayrton and Perry in1887. In 1932 Southwell independently redeveloped the technique and use3 it todiscuss the classic colui'i tests of von Karma'n.
This report coordinate:- and extends the research made in this field during thelast century and a half. It demonstrates the power ind versatility of the methodof expressing the given hy.-bolic equation in a linear form - by change ofvariables - and determini,.t the classic critical load as the slope of this line. Theresults show that there ean be no doubt as to the applicability of the method to alllinear instability prc.olems of columns and plates. Thus, the report challengesthe statements of prcvious researchers who have been hampered in their work by thelack of valid experi nents, arising from the coarseness of measurement techniques.
D D I 1V 473 Unclassified
Unclassified
p1. ~ ORSLINK A LINKS, LINK C
ROL.E WY ROLK WT ROLI WT
Southwel). Plot K --Stability StudiesElastic ColumnPlate Structur-esHyperboJJ.c Equation in a Linear Form by Change
of VariablesCorzalation of experimental Data With Linear
Theory
U~nclassifiedsecurity classificationI 11281.71
DEPARTMENT OF THE ARMYU.S. ARMY AIR MOBILITY RESEARCH & DEVELOPMENT LABORATORY
EUSTIS DIRECTORA[EFORT EUSTISo VIRGINIA 23604
ERRATA
USAAVLABS Technical Report 69-32TITLE: Applicability of the Southwell Plot to the Interpretation
of Test Data Obtained From Stabilit7 Studies of ElasticColumn and Plate Structures
Make the following change to the title on the cover:
Change the word Studied to Studies
I
MMSDEPARTMENT OF THE ARMYU. S. ARM' AIR MUBILITY RESEARCH & DEVELOPMENT LABORATORY
EUSTIS DIRECTORATEFORT EUSTIS, VIRGINIA 23604
This program was carried out under Contract DA 44-177-AMC-258(T) withStanford University.
The data contained in this report are the result of research conductedto apply the Southwell Plot in the intcrpretation of test data obtainedfrorm stability studies of elastic column and plate structures. TheSouthwell method was applied to test data obtained from the literature,as well as from experiments, and was found to be applicable to insta-bility problems of plates.
The report has been reviewed by this Directorate and is co.sidered tooe technically sound. It is published for the exchange of informationand the stimulation of future research.
This program was conducted under the technical maudgement of Mr. James P.Waller, Structures Division.
'\I
\4\j
\,I
ii
---. , .. .. ---... . -... _ .......- - - -
Task LF1%62o4Al7OOlContract DA 44-177-4C-258(T)
USAAVLABS Technical Report 69-32
November 1971
APPLICABILITY OF THE SOUTHWELL PLOT TO THE TTRETATIONOF TEST DATA OBTAINED FROM STABILITY STUDIES
OF ELASTIC COLUMN AND PLATE STRUCTURES
SUDAAR 296
by
W. H. HortonF. L. CundariR. W. Johnson
Prepared by
Stanford UniversityDepartment of Aeronautics and Astronautics
Stanford, California
for
EUSTI S I) I RECTORATE:U.S. ARIY AIR MOBILITY RESEARCII AND DEVELOPMENT LABORATORY
FORT EUSTIS, VIRGINIA
I Approved for public release;distribution unlimited.
SUMARY
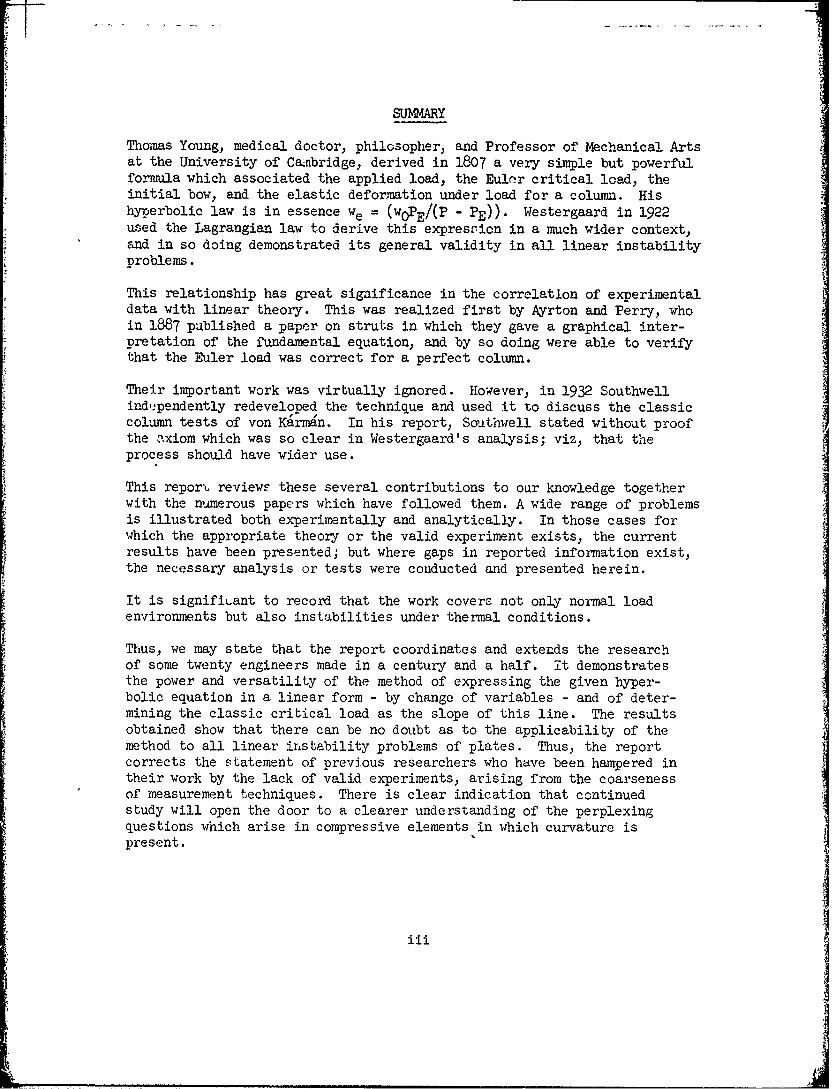
Thomas Young, medical doctor, philosopherj and Professor of Mechanical Artsat the University of Cabridge, derived in 1807 a very simple but powerfulformula which associated the applied load, the Euler critical lcad, theinitial bow, and the elastic deformation under load for a column. Hishyperbolic law is in essence we = (wOPE/(P - PE))- Westergaard in 1922used the Lagrangian law to derive this expression in a much wider context,and in so doing demonstrated its general validity in all linear instabilityproblems.
This relationship has great significance in the correlation of experimentaldata with linear theory. This was realized first by Ayrton and Perry, whoin 1887 published a paper on struts in which they gave a graphical inter-pretation of the fundamental equation, and by so doing were able to verifythat the Euler load was correct for a perfect column.
Their important work was virtually ignored. However, in 1932 Southwellindf-pendently redeveloped the technique and used it to discuss the classiccolumn tests of von K~rman. In his report, Southwell stated without proofthe axiom which was so clear in Westergaard's analysis; viz, that theprocess should have wider use.
This report reviews these several contributions to our knowledge togetherwith the numerous papers which have followed them. A wide range of problemsis illustrated both experimentally and analytically. In those cases forwhich the appropriate theory or the valid experiment exists, the currentresults have been presented; but where gaps in reported information existthe necessary analysis or tests were conducted and presented herein.
It is significant to record that the work covers not only normal loadenvironments but also instabilities under thermal conditions.
Thus, we may state that the report coordinates and extends the researchof some twenty engineers made in a century and a half. It demonstratesthe power and versatility of the method of expressing the given hyper-bolic equation in a linear form - by change of variables - and of deter-mining the classic critical load as the slope of this line. The resultsobtained show that there can be no doubt as to the applicability of themethod to all linear instability problems of plates. Thus, the reportcorrects the statement of previous researchers who have been hampered intheir work by the lack of valid experiments, arising from the coarsenessof measurement techniques. There is clear indication that continuedstudy will open the door to a clearer understanding of the perplexingquestions which arise in compressive elements in which curvature ispresent.
iii
FOREWORD
The research reported herein was carried out under the sponsorship of theUnited States Air Force under Contract AF 49(638)149 5 and the United StatesArnW Aviation Materiel Laboratories under Contract DA 44-177-AMC-258(T)(Task F,:e2o4A17001). Their encouragement and support are gratefullyacknowledged. The authors would like to thank Mr. Lawrence Wang forpreparation of the figures and Mr. Bruce Willey for performing the bucklingtests on the Fiberglas panels.
wI
.... .iiiI I[I I I I I iiiii I
V
TABLE OF CONTENTS
Page
SUIMARY . .. ... . . . . .. M
FOREWORD ... . . . . . . . . . . . .. . v
LIST OF ILLUSTRATIONS . . . . . . . . . . . . . . viii
LIST OF TABLES . . . . . . . . . . . . . . . xii
LIST OF SYMBOLS .. . . . . . . . . . . . . . . xiii
BODY OF REPORT . . . . . . . . . . . . . . . 1
REFERENCES . . ............. 111
DISTRIBUTION 1. . . . . . . . . . . . . . . . 5
viiJS
,w~pi, r ll mw-
LIST OF ILLUSTRATIONS
Figure Page
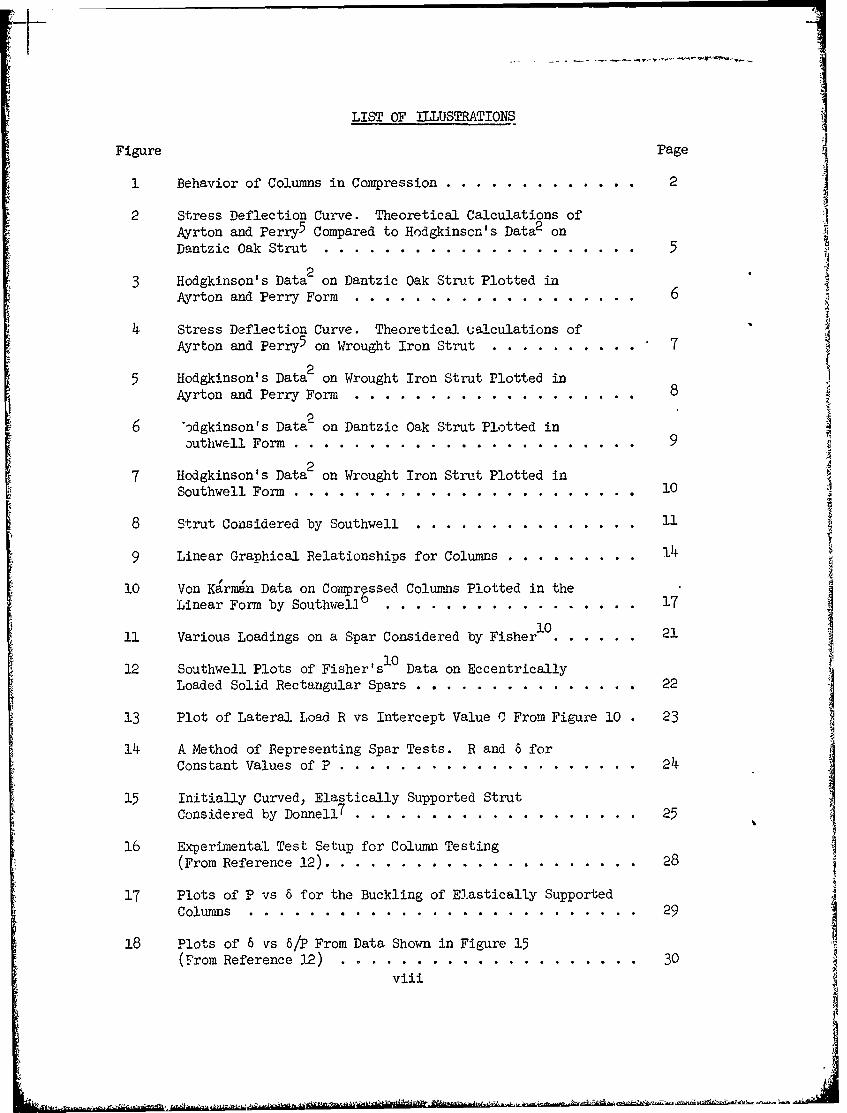
1 Behavior of Columns in Compression ...... ............. 2
2 Stress Deflection Curve. Theoretical Calculations of '3Ayrton and Perry5 Compared to Hodgkinson's Data2 onDantzic Oak Strut .... ...... .. ................. 5
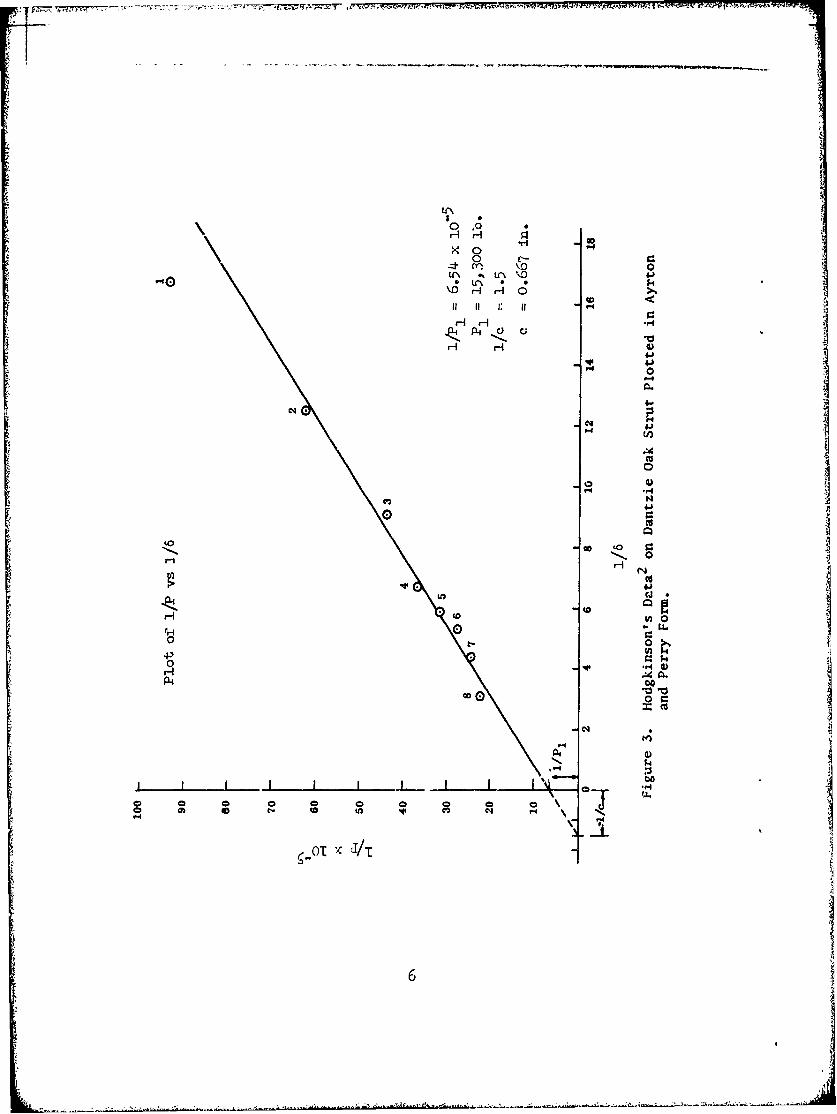
3 Hodgkinson's Data2 on Dantzic Oak Strut Plotted inAyrton and Perry Form .. ....... . . . . . . . .. 6
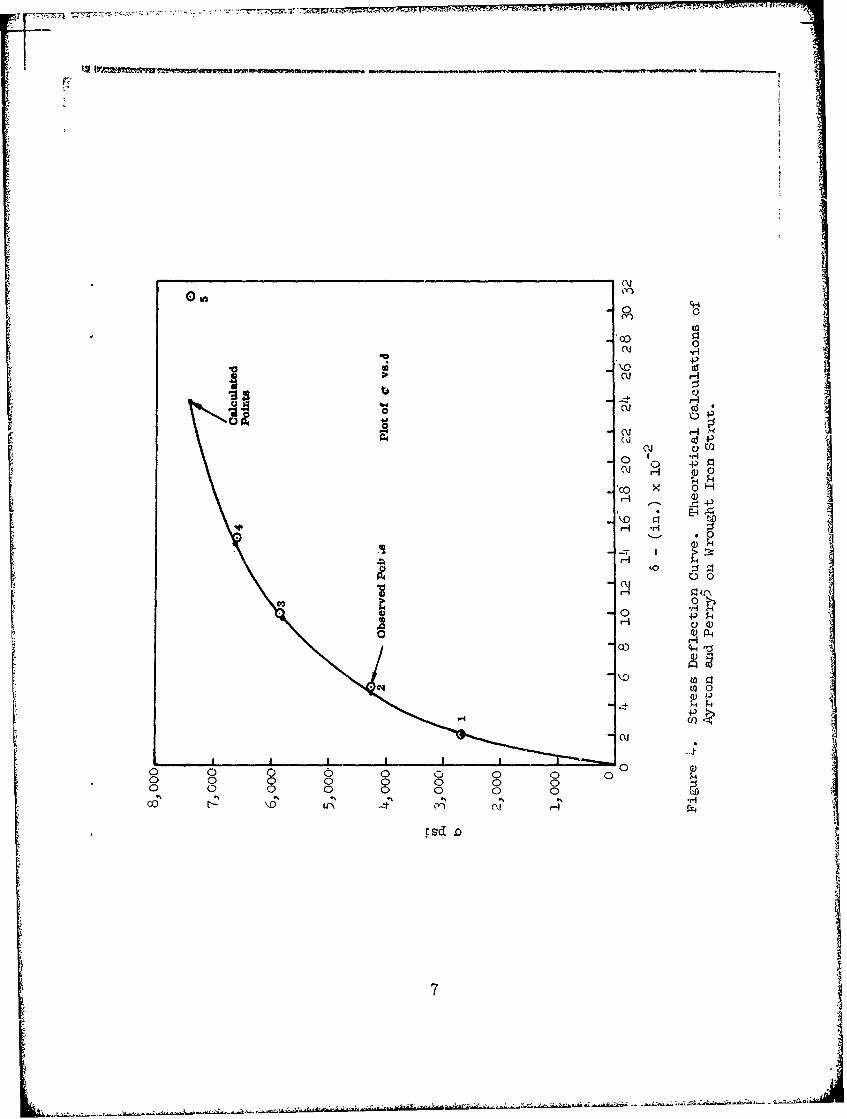
4 Stress Deflection Curve. Theoretical ualculations ofAyrton and Perry5 on Wrought Iron Strut .... .. .......... 7
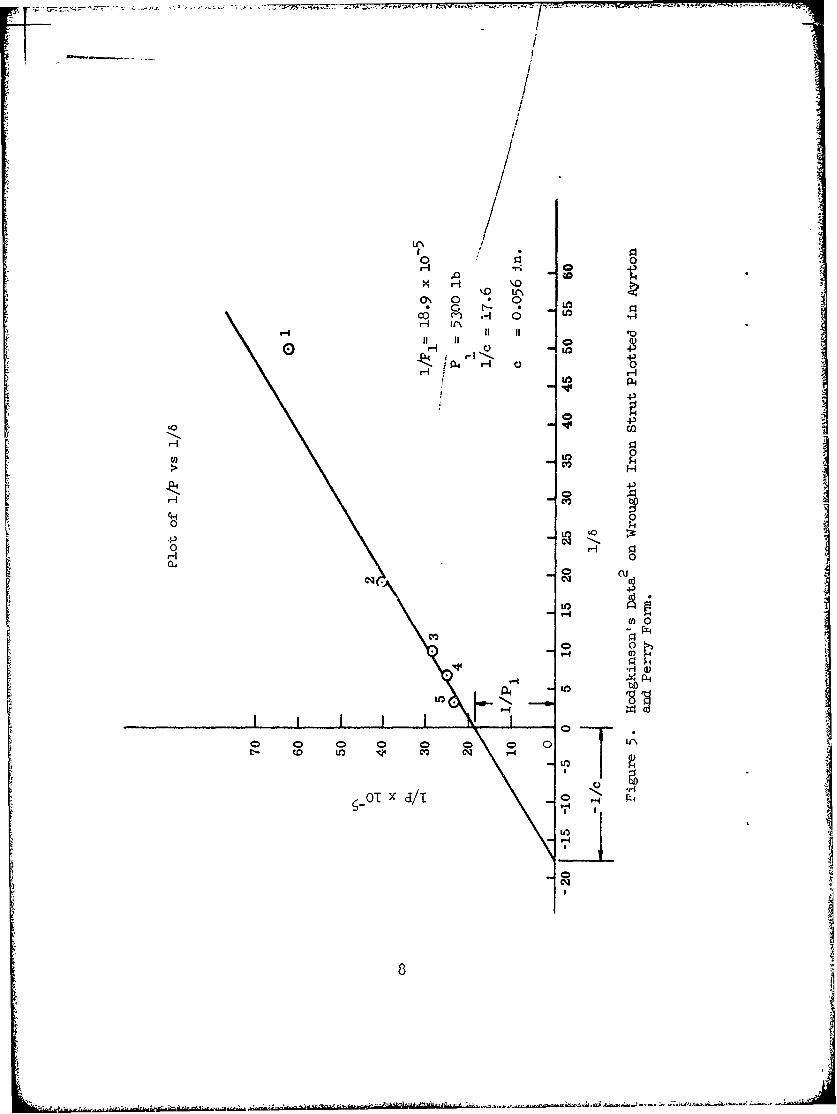
25 Hodgkinson's Data on Wrought Iron Strut Plotted in8Ayrton and Perry Form ....... . ...................
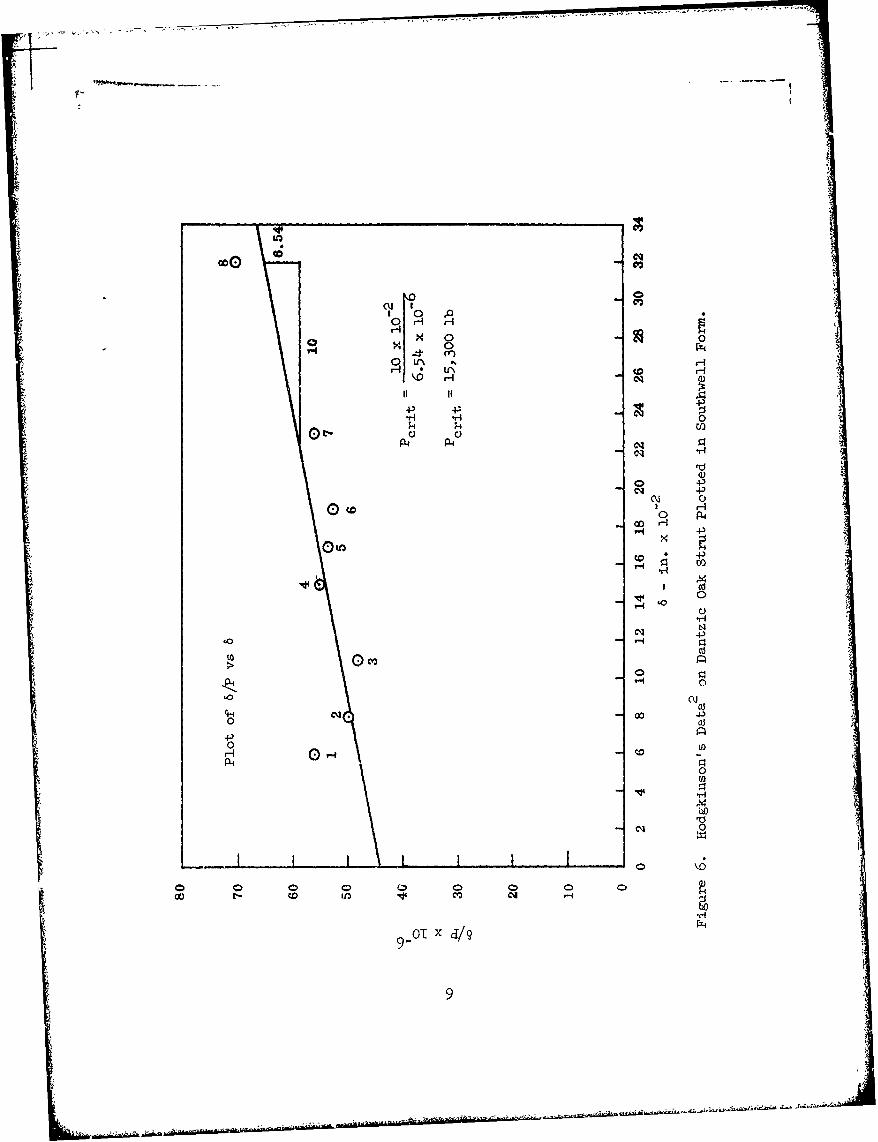
6 "dgkinson's Data- on Dantzic Oak Strut Plotted inouthwell Form ......... ........................ 9
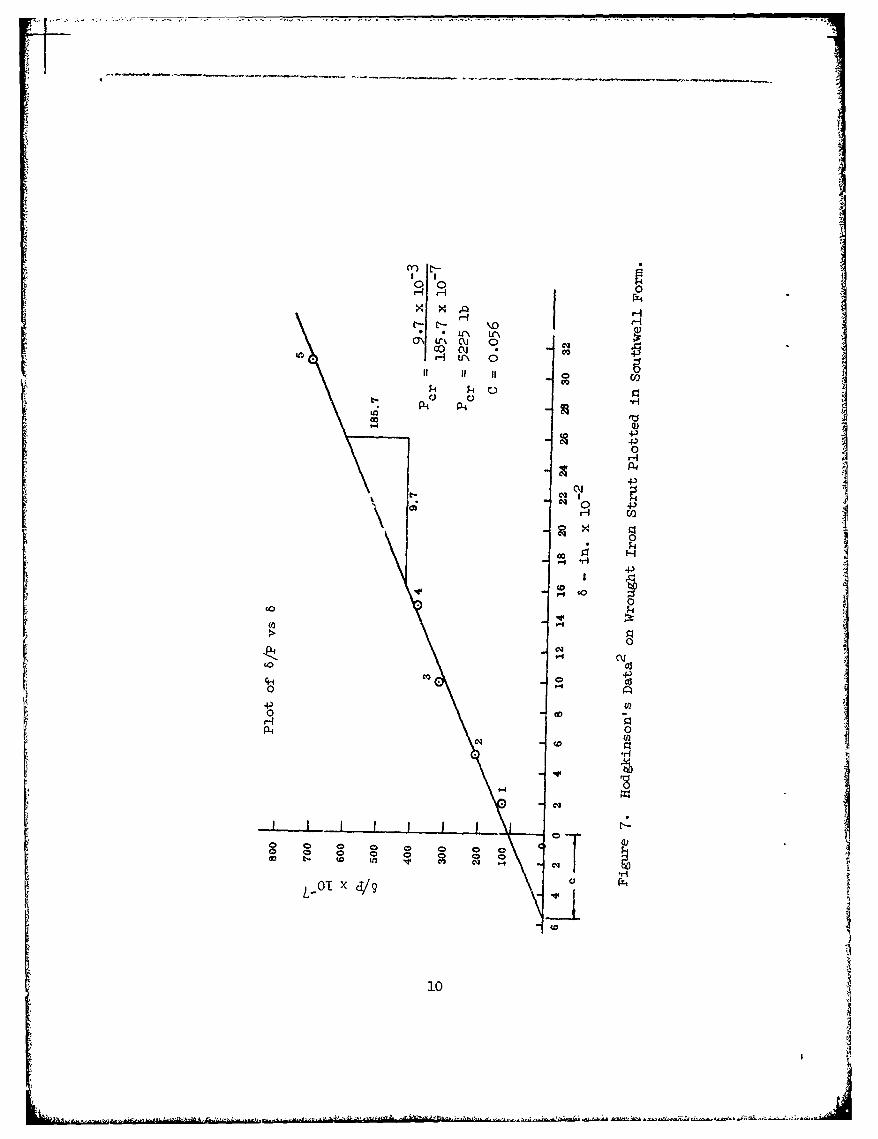
27 Hodgkinson's Data on Wrought Iron Strut Plotted in
Southwell Form ........ ....................... .l.O.10
8 Strut Considered by Southwell ..... .............. .. 11
9 Linear Graphical Relationships for Columns ..... .... . 4
10 Von Karmsn Data on Comprgssed Columns Plotted in theLinear Form by Southwell] ..... ... .......... ..... 17
11 Various Loadings on a Spar Considered by Fisher1 0 . . . . . . 21
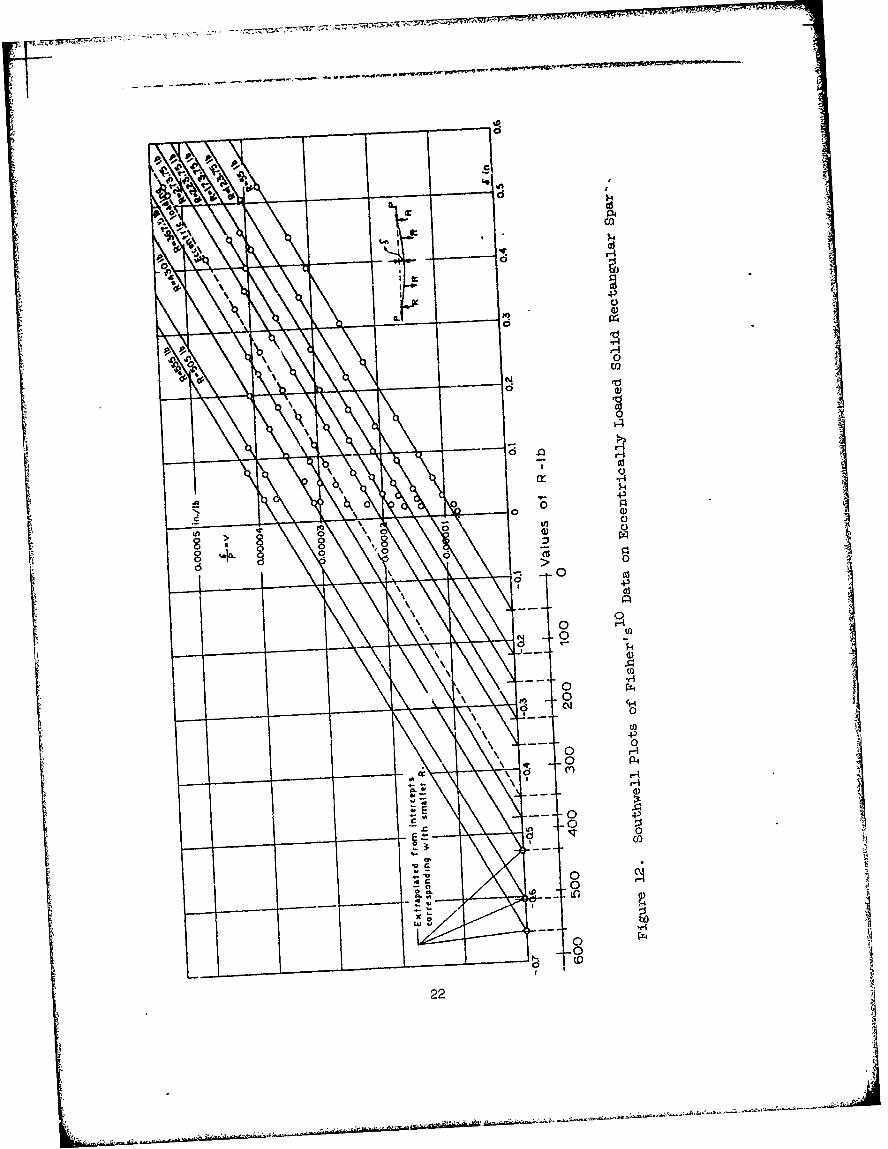
12 Southwell Plots of Fisher's Data on Eccentrically
Loaded Solid Rectangular Spars ................ 22
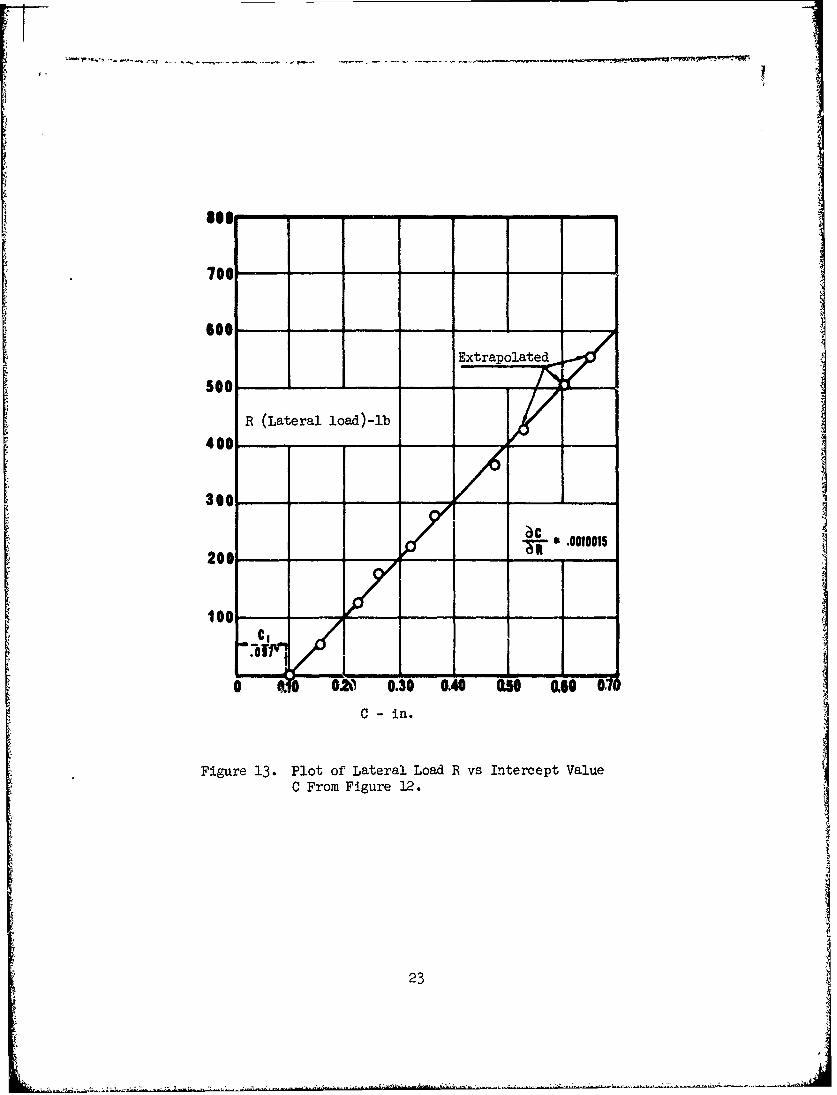
13 Plot of Lateral Load R vs Intercept Value C From Figure 10 . 23
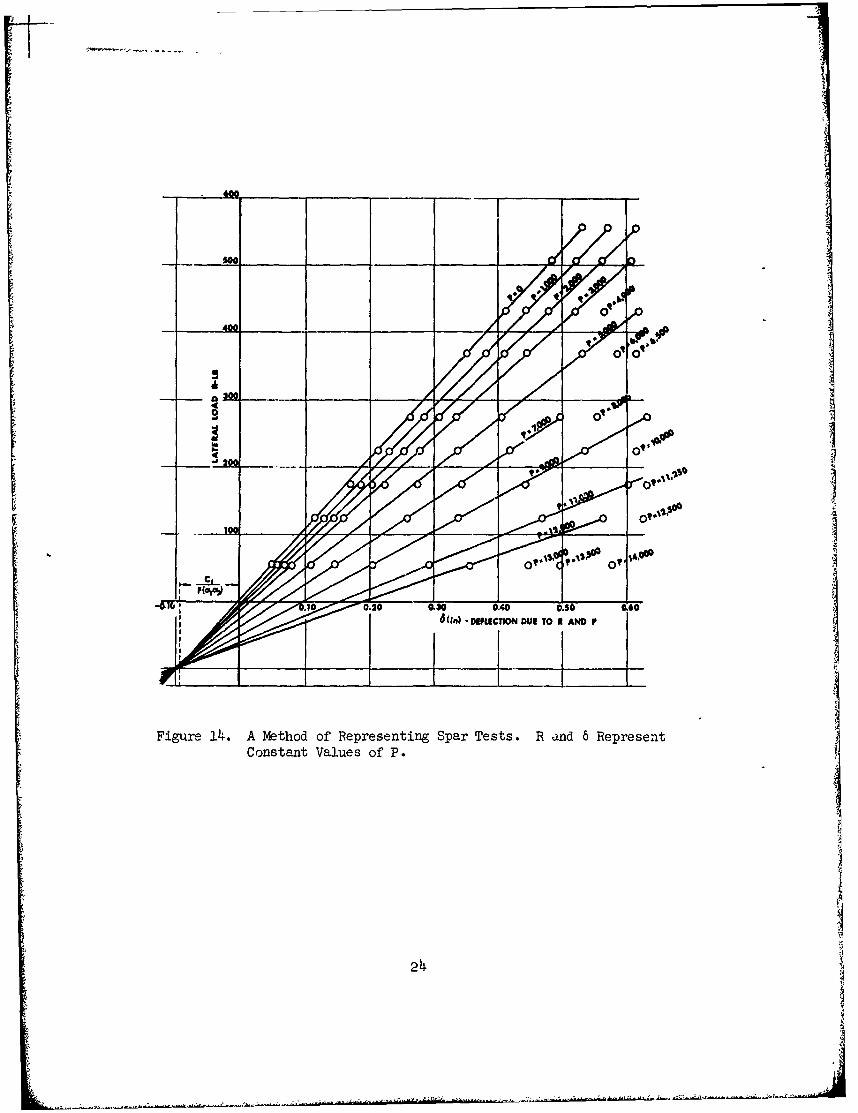
14 A Method of Representing Spar Tests. R and 6 for
Constant Values of P ...... .................. ..... 24
15 Initially Curved, Elastically Supported StrutConsidered by Donnell7 . . . . . . . . .. . . . . . . . . . . . . . . . . . . . 25
16 Experimental Test Setup for Column Testing(From Reference 12) ....... ... ..................... 28
17 Plots of P vs 6 for the Buckling of Elastically Supported
Columns ..... .... ....................... ...... 29
18 Plots of 6 vs 6/P From Data Shown in Figure 15(Frrom Reference 12) ................ 30
viii
LIST OF IIUSTRATIONS(Cont' d
Figure Page
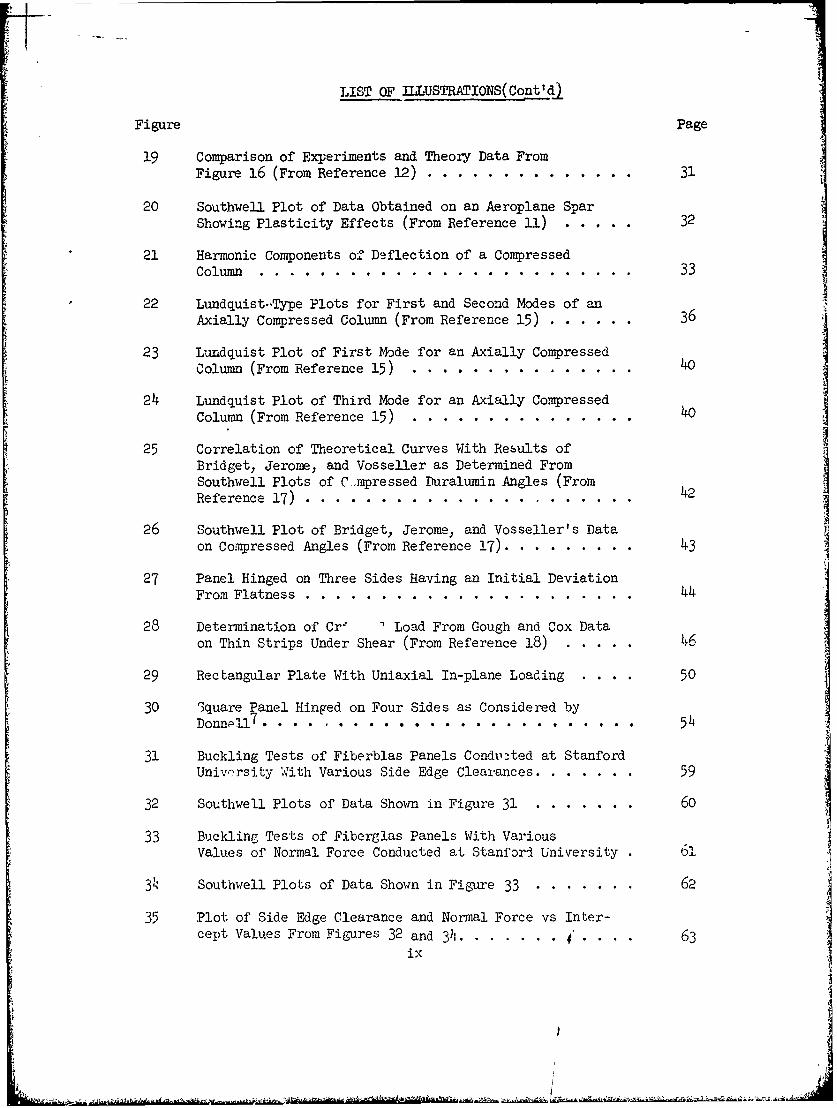
19 Comparison of Experiments and Theory Data FromFigure 16 (From Reference 12) ... ............. .... 31
20 Southwell Plot of Data Obtained on an Aeroplane SparShowing Plasticity Effects (From Reference 11) ..... 32
21 Harmonic Components of Deflection of a Compressed
Column ............. ........................ 33
22 Lundquist--Type Plots for First and Second Modes of anAxially Compressed Column (From Reference 15) ...... .36
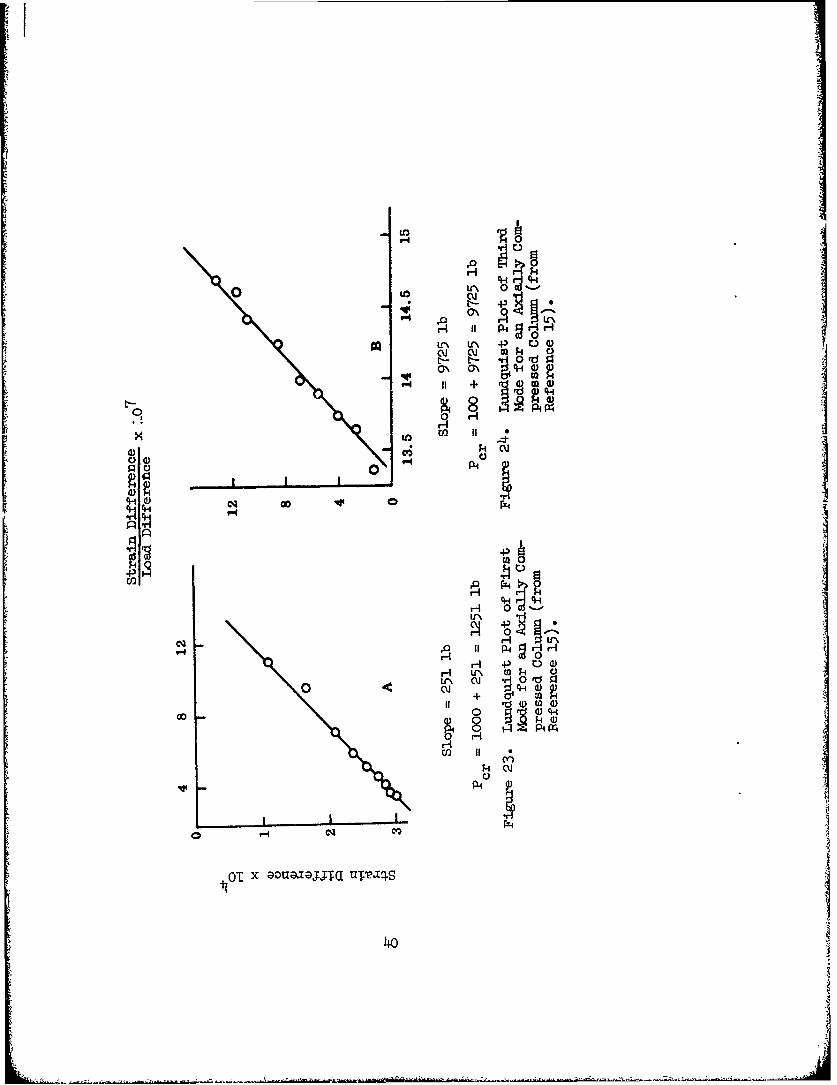
23 Lundquist Plot of First Mode for an Axially Compressed
Column (From Reference 15) ....... ............... 40
24 Lundquist Plot of Third Mode for an Axially Compressed
Column (From Reference 15) ............... 40
25 Correlation of Theoretical Curves With Results of
Bridget, Jerome, and Vosseller as Determined FromSouthwell Plots of C-mpressed Duralumin Angles (FromReference 17) ...... .. .. ...................... 42
26 Southwell Plot of Bridget, Jerome, and Vosseller's Dataon Compressed Angles (From Reference 17) ..... ....... 43
27 Panel Hinged on Three Sides Having an Initial DeviationFrom Flatness ..... .. ...................... .... 44
28 Determination of Cr- I Load From Gough and Cox Data
on Thin Strips Under Shear (From Reference 18) ..... 46
29 Rectangular Plate With Uniaxial In-plane Loading . . . 50
30 13quare 1anel Hinged on Four Sides as Considered byD o n n p l '( ... . . . . . . . .. . . . . . . . . . 5 4
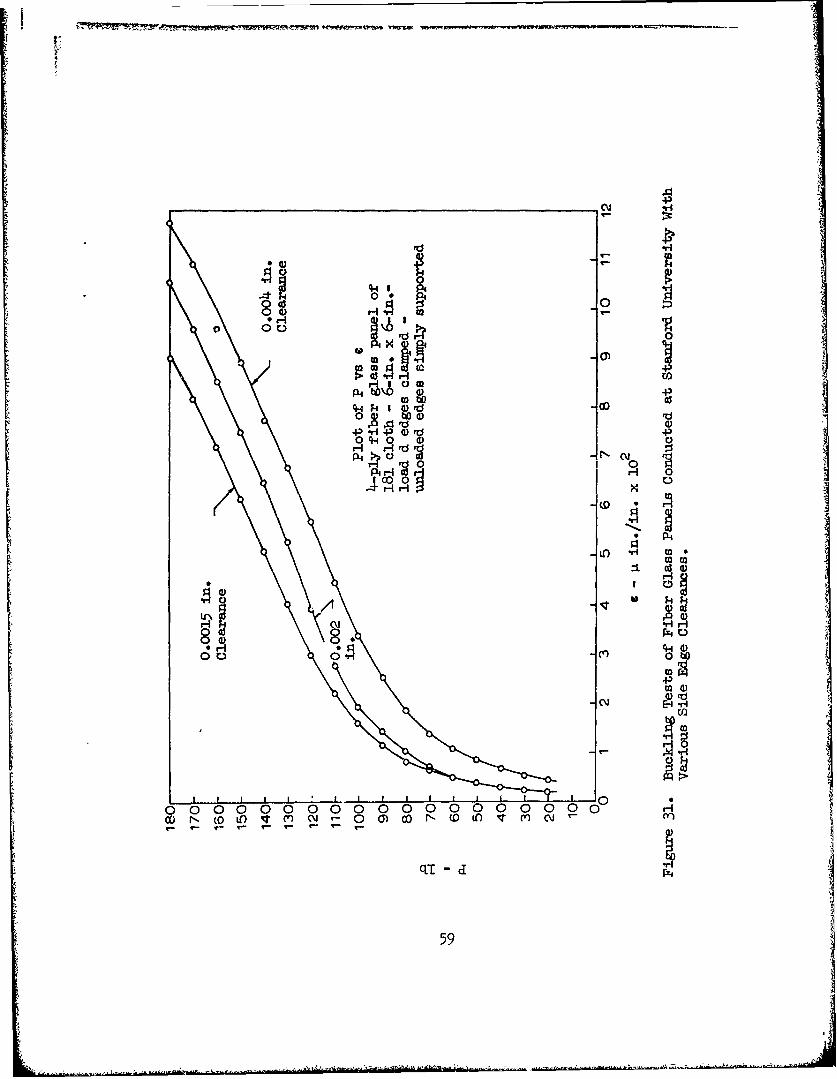
31 Buckling Tests of Fiberblas Panels Condilated at Stanford
Univcrsity With Various Side Edge Clearances ... ....... 59
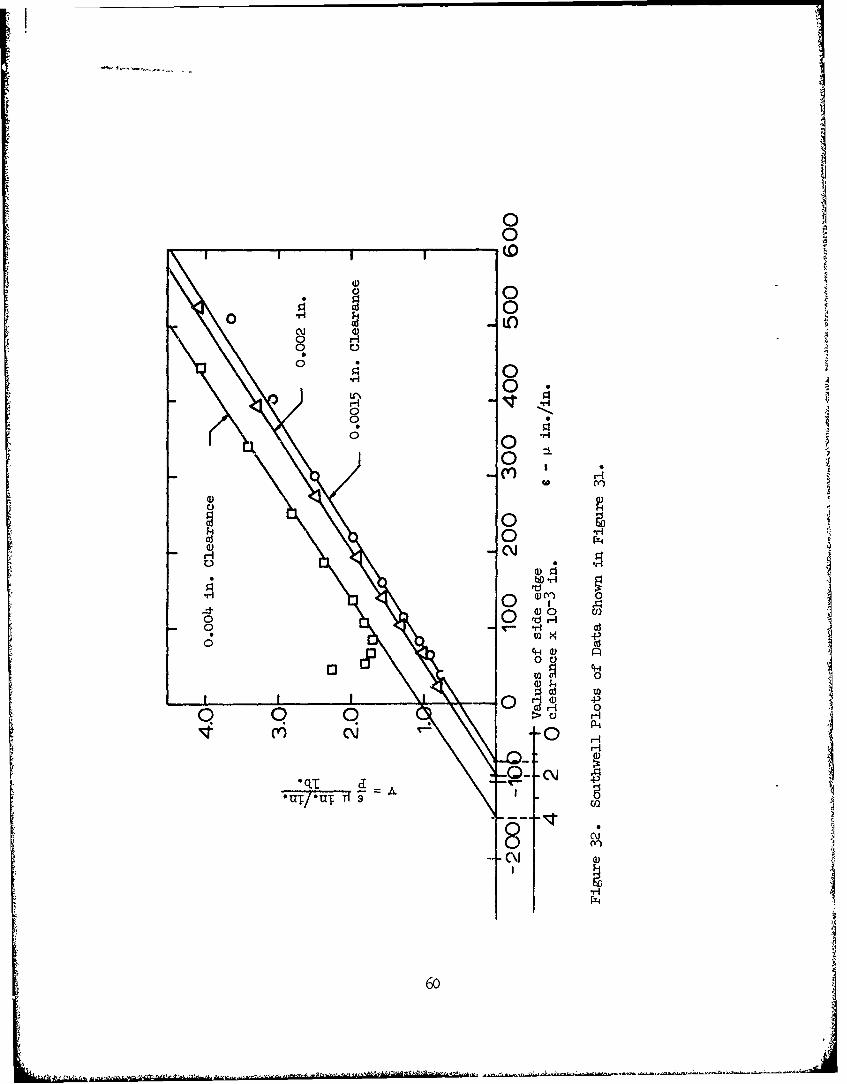
32 Southwell Plots of Data Shown in Figure 31 ... ....... 60
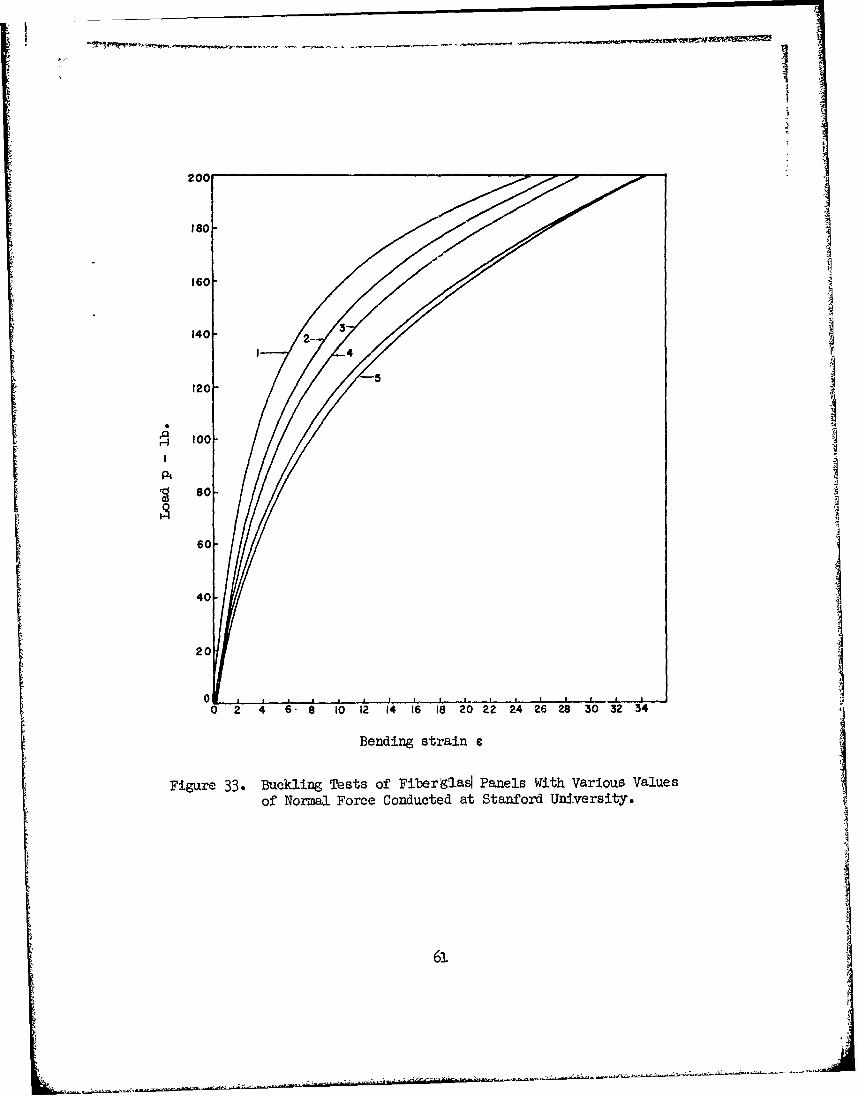
33 Buckling Tests of Fiberglas Panels With VariousValues of Normal Force Conducted at Stanford University 61
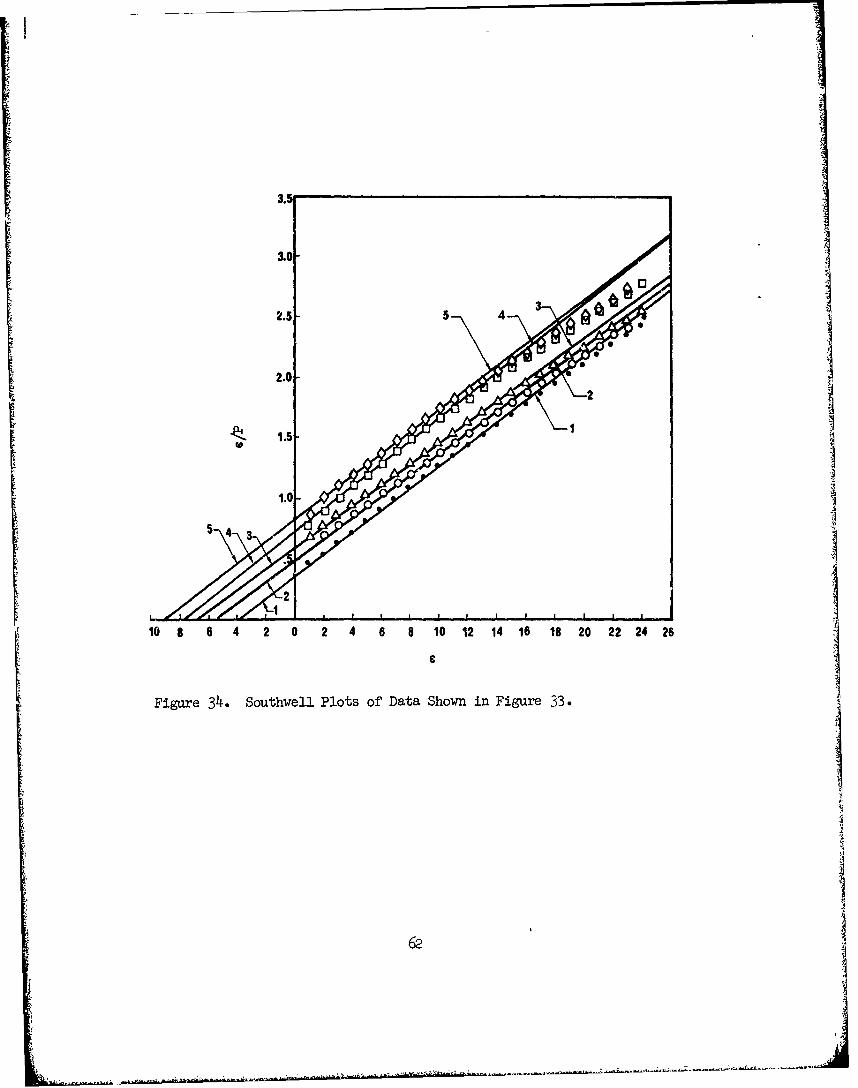
3' Southwell Plots of Data Shown in Figure 33 ... ....... 62
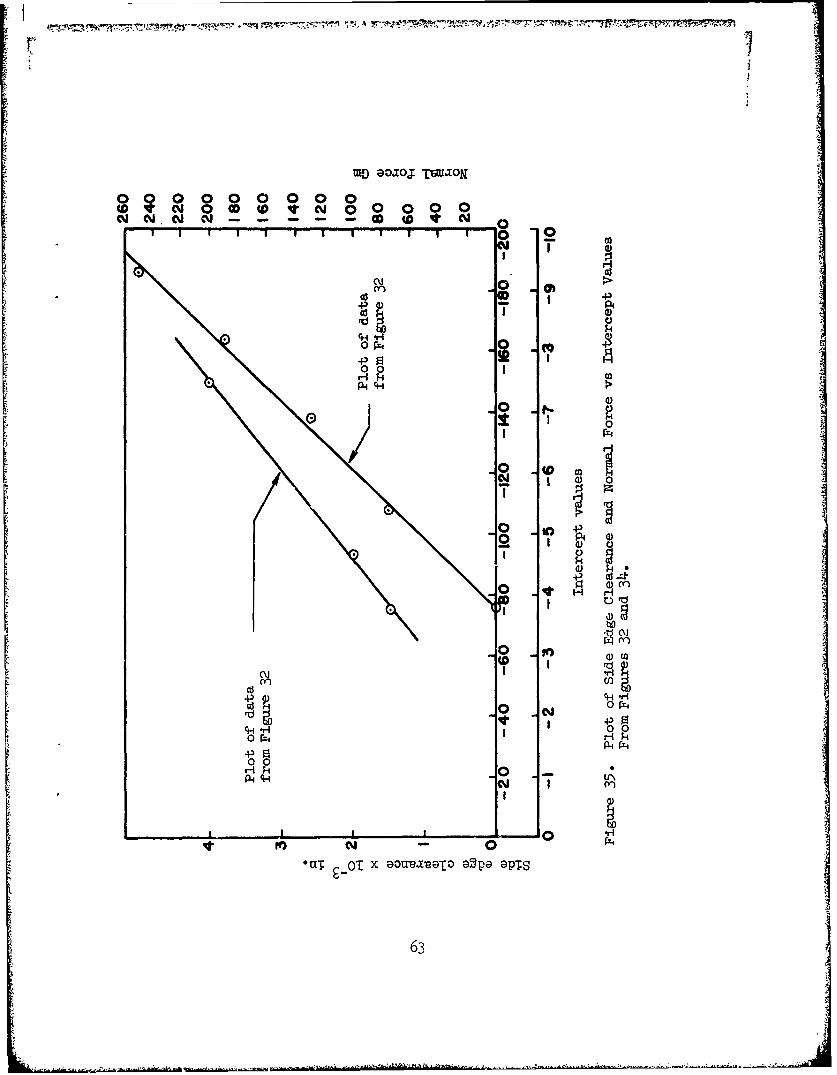
35 Plot of Side Edge Clearance and Normal Force vs Inter-cept Values From Figures 32 and 3)4 .... ...... . . 63
ix
LIST OF T,.USTRATIONS(Cont'd)
Figure Page
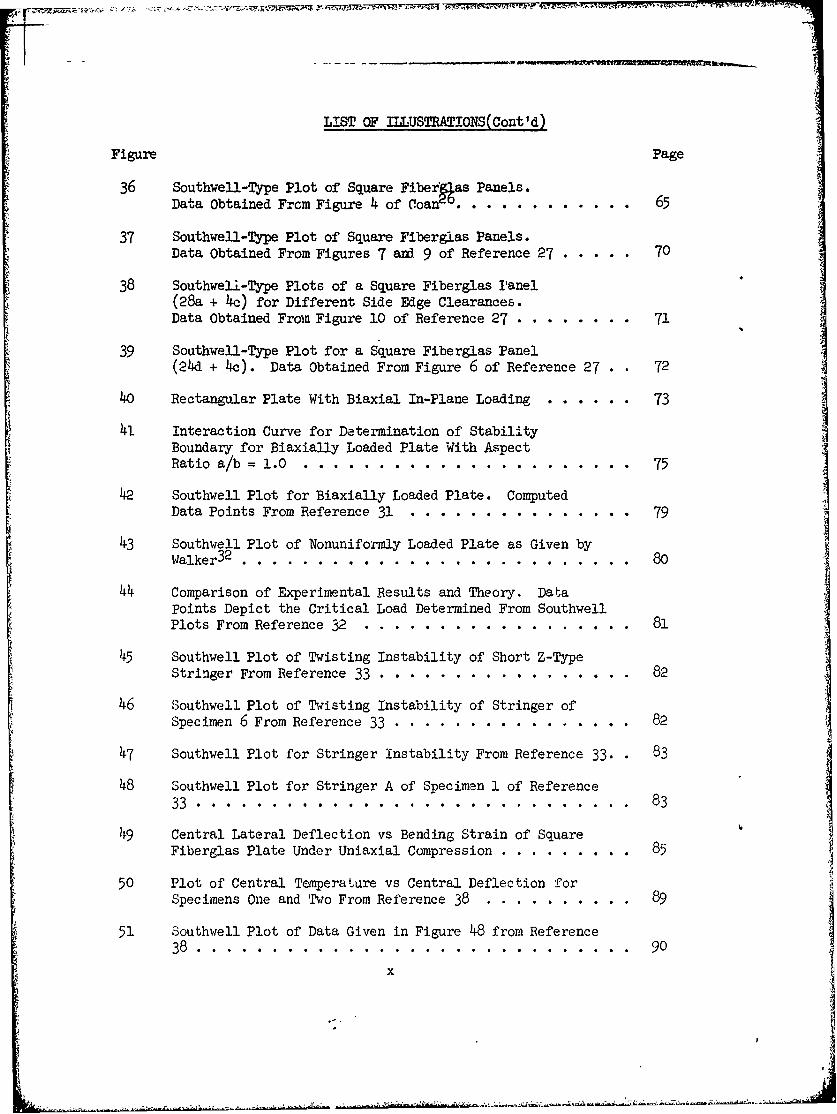
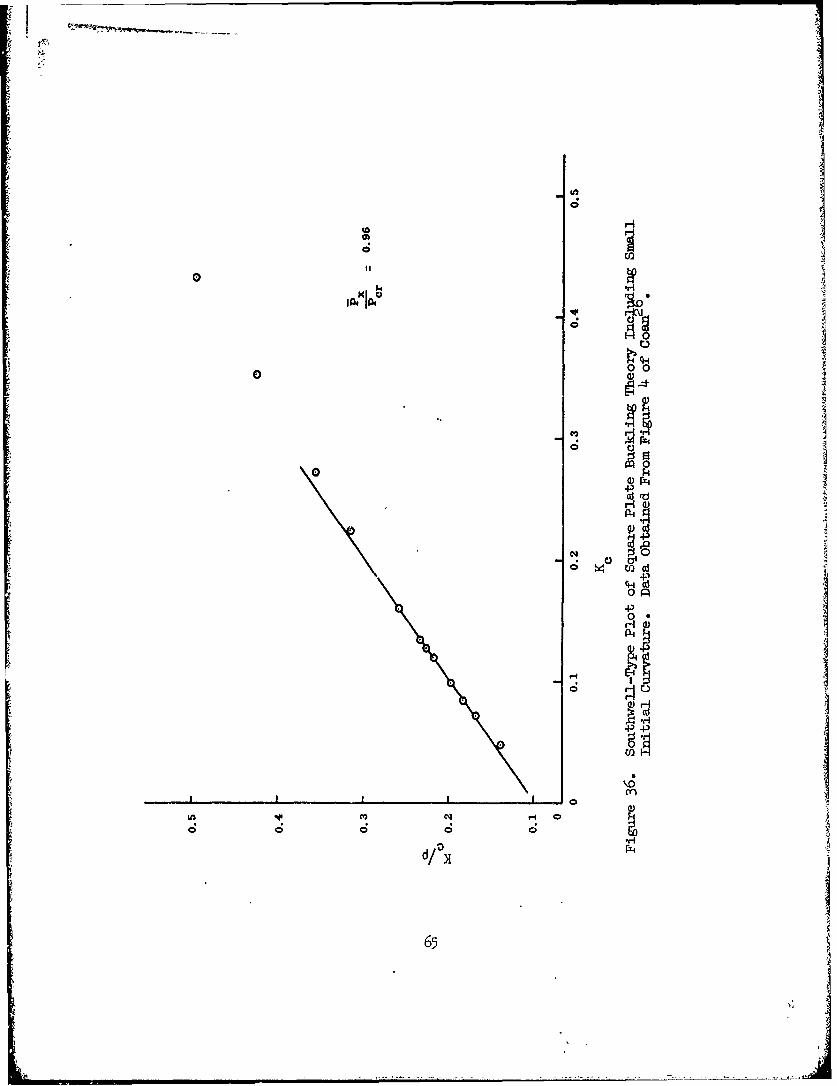
36 Southwell-Type Plot of Square Fiberas Panels.Data Obtained Frcm Figure 4 of Coan . . . . . . .. . . . . 65
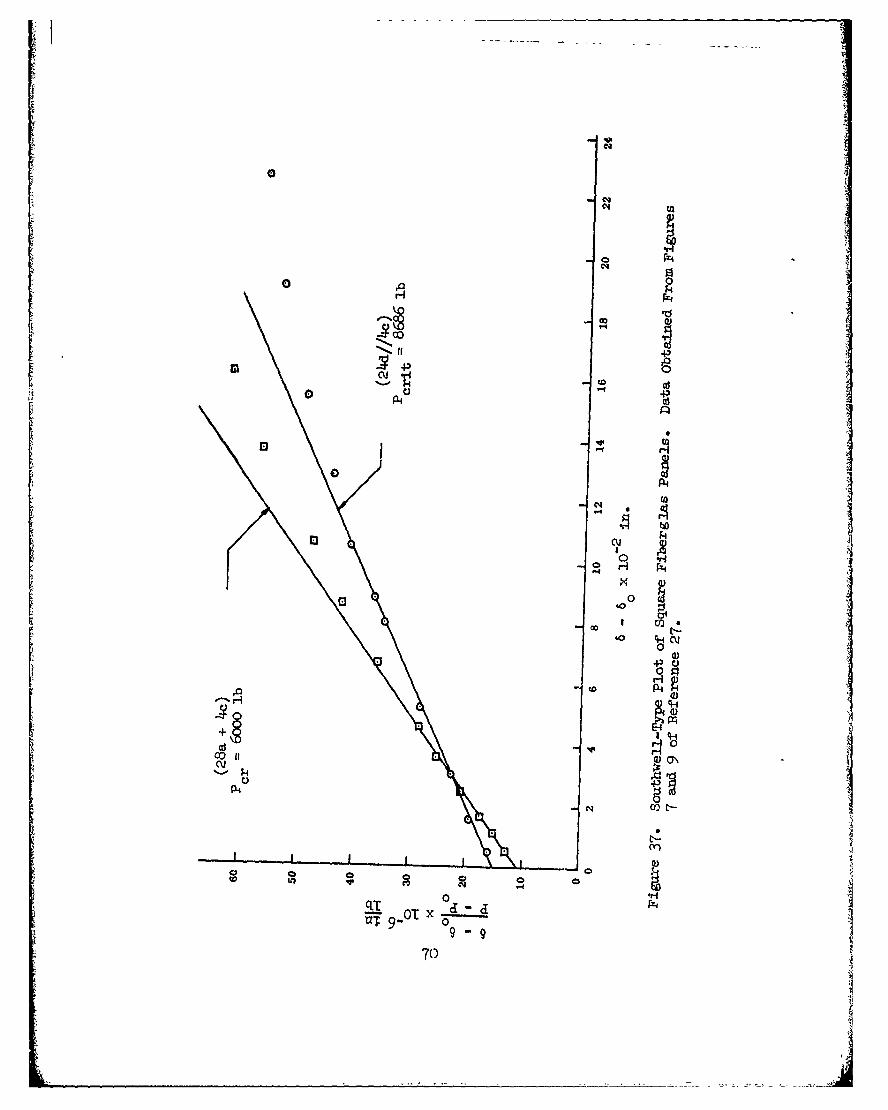
37 Southwell-Type Plot of Square Fiberglas Panels.Data Obtained From Figures 7 an3. 9 of Reference 27 . . . .. 70
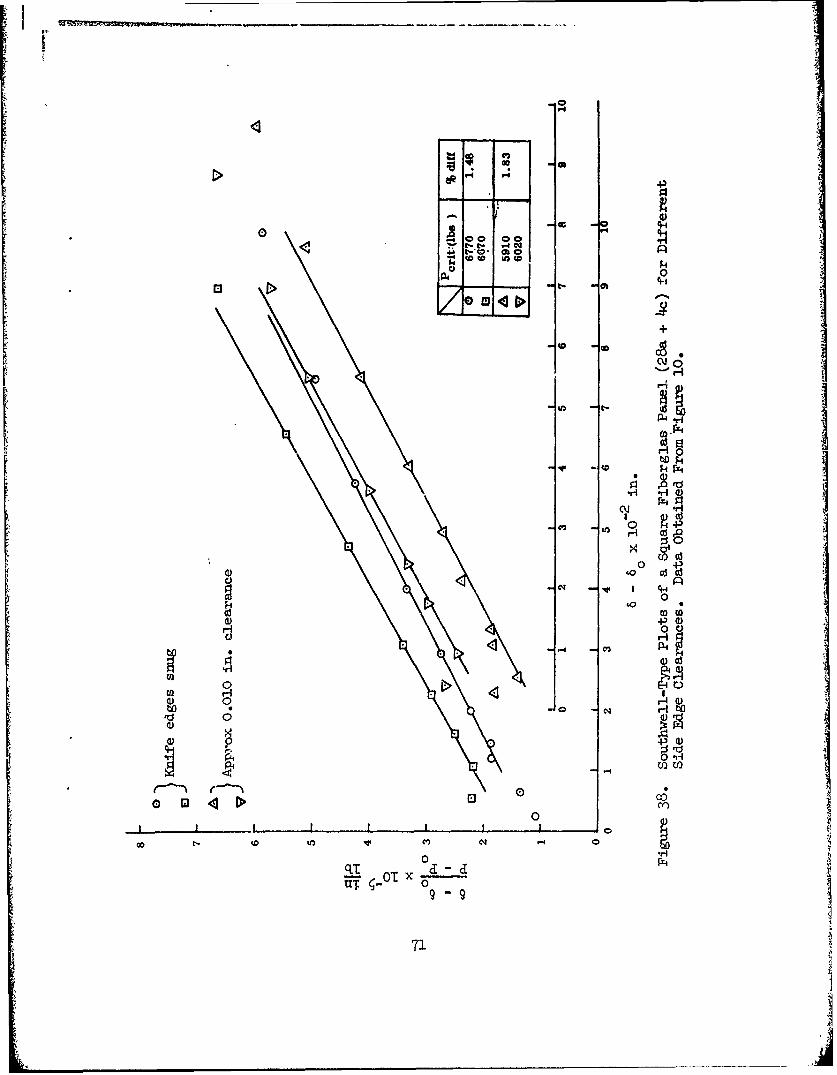
38 Southweli-Type Plots of a Square Fiberglas Ianel(28a + 4 c) for Different Side Edge Clearances.Data Obtained From Figure 10 of Reference 27 ........ .... 71
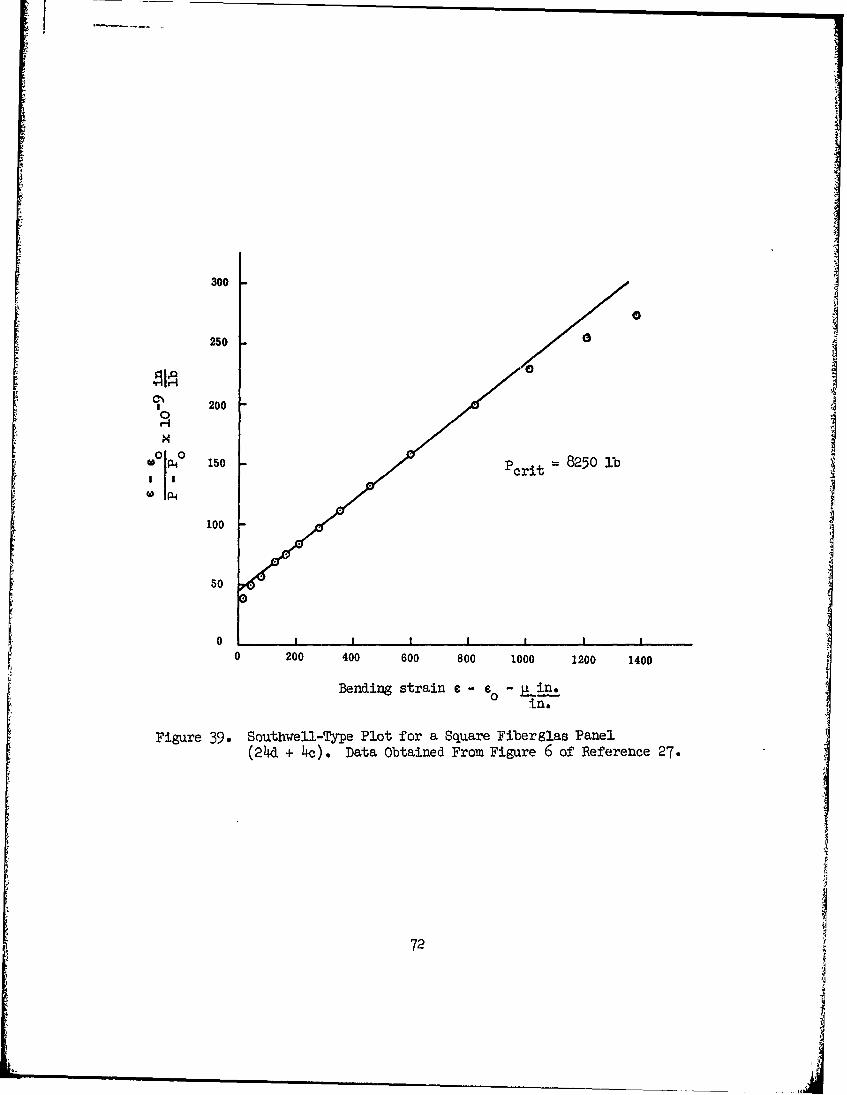
39 Soathwell-Type Plot for a Square Fiberglas Panel
(24d + 4c). Data Obtained From Figure 6 of Reference 27 72
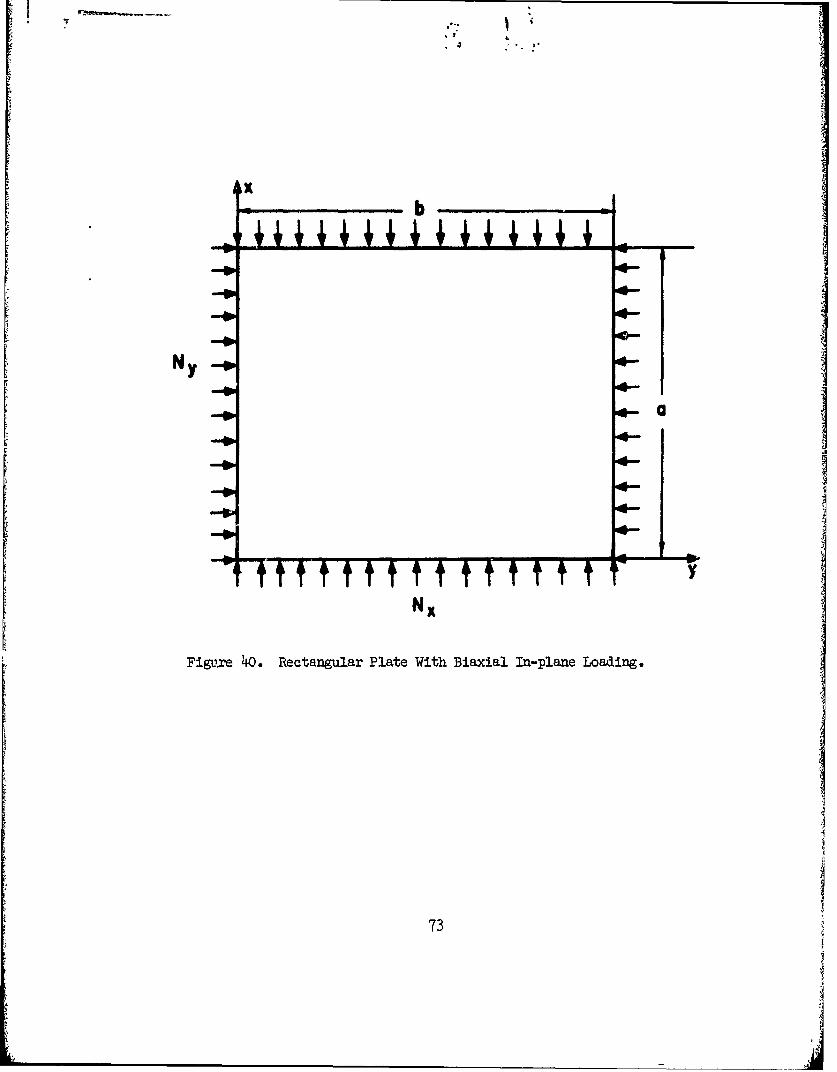
40 Rectangular Plate With Biaxial In-Plane Loading ......... 73
41 Interaction Curve for Determination of StabilityBoundary for Biaxially Loaded Plate With AspectRatio a/b = 1.0 . ..................... .75
42_ Southwell Plot for Biaxially Loaded Plate. ComputedData Points From Reference 31 ................ . . . 79
43 Southwell Plot of Nonuniformly Loaded Plate as Given by
Walker 32 . . . . . . . . . . . . . . . . . . . . . . .. . . . . . . . . . . . . .. 80
44 Comparison of Experimental Results and Theory. DataPoints Depict the Critical Load Determined From SouthwellPlots From Reference 32 ...... ................. .... 81
45 Southwell Plot of Twisting Instability of Short Z-TypeStringer From Reference 33 ....... ................ 82
46 Southwell Plot of Twisting Instability of Stringer ofSpecimen 6 From Reference 33 ...... ................ 82
47 Southwell Plot for Stringer Instability From Reference 33. • 83
48 Southwell Plot for Stringer A of Specimen 1 of Reference
33 . . . . . . . . . . . . . . . . . . . . . . . . . . . . . 83
49 Central Lateral Deflection vs Bending Strain of Square
Fiberglas Plate Under Uniaxial Compression .. ......... ... 85
50 Plot of Central Temperature vs Central Deflection forSpecimens One and Two From Reference 38 .. .......... .. 89
51 Southwell Plot of Data Given in Figure 48 from Reference38 . . . . . . . . . . . . . . . . . . . . . . . . . . . . . 90
xI
mro
LIST OF DSRATIONS(Coflt'j
Figure Page
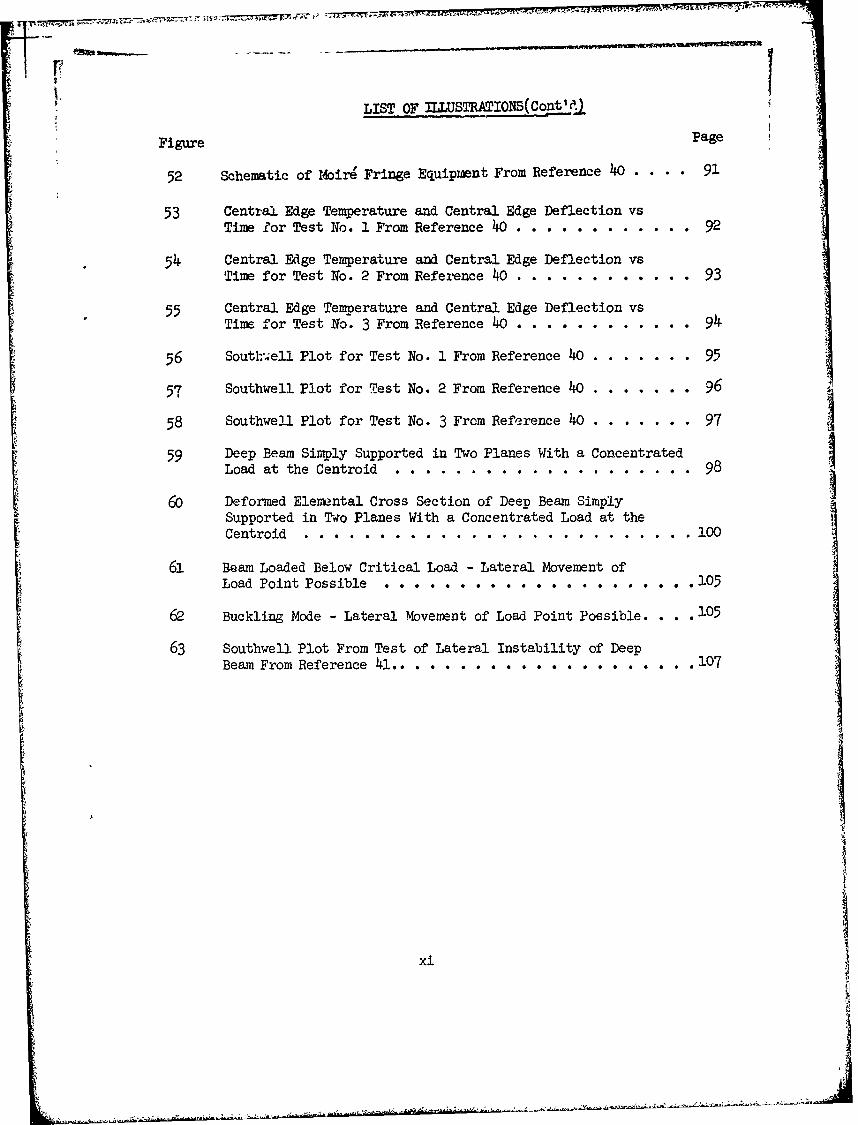
52 Schematic of Moire Fringe Equipment From Reference 40 . . . . 91
53 Central Edge Temperature and Central Edge Deflection vsTime for Test No. 1 From Reference 40 . . . . . . . . . . . . 92
54 Central Edge Temperature and Central Edge Deflection vsTime for Test No. 2 From Reference 40 . . . . . . . . . . . . 93
55 Central Edge Temperature and Central Edge Deflection vsTime for Test No. 3 From Reference 40 . . . . . ............. 94
56 South- ell Plot for Test No. 1 From Reference 40 ... ....... 95
57 Southwell Plot for Test No. 2 From Reference 40 . . . .. .. 96
58 Southwell Plot for Test No. 3 From Reference 40 ......... 97
59 Deep Beam Simply Supported in Two Planes With a ConcentratedLoad at the Centroid . .. .. .. .. .. .. .. .. . .. 98
60 Deformed Elemental Cross Section of Deep Beam Simply
Supported in Two Planes With a Concentrated Load at the
Centroid . . . . . . . . . ........ . ....................... 100
61 Beam Loaded Below Critical Load - Lateral Movement of
Load Point Possible .............. ...... 105
62 Buckling Mode - Lateral Movement of Load Point Possible .... 105
63 Southwell Plot From Test of Lateral Instability of DeepBeam From Reference 41. ............... . 107
xi
LIST OF TABLES
Table Page
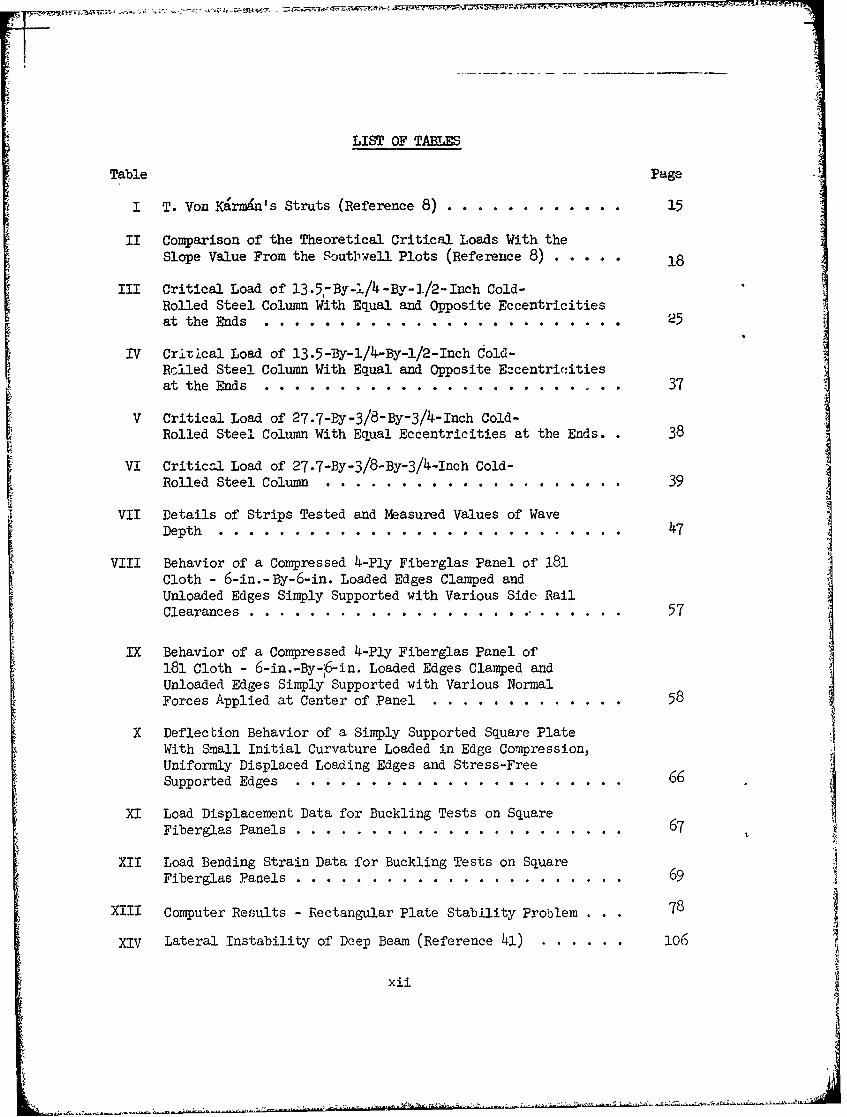
I T. Von Karmlns Struts (Reference 8) . ............. 15
II Comparison of the Theoretical Critical Loads With theSlope Value From the Soutbwell Plots (Reference 8) ..... 18
III Critical Load of 13.5-BY-1/4-By-1/2-Inch Cold-Rolled Steel Column With Equal and Opposite Eccentricitiesat the Ends ...... ...... ........................ 25
IV Critical Load of 13.5-By-1/4-By-i/2-Inch Cold-Roled Steel Column With Equal and Opposite Eccentricitiesat the Ends ....................... . 37
V Critical Load of 27.7-BY-3/8-By-3/4-Inch Cold-Rolled Steel Column With Equal Eccentricities at the Ends.. 38
VI Critical Load of 27.7-BY-3/8-By-3/4-Inch Cold-
Rolled Steel Column . .. .. .. .. .. .. .. .. . .. 39VII Details of Strips Tested and Measured Values of Wave
Depth .......................... .. 47
VIII Behavior of a Compressed 4-Ply Fiberglas Panel of 181Cloth - 6-in.-By-6-in. Loaded Edges Clamped andUnloaded Edges Simply Supported with Various Side RailClearances ......................... . ...... 57
IX Behavior of a Compressed 4-Ply Fiberglas Panel of
181 Cloth - 6-in.-By- 6-in. Loaded Edges Clamped andUnloaded Edges Simply Supported with Various NormalForces Applied at Center of Panel . . . . ............ 58
X Deflection Behavior of a Simply Supported Square PlateWith Small Initial Curvature Loaded in Edge Compression,Uniformly Displaced Loading Edges and Stress-FreeSupported Edges ....... .......................... 66
XI Load Displacement Data for Buckling Tests on SquareFiberglas Panels ...... .. .................... .... 67
XII Load Bending Strain Data for Buckling Tests on SquareFiberglas Panels ....... ...................... .... 69
XIII Computer Results - Rectangular Plate Stability Problem . . . 78
XIV Lateral Instability of Deep Beam (Reference 41) ... ..... 106
xii
LIST OF SYMMS
A general amplitude in elastic lateral deflection function for platemn
a length of side of plate
a, a constant equal to initial eccentricity
Bmn general amplitude in initial deflection function for plate
b length of side of plate
D flexural stiffness Et3 /12(1-)
d displacement
E Young's modulus
G shear modulus = E/2(l+p)
H sum of the normal forces
I second moment of x-section about appropriate axis
J polar second moment
K A constant defining initial imperfection shape for thermallybuckled plate
L length
m a number, 1, 2) 3, etc.
N load per unit length in direction xx
Nx critical value of Ncr
Nload per unit length in direction y
N shear force per unit lengthxy
n a number, 1, 2, 3, etc.
P actual load: P r = critical instability load
P nth critical loadn
P an initial value of loadi
q normal force per unit area on plate
qo an equivalent value of q
xiii
~I
-° -!-
LJBT OF SYMMOS (Cont'd)
r radius or radial coordinate
R applied side load to strut
t thickness or t = time in seconds
T temperature
Tcrit critical value of temperature
U airy strebs function for circular plate
v ratio of 6/P.
assumed buckle shape
w ' initial deformation
W a general displacement amplitude
Wo an initial value of W
W an initial value of W0
W displacement amplitude of the n harmonic~n
, n an initial value of W
x a displacement along member
coordinate directions
) }amplitude coefficients in displacementfoundation constant for beam on elastic foundation
f
the effective initial angle of rotation (deep beam).
ya constant = 3(1-p 1P) / 8 t 2
6 displacement at a reference station = (Wn W ,)
6 an initial value of 6 n-li
strain
'IT thermal strainxiv
LIST OF SYMBOLS (Cont'd)
11Poisson's ratio
angle of rotation - deep beam
a membrane stress in radial directionr
acr critical compressive stress
1T constant
t
xv
The bubject of elastic stability ts more than 200 years old. From thescientific point of view it begsn, in 1744,when Leonard EulerA made the
now classic analysis of the b'-navior of an initially straight, perfectlyelastic, centrally comp.essed strut. Despite his analytical achievement,
there is little doubt that in the century which followed, practicingengineers still had to rely upon experience and empiricism born in experi-mentation.
There is no doubt, however, that researchers who were active in hefield studied Euler's work very thoroughly. Indeed, Hodgk nson, a foremostexperimentalist, remarked in 1842 with reference to Euler:
"It appeared from the resea'rhes of this great analyst, that a pillar
of any given dimensions and description of material required a certainweight to bend it, even in the slightest degree; and with less than
this weight it would not be bent at all. L.agrange, in an elaborateessay in the same work, arrives at the s.ime conclusion. The theoryas deduced from this conclusion is ver7 beautiful, and oisson'sexposition of it, in his Mecanique, 2nd edition, vol iy will wellrepay the labour of a perusal.
I have many times sought, experimentally, with great care for theweight producing incipient flexure, according to the theory of Fuler;but have hitherto been unsuccessful. So far as I can see, flexure
commences with weights far below those with which pillars are usuallyloaded in practice. It seems to be produced by weights much smallerthan cre sufficient to render it capable of being measured."
At the time that Hodgkinson made this remark a large quantity of experimentaldata was being obtained by many workers. These r'perimental data were,however, at variance with the predictions of Euler, and analysts thus cameto regard his theory as incomplete. Now analysis according to the (assictheory indicates that struts of the type already described will remain
straight until a certain critical load level is reached; then the strutsmay suddenly bend into the form of a single bow, a shape which will omaintained with increasing load although the amplitude of the deformation
will increase.
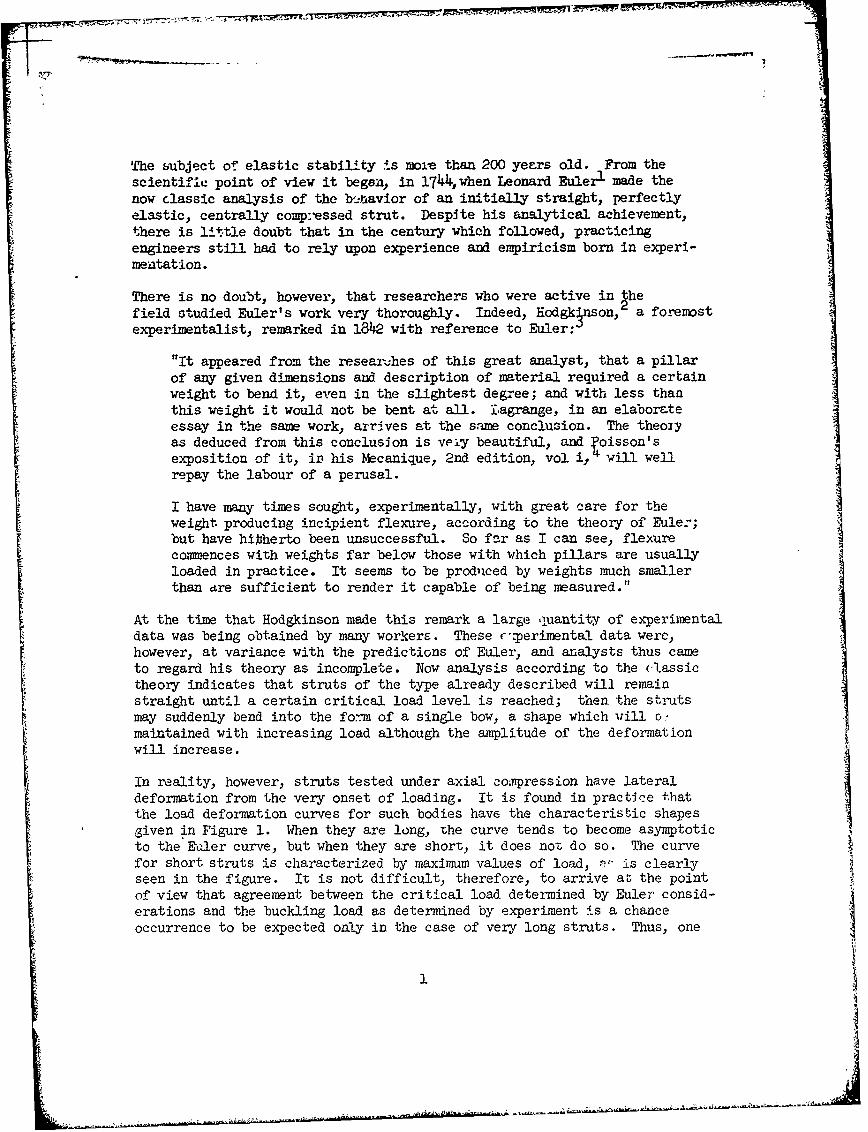
In reality, however, struts tested under axial compression have lateraldeformation from the very onset of loading. It is found in practice thatthe load deformation curves for such bodies have the characteristic shapesgiven in Figure 1. When they are long, the curve tends to become asymptoticto the Ealer curve, but when they are short, it does not do so. The curvefor short struts is characterized by maximum values of load, P is clearlyseen in the figure. It is not difficult. therefore, to arrive al the pointof view that agreement between the critical load determined by Euler consid-erations and the buckling load as determined by experiment is a chance
occurrence to be expected only in the case of very long struts. Thus, one
1
ii
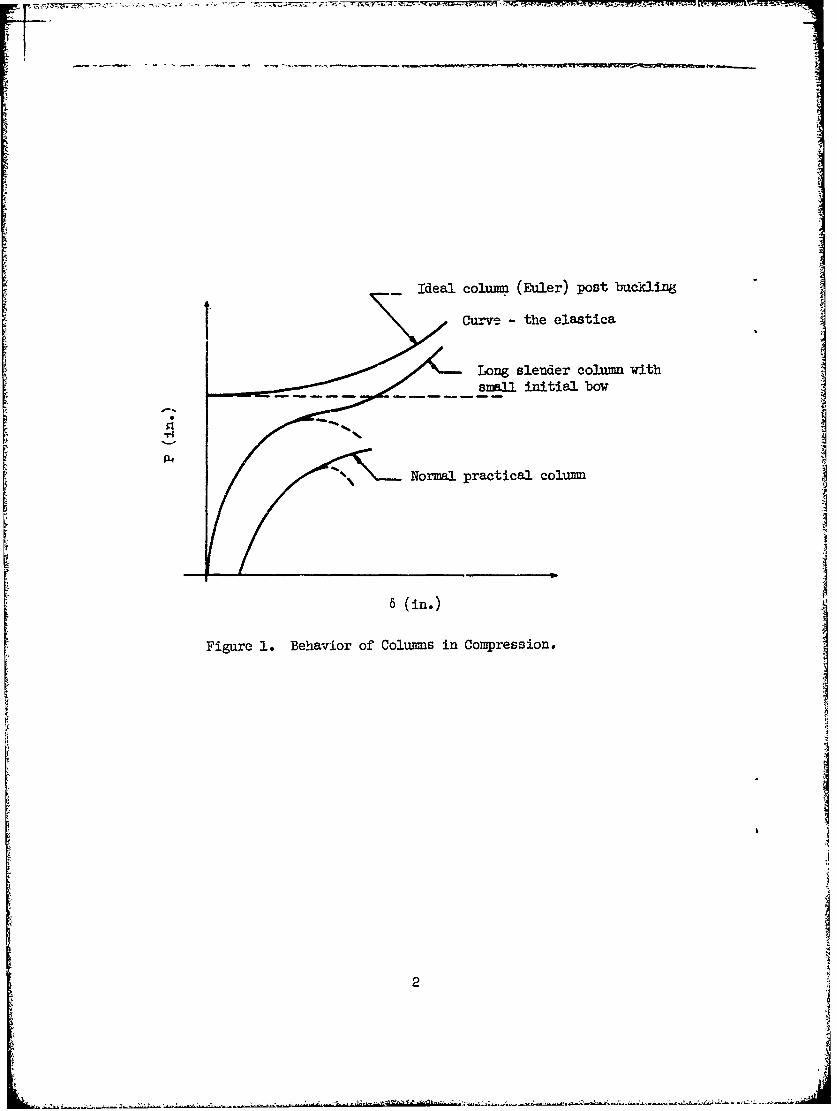
Ideal column (Euler) post buckling
Curve - the elastics
Long slender column withsmall initial bow
Normal practical column
S(in.)
Figure 1. Beha-vior of Columns in Compression.
is forced to ask the question: When experimental observations give curvesof the type presented in Figure 1 and the critical load is never attained,can any valid comparison of theory and experiment be made?
The first researcbers to prcvide a substantial answer to this question wereAyrton and Perry.5 in 1886 these two investigators published an instructivepaper on struts. It is interesting tc note that when they performed this
.ork, the situation with regard to knowledge on this fundamental questionwas such that they commentel: "We think we are right in saying that nosubject connected "with the strength of structures is at present regardedas being in a more vagae and unscientific state than the subject of whichwe have undertaken the study".
As a result of their study, Ayrton and Per& were among the first torealize that for a complete theory it was essential to introduce imper-fections of fcrm and loading. Their o.m words express this particularpoint and their manner of dealing with it: "The conclusion at which wehave arrived is, then, that any want of axiality in placing the load, or
want of straightness in the unloaded strut, or want of homogeneity in thematerial may be allowed for by a term C such that it may be taken as theinitial deflection of a homogeneous, carefully loaded strut, and then,
y 1 = C (1)1 - 4L P
where
Yl = the ordiuate of the strut center line in the displacedconfiguration
E = Young' s modulus
I = second moment of cross-sectional area
L = pin center length
P = axial load ."
From this expression, they deduced that the measured deflection of themidpoint from its initial value was given by
6C _ P (2)
F,- P
where P was the end load and P, was Euler load.
Equation (2) can be written as
1 1' 1 lP.1
if we choose new variables,
x 1andyP
then we see that equation (3) is a linear equation in these variables. Thus
a plot of1 1 C
and lis a straight line whose slope is
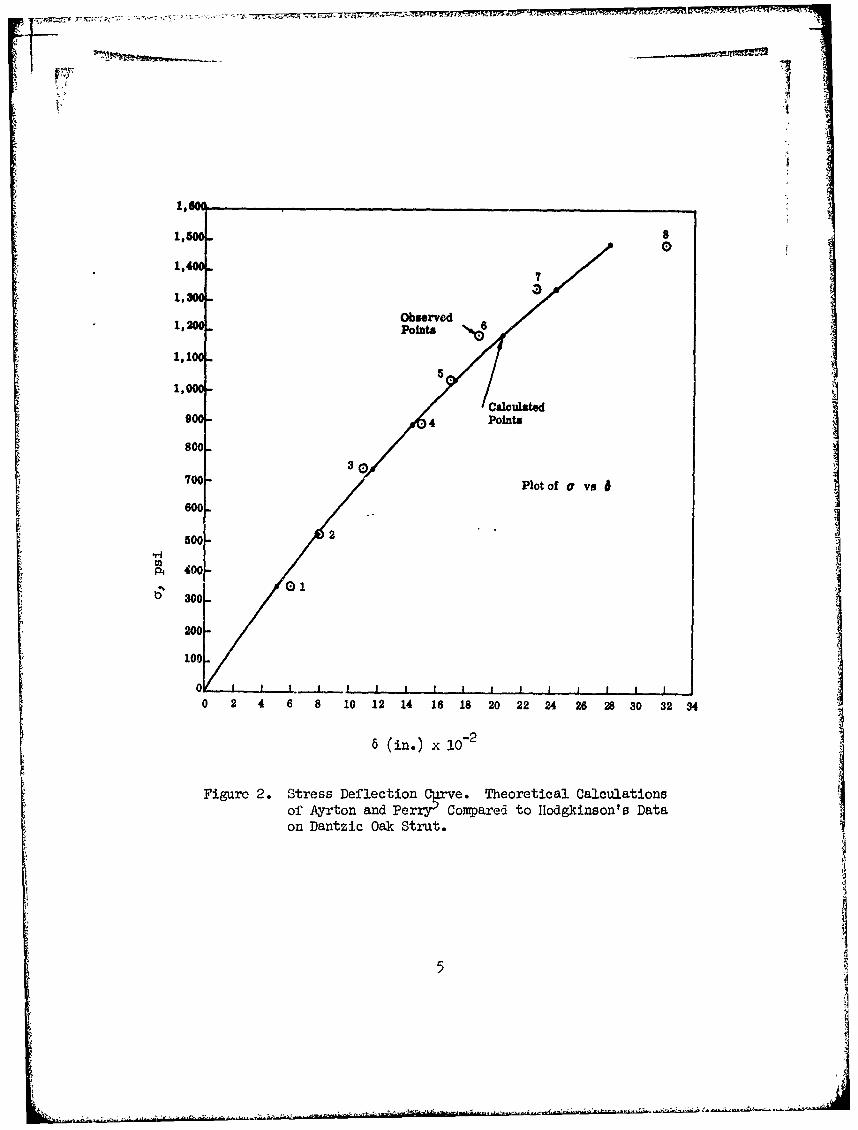
This analytical deduction was verified from tests on Dantzic OaK and wrought
iron. The appropriate data are given in Figures 2 to 5. The plots of
6 P
are seen to be straight lines. Ayrton and Perry's result of equation (2)can also be expressed as
Pcb r -6= C = effective initial deflection (4)
Thus, we may choose a new variable x, such that
8
P
Hence, equation (4) may be written as
P,x - 6 = C = constant (5)
This is a linear equation in x and 6. The inverse of the slope of the line
is clearly the Euler critical load, and the intercept w ith 4.he 6 axis is the
effective initial deflection. This is shown in Figure. 6 and 7.
It is strange that this equation, which gives a very elegant method of
correlating theory and practice, was virtually ignored. Indeed, almost
half a century passed before the method was used to any extent. Then it
was indepegdently rediscovered and presented in the second form by R. V.
Southwell, who published his work in the Proceedings of the Royal Society.
Today the method of presentation is always referred to as a Southwell plot.
Since it is this latter work to which all reference is made, the theoretical
justification for the formula given in equation (2) will be derived in the
Southwell manner.
Consider the strut shown in Figure 8. Let y0 denote the initial deflection,
4
1,60 1, 8
1.500
1,400- 7
0
1,0 ObservedPoints
1,100
1,00
900 CalculatedS900 - / 4 Points
800-
70- Plot of a va
600
25001
P, 400-
200
100
0 I I I ., __! I I I .I I I0 2 4 6 8 10 12 14 16 18 20 22 24 26 28 30 32 34
8 (in.) x iao
Figure 2. Stress Deflection Cprve. Theoretical Calculations
of Ayrton and Perry" Compared to Hodgkinson's Dataon Dantzic Oak Strut.
40
0 C0
-*(Yo to
t4
- 0
P4. 4
OT0
0'00
0
(NJ
-- t~
0 0 1
0
r4 4i8 -:
J\7 -
H j
- - .,, ~ - ro-C l 9S. t, .- -
o 0
*0 r4
"0 u0
> to~
0 Hco
04 C) 0
00
3105
UN
0 N0
OT 0/
to
cooi
x 0 ,
H -HN W
'.4 H-
eq H
U C)
00
'0 4-)
0
C90
44-
100
Cd
eql 0
00 00 4-)00
0o Lo o f 0
900 /
90
001
CD C'~L
H- U, 0
~V C) t-
P-1 P-1
'4-)
0
4-)
eqC~
H O 1
r44
00
100
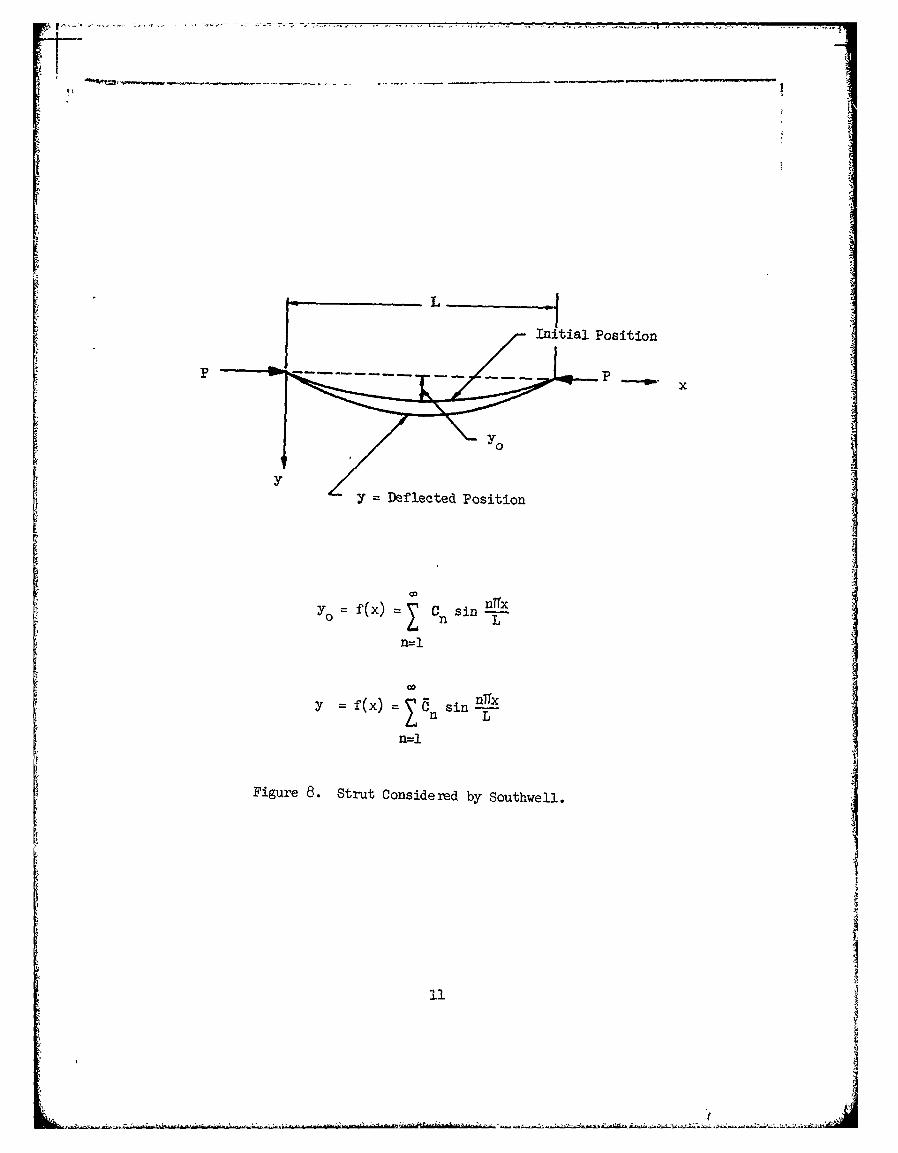
L Initial Position
P P x
Y Deflected Position
CO nrrxYO f(XY. C,, sin2
y =f(x)Xc sin nTx
n=l
Figure 8. Strut Considered by Southwell.
llS
iiJ
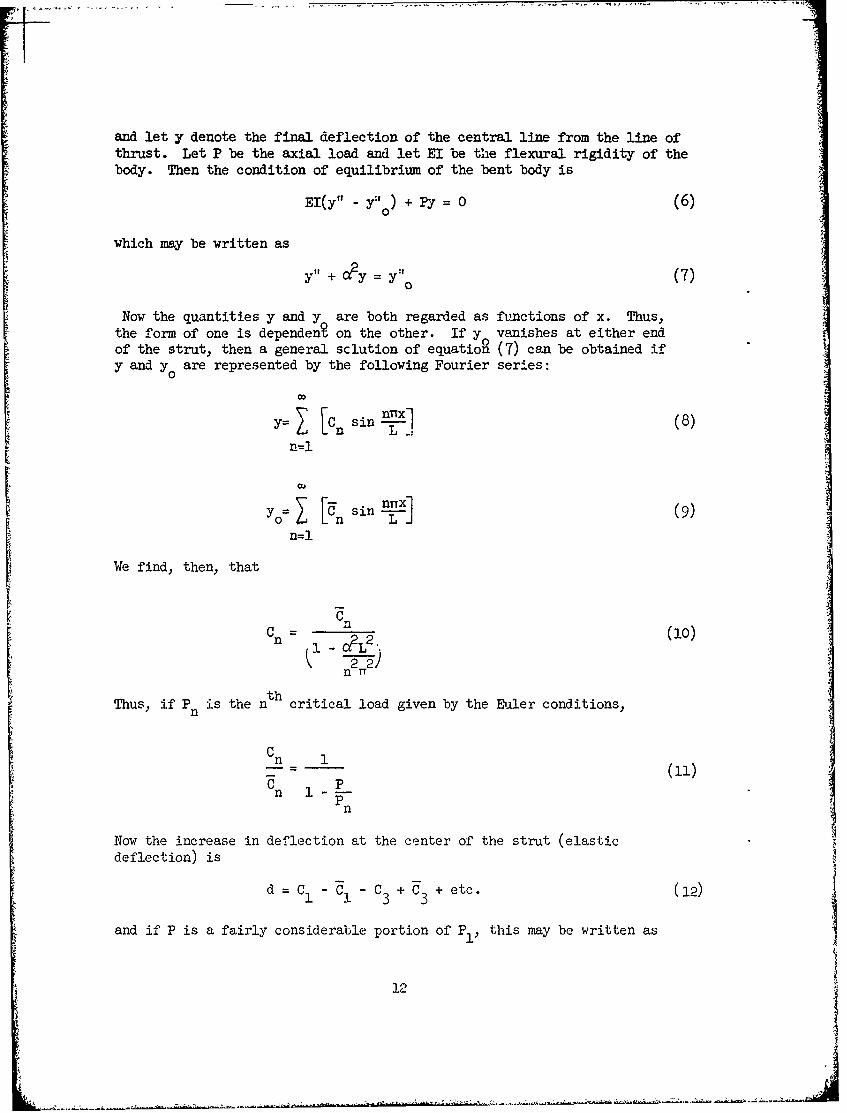
and let y denote the final deflection of the central line from the line ofthrust. Let P be the axial load and let EI be the flexural rigidity of thebody. Then the condition of equilibrium of the bent body is
EI(y" - y 0) + -= 0 (6)
which may be written as
y,, + a2y = y,, (7)
Now the quantities y and y are both regarded as functions of x. Thus,the form of one is dependen on the other. If y vanishes at either endof the strut, then a general sclution of equation (7) can be obtained ify and y are represented by the following Fourier series:
= I' 1C sin 371(8)LL L,
n=l
Yo= I rn sinIn -
n=l }
We find, then, that
Cn (10)
n ur
th
Thus, if P is the n critical load given by the Euler conditions,
C n
Cn 1
P
n
Now the increase in deflection at the center of the strut (elasticdeflection) is
d = C - I - C3 + C3 + etc. (12)
and if P is a fairly considerable portion of Pl. this may be written as
12
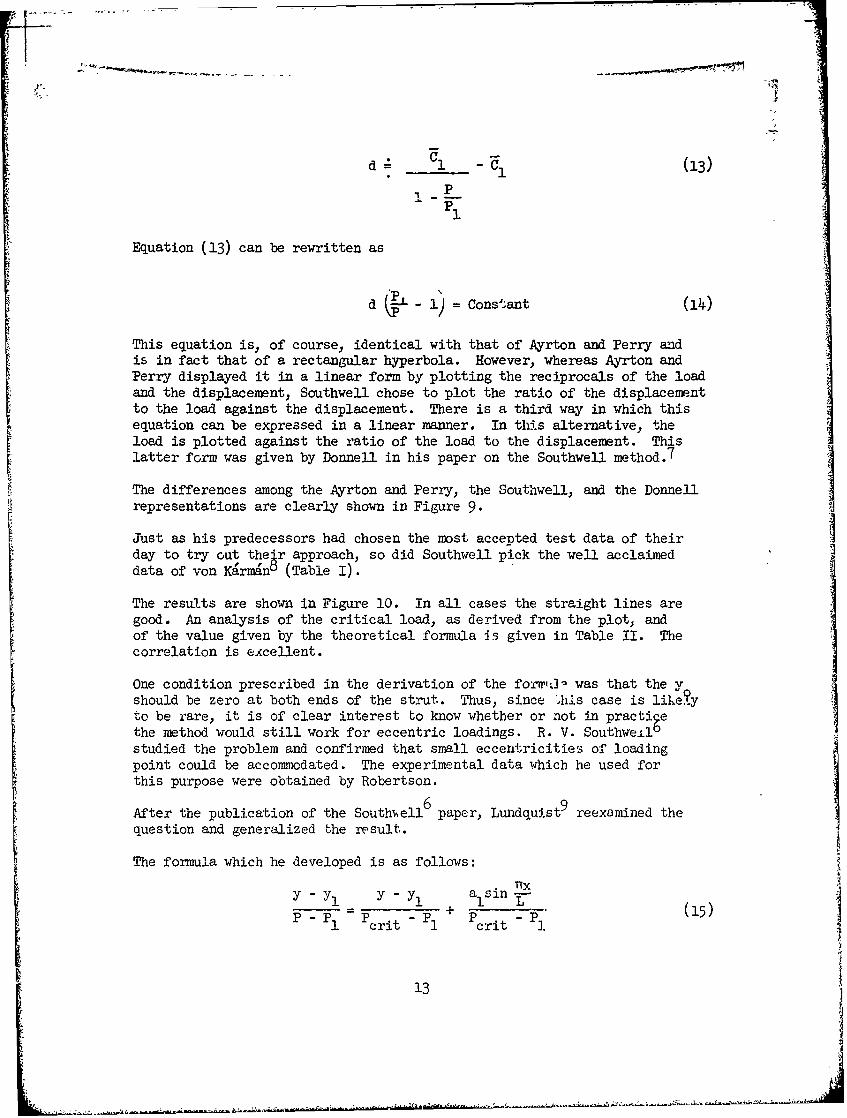
d- (13)
PP1
Equation (13) can be rewritten as
d - i) = Constant (14)
This equation is, of course, identical with that of Ayrton and Perry andis in fact that of a rectangular hyperbola. However, whereas Ayrton andPerry displayed it in a linear form by plotting the reciprocals of the loadand the displacement, Southwell chose to plot the ratio of the displacementto the load against the displacement. There is a third way in which thisequation can be expressed in a linear manner. In this alternative, theload is plotted against the ratio of the load to the displacement. Thislatter form was given by Donnell in his paper on the Southwell method.7
The differences among the Ayrton and Perry, the Southwell, and the Donnellrepresentations are clearly shown in Figure 9.
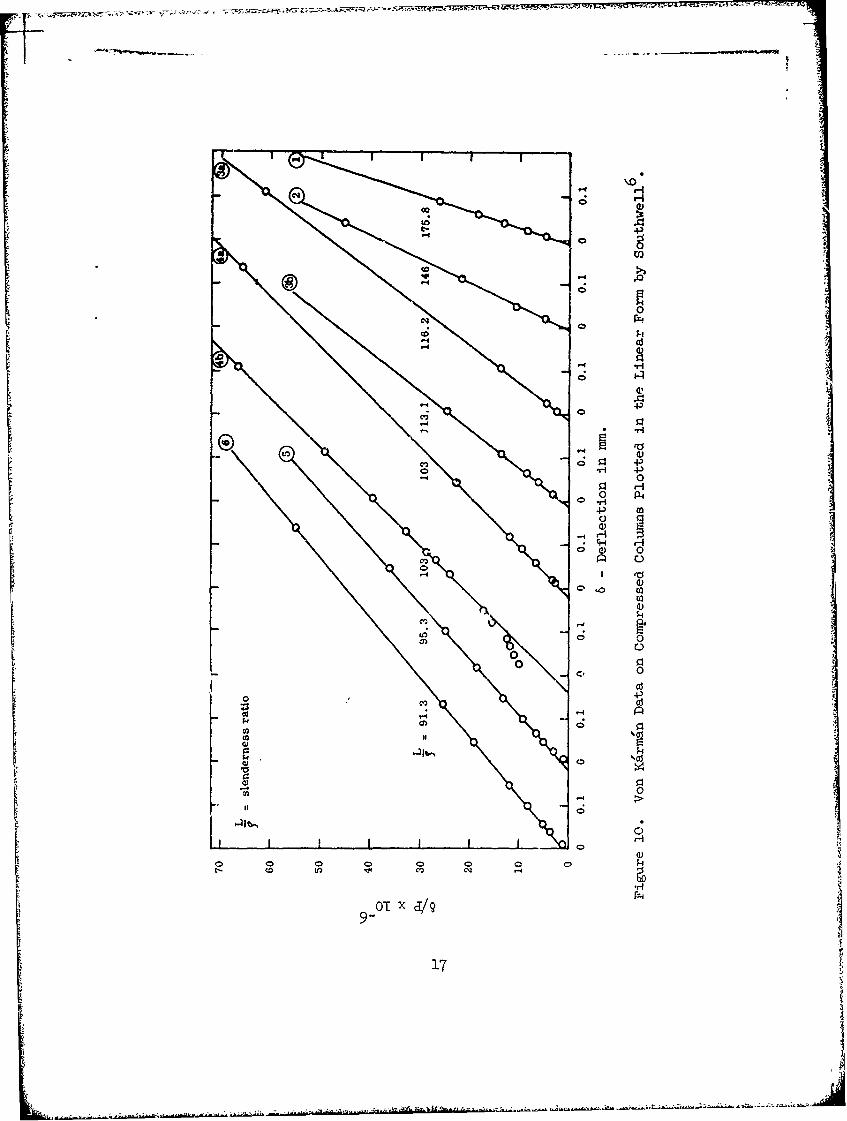
Just as his predecessors had chosen the most accepted test data of theirday to try oat their approach, so did Southwell pick the well acclaimeddata of von K~rman O (Table I).
The results are shown in Figure 10. In all cases the straight lines aregood. An analysis of the critical load, as derived from the plot, andof the value given by the theoretical formula is given in Table II. Thecorrelation is excellent.
One condition prescribed in the derivation of the forw, was that the yshould be zero at both ends of the strut. Thus, since 'ls case is likelyto be rare, it is of clear interest to know whether or not in practiethe method would still work for eccentric loadings. R. V. Southwellstudied the problem and confirmed that small eccentricitie s of loadingpoint could be accommodated. The experimental data which he used forthis purpose were obtained by Robertson.
After the publication of the Southuell 6 paper, Lundquist9 reexamined thequestion and generalized the result.
The formula which he developed is as follows:
Y Yl Y - yl a sin r--
P- PI Pcrit P 1 Pcrit _ p.
13
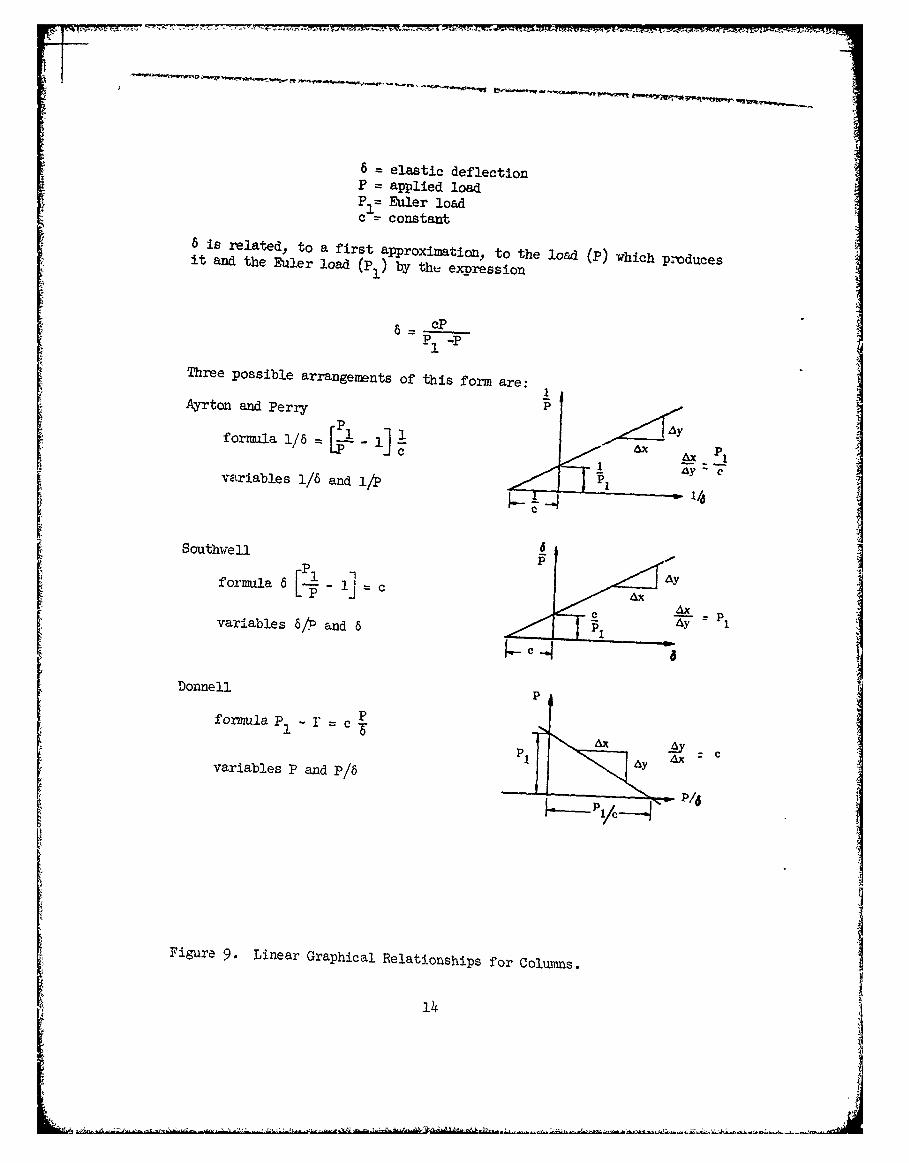
6 elastic deflectionP = applied load
PI = Euler loadc - constant
6 is related, to a first approximation, to the load (P) which producesit and the Euler load (P1) by the expression
6= cP
P1 PThree possible arrangements of this form are: 1Ayrton and Perry P
formula 1/6 =A
Southwell /an1/
c c AX P
variables 6/P and 6 TP_ I__ ___
Donnell P
formula P 1 A cPvariables 6p and /6 il A
6 A6
III
Figure 9. Linear Graphical Relationships for Columns.
14
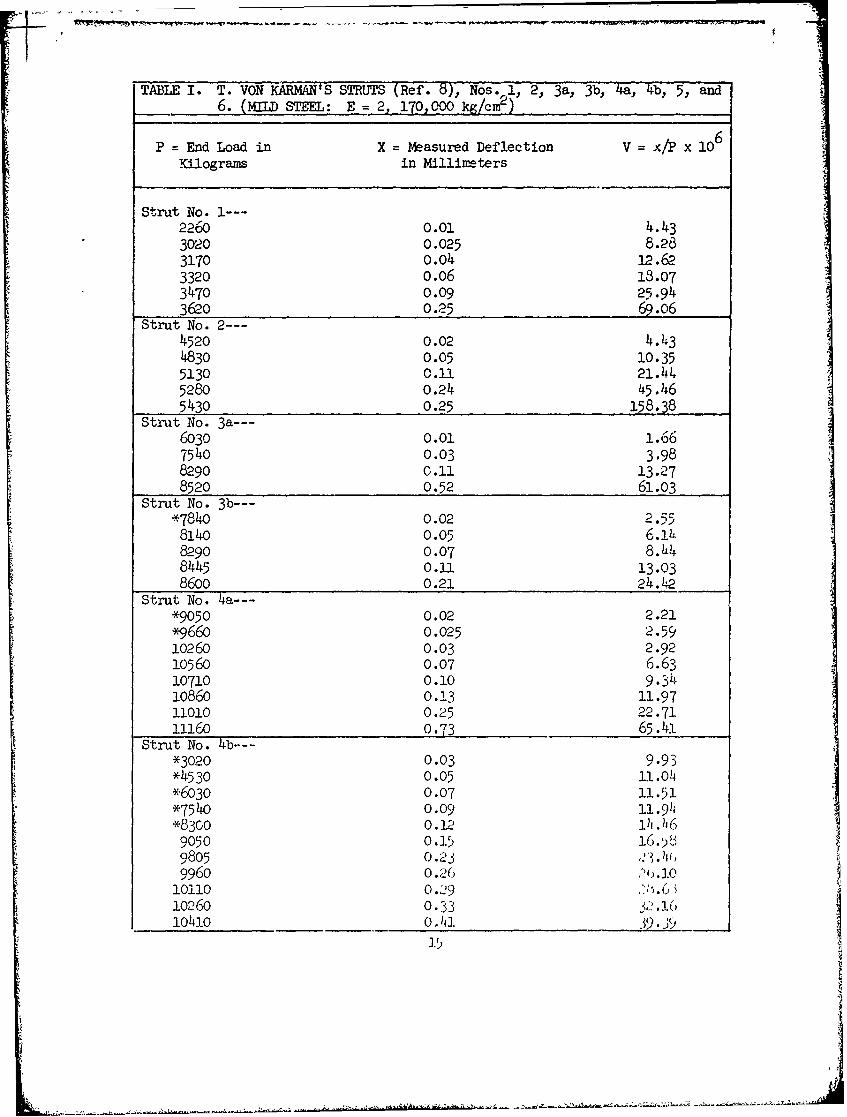
TABLE I. T. VON KARMAN'S STRUTS (Ref. 8), Nos. 1, 2, 3a, 3b, 4a, 4b, 5, and6. M STEEL: E =2, 170,000 kg/ciTP)
P = End Load in X = Measured Deflection V = X!P x 106
Kilograms in Millimeters
Strut No. 1---2260 0.01 4.433020 0.025 8.283170 0.04 12.623320 0.06 18.073470 0.09 25.943620 0.25 69.06
Strut No. 2---
4520 0.02 4.434830 0.05 10.355130 0.11 21.445280 0.24 45.465430 0.25 158.38
Strut No. 3a---6030 0.01 1.667540 0.03 3,988290 0.11 13.278520 0.52 61.03
Strut No. 3b---*7840 0.02 2.55
8140 0.05 6.!1829O 0.07 8. IL48445 0.11 13.038600 0.21 24.42
Strut No. 4a---*9050 0.02 2.21*9660 0.025 2.5910260 0.03 2.9210560 0.07 6.6310710 0.10 9.3410860 0.13 11.9711010 0.25 22.711116o 0.73 65.41L
Strut No. 4b---*3020 0.03 9.93*4530 0.05 ii.o4*6030 0.07 11.51*7540 0.09 11.9;*8300 0.12 14.1j6
9050 0.15 16.589805 0.23 ,Y. IW,9960 0.26 .. 0
10110 0.2910260 0.33 2. 1610410 0,41 39.j9
* -- . • o= . , %. , - = A ±' ' ;T , p : ' -. ' ' r'7 -" " ' '"
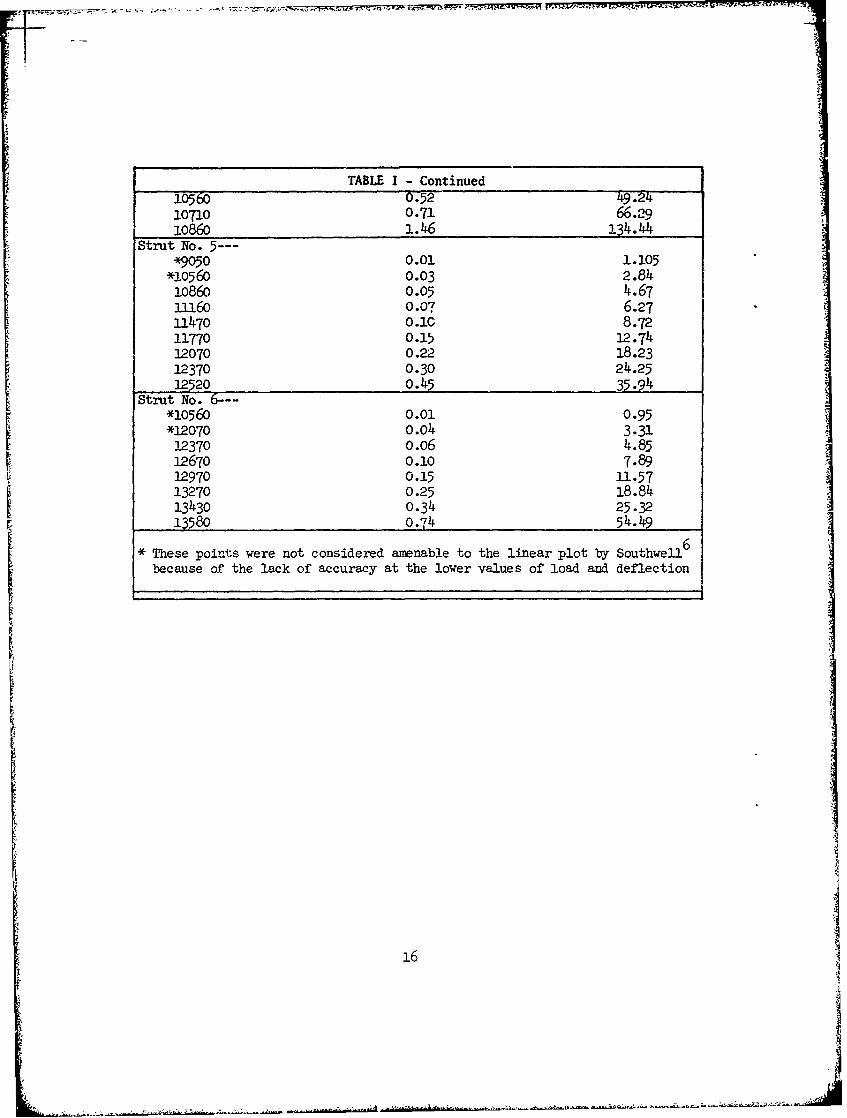
TABLE I - Continued1056D 0.52 49.2
10710 0.71 66.291o86o 1.46 134.44
Strut No. 5---*9050 0.01 1.105
*1056o 0.03 2.841o86o 0.05 4.67
i160 0.07 6.2711470 0.1c 8.7211770 0.15 12.741270 0.22 18.2312370 0.30 24.25
12520 o.45 35.94Strut No. 6---
*10560 0.01 0.95*12070 0.04 3.3112370 0.o6 4.8512670 0.10 7.8912970 0.15 11-5713270 0.25 18.8413430 0.34 25.321358o o.74 54.49
* These points were not considered amenable to the linear plot by Southwell6
because of the lack of accuracy at the lower values of load and deflection
16
-H
14
C,
o P c
to
0
04 '00
0
00
k 0 C0
OT 44
17,
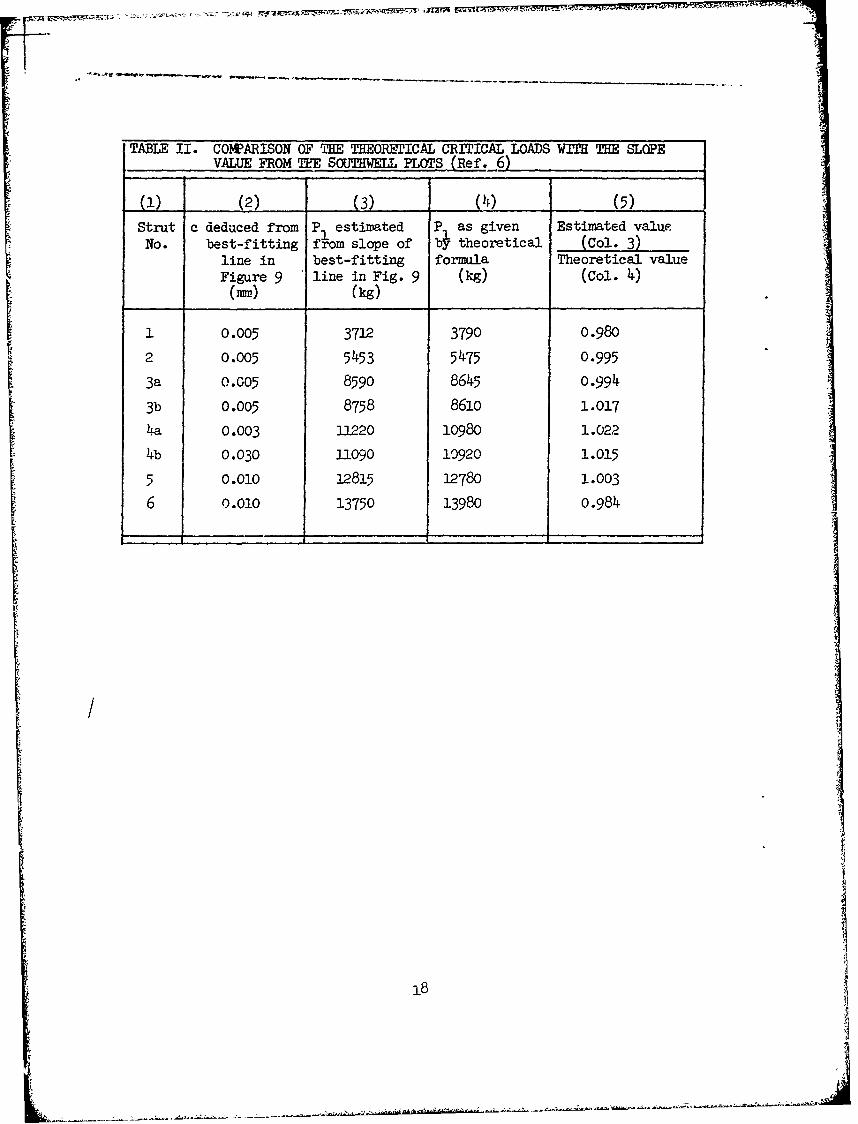
TABLE II. COMPARISON OF UE THEORETICAL CRITICAL LOADS WI H THE SLOPEVAUE FROM TEE SOUTHWELL PLOTS (Ref._6)
(1) (2) (3) (4) (5)
Strut c dedaced from P estimated P as given Estimated value
No. best-fitting from slope of theoretical (Col. 3)line in best-fitting formula Theoretical value
Figure 9 line in Fig. 9 (kg) (Col. 4)(mm) (kg)
1 1 0.005 3712 3790 0.980
2 0.005 5453 5475 0.995
3a 0.005 8590 8645 0.994
3b 0.005 8758 8610 1.017I0.03 11220 10980 1.022
4b 0.030 .1090 10920 1.015
5 0.010 12815 12780 1.003
6 0.010 13750 13980 0.984
/3
I1
whereP and y = the load and the corresponding midpoint deflection,
respectively
P1 and y= initial values of P and y. respectively
P = the first Euler loadcrit
a sin 1- = e, constant for a given reference point x.1 L
The straight line obtained by plotting
Y -Yl
P P1
as an ordinate against y - Yl as an abscissa cuts the horizontal axis atthe distance
[a,1sin TT]
from the origin, and the inverse slope of the line is Pcrit -Pl"
With this formula he was able to analyze some of the von Kgrmdn resultswhich were not amenable by the original approach.
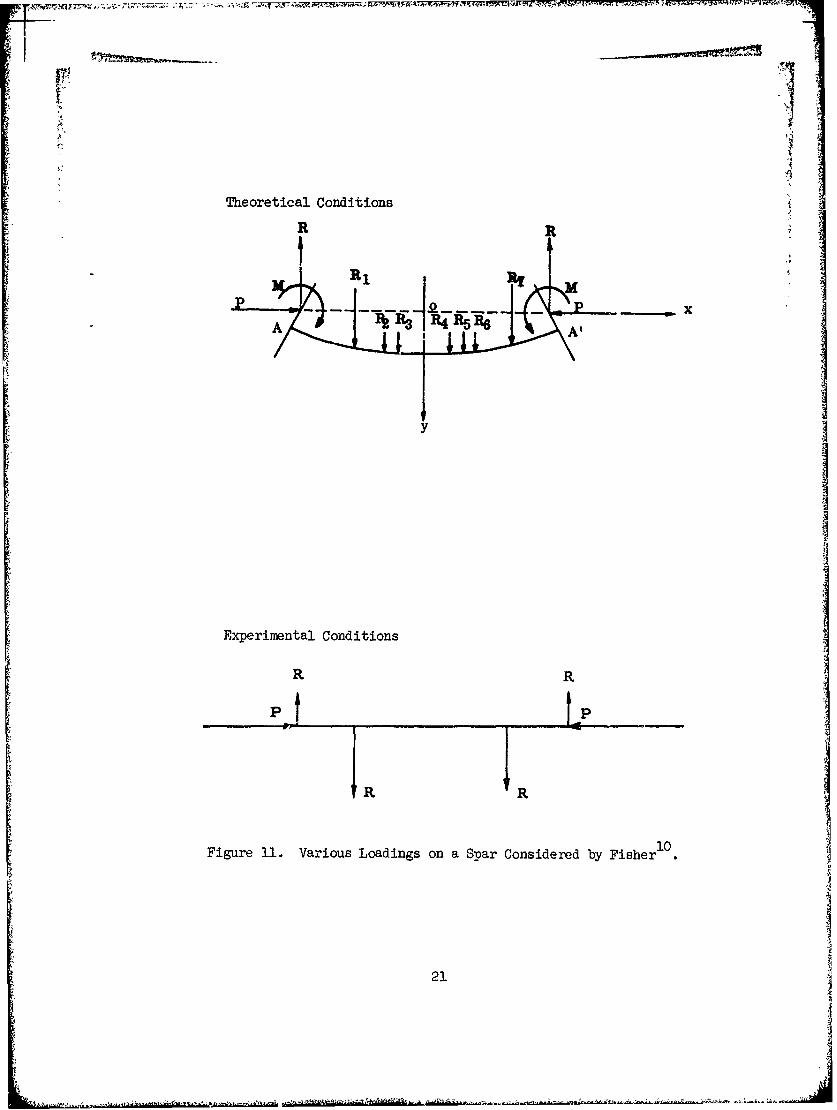
This process of analyzing experimental data was extended by Fisher10'11
to deal with moie complex conditions. The case which he considered isdepicted in Figure 11. In this diagram the line AA' represents the center
line of the bear. Thus, the conditions assumed for the purpose of analysisare:
1. Compressive loads P are applied at fixed points in the end cross
sections of the beam.
2. The end eccentricity of P is small.
3. The center line of the beam in the unstrained case is representedby y = n(x).
4. Forces proportional to P are applied to the beam in the direction0 , and end couples proportional to P are applied in the plane 0 xy.
5. The forces described in (4) above and their associated reactionsare defined by saying that they produce in the absence of otherloads a bending moment P • N(x) at a distance x from the origin.
6. Constant forces parallel to Qy are applied at various points alongthe beam, and constant end couples are applied in the plane 0
7. The system described in (6) above is defined by saying that these
19
forces, together with their appropriate reactions, produce
a bending moment M(x) at position x and end rotation m(x).
With these assumptions the equilibrium equation may be written as:
d2
d 2l x {o(x) + m(x)} P {n(x) + m(x) + 8(x)} l )+P'~)(6
or
LDP2 + P2] 6(x 2 {n(x) + N(x) + m(x)} =i 2 H(x)say (17)
where
6(x) is the added deflection due to P and its associated loads and
2 P= E.
The deflection 6(x) is determined by equation (17) and by the condition6 = 0 at x t L. It is to be noted that there is an exact correspondenceamong y, N, and m. in that it is not these individual values which affect6 but only the sum H. Thus, we have the most important results - namely,initial bowing, end-eccentricity, transverse loads, and end coupleswhether proportional to P or constant, all combine to form one total equiv-alent eccentricity.
Fisher then proceeded with a rigorous analysis and demonstrated that South-
well's expression should be written as
P1 v- Hi(e). F (e,z) (18)
where
H(e) = the sum of the normal forces on the beam
FH(e,z) = a function dependent upon the normal force distribution
v = 6P
Now the variation of F as z passes from 0 to 1 is a measure of thedeviation from lineari~y. This he demonstrated to be small in general.
A second approximation is also given to the v/6 relationship. This is inthe form of a hyperbola.
(Pi v - 6 C )(Piv -K + Cl - 0= -01(01 C.o) al9)
where
20
.....
- '. t{ -1 -
12Theoretical Conditions
RR
p xA A'
y
Experimental Conditions
R R
JrR R
Figure 11. Various Loadings on a Spar Considered by Fisher1.
21
4 04
CLC
6H
01
r
C5)
> 0
0
xc 0
0
22r-
0 P
800
Extrapolated
400R (Lateral load)-lb400
300
.0010015200 •.oo
100 _
0 0. O 0.30 0.40 0.50 0.00
C - in.
Figure 13. Plot of Lateral Load R vs Intercept ValueC From Figure 12.
23
01 1PSa _e _ e%
0~ ~U
21.
0/00,I
! ' L
W+W T
P
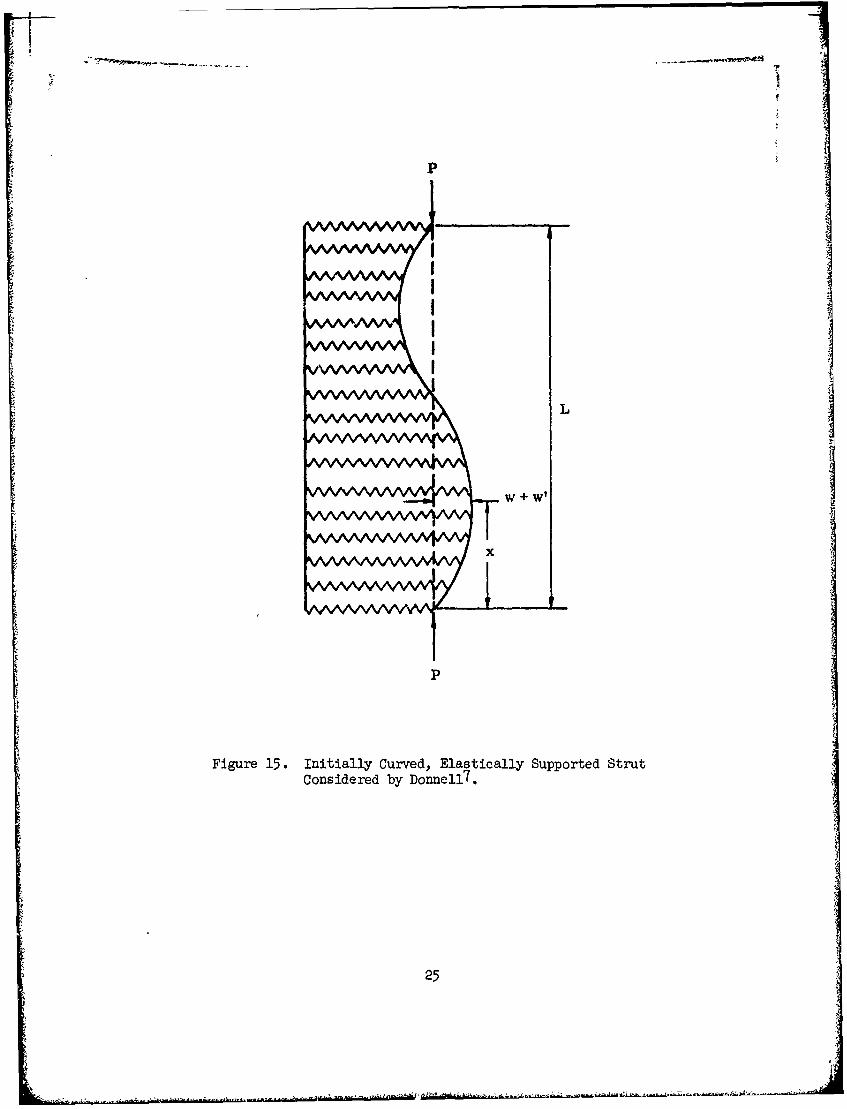
Figure 15. Initially Curved, Elastically Supported StrutConsidered by Donnell 7 .
25
P, v, and 6 have the significance previously ascribed, and C and Care constants. K has the value 0.123234. 1
To test his theory, Fisher performed a series of experiments. The resultsare portrayed in Figures 12, 13, and 14. It is seen from these figuresthat even large values of side force do not destroy the linearity of the6/P versus 6 curves. Thus, the tests provide substantial verification ofFisher's analysis. It is interesting to note, too, that when the South-well eccentricities are expressed in terms of the side force values, therelationship is linear (Figure 13). This is clear evidence that theintercept with the axis has the meaning normally ascribed to it.
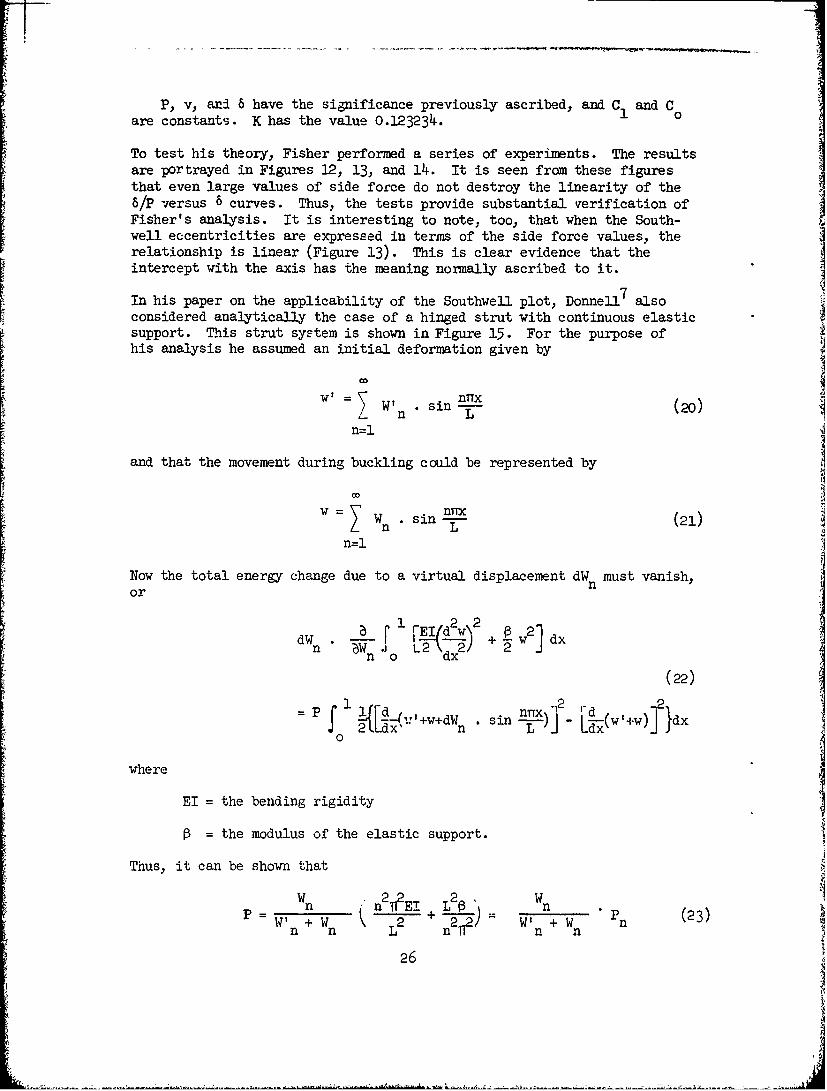
7In his paper on the applicability of the Southwell plot, Donnell alsoconsidered analytically the case of a hinged strut with continuous elasticsupport. This strut system is shown in Figure 15. For the purpose ofhis analysis he assumed an initial deformation given by
S W n sinTh- (20)
n=l
and that the movement during buckling could be represented by
w W sin (21)
n=l
Now the total energy change due to a virtual displacement dWn must vanish,or
[1 2 2~h
b pE/ w iP/d,. 2 _d_.dW . r L-2-( 2-+ J w Idx
n wn jo dx
(22)
{L-(i'+w+dW sin -r) L2 d' I+w) 2dxf 2- d n L w)]}dx
0
where
EI = the bending rigidity
= the modulus of the elastic support.
Thus, it can be shown that
Wn (n 2 EI L G L i Wn
W' + W L2 +n=2 / Wm+W Pn (23)Sn n L nn n
26
- - -- " -,-- - ,-A
This equation can be written in the form
W1
nn 1 (24)
where
Pn = the classical critical loads for a perfect strut having a
continuous elastic support.
Once again the relationship between the elastic deformation and the appliedload reveals a form similar to the Southwell representation for the strut.Of course, in a problem of this type, which may easily exhibit modal shapeshaving harmonics higher than the fundamental one, it is important toobserve and record adequately the buckling shape as well as the load anddeflection parameters.
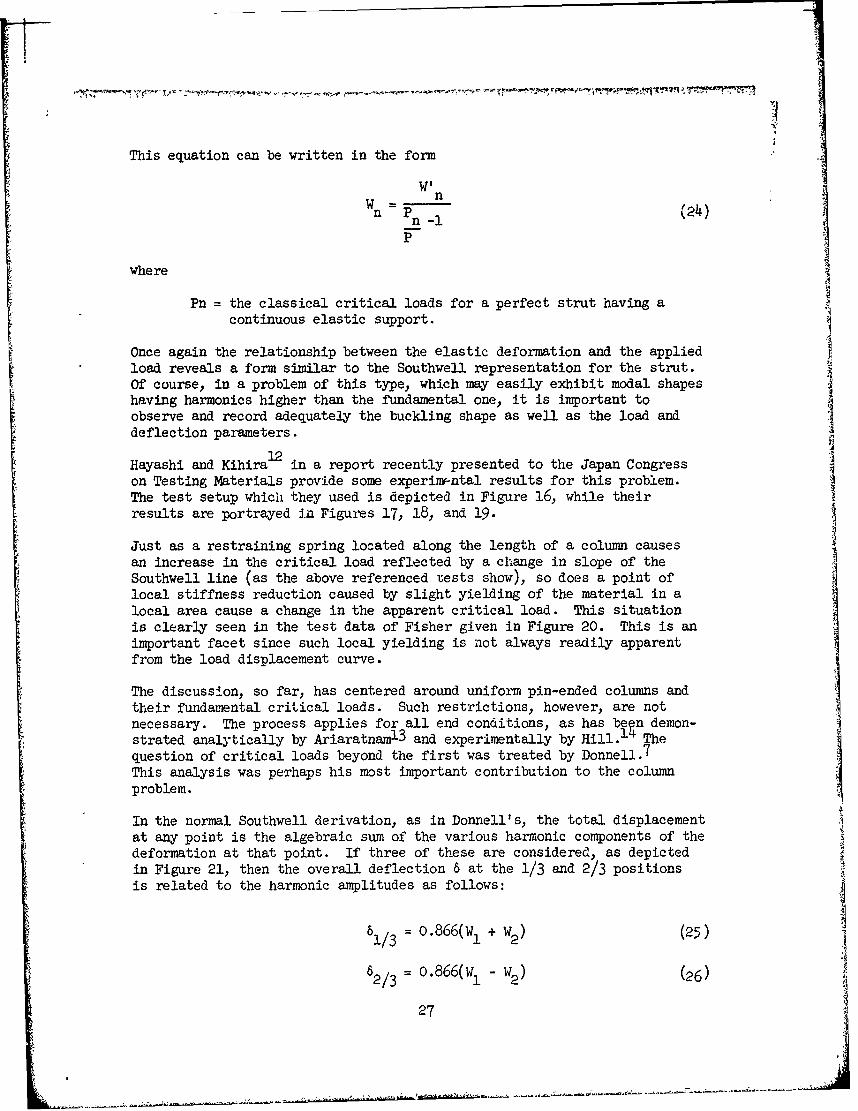
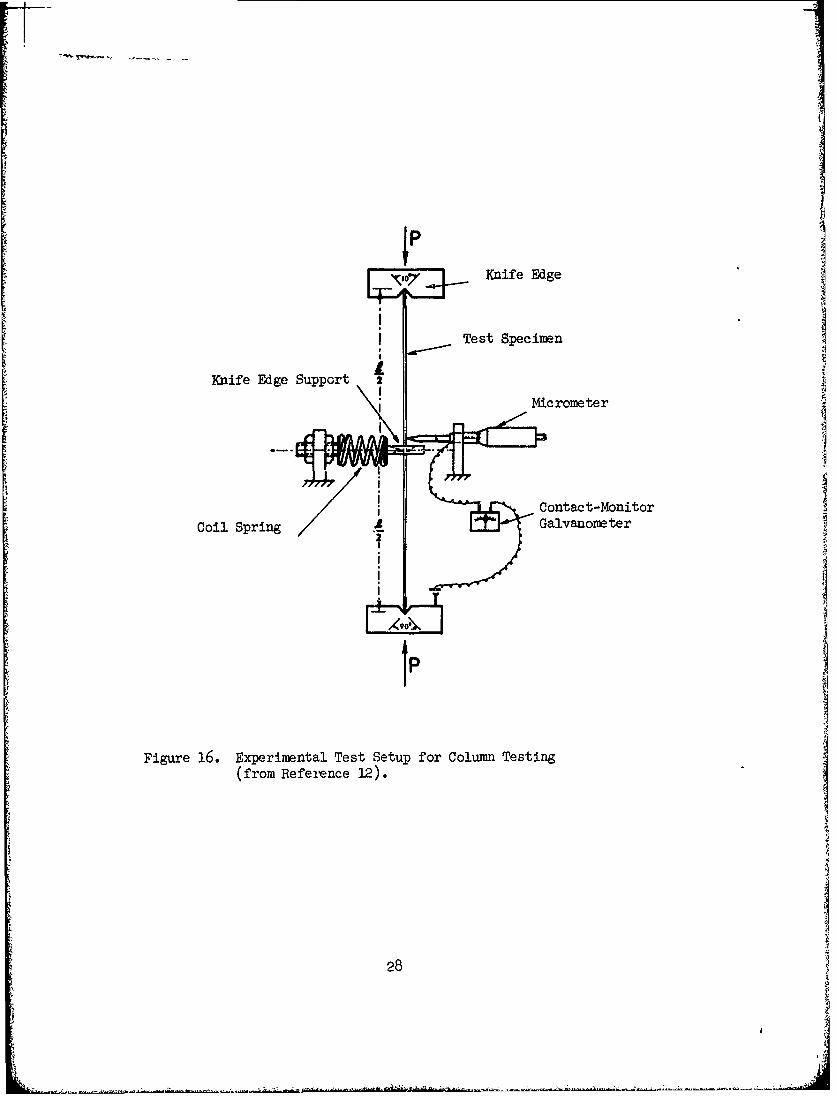
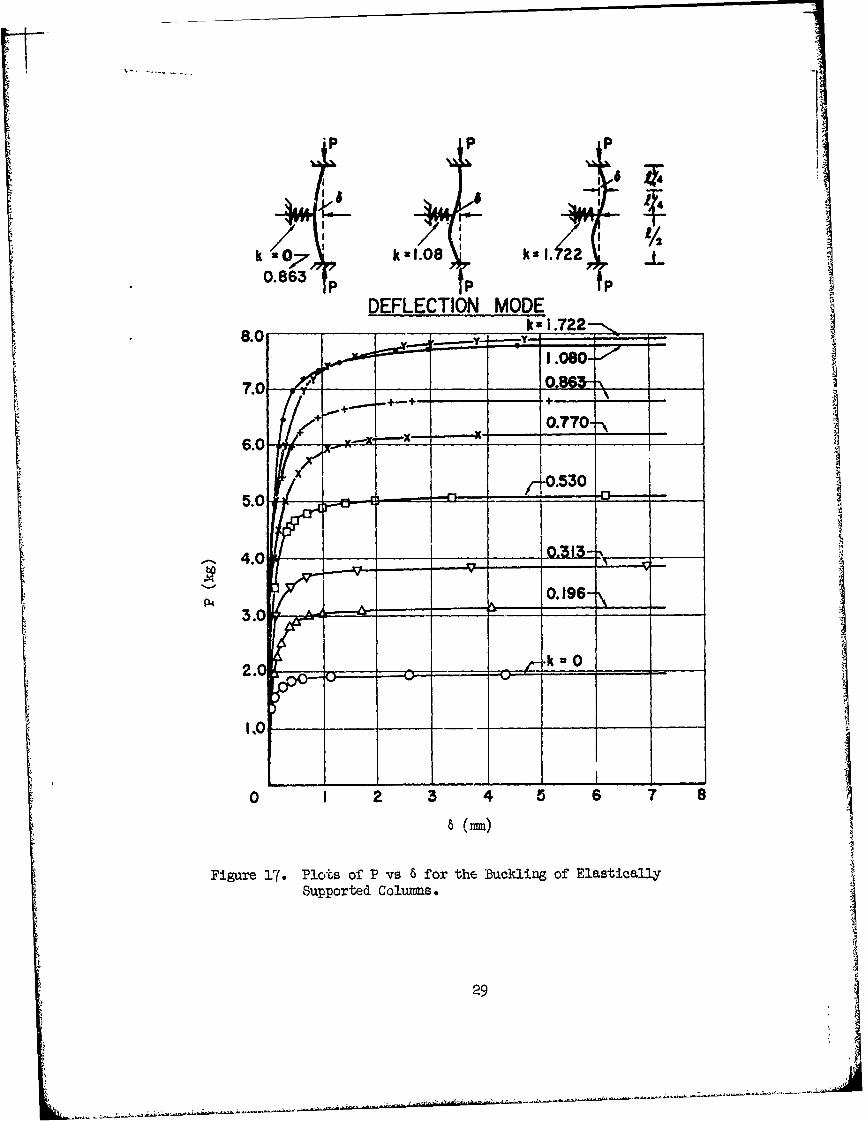
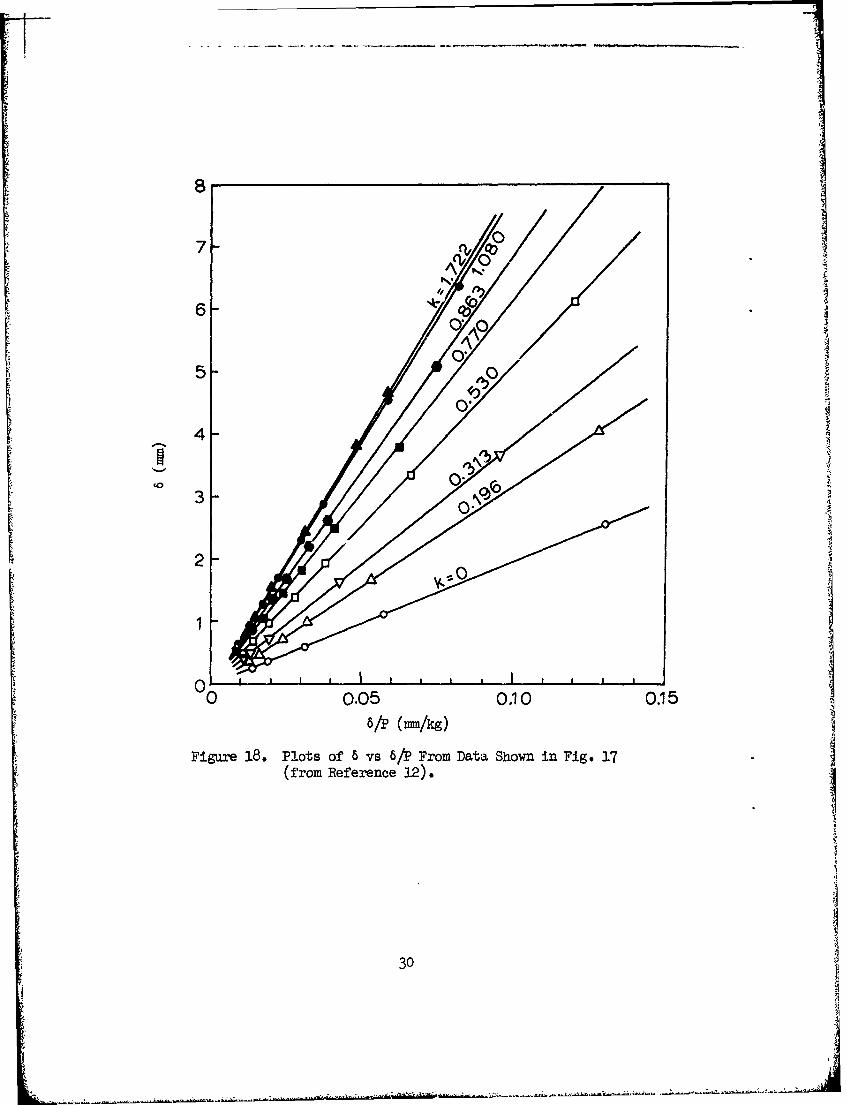
Hayashi and Khr12in a report recently presented to the Japan Congresson Testing Materials provide some experimental results for this problem.
The test setup which they used is depicted in Figure 16, while theirresults are portrayed in Figures 17, 18, and 19.
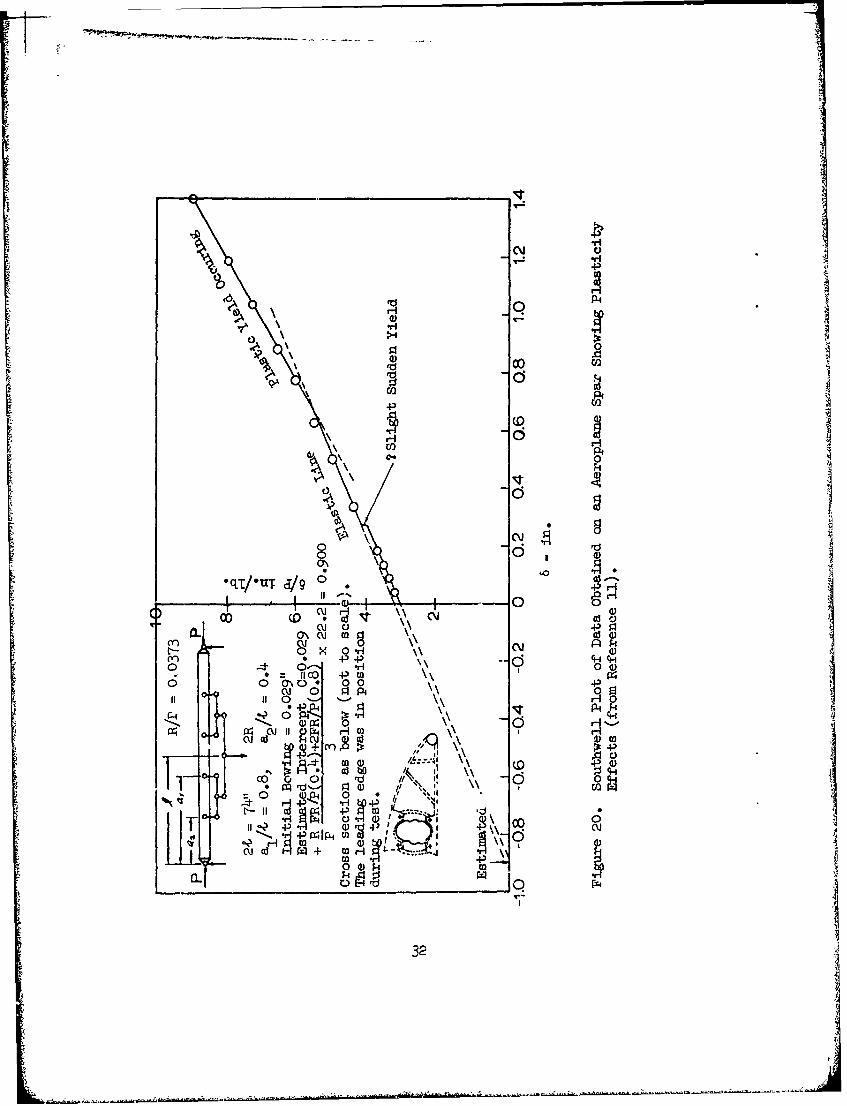
Just as a restraining spring located along the length of a column causesan increase in the critical load reflected by a change in slope of theSouthwell line (as the above referenced tests show), so does a point oflocal stiffness reduction caused by slight yielding of the material in alocal area cause a change in the apparent critical load. This situationis clearly seen in the test data of Fisher given in Figure 20. This is an
important facet since such local yielding is not always readily apparentfrom the load displacement curve.
The discussion, so far, has centered around uniform pin-ended columns andtheir fundamental critical loads. Such restrictions, however, are notnecessary. The process applies for all end conditions, as has ben demon-strated analytically by Ariaratnam1 3 and experimentally by Hill.14 Thequestion of critical loads beyond the first was treated by Donnell.
7
This analysis was perhaps his most important contribution to the columnproblem.
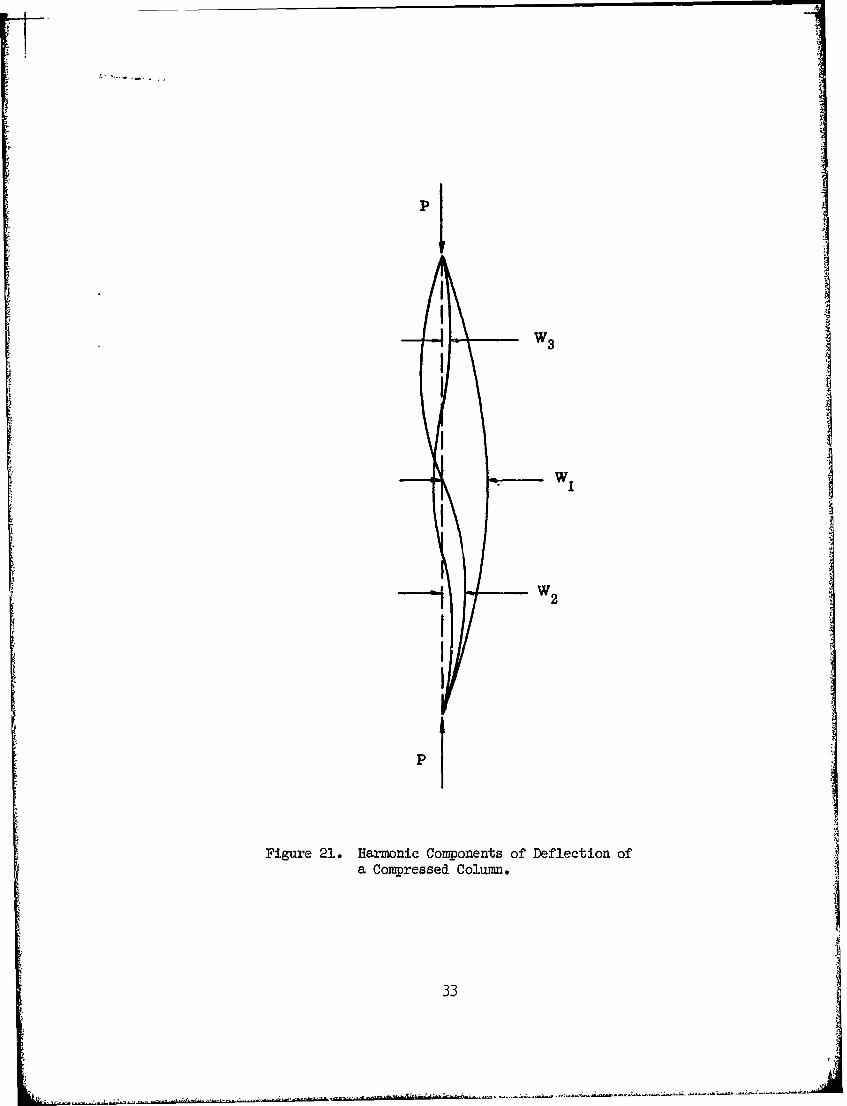
In the normal Southwell derivation, as in Donnell's, the total displacementat any point is the algebraic sum of the various harmonic components of thedeformation at that point. If three of these are considered, as depictedin Figure 21, then the overall deflection 6 at the 1/3 and 2/3 positionsis related to the harmonic amplitudes as follows:
61/3 = o.866(w1 + w2 ) (25)
623=0.866(W4 W (26)
27
jPj
\107 Knife Edge
07 Test Specimen
Knife Edge Support 2k fMic rome te r
Contact-Monitor
Coil Spring A Galvanometer
II
Figure 16. Experimental Test Setup for Column Testing(from Reference 12).
28
I y~
4P4
I /2 /2k n-k aI.08 ks 1c. 220.863 p p
DEFLECTION MODE____ ____ kha 1.722 _ _
1.060-
0.770-___
,r[0.530
.0
Figur'e 17. Plots of' P vs f ±or the Buckling of' ElasticallySupported Columns.
29
4 7-
6-4
A5-
It
o 3-0.4
I 2
40 0.05 0.10 0.15
Figure 18. Plots of 8 vs 8/P From Data Shown in Fig* 17(from Reference 12).
30
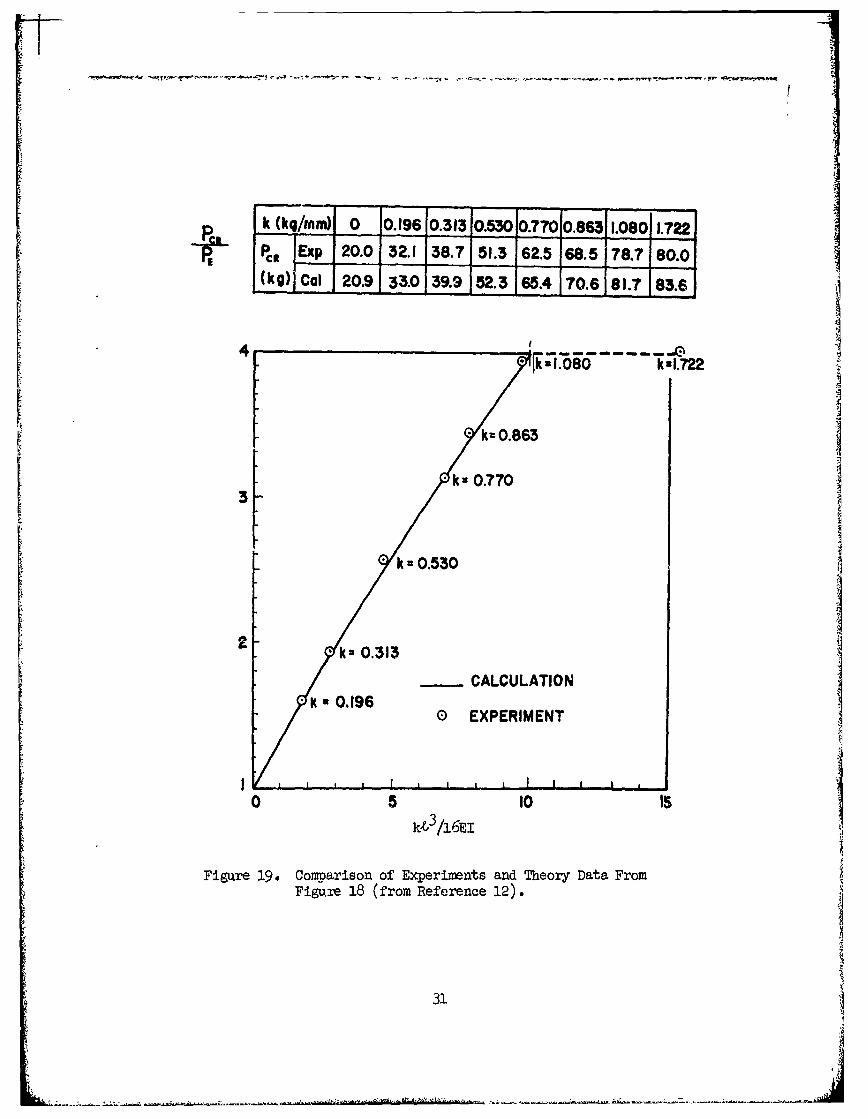
k (kq/mm) 0 0.196 0.313 0.530 0.770O.8631 1.080 1.722Pc3 Exp 20.0 32.1 38.7 51.3 62.5 68.5 78.7 80.0(kg) Cal 20.9 33.0 39.9 52.3 65.4 70.6 81.7 83.6
k --- - - I k1.722
& 0.863
k 0.7703
k 0.530
2k 0.313
KCALCULATIONa 0.196
0 EXPERIMENT
0 5 10 1
kt,3/16EI 0IS1
Figure 19. Comparison of Experiments and Theory Data FromFigure 18 (from Reference 12).
4
0 g1
co
01
qT/Y) 0i 0
C0J 00S
0 0 o', 0 0
P4 P4 i 11q-4 -l c
G o 0 \. : : -cooo , oIc
ttv~ ~ i-~ H- ~ 0 * s.10
C) rI TD "
t.-j encd4- CI-H 0 \ 32
11 p( g 1 I
W 3
III w
1 2
P
Figure 21. Harmonic Components of Deflection ofa Compressed Column.
33
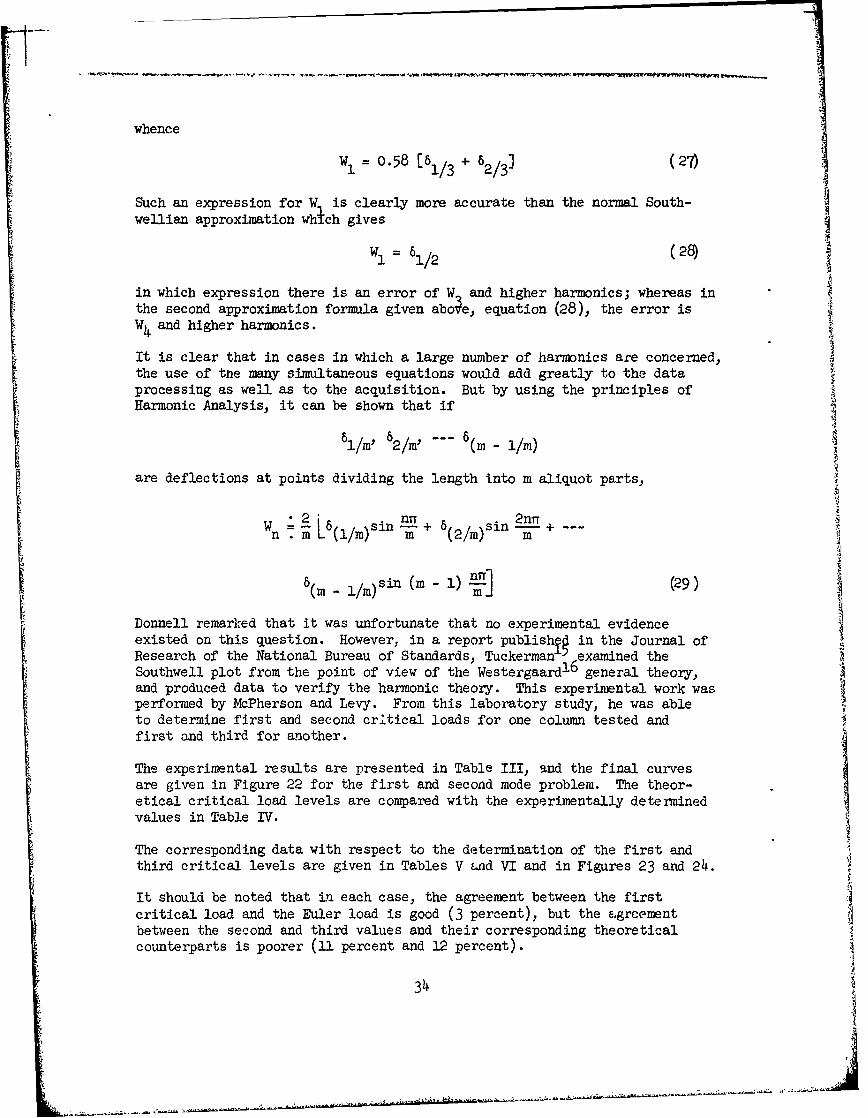
whence
W1 =0.58 [61/3 + 62/3 (27)
Such an expression for W is clearly more accurate than the normal South-wellian approximation whch gives
W = 8 / 2 (28)
in which expression there is an error of W and higher harmonics; whereas inthe second approximation formula given aboe, equation (28), the error isW and higher harmonics.
It is clear that in cases in which a large number of harmonics are concerned,the use of the many simultaneous equations would add greatly to the data
processing as well as to the acquisition. But by using the principles ofHarmonic Analysis, it can be shown that ifI 1/m' 62/m'.-- 6(m- iIare deflections at points dividing the length into m aliquot parts,
W nTT 2nTT
- /m Sin nn + n -2 sin 2 2/ +
(m m)sin (m 1) ] (29)
Donnell remarked that it was unfortunate that no experimental evidence
existed on this question. However, in a report publishV in the Journal ofResearch of the National Bureau of Standards, Tuckerman examined the
Southwell plot from the point of view of the Westergaard general theory,and produced data to verify the harmonic theory. This experimental work wasperformed by McPherson and Levy. From this laboratory study, he was ableto determine first and second critical loads for one column tested andfirst and tbird for another.
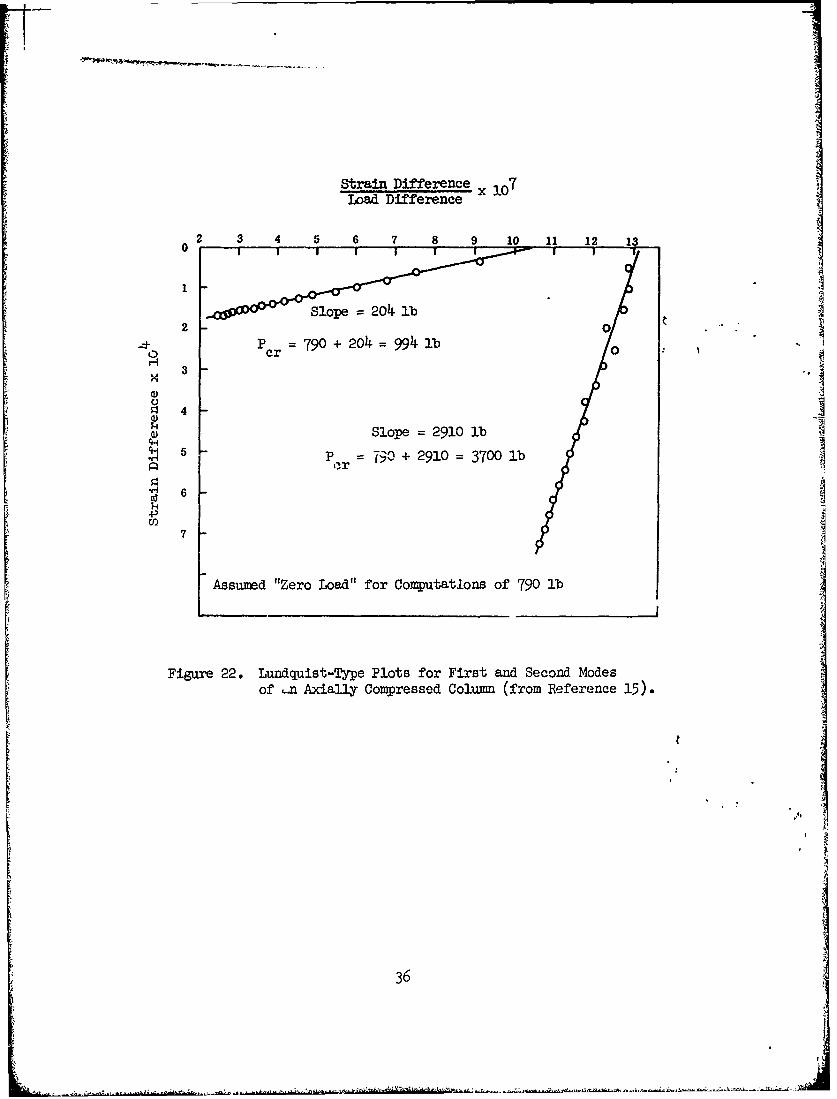
The experimental results are presented in Table III, and the final curvesare given in Figure 22 for the first and second mode problem. The theor-etical critical load levels are compared with the experimentally determinedvalues in Table IV.
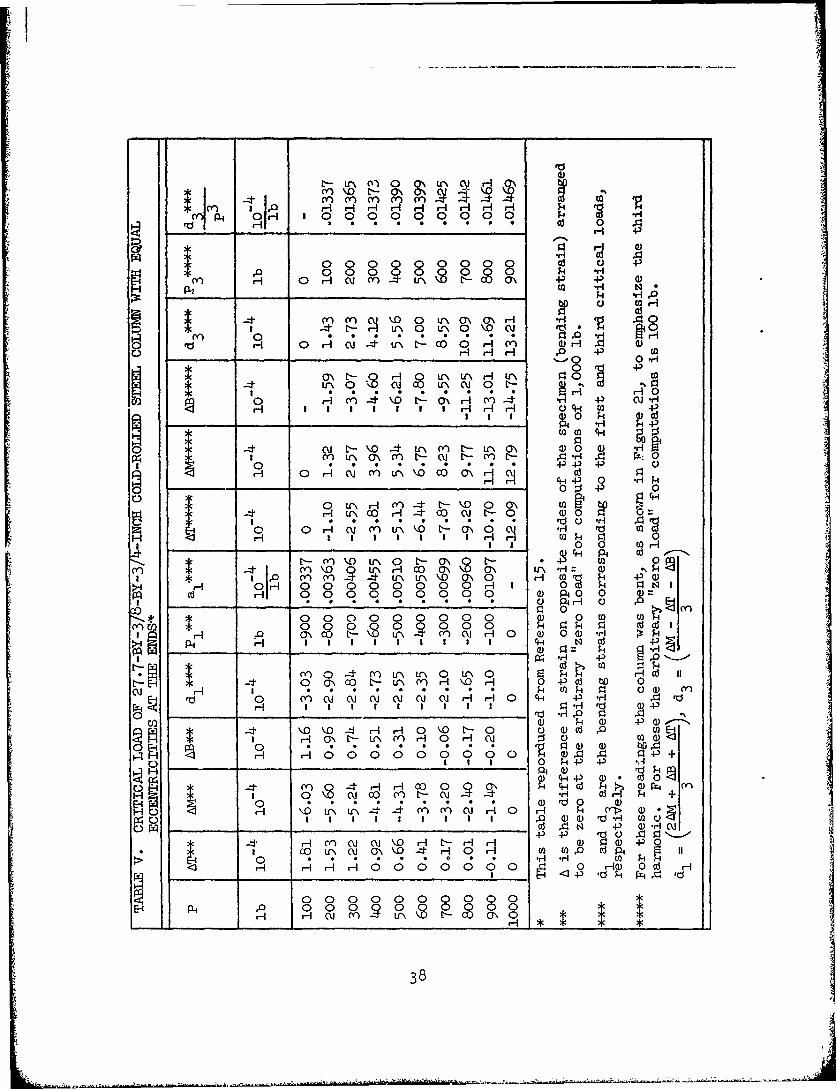
The corresponding data with respect to the determination of the first andthird critical levels are given in Tables V and VI and in Figures 23 and 24.
It should be noted that in each case, the agreement between the firstcritical load and the Euler load is good (3 percent), but the e.greementbetween the second and third values and their corresponding theoreticalcounterparts is poorer (11 percent and 12 percent).
34
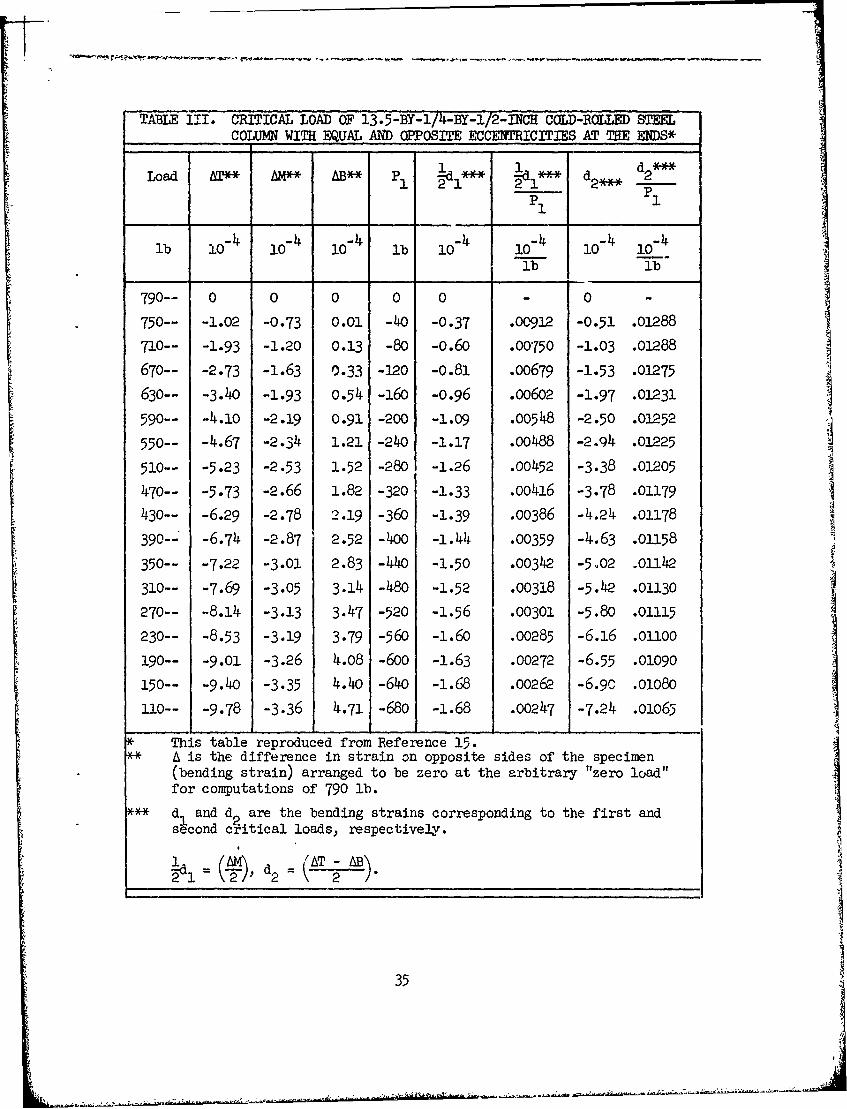
TABLE III. CRITICAL LOAD OF 13.5-BY-1/4-BY-1/2-INCH COLD-ROLLED STEELCOLUM WITH EQUAL AND OPPOSITE ECCENTR.ICITIES AT THE ENDS*
1 1 d2**-
P 1I
04 i4 -4 -4 -4 i-4 ilb 10- 10- 10- lb 10 10- 1 10-lb lb
790-- 0 0 0 0 0 -0 -
750-- -1.02 -0.73 0.01 -40 -0.37 .00912 -0.51 .01288
710-- -1-93 -1.20 0.13 -80 -0.60 .00750 -1.03 .01288
670-- -2.73 -1.63 0.33 -120 -0.81 .00679 -1.53 .01275
630-- -3.40 -1.93 0.54 -160 -0.96 .00602 -1.97 .01231
590-- -4.10 -2.19 0.91 -200 -1.09 .00548 -2.50 .01252
550-- -4.67 -2.34 1.21 -240 -1.17 .00488 -2.94 .01225
510-- -5.23 -2.53 1.52 -280 -1.26 .00452 -3.38 .01205
470-- -5.73 -2.66 1.82 -320 -1.33 .00416 -3.78 .01179
430-- -6.29 -2.78 2.19 -360 -1.39 .00386 -4.24 .01178
390-- -6.74 -2.87 2.52 -40o -1.44 .00359 -4.63 .01158
350-- -7.22 -3.01 2.83 -440 -1.50 .00342 -5.02 xoi142
310-- -7.69 -3.05 3.14 -480 -1.52 .00318 -5.42 .01130
270-- -8.14 -3.13 3.47 -520 -1.56 .00301 -5.8o .oll15
230-- -8.53 -3.19 3.79 -560 -1.60 .00285 -6.16 .01100
190-- -9.01 -3.26 4.08 -600 -1.63 .00272 -6.55 .01090
150-- -9.40 -3.35 4.40 -640 -1.68 .00262 -6.9c .0108o
110-- -9.78 -3.36 4.71 -680 -1.68 .00247 -7.24 .01063
* This table reproduced from Reference 15.* A is the difference in strain on opposite sides of the specimen
(bending strain) arranged to be zero at the arbitrary "zero load"for computations of 790 lb.
** d and d are the bending strains corresponding to the first andsecond critical loads, respectively.
d AT -AB
35
Strain Difference 7Load Difference x1
2 3 4 5 6 7 8 9 10 11 12 13
Slope =2041 lb ~2
Pcr =790 +204 = 9941lb3
S4
Slope = 2910 lb
5 -f9,0+ 2910 3700 lb
Cc
Assumed "Zero Load" for Computations of 790 lb
Figure 22. Lundquist-Type Plots for First and Second Modesof ,n Axiall3y Compressed Column (from Reference 15).
36
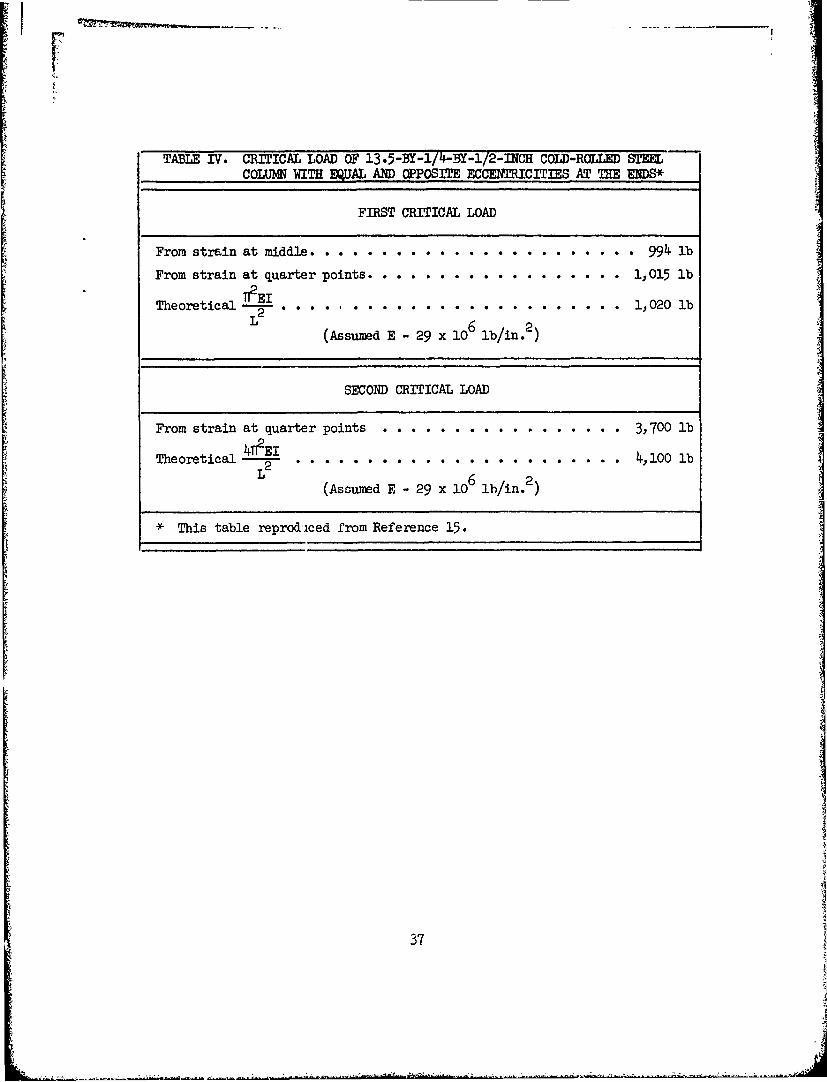
TABLE IV. CRITICAL LOAD OF 13.5-BY-1/4-BY-1/2-INCH COLD-ROLLED STELCOLUMN WITH EQUAL AMD OPPOSITE ECCENTRICITIES AT THE ENDS*
FIRST CRITICAL LOAD
From strain at middle ........................ 994 lb
From strain at quarter points ......... . . . . . . . 1,015 lb
Theoretical - ..EI1,020. .
(Assumed E - 29 x 106 lb/in. )
SECOND CRITICAL LOAD
From strain at quarter points . ................ 3,700 lb
Theoretical 4 I .... 4,100 lb
(Assuned E - 29 x 10l6 b/in. 2
* This table reprod iced from Reference 15.
37
(ntr' ' 0 aC tr
ry1cy 100000000ri~~i- .. '- H fir- -
P,0 00 0 0 0 0I
8000 0 0008H O~ COY)r U-L\' 4) 43 0
:3: 4 .d.OCdH
_:tO 0 nt~~~ m1- mQ-
0Y * 0 . 8 -HO R___ H0 0 t 0U 0\- ' o*r Y ) D 0
O- r E -I 10 + co____0 0.r-H
043
0- 0 CMa U'\ cMu0$ I-i I- 00~ u
0:1 C; -'.O,: - LrCr -H 4-0\ ~ .HCr)~ a('\Y C-C% to~t~ ,C >
H~~~a 0Hu ~ 0a O~ k...) Cd
I . r Ch . Y El . j LI . r pt * ) *
0 0r 0 0 )U\55O\'PH
rr\0 Lr HH o'm u-yi-a En\ C 4csH .. ) 0 0 0 0 ar 0 ~i~ i
00 00 P4-) 0
I *o C* *r * ) gk 0
H- 0 0 0 0 I 0 0 a- 1 .. 0
m~. CO00 ) dc
*PC,Cr0- CrdC LAEa ~H , I
04'ai 4-5 0O
O 0 _P) k 3 0 Y
\ Q -Zi H HcO 0r \1 -0 0 )cI 0- CN. Lc'.a - CO ) C- C j 0'0 * * .C
H ~L~f- 1~ 0~rC H H i 4-) 4)
(Y)'+:) 4' 'd00 0 H 43--~~~~ HCHC~uD C>0d 0 4)0 Im C L u00\-") -~ (\i - CD CD d ,+
H- 0 * *r- 4 C
<I~~- H HHH OOOij 0 i20____~~ H4-)A~ ~ H~~
CA4 EapOO4
38r]r
E- 0 n $
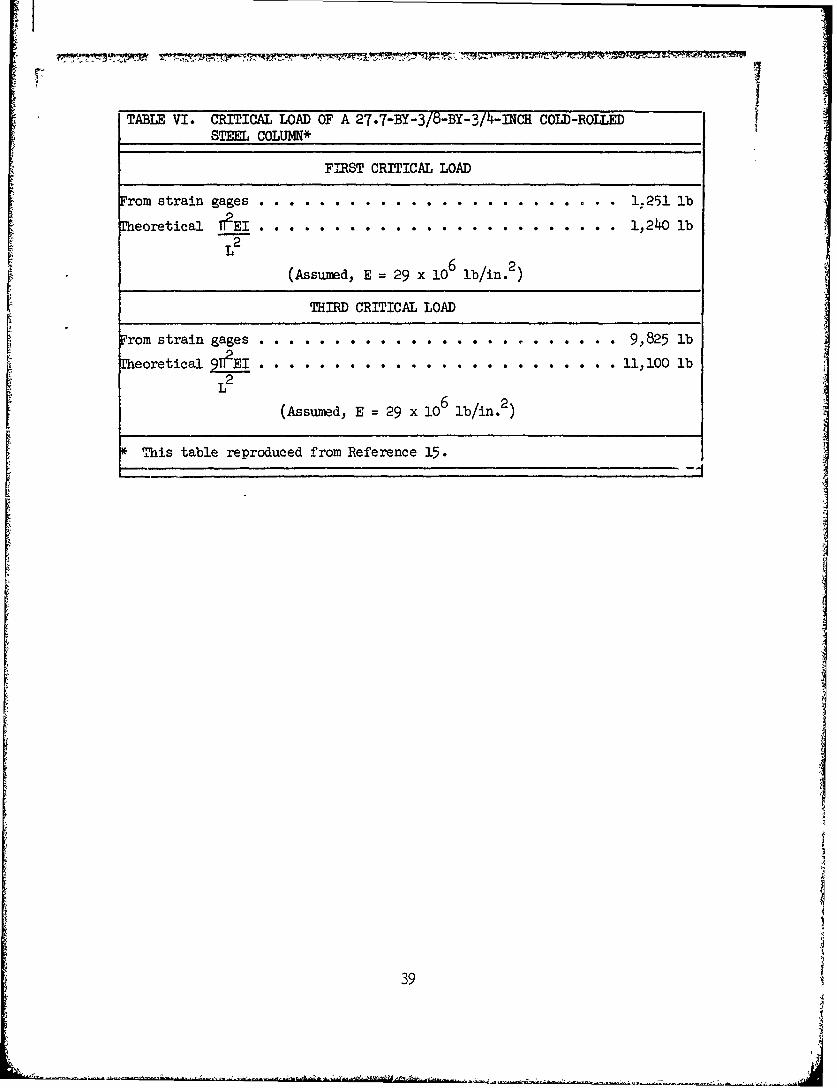
TABLE VI. CRITICAL LOAD OF A 27.7-BY-3/8-BY-3/4-INCH COLD-ROLLEDSTEEL COLUMN*
FIRST CRITICAL LOAD
From strain gages . .. . . . ... . . . . . . . . . . . ... 1.251 lb
Theoretical TEI . . . . . . . . . . . . . . . . . . . . . . . . 1,24o lb
(Assumed, E = 29 x 106 lb/in. 2)
THIRD CRITICAL LOAD
From strain gages . . . . . . . . . 9P825 lbTheoretical9TPEI . . . . . . . . . .. . . . . . . . . . . . . .11,100 lb
L2
(Assumed, E -29 x 1O6 lb/in.2)
This table reproduced from Reference 15.
39
LO
0r UN430
LCr CI\ (D 0
o 8 ; Q P
00cq 0
'4
H
0- 440:
II + wHO
co~ H
40 I
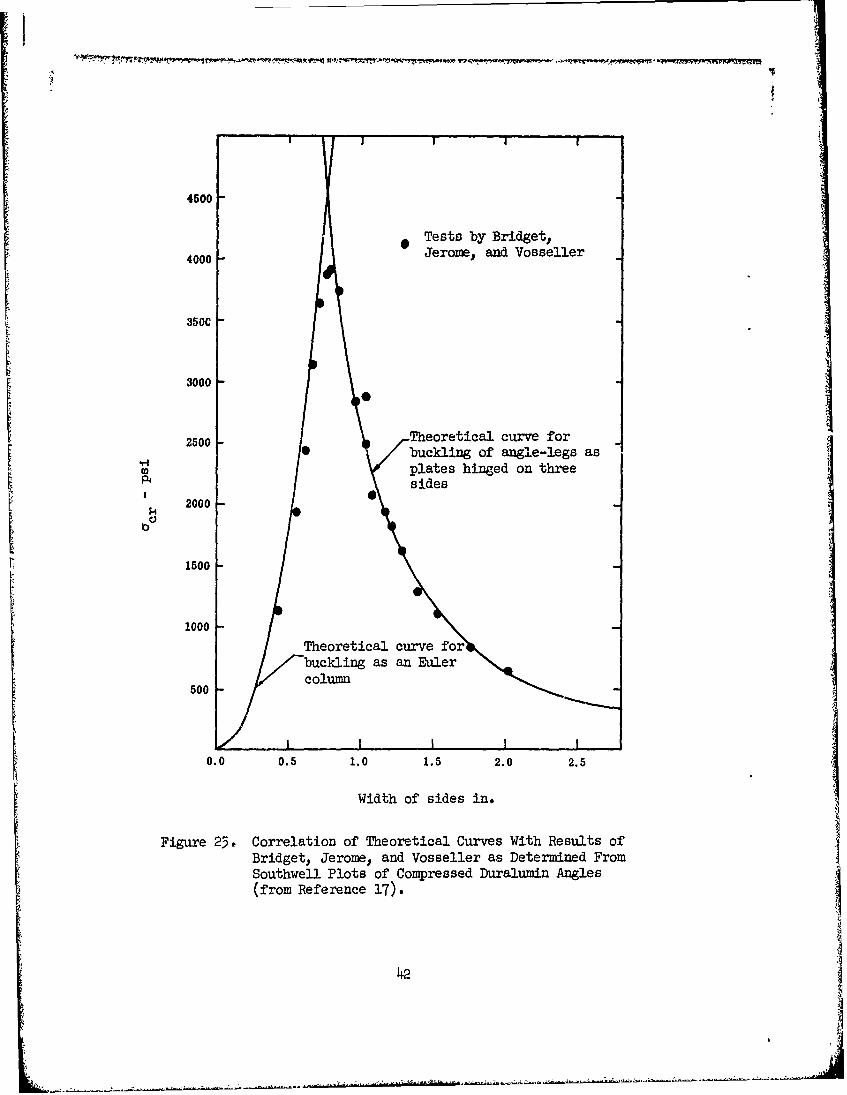
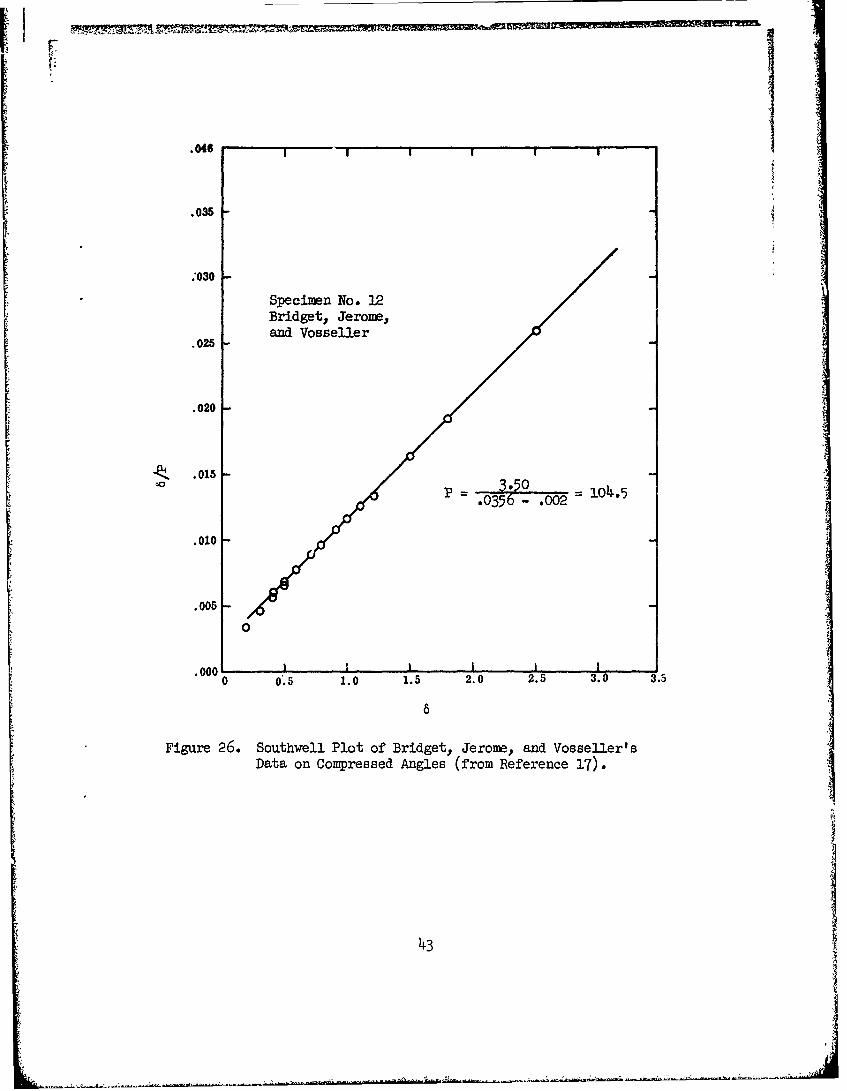
The next applicatio: of interest appears in the study reported by Bridget,Jerome, and Vosseller.1 7 This work was concerned with the stability of
angle struts. The instability mode for such structures Is markedlydependent on the width of the flanges. When the flanges are narrow, themode is of the Euler Column type, but when they are wide, local or torsionalinstability can occur. It was found in the investigation that the South-well plot was applicable irrespective of mode. The oerall results of the
study are given in Figure 25. A typical Southwell plot is shown in Figure
26.
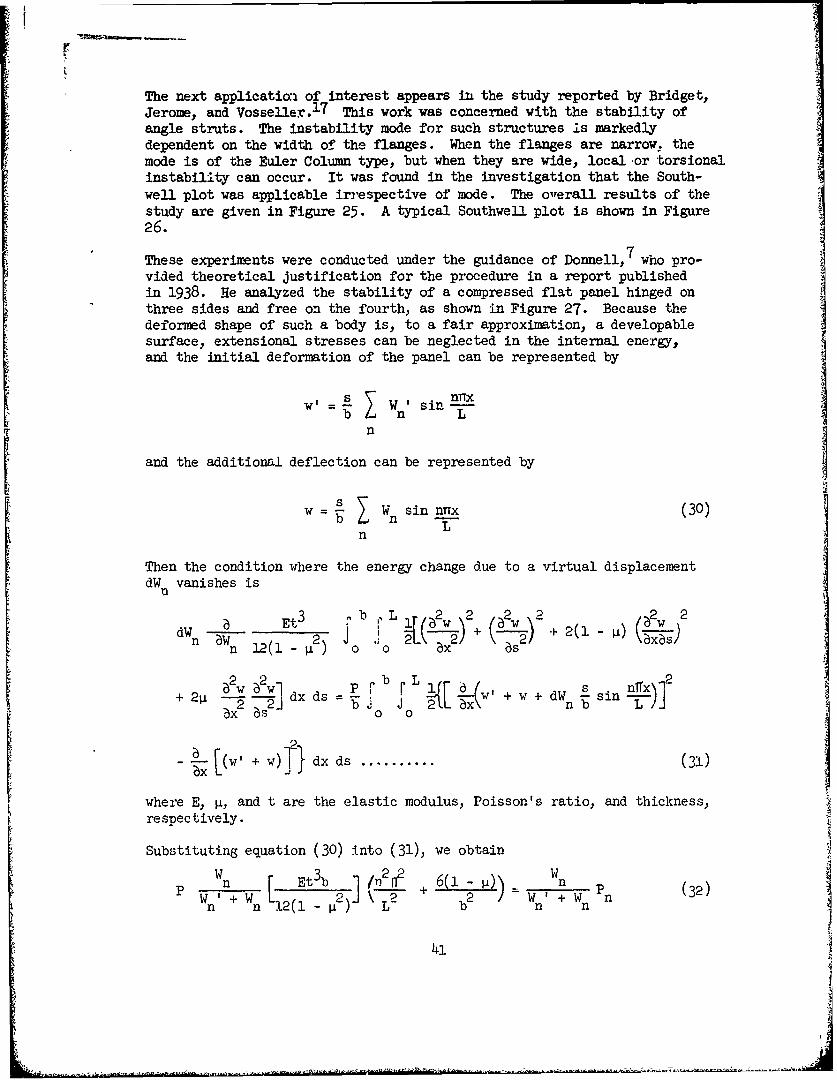
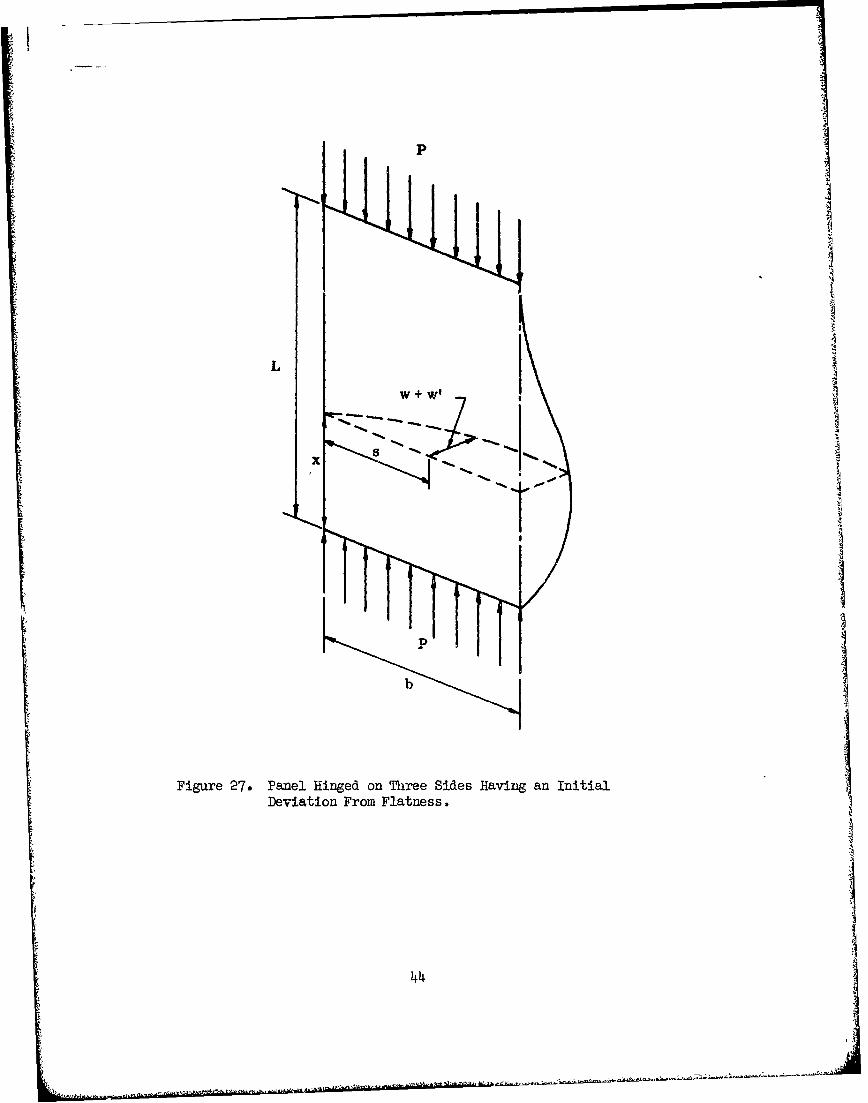
7These experiments were conducted under the guidance of Donnell, who pro-vided theoretical justification for the procedure in a report publishedin 1938. He analyzed the stability of a compressed flat panel hinged onthree sides and free on the fourth, as shown in Figure 27. Because thedeformed shape of such a body is, to a fair approximation, a developablesurface, extensional stresses can be neglected in the internal energy,
and the initial deformation of the panel can be represented by
w' W W nrxb n --Ln
and the additional deflection can be represented by
s.1w b I Wn sin nTx (30)
Ln
Then the condition where the energy change due to a virtual displacementdW vanishes is
WEt 3 nb ,L i(2w 2 2 ( 2
2 P ) o , 2) + (b- ) -
L 1)
nx~ 0 0 x+ ~ ~ 2p 62 aJ_ dxd x"\ rLw + w + dW ssin-f2 x2 6s 21 dx ; as 0 Jo 0o1 [ nb !i-X
-- [(w +w)2} dx ds (31)-a- L w' + W 21 d ds .......... ( 1
where E, p, and t are the elastic modulus, Poisson's ratio, and thickness,
respectively.
Substituting equation (30) into (31), we obtain
W n Et3b n2 + 6(1 - Wn P (32)W +W 2) + 2\-1 2 W) + W nn n 12(l -[) L- b n n
41
4500
Tests by Bridget,
4000 Jerome, and Vosseller
350C
3000 0
2500 -Theoretical curve for2 / buckling of angle-legs as
w plates hinged on threePsides
2000 0
bO
1500
1000 1Theoretical curve for
buckling as an Eulercolumn
500 -
0.0 0.5 1.0 1.5 2.0 2.5
Width of sides in.
Figure 25. Correlation of Theoretical Curves With Results ofBridget, Jerome, and Vosseller as Determined FromSouthwell Plots of Compressed Duralumin Angles
(from Reference 17).
I
.046
.035
:030
Specimen No. 32Bridget, Jerome..and Vosseller
.025
.020
. o.0 15 3 .50
.010 -
.005 -
0
.000 I I I i0 0.5 1.0 1.5 2,0 2.5 3.0 3.5
8
Figure 26. Southwell Plot of Bridget, Jerome3, and Vosseller'sData on Compressed Angles (from Reference 17).
43
w+w, 7 ,-_ _
b/
Figure 27# Panel Hinged on Three Sides Having an InitialDeviation From Flatness,
44
thwhere P is the n critical load. This expression if clearly identicalin form to that derived by Southwell and suggested by Ayrton and Perry.5
If the linear plot method (Southwell Plot) described had significancemerely with regard to the strut, then, without question, it would meritdiscussion. But the value of the technique is much wider. We shall dealwith various successful applications of the procedure in chronologicalorder.
In 1933 Gough and Cox 18 made experiments on the shear buckling of plateswith a view to checking the analytical studies of Southwell and Skan.19
In the first series of tests ithich they made, the buckling loads weredetermined by distortion of images reflected in the surface of the strip.The results of this approach were very positive. In all cases, there wasa serious discrepancy between theory and experiment. The "critical loads"determined as described were found to be representable by an expressionwhich differed from the theoretical not only in magnitude but also in form.
As a consequepce, the interpretation of the tests was made on the basis ofthe SouthwellO argument, which proceeds as follows.
If initial irregularities are present in the plane of the sheet, therewill be a component of the wave form corresponding to the first criticalload, as defined by theory. If the amplitude of this component is Wo, theeffect of a shear load S is to multiply this amplitude in the ratioS/(S - S), S being the critical load. Thus, the corresponding values ofS an W (elas~ic deflection) should satisfy the relationship.
W = SW 0 / (S 0 - S) (33)
i.e., WL- - lj = constant (34)
an equation of precisely the same form as equation (14).
Thus, the plot of W versus W/S should be linear, and the slope shouldcorrespond to the first critical load for a perfect plate, since the inter-cept is clearly the value of the effective imperfection.
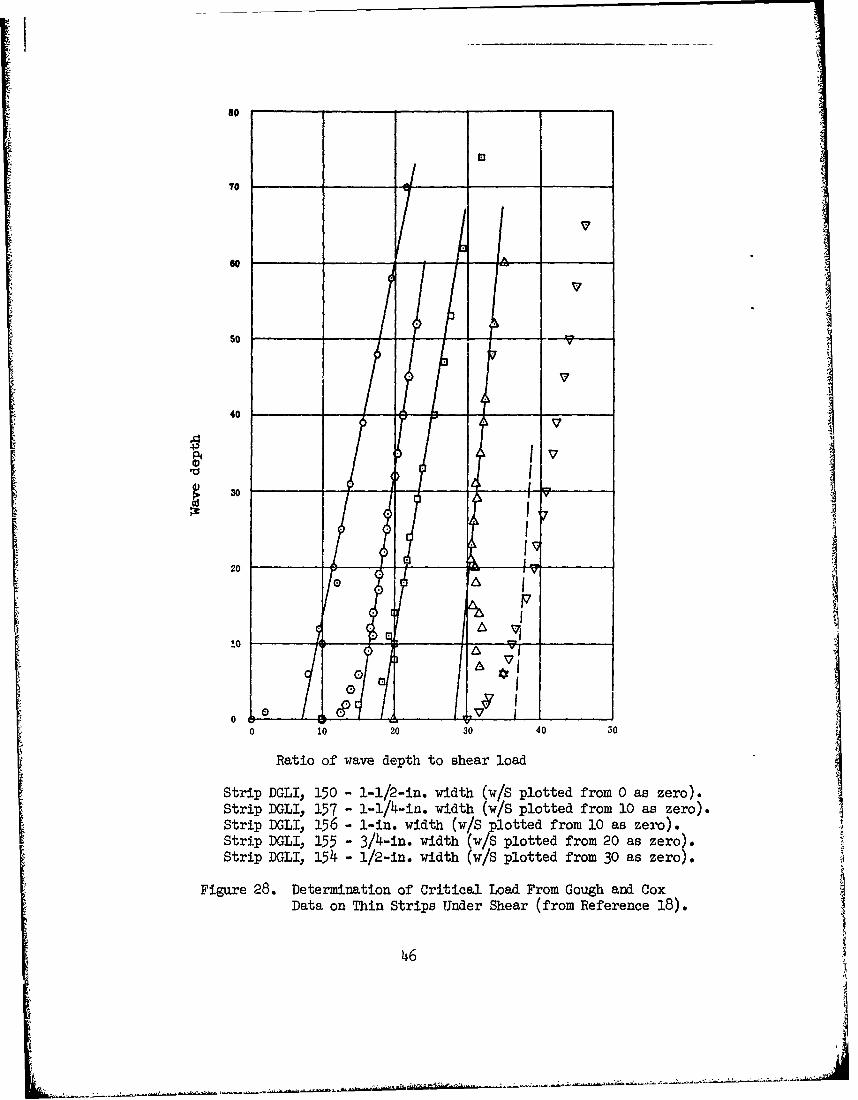
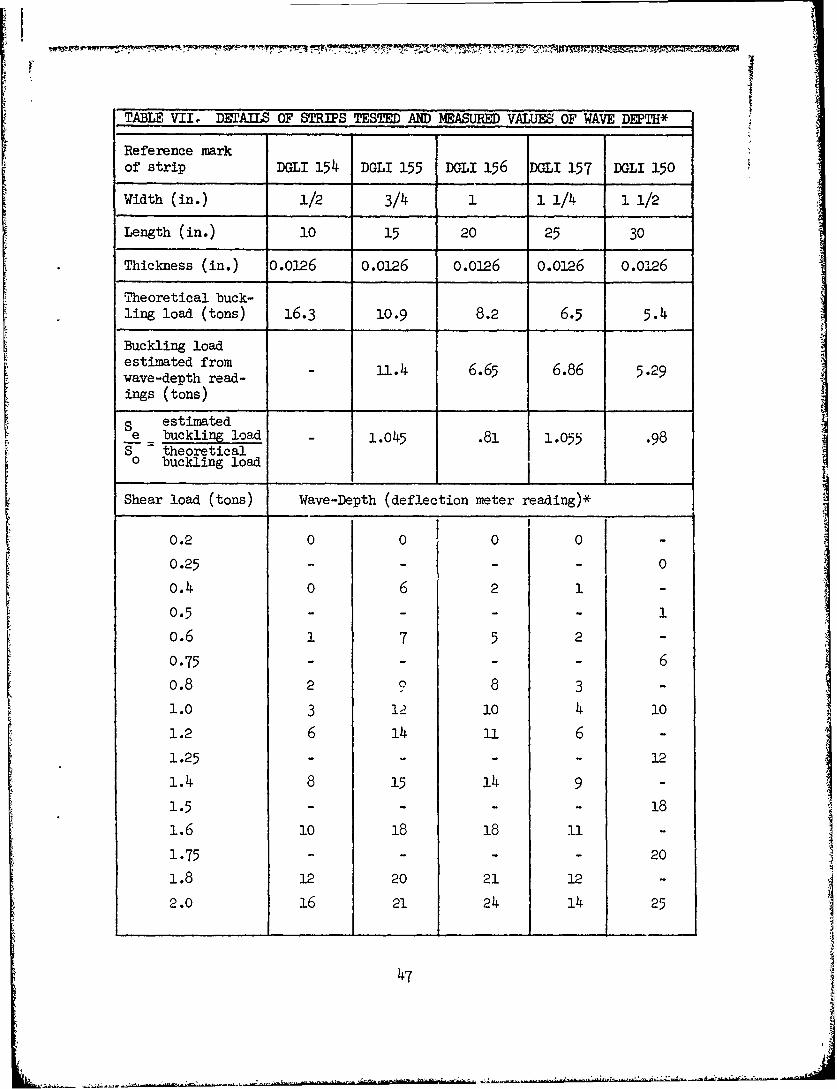
The results of this approach are portrayed in Figure 28. Good linearrelationships are obtained. The comparison of the theoretical loads andthe values estimated from experiment is given in Table VII.
The application of the same techniques for the interpretation of the 20instability results of flat plates is also feasible. Timoshenko and Geredetermined a linear relationship similar to equation (14) for plates inwhich there is no midplane stretching. The initial deflection must besmall in comparison to the plate thickness. The fourth-order differentialequation of equilibrium is
45
8O
600
70
40
30
20 1 V
30 I .J
0 10 20 30 40 50
Ratio of wave depth to shear load
Strip DGLI, 150 - 1-1/2-in. width (w/S plotted from 0 as zero).Strip DGLI, 157 - 1-1/4-in. width (w/S plotted from 10 as zero).Strip DGLI, 156 - 1-in. width (w/S plotted from 10 as zero).Strip DGLI, 155 - 3/4-in. width (w/S plotted from 20 as zero).Strip DGLI, 154 - 1/2-in. width (w/S plotted from 30 as zero).
Figure 28. Determination of Critical Load From Gough and CoxData on Thin Strips Under Shear (from Reference 18).
46
1
TABLE VIIo DETAILS OF STRIPS TESTED AND MEASURED VALUE OF WAVE DEPTH*
Reference markof strip DGLI 154 DGLI 155 DGLI 156 DGLI 157 DGLI 150
Width (in.) 1/2 3/4 1 1 1/4 1 1/2
Length (in.) 10 15 20 25 30
Thickness (in.) 0.0126 0.0126 0.0126 0.0126 0.0126
Theoretical buck-ling load (tons) 16.3 10.9 8.2 6.5 5.4
Buckling loadestimated from ll.4 6.65 6.86 5.29wave-depth read-ings (tons)
S estimatede - buckling load 1.045 .81 1.055 .98S theoretical
0 buckling load
Shear load (tons) Wave-Depth (deflection meter reading)*
0.2 0 0 0 0 -
0.25 - - - - 0
0.4 0 6 2 1 -
0.5 3 1 .. 1
1.6 1 7 5 2 -
0.75 - - - - 6M. 2 P 8 3-
1.0 3 1-2 10 4 10
1.2 6 14 14 6 -
1.25 - - 121.4 8 15 14 9 -
1 . 5 ....- 1 8
1.6 10 18 18 11 -
1.75 .... 20
1.8 12 20 21 12 -
2.0 16 21 24 14 25
47
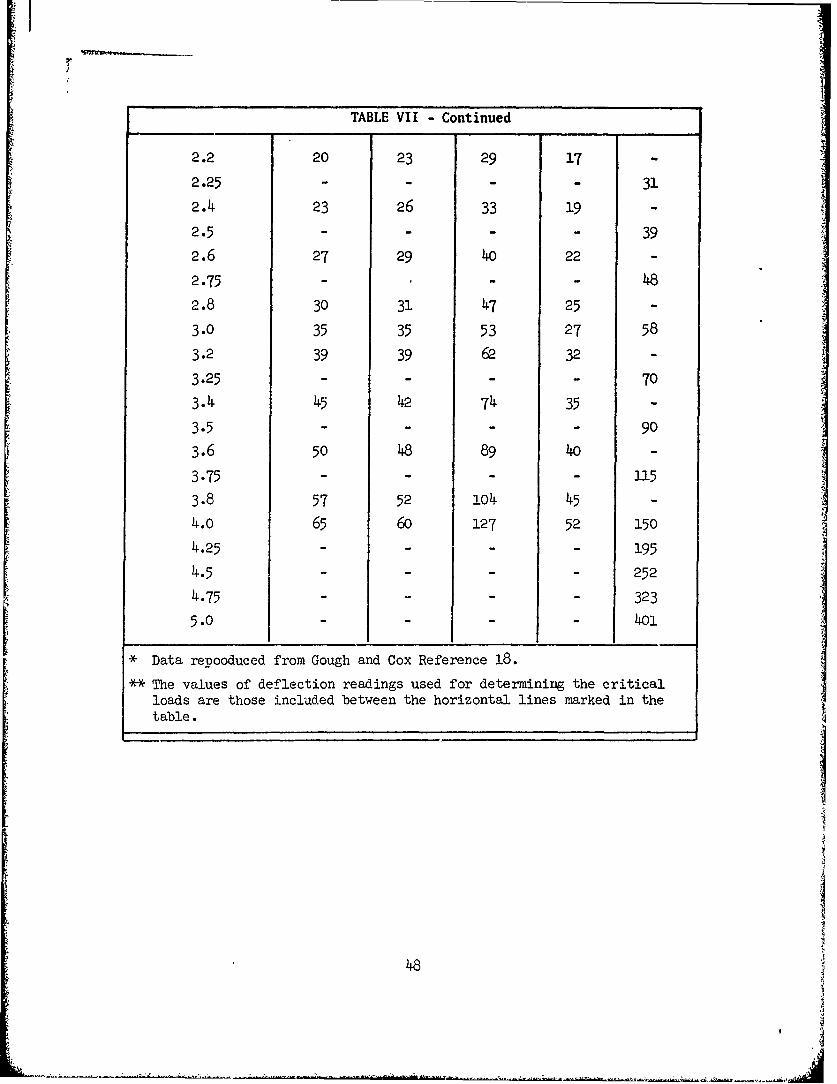
TABLE VII - Continued
2.2 20 23 29 17 -
2.25 - - - - 31
2.4 23 26 33 19 -
2.5 - - - - 39
2.6 27 29 40 22 -
2.75 - - - 48
2.8 30 31 47 25 -
3.0 35 35 53 27 58
3.2 39 39 62 32 -
3.25 - - - - 70
3.4 45 42 74 35 -
3.5 - - - - 903.6 50 48 89 40 -
3.75 - - - - 115
3.8 57 52 1o4 454.o 65 60 127 52 150
4.25 - - - - 195
4.5 - - - 252
4.75 - - - 323
5.0 - - - 4o
* Data repooduced from Gough and Cox Reference 18.
** The values of deflection readings used for determining the criticalloads are those included between the horizontal lines marked in thetable.
48
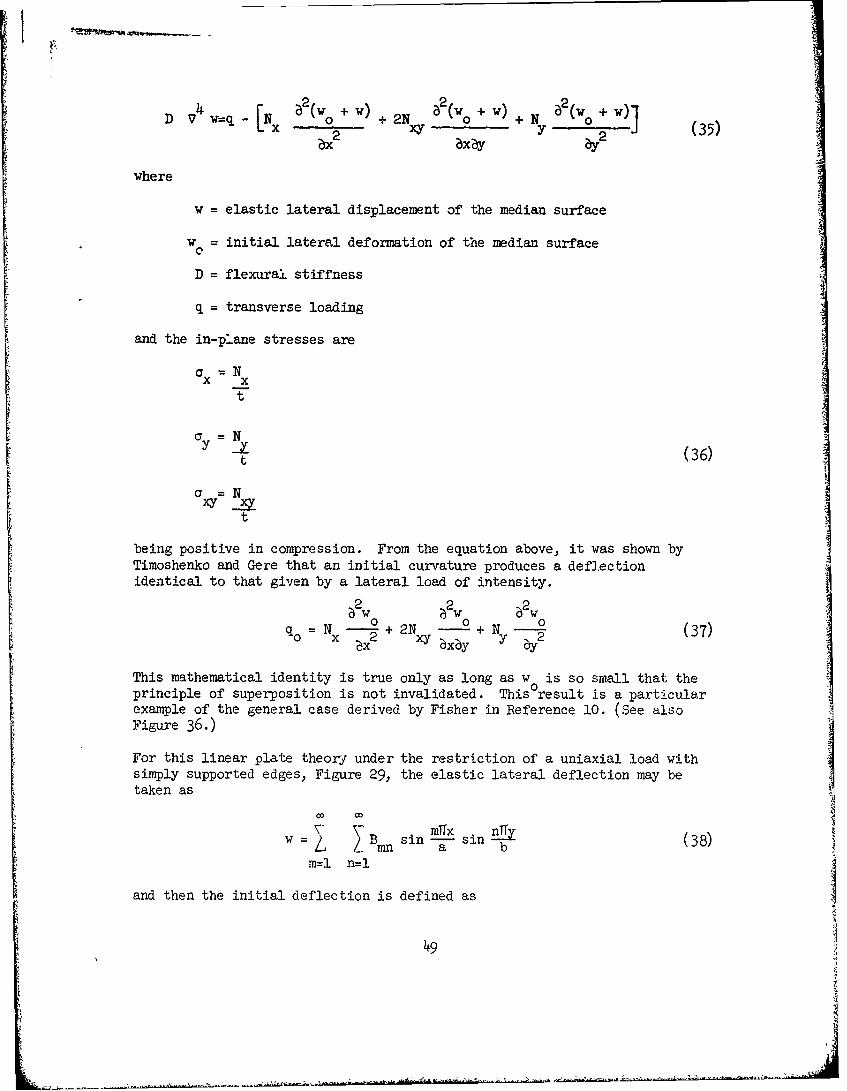
V w) [N W2 ) ?21~ ( ) (W + )J2 (35)
where
w = elastic lateral displacement of the median surface
w = initial lateral deformation of the median surface0
D = flexural stiffness
q = transverse loading
and the in-plane stresses are
Ox= NXt
a(36)t
a =NYy XYt
being positive in compression. From the equation above, it was shown byTimoshenko and Gere that an initial curvature produces a deflectionidentical to that given by a lateral load of intensity.
2 w 2w 62w0 0 0qo = Nx-2 + 2N +Ny y (37)x Y xby y 61
This mathematical identity is true only as long as w is so small that theprinciple of superposition is not invalidated. This result is a particularexample of the general case derived by Fisher in Reference 10. (See alsoFigure 36.)
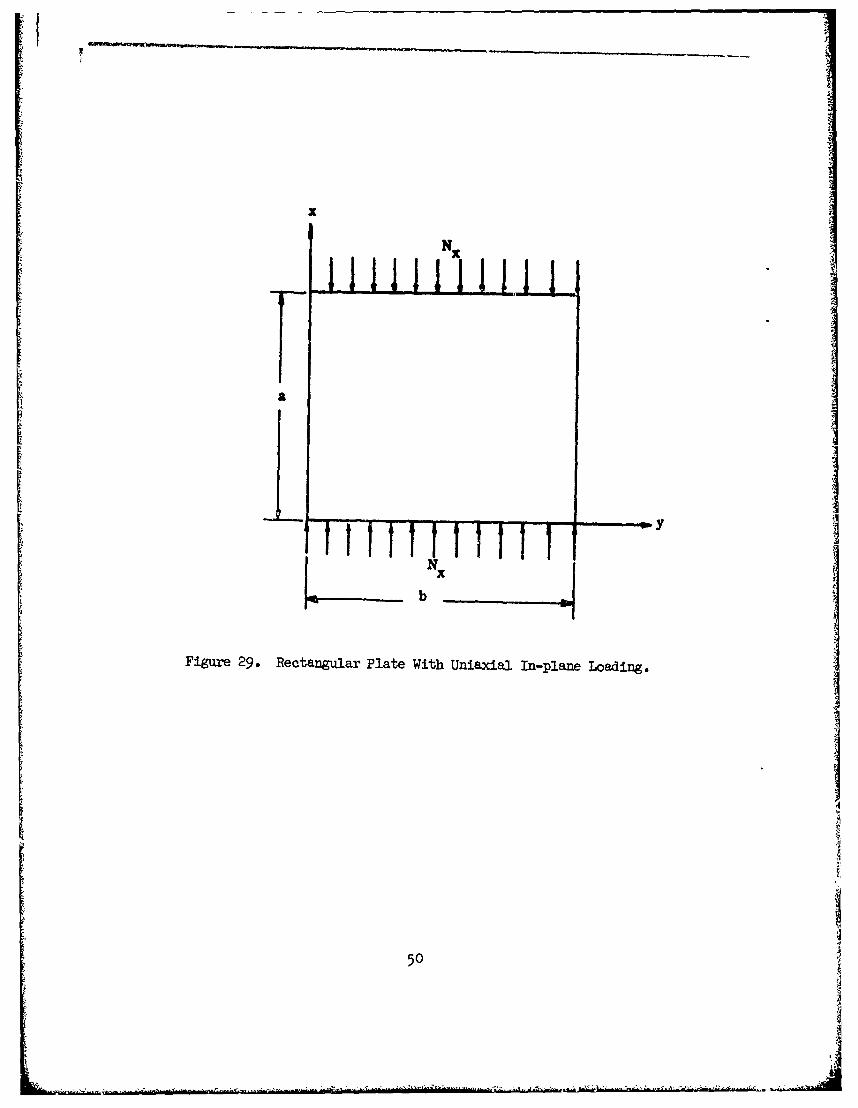
For this linear plate theory under the restriction of a uniaxial load withsimply supported edges, Figure 29, the elastic lateral deflection may betaken as
wI= Ba sin m-X sin n Y (38)
m=l n=l
and then the initial deflection is defined as
49
x
N•
a
b
Figure 29. Rectangular Plate With Uniaxial In-plane Loading.
I
: l~l,-" , , .... , ', ., ., .. :i- . '°i i ' " ..... ."' - -- "."' ' ... . . . ,, . , . :_ ..50 :.
W , , OSflrx l (39)a b
: m~-l -i=l
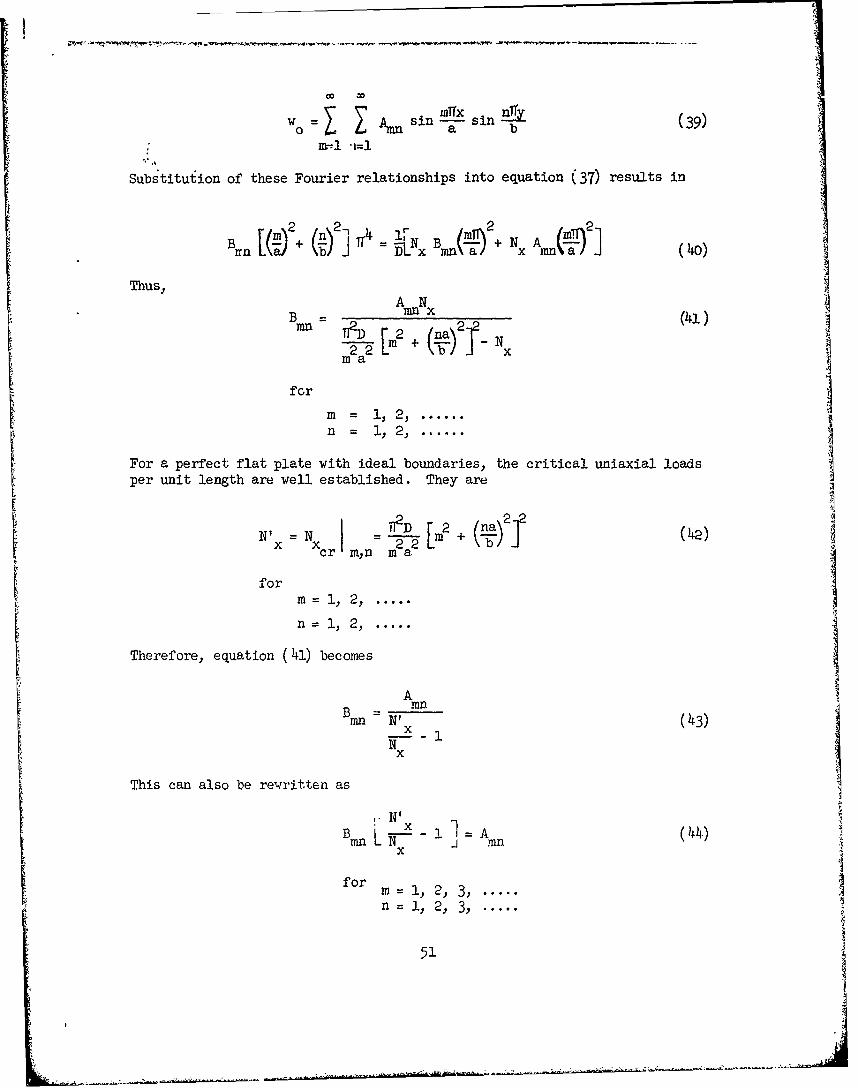
Substitution of these Fourier relationships into equation (37) results in
B [ = 'Nx Br(n x ] (+N)
Thus,
B ra l.x (41)"'= 1D [M2+ (na\
form =1l,2,.......
n = ,2. ......
For a perfect flat plate with ideal boundaries, the critical uniaxial loadsper unit length are well established. They are
N' N I E- _+ (42)x Xcr mn m a
for m =1, 2.....
n = 1, 2,.....
Therefore, equation (41) becomes
Amn
n N' (43)N
This can also be rewritten as
N'BA (44) '
Brn LN J %
for 1n = 1, 2, 3,.....
n=i,2,3 .....
51
j
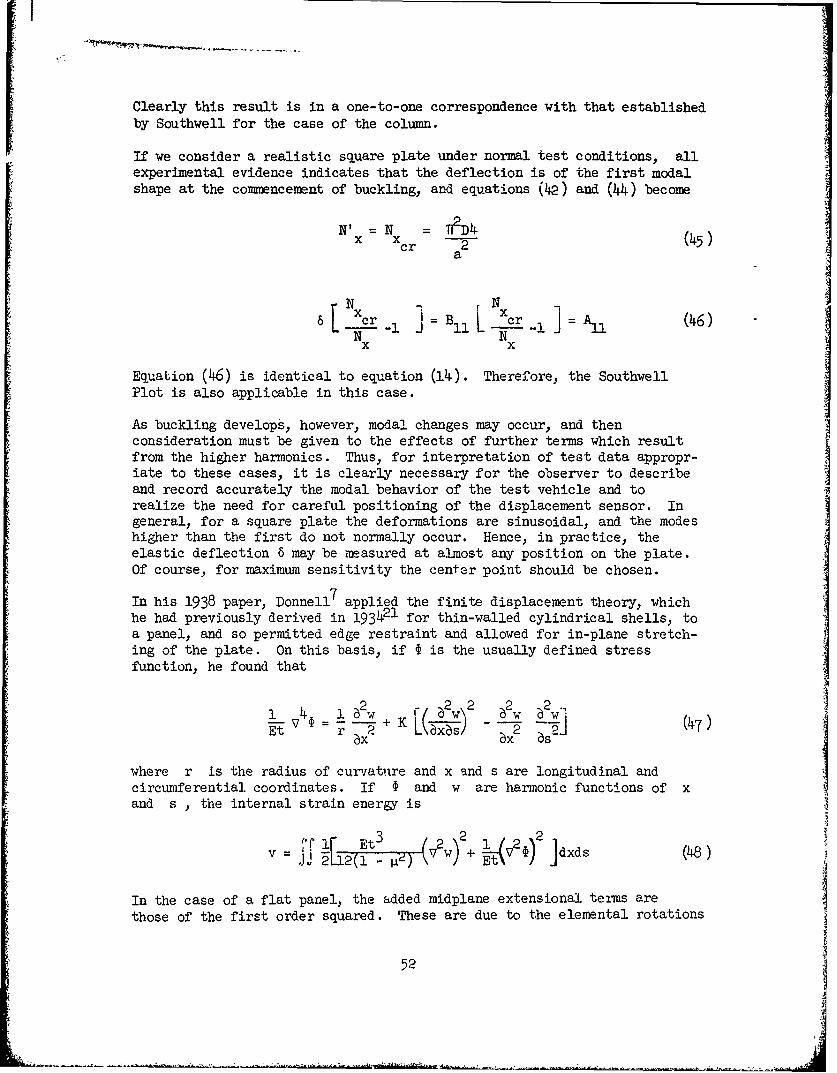
Clearly this result is in a one-to-one correspondence with that establishedby Southwell for the case of the column.
If we consider a realistic square plate under normal test conditions, allexperimental evidence indicates that the deflection is of the first modalshape at the commencement of buckling, and equations (42) and (44) become
N' = N = TD4x X 2 (45)a
--xcr-1 ]= Bll Lxcr ]=All (46)
x x
Equation (46) is identical to equation (14). Therefore, the SouthwellPlot is also applicable in this case.
As buckling develops, however, modal changes may occur, and thenconsideration must be given to the effects of further terms which resultfrom the higher harmonics. Thus, for interpretation of test data appropr-iate to these cases, it is clearly necessary for the observer to describeand record accurately the modal behavior of the test vehicle and torealize the need for careful positioning of the displacement sensor. Ingeneral, for a square plate the deformations are sinusoidal, and the modeshigher than the first do not normally occur. Hence, in practice, theelastic deflection 6 may be measured at almost any position on the plate.Of course, for maximum sensitivity the center point should be chosen.
In his 1938 paper, Donnell7 applied the finite displacement theory, whichhe had previously derived in 193421 for thin-walled cylindrical shells, toa panel, and so permitted edge restraint and allowed for in-plane stretch-ing of the plate. On this basis, if is the usually defined stressfunction, he found that
1 4+ 2 W ,; 4 2 2a w 21-v = --L + K - - (47)ET r 2 (47)
where r is the radius of curvature and x and s are longitudinal andcircumferential coordinates. If and w are harmonic functions of xand s , the internal strain energy is
v JL 2 ( w E&w)2 ]dxds (48)
In the case of a flat panel, the added midplane extensional terms are
those of the first order squared. These are due to the elemental rotations
52
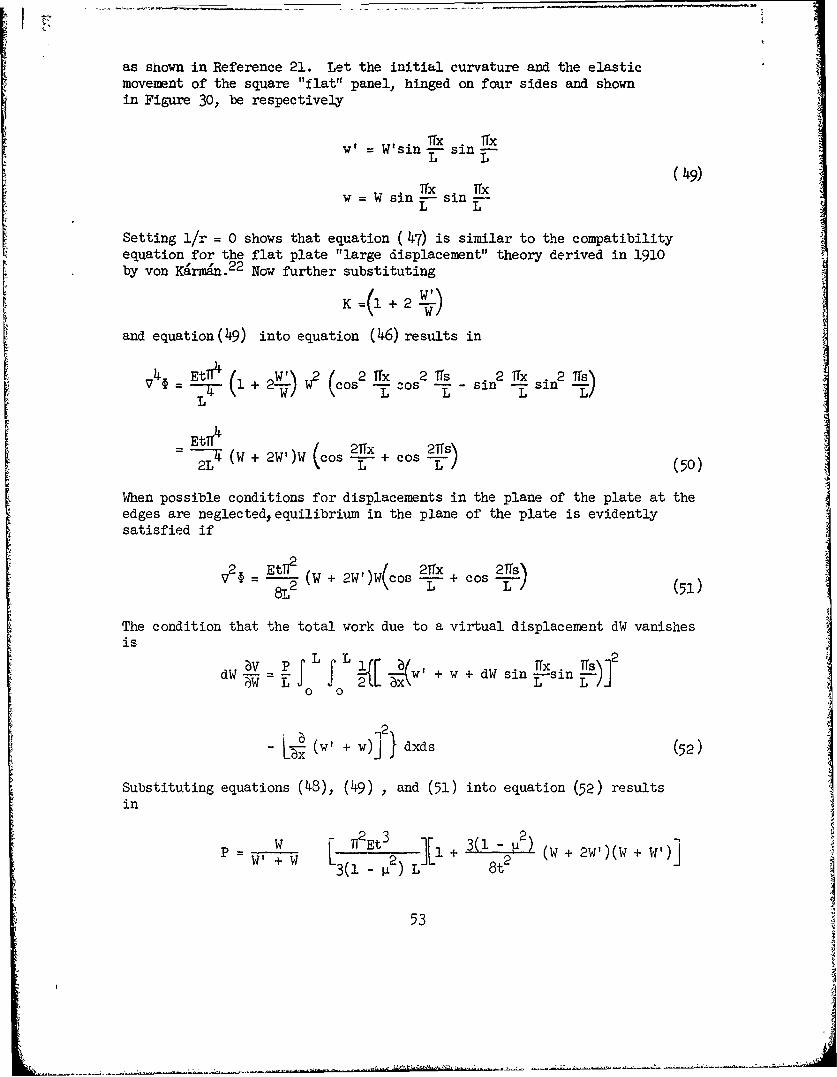
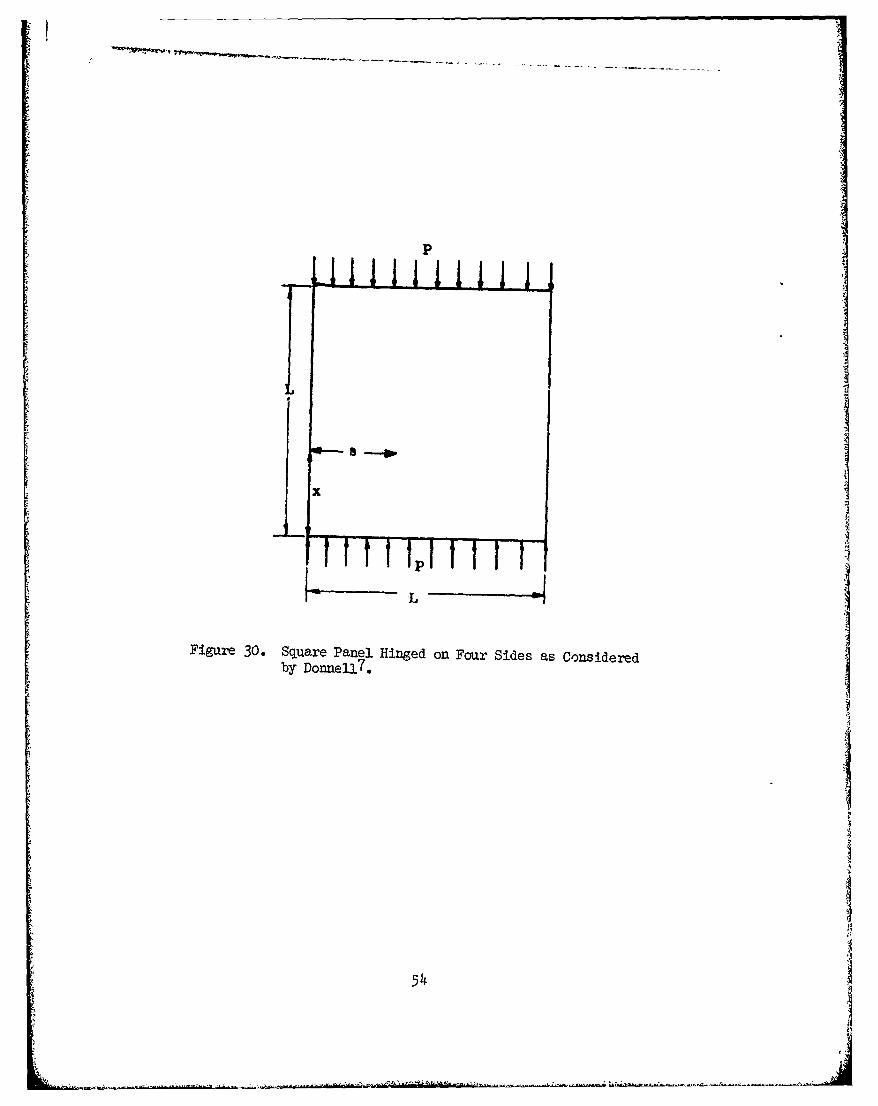
as shown in Reference 21. Let the initial curvature and the elasticmovement of the square "flat" panel, hinged on four sides and shownin Figure 30, be respectively
w' = W'sin E- sin "K
L L(49)
T x Trxw = W sin - sin
=" L L
Setting 1/r = 0 shows that equation (47) is similar to the compatibilityequation for the flat plate "large displacement" theory derived in 1910by von K~rman.2 2 Now further substituting
K =(l + 2 w
and equation( 4 9) into equation (46) results in
4@ =Et + (cos2- f 2 s 2TTx TS
(t19 + 2W'2f T x -os - sin -L sinL L
Etnr'--~ r w+ ,w(cos 2Tfx +cs2T sIL( + cos L L (50)
When possible conditions for displacements in the plane of the plate at theedges are neglected, equilibrium in the plane of the plate is evidentlysatisfied if
V2 -t (W + 2W')W cos 2rx + cos 2T()8-T,2 L o (51)
The condition that the total work due to a virtual displacement dW vanishesis
dW 7-- f x\w + w + dW sin i-sin2WL 6Lx\ L L0 0
- L (w' + w)j }dxds (2
Substituting equations (48), (49) , and (51) into equation (52) resultsin
P = W [ +lWEt 3 "[l+3(- 2) (W + 2W')(W+ W')j38t
53
- - !
-- lop ~ -
P
1
Figure 30. Square Panel Hinged on Four Sides as Consideredby Donnell7.
54
1
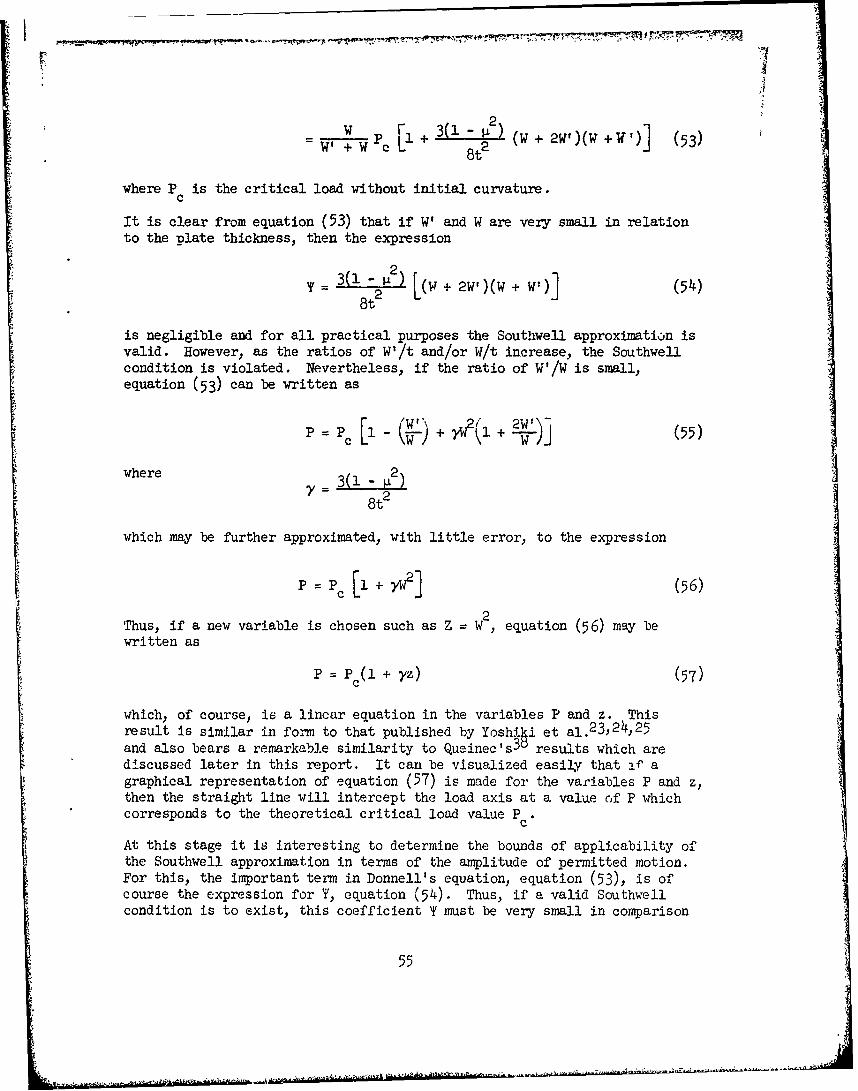
W P r +3(1i (W + 2W,)(w + V,)] (53)
where P is the critical load without initial curvature.c
It is clear from equation (53) that if W, and W are very small in relationto the plate thickness, then the expression
= 3( 1 - ) L(w + 2W,)(W + W:)] (54)
8t2
is negligible and for all practical purposes the Southwell approximation isvalid. However, as the ratios of W'/t and/or W/t increase, the Southwellcondition is violated. Nevertheless, if the ratio of W'/W is small,equation (53) can be written as
where 3(l - 2
8t2
which may be further approximated, with little error, to the expression
P P c[1 + W2] (6
Thus, if a new variable is chosen such as Z = W2, equation (56) may bewritten as
P = Pc(l + yz) (57)
which of course is a linear equation in the variables P and z. Thisresult is similar in form to that published by Yoshi~i et al.23,24,25and also bears a remarkab.e similarity to Queinec's 3° results which arediscussed later in this report. It can be visualized easily that if agraphical representation of equation (57) is made for the variables P and z,then the straight line will intercept the load axis at a value 6f P whichcorresponds to the theoretical critical load value Pc"
At this stage it is interesting to determine the bounds of applicability ofthe Southwell approximation in terms of the amplitude of permitted motion.For this, the important term in Donnell's equation, equation (53), is ofcourse the expression for T, equation (54). Thus, if a valid Southwellcondition is to exist, this coefficient Y must be very small in comparison
55
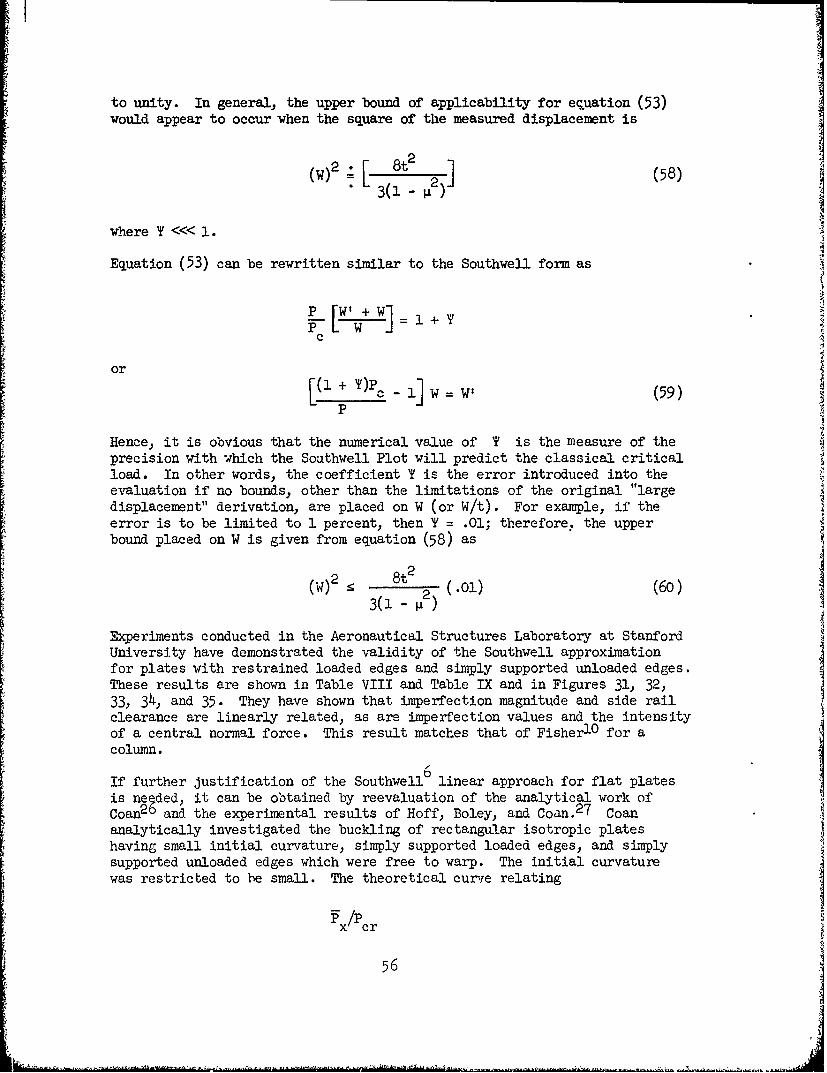
to unity. In general, the upper bound of applicability for equation (53)would appear to occur when the square of the measured displacement is
[ 8t 2 (58)3( g)
where T <<< 1.
Equation (53) can be rewritten similar to the Southwell form as
P rW' + w1+
or
[ + w 1 (59)P
Hence, it is obvious that the numerical value of T is the measure of theprecision with which the Southwell Plot will predict the classical criticalload. In other words, the coefficient T is the error introduced into theevaluation if no bounds, other than the limitations of the original "large
displacement" derivation, are placed on W (or W/t). For example, if theerror is to be limited to 1 percent, then T = .01; therefore. the upperbound placed on W is given from equation (58) as
2 8t2(W)2 2 (.01) (60)
3(1 - g 2
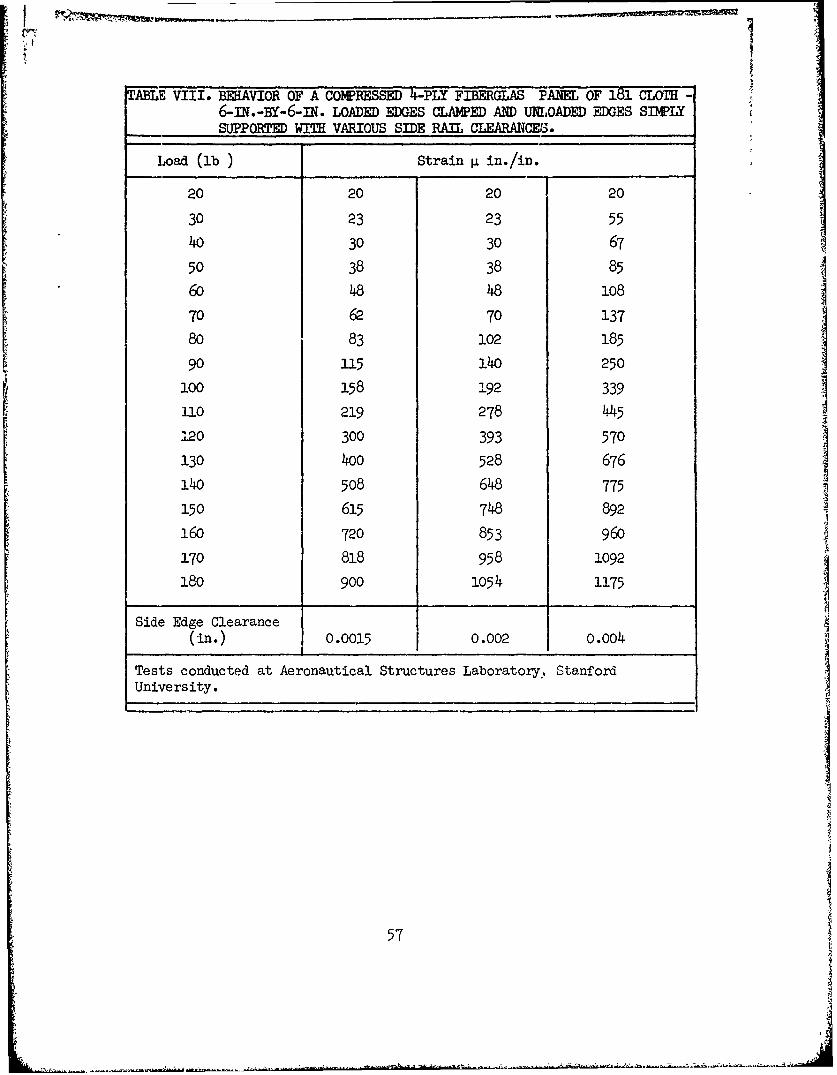
Experiments conducted in the Aeronautical Structures Laboratory at StanfordUniversity have demonstrated the validity of the Southwell approximationfor plates with restrained loaded edges and simply supported unloaded edges.These results are shown in Table VIII and Table IX and in Figures 31, 32,33, 34, and 35. They have shown that imperfection magnitude and side railclearance are linearly related, as are imperfection values and the intensityof a central normal force. This result matches that of FisherlO for acolumn.
If further justification of the Southwell0 linear approach for flat plates
is ne ded, it can be obtained by reevaluation of the analytical work ofCoan29 and the experimental results of Hoff', Boley, and Coan.
2 7 Coananalytically investigated the buckling of rectangular isotropic plates
having small initial curvature, simply supported loaded edges, and simplysupported unloaded edges which were free to warp. The initial curvaturewas restricted to be small. The theoretical cure relating
Px/Pcr
56
_ _ _ _ _ _ _ _ _ _ _ _ _ _ _ _ _ _ _
TABLE VIII. BEHAVIOR OF A COMPRESSED 4-PLY FIBERGLAS PANEL OF 181 CLOTH -
6-IN.-BY-6-IN. LOADED EDGES CLAMPED AND UmOADED EDGES SIMPLYSUPPORTED WITH VARIOUS SIDE RAIL CLEARANCES.
Load (lb) Strain g in./in,
20 20 20 20
30 23 23 55
40 30 30 67
50 38 38 85
60 48 48 108
70 62 70 137
80 83 102 185
90 115 140 250
100 158 192 339
110 219 278 445
2o 300 393 570
130 400 528 676
140 508 648 775
150 615 748 892
16o 720 853 960
170 818 958 1092
180 900 1054 1175
Side Edge Clearance(in.) 0.0015 0.002 0.004
Tests conducted at Aeronautical Structures Laboratory, StanfordUniversity.
57
-..- '-- '.--
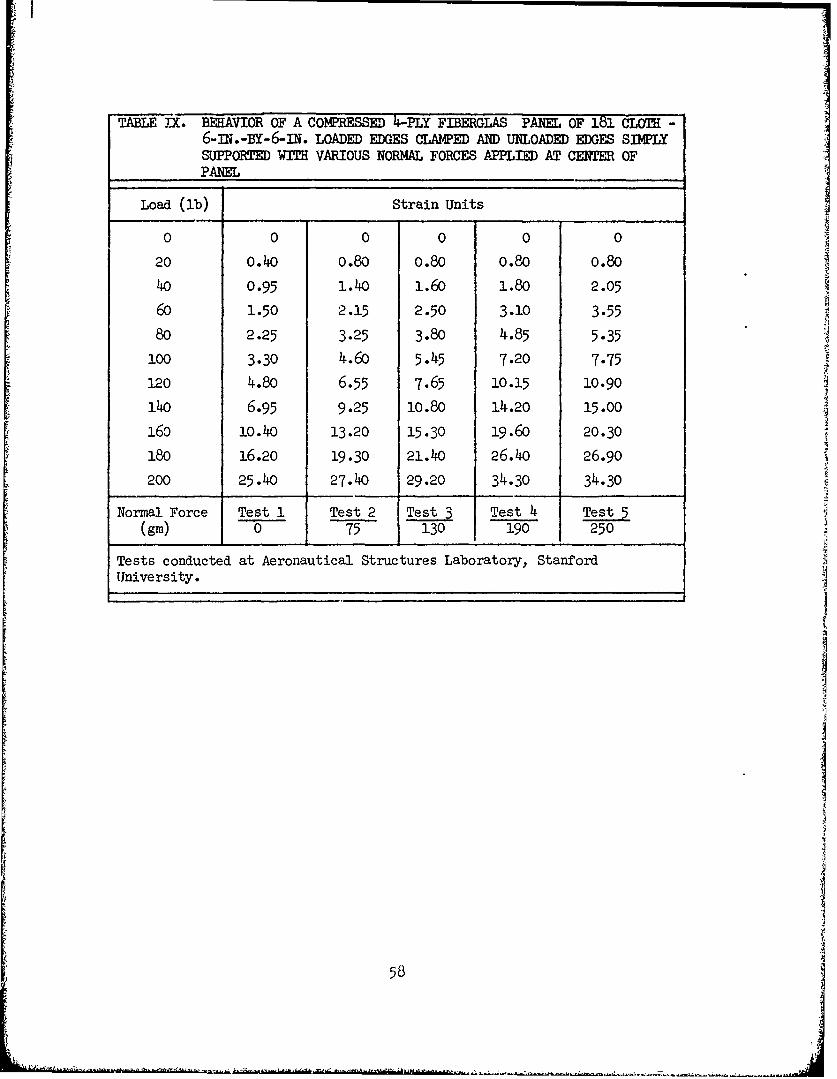
TABLE IX. BEHAVIOR OF A COMPRESSED 4-PLY FIBERGLAS PANEL OF 181 CLOTH-6-iN.-BY-6-IN. LOADED EDGES CLAMPED AND UNLOADED EDGES SIMPLYSUPPORTED WITH VARIOUS NORMAL FORCES APPLIED AT CENTER OFPANEL
Load (Ib) Strain Units
0 0 0 0 0 0
20 0.40 0.80 0.80 0.80 0.80
40 0.95 1.40 1.60 1.80 2.05
60 1.50 2.15 2.50 3.10 3.55
80 2.25 3.25 3.80 4.85 5.35
100 3.30 4.60 5.45 7.20 7.75
12o 4.80 6.55 7.65 10.15 10.90
140 6.95 9.25 10.80 14.20 15.00
160 10.40 13.20 15.30 19.60 20.30
18o 16.20 19.30 21.40 26.40 26.90
200 25.40 27.40 29.20 34.30 34.30
Normal Force Test 1 Test 2 Test 3 Test 4 Test 5(gm) 0 75 130 190 250
Tests conducted at Aeronautical Structures Laboratory, StanfordUniversity.
58
A. 0
42 4)rd-a C a)
0I D
P40
Cu 0 If(Y
00 0-I O
4-'
rd2
cy,
CLut- (Irz
59
((000
.H 0 (~0 d0 10
HC0F0 oo "
0 0
0 f-0
(Y) Fx4-
o Ux,
600
2OO,
80
ISO-
160
140 2
I 4
-5120/
100 IP,
60 j
40-
20
60
0 I I I I I I I I I I n I
0 2 4 6 8 10 12 14 16 18 20 22 24 26 28 0 30 34
Bending strain s
Figure 33. Buckling Tests of Fiberglasl Panels With Various Values
of Normal Force Conducted at Stanford University.
61S('
3.5
3&0
2.5-
2.0-
I5 4
.22
62
mo aoj: Twa~ox
0 ~ 0 0 0 0 0 00 0040 N 000 0v N
0 to
0 4)
0 f%0P4
-0
T~
-P) Cd :
di d~
0
t0 0 0X
1EH H - 0
63 0
stud Kc, Figure 4 or Reference 26, where
P = average compressive load
Pcr = critical load for a perfect plate
Kc = elastic deformation at the plate center divided by theplate thickness,
was used to obtain the data listed in Table X. This information has beenplotted in the Southwell manner and is shown in this form in Figure 36.The resulting straight line has an inverse slope of
Kc = P = x o.96 (61)
c Pcrp
which is within 4 percent of the classical relationship.
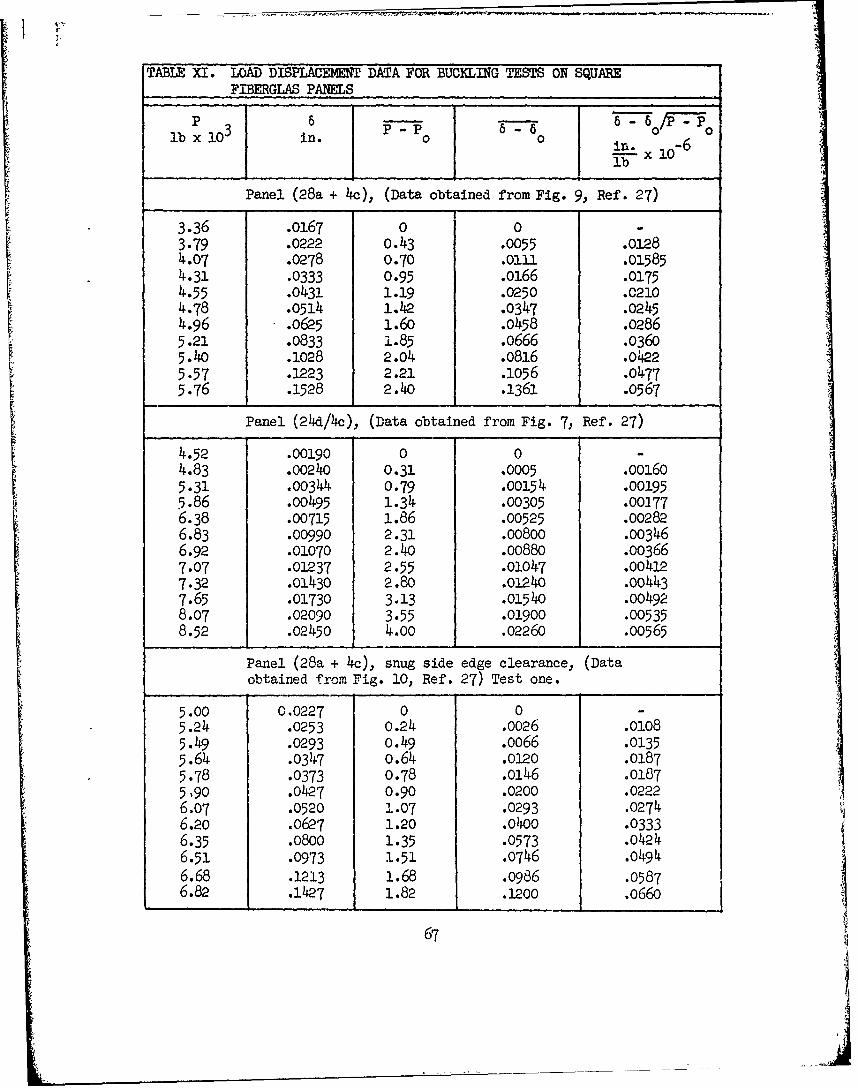
In the experimental work of Hoff, Boley, and Coan., "flat" fiberglas:-plates were buckled. Lateral deflections and strains of the plates weremeasured and load-deflection curves as well as load-strain curves wereshown. Some of the data from Figures 6, 7, 9, and 10 of the report areshown in Tables XI and XII. These data were recast in the Southwell manner
and plotted in Figures 37, 38. and 39.
This technique can be applied also to the case of a biaxially loaded plate.The dimensions and coordinates are shown in Figure 40. The equilibriumequation which holds true under the assumption of a Hookean homogeneous,isotropic, and perfectly flat plate is
4 2wDv w- N 2 -- (62)
when the effect of an initial deformation, w0, is included, this equationbecomes
4 6 2 y2 2WDV w= N e Wjy 2 0 + ] (6.3)
For a simply supported plate where the biaxial forces Nx and N are uni-formly applied in the plane of the middle surface, the appropriate elasticdeflection is
w ' - mnSln ET sin nTly (64)=_ am bm=l n=l
64
i' ' :, ,M-., =,,. ', ,t~ r"" '':=t '"°B 'F 'k" r " ,''- -i -' ': ""l '; i ' ='' '" "'%'|': :? " " ' " " : '"" ' ' < I
om
844
" ,
0
P-1
4-)
654a
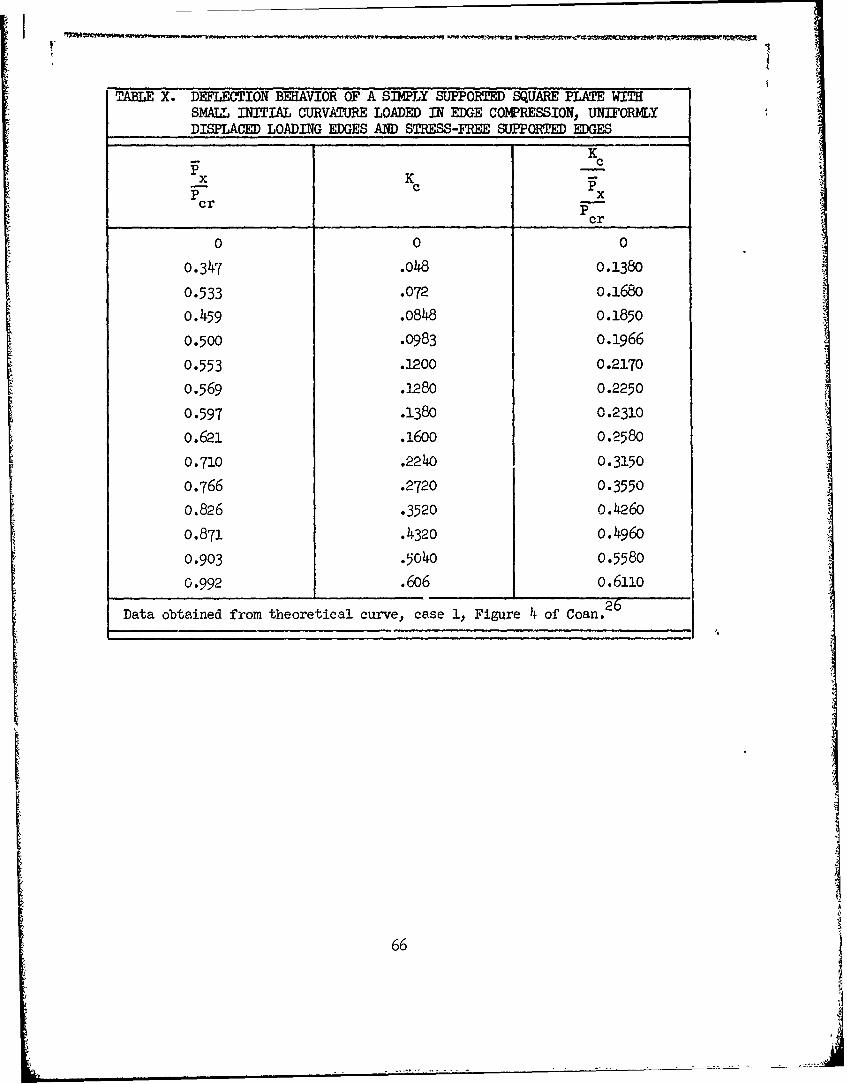
TABLE X. DEFLECTION BEHAVIOR OF A SIMLY SUPPORTED SQUARE PLATE WITHSMALL INITIAL CURVATURE LOADED IN EDGE COWPRESSION, UNIFORMLYDISPLACED LOADING EDGES AND STRESS-FREE SUPPORTED EDGES
KC
x Kp xcr
cr
0 0 0
0.347 .048 0.138o
0.533 .072 0.1680
0.459 .0848 o.1850
0.500 .0983 0.1966
0.553 .1oo 0.2170
0.569 .i280 0.2250
0.597 .1380 0.23100.621 .16oo 0.25800.710 .224o 0.3150
0.766 .2720 0.3550
0.826 .3520 O.4260
o.871 .4320 0.4960
0.903 .5o4o 0.5580
0.992 .606 o.611o
Data obtained from theoretical curve, case 1, Figure + of Coan. 2 6
66 J"
~I
TABLE XI. LOAD DISPLACEMENT DATA FOR BUCKLING TESTS ON SQUAREFIBERGLAS PANELS
P 36 r- v 0 /F' o
lb x 10 in. 0 i
Panel (28a + 4c), (Data obtained from Fig. 9, Ref. 27)
3.36 .0167 0 0 -3.79 .0222 0.43 .0055 .01284.07 .0278 0.70 .0111 015854.31 .0333 0.95 .0166 .01754.55 .0431 1.19 .0250 .02104.78 .0514 1.42 .0347 .02454.96 .0625 1.60 .0458 .02865.21 .0833 1.85 .0666 .03605.4o .1028 2.04 .816 .04225.57 .1223 2.21 .1056 .x4775.76 .1528 2.40 •1361 .0567
Panel (24d/4c), (Data obtained from Fig. 7, Ref. 27)
4.52 .00190 0 0 -4.83 .00240 0.31 .0005 .001605.31 .00344 0.79 .00154 .001955.86 .00495 1.34 .00305 .00]776.38 .00715 1.86 .00525 .002826.83 .00990 2.31 .00800 .003466.92 .01070 2.40 .00880 .003667.07 .01237 2.55 .01047 .004127.32 .01430 2.80 .01240 .04437.65 .01730 3.13 -01540 .004928.07 .02090 3.55 .01900 .005358.52 .0245o 4.00 .0226o .00565
Panel (28a + 4c), snug side edge clearance, (Dataobtained from Fig. 10, Ref. 27) Test one.
5.00 0,0227 0 05.24 .0253 0.24 .0026 .olo85.49 .0293 0.49 .0066 .01355.64 •0347 o.64 .0120 .01875.78 •0373 0.78 .0146 .01875,90 .0427 0.90 .0200 .02226.07 .0520 1.07 .0293 .02746.20 .0627 1.20 .0400 .03336.35 .0800 1.35 .0573 .04246.51 .0973 1.51 .0746 .0494
6.68 .1213 1.68 .0986 .05876.82 .1427 1.82 .1200 .0660
67
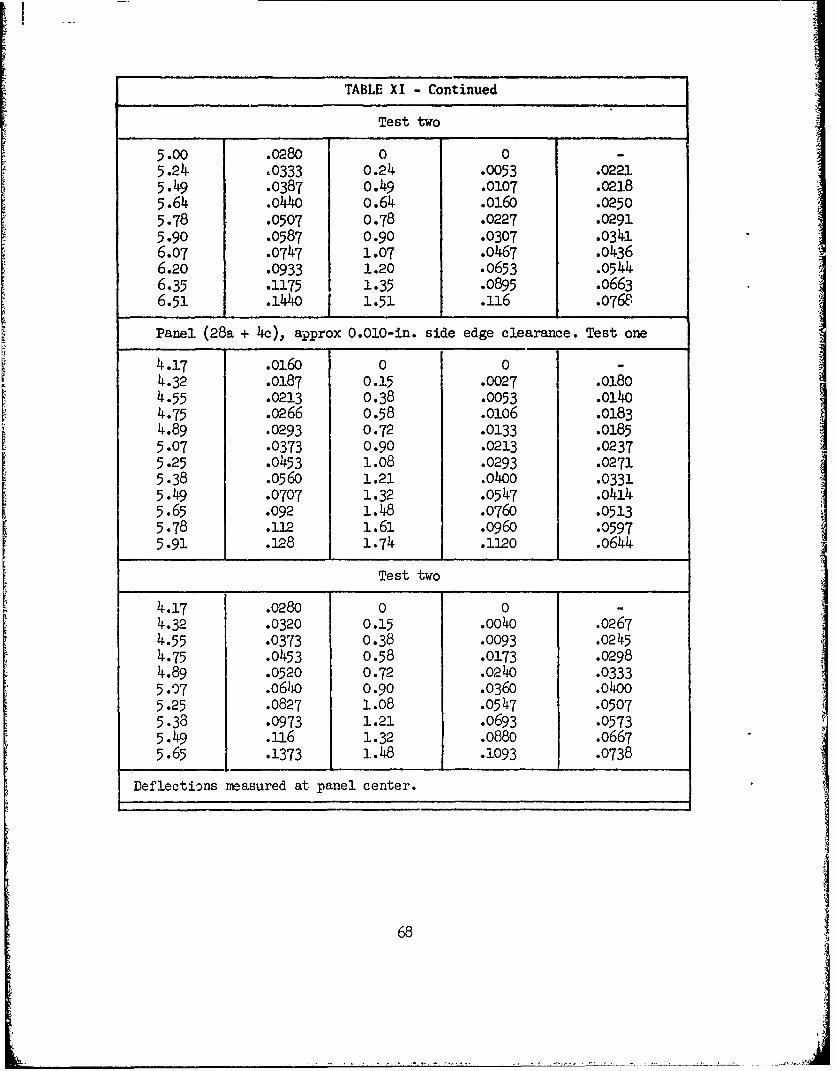
TABLE XI - Continued
Test two
5.00 .0280 0 05.24 -0333 0.24 .0053 .02215.49 .0387 0.49 .0107 .2185.64 .o44o 0.64 .0160 .02505.78 .0507 o.78 .0227 .02915.90 .0587 0.90 .0307 .03416.07 .0747 1.07 .0467 .04366.20 .0933 1.20 .o653 .05446.35 .1175 1.35 .0895 .06636.51 .1440 1.51 .116 .0768
Panel (28a + 4c), approx 0.010-in. side edge clearance. Test one
4.17 .0160 0 0 -4.32 .0187 0.15 .0027 .01804.55 .0213 0.38 .0053 .o14o4.75 .0266 0.58 .0106 .01834.89 .0293 0.72 .0133 .01855.07 .0373 0.90 .0213 .02375.25 .0453 1.08 .0293 .02715.38 .0560 1.21 .0400 .03315.49 .0707 1.32 .0547 .4145.65 .092 1.48 .0760 .05135.78 .112 1.61 .0960 .05975.91 .128 1.74 .1120 .0644
Test two
4.17 .0280 0 04.32 .0320 0.15 .0040 .02674.55 .0373 0.38 .0093 .02454.75 .0453 0.58 .0173 .02984.89 .0520 0.72 .0240 .03335.07 .6W0 0.90 .0360 .o4005.25 .0827 l.o8 .0547 .05075.38 .0973 1.21 .0693 .05735.49 .16 1.32 .0880 .6675.65 .1373 1.48 .1093 .0738
Deflections measured at panel center.
68
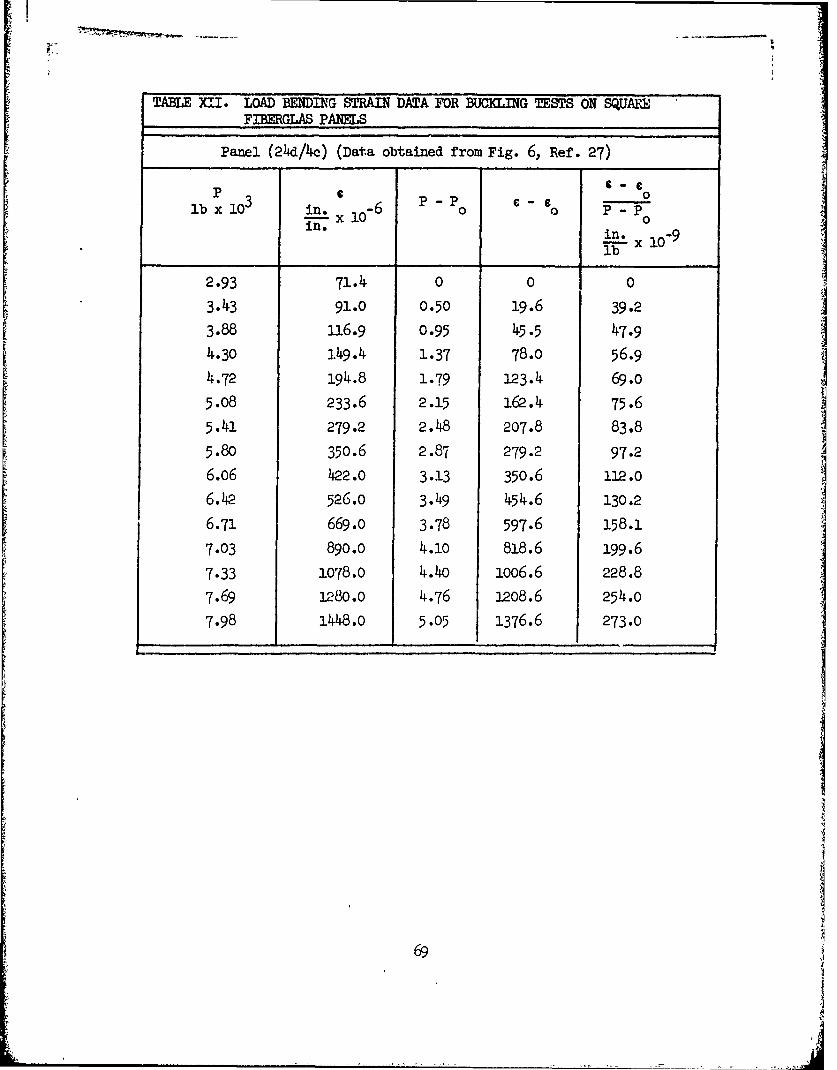
TANA XII. LOAD BENDING STRAIN DATA FOR BUCING TESTS ON SQUAREFIBERGLAS PANELS
Panel (214d/4c) (Data obtained from Fig. 6, Ref. 27)
P 3 6lb x l 3 in. x l0 - 6 0 a P - P0
in. in.lb
2.93 71.4 0 0 0
3.43 91.0 0.50 19.6 39.2
3.88 116.9 0.95 45.5 47.9
4.30 1.49.4 1.37 78.0 56.9
4.72 194.8 1.79 123.4 69.0
5.08 233.6 2.15 162.4 75.6
5.41 279.2 2.48 207.8 83.8
5.80 350.6 2.87 279.2 97.2
6.06 422.0 3.13 350.6 112.0
6.42 526.0 3.49 454.6 130.2
6.71 669.0 3.78 597.6 158.1
7.03 890.0 4.10 818.6 199.6
7.33 1078.0 4.40 1006.6 228.8
7.69 1280.0 4.76 1208.6 254.0
7.98 1448.0 5.05 1376.6 273.0
69
00'Cloo 1
Cd
T! C
0
P4
0co
-P-
CU
P-4
S -4
Cr)
9-() 0
70Xp.
AQ a J
to0 C8
0 0
c'o
10 0
c CHO
00H o w
C))
~~r a)Iq.
033
EC )
T, 0
171
300
250 0
CNf200
0xPO 150 crit
100
50
0
0 I I , I , a
0 200 400 600 800 1000 1200 1400
Bending strain e - eo -Iin
in.
Figure 39. Southwell-Type Plot for a Square Fiberglas Panel
(24d + 4c). Data Obtained From Figure 6 of Reference 27.
72
i
•-
NYA
a. ),
I;
4- -.
Nx
FigLure 40. Rectangular Plate With Biaxial In-plane Loading.
73
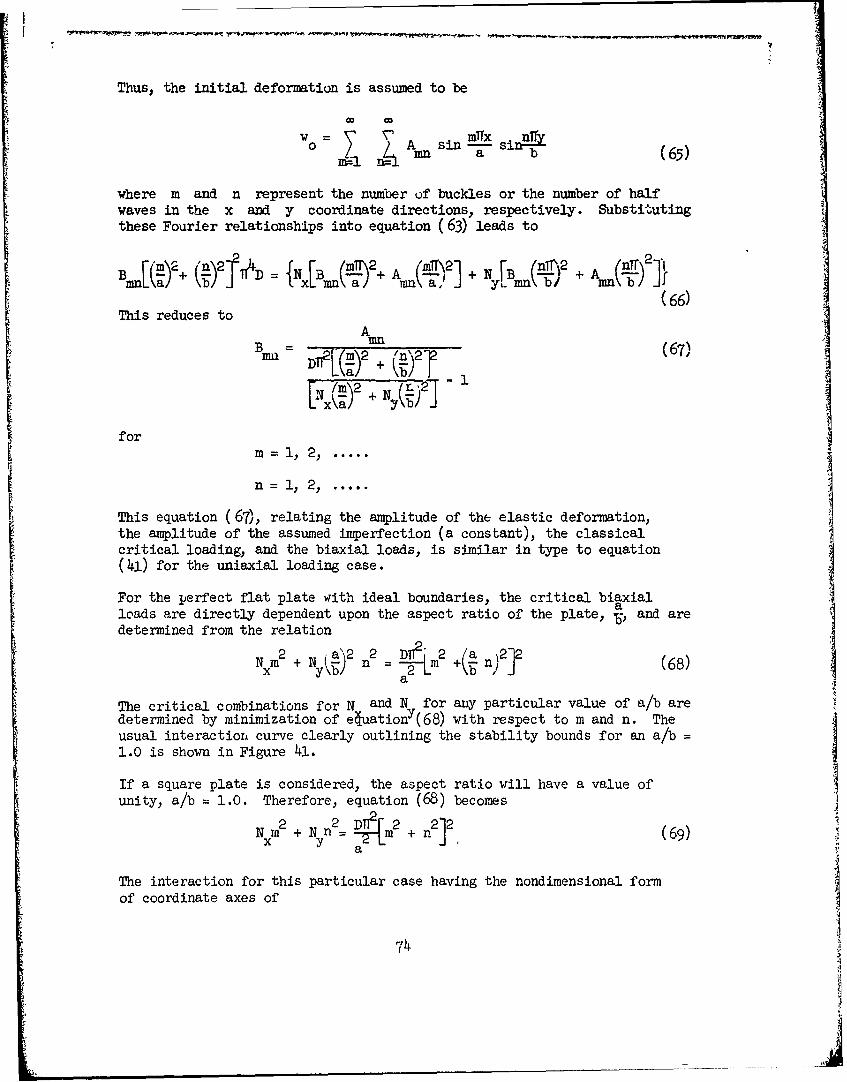
Thus, the initial deformation is assumed to be
w o A sinmTx n)y13 (65)
where m and n represent the number of buckles or the number of halfwaves in the x and y coordinate directions, respectively. Substitutingthese Fourier relationships into equation (63) leads to
)2 n-2-1J fx[3 (in2 (jn2] + N (IT 2
\bJ x~nnaI in a, yL inn bI inb,(66)
This reduces toA
B =m (67)
+ N - 1
form i1, 2, .....
n 12....
This equation (67), relating the amplitude of the elastic deformation,the amplitude of the assumed imperfection (a constant), the classicalcritical loading, and the biaxial loads, is similar in type to equation(41) for the uniaxial loading case.
For the perfect flat plate with ideal boundaries, the critical biaxialaloads are directly dependent upon the aspect ratio of the plate, B, and aredetermined from the relation
N Nm2 + a 2 n2 D +(2 n (68)x y2bb a
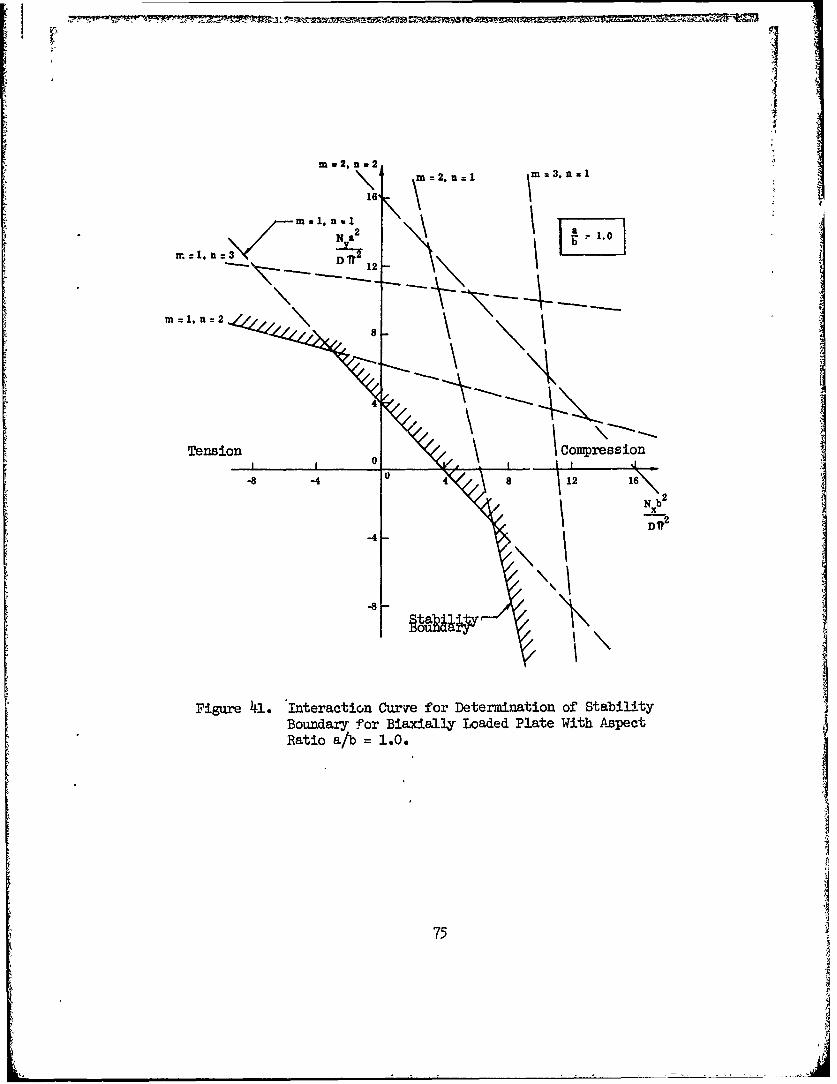
The critical combinations for N and N for any particular value of a/b aredetermined by minimization of e~uationY(68) with respect to m and n. The
usual interactiou curve clearly outlining the stability bounds for an a/b =
1.0 is shown in Figure 41.
If a square plate is considered, the aspect ratio will have a value ofunity, a/b = 1.0. Therefore, equation (68) becomes
2 2DTr2 22Nm n 2] (69)
a
The interaction for this particular case having the nondimensional form Iof coordinate axes of
74.1
mm 2, =2
Naa
12
m'W 1, nA1 2
4
Tension \Compression
-8 -4 0 4 8 12 16\b 2
N x
-8-
Figure 41. Interaction Curve for Determination of StabilityBoundary -for Biaxially Loaded Plate With AspectRatio a/b = 1.0.
75
r ',
Na2 N a2
XT and
is shown in Figure 41. From this graph, the classical critical loads canbe determined for particular biaxial load ratios. Thus, if the loadingratio
NK _x
y
is substituted into equation (69), the critical loading for a perfect platewould become ' -:DTF [r2 + n - 7?n( 2 + 1
N ~ f -D1 nt~ 2 (70o)cr r a [2 12 2 2Im + nJ IIn/RK+ -R
After substitution of this expression into equation (67), the elasticdeflection is I
A
cr 1
where N = N KN • This implies that the loading rate in the twodirections will mintain a constant proportionality. Transposing equation(71) results in
B Ncr 1 A AM (72)
for the particular m and n which correspond to Ncr obtained from Figure 41.
If the values of the total in-plane loads
P =N aX X
P =N ay y
are substituted into equation (72), we obtain
T - = (3P
Thus, once again the relationship between the variables of £he elasticdeformation and the load shows a direc, correspon.dence to the Southwellequation (14). The experimental work to check this derivation should
76
be completed in the very near future.
In the analysis performed above, the imperfection of the plate was con-sidered to be an initial deformation whose shape was similar to the expect-ed buckle mode. An alternate manner in which to consider the imperfectionis to suppose that an additional transverse load is applied at some pointon the plate. This technique has received attention by Loo and Evan-Iwanowski28 in the experimental study of instability of spherical caps.Their work is discussed in our paper on shells.29 It is, of course,validated by the tests of Fisher and by the tests reported here on panels.
Turner, Martin, and Weike1031 numerically examined a biaxially loadedplate with such an added normal force. Their compute ' results are listedin Table XIII and depicted graphically in Figure 42. These computedpoints are essentially collinear. This result tends to give credence tothe suggestion that a knowledge of the nature of the basic imperfectionis not of importance if it is desired merely to confirm the theory forperfect bodies. It is obviously of importance in the compilation of datadesigned to help in the formulation of practical theories of real struct-ures.
Real structures, of course, are very rarely subjected to uniformly dis-tributed loadings or restrained in the simple manner considered so far.Walker 32 has made a substantial effort to consider flat plates underconditions which more closely approximate those encountered in actuality.His study has been directed toward the establishment of a stability theory
'for plates axially compressed by nonuniformly distributed load. In theanalysis performed, a wide range of possible boundary conditions was taken
into account. The theoretica3 treatment was evaluated in the laboratory. Thetests which were performed and reported in the given reference appear tobe very thorough, well conducted tests. In the analysis of the data derived,Walker demonstrated that a linear relationship existed between 8 and 6/P,but he offered no analysis to confirm that this was so. Typical resultsare given in Figure 43. In presenting the results, the author pointed outthat the correlation of the theoretical critical load value and the insta-bility level predicted from the analysis of the test is very good. Thiscan be seen from the graphs in Figure 44.
However, it must be admitted that while flat plates do play an importantpart in everyday structures, generally, conditions are more complex. Inaeronautics, combinations of plate and column (Usually called a stringerin this application) are frequently met. The testing of components of thistype is fraught wit 3all the difficulties of the simpler cases. Eamberg,McPherson, and Levy have carried out an experimental study of this problem.In their analysis of the test data, they applied a Southwell-type plot. Theydemonstrated, as is clearly seen in Figures 45 through 48, that it gave goodresults for stringers attached to sheets, irrespective of their failing mode.They were unable to apply the process to the sheet between stringers due tothe lack of appropriate data prior to the instability value.
77
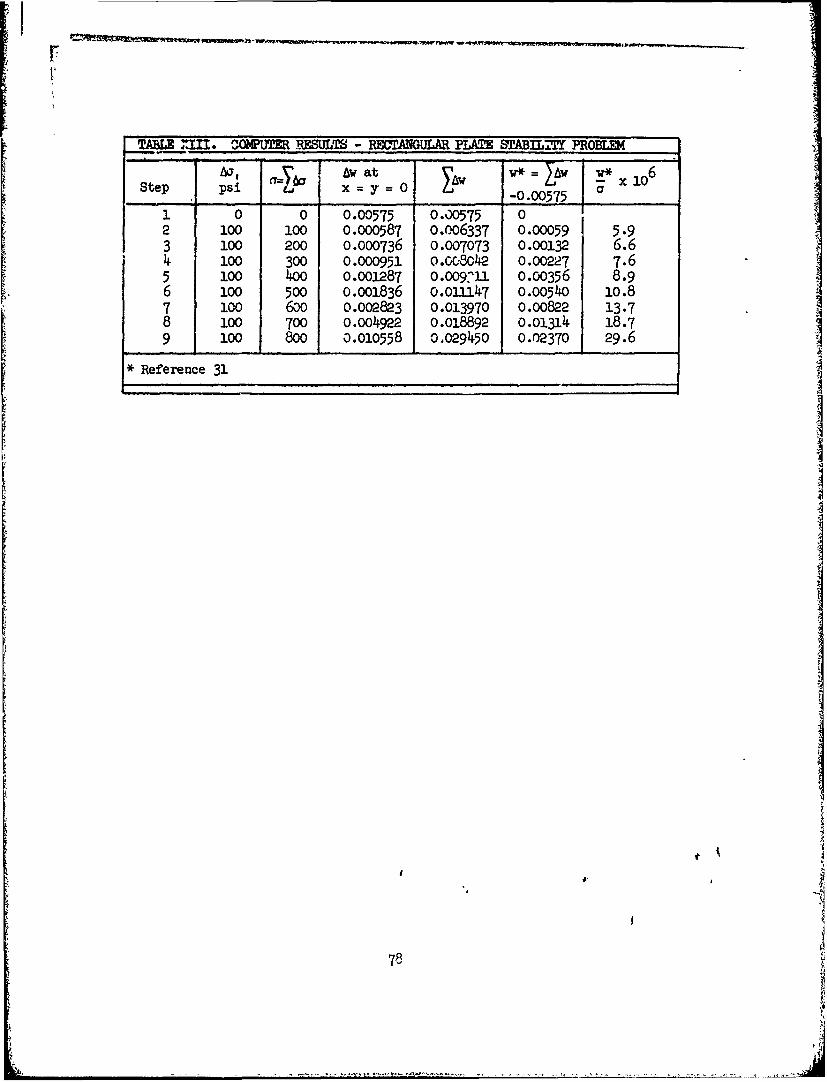
V
TABLE . MPU * TJ RESLT - RECTANGULAR PLATE STABILhTf PROBLEM
Aw at xlOStep psi x = y = 0 l-000575I
1 0 0 0.00575 0.00575 0
2 i00 i00 0.000587 0.006337 0.00059 5.93 100 200 0.000736 O0.007073 0.00132 6.64 100 300 0.000951 o.00842 0,00227 7.65 i00 400 0.001287 0.009-U 0.00356 8.96 100 500 0.001836 0.o11147 0.00540 10.87 100 600 O.002823 0.013970 0.00822 13.78 100 700 o.oo4922 o.o8892 o.o1314 18.79 100 800 0.010558 0.029450 0.02370 29.6
* Reference 31
78
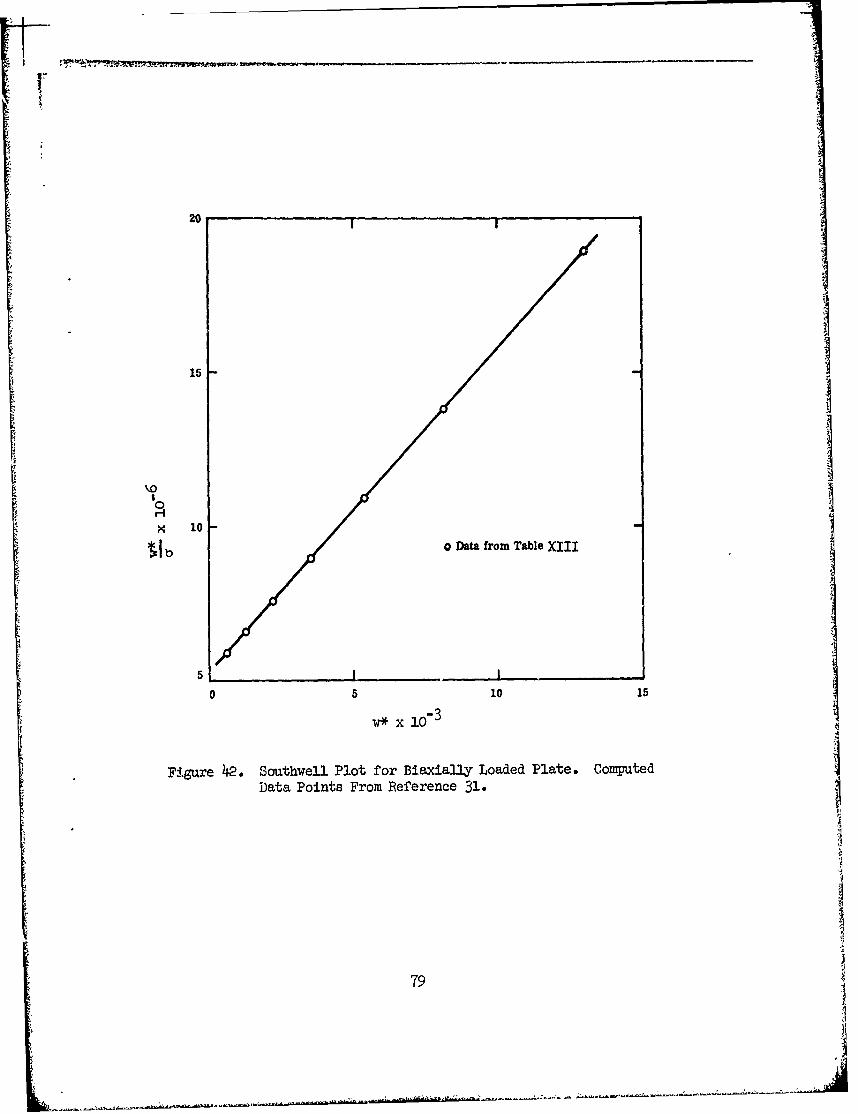
20
15
x 10
Ib o Data from Table XIII
5I I
0 5 10 15
w* xlO"3
Figure 42. Southwell Plot for Biaxially Loaded Plate. ComputedData Points From Reference 31.
79
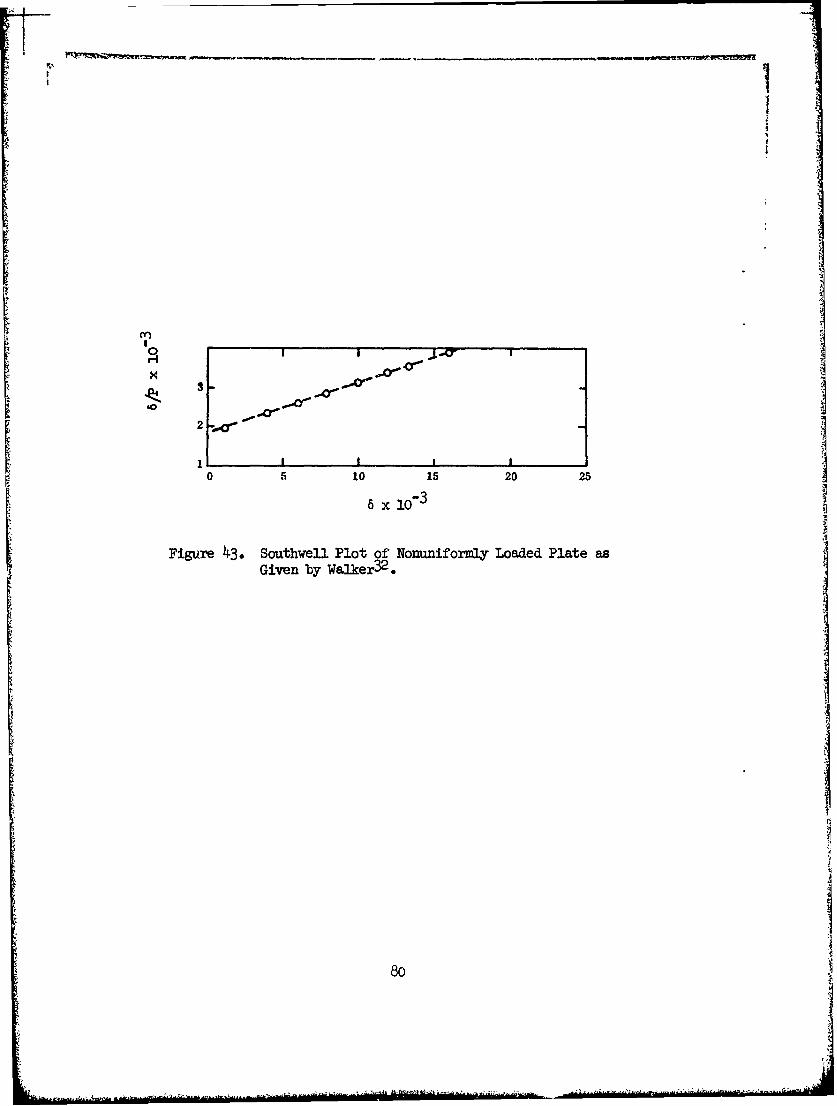
-1c$1I ,
x
0 5 10 15 20 25
6 x lO-3
Figure 43. Southwell Plot of Nonuniformly Loaded Plate asGiven by Walker32 .
80
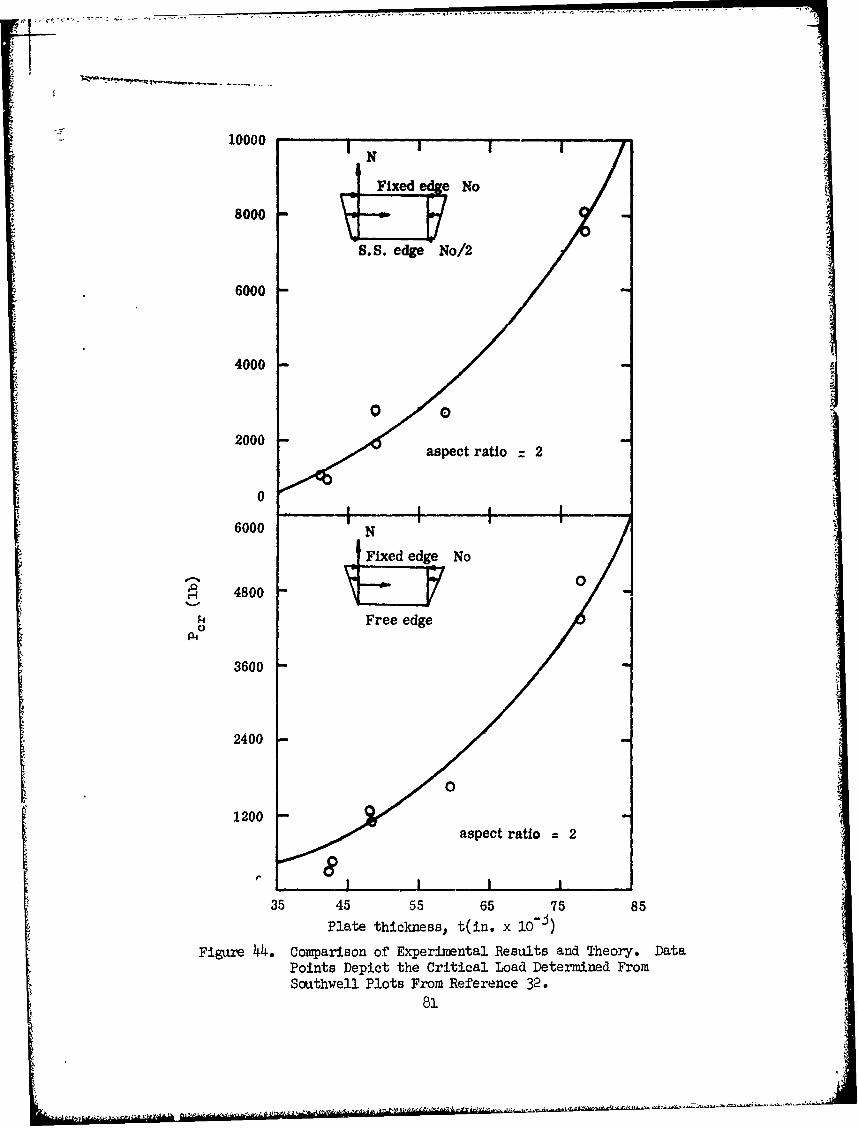
10000N
~N
8000
S.S. edge No/2
6000
4000
0 0
2000aspect ratio 2
0
6000 N
Fixed edge No
4800 I0Free edge
V
3600
2400
1200aspect ratio =2
I-0
35 45 55 65 75 85Plate thickness, t(in. x iO- )
Figure 44,. Comparison of Experimental Results and Theory. DataPoints Depict the Critical Load Determined FromSouthwell Plots From Reference 32.
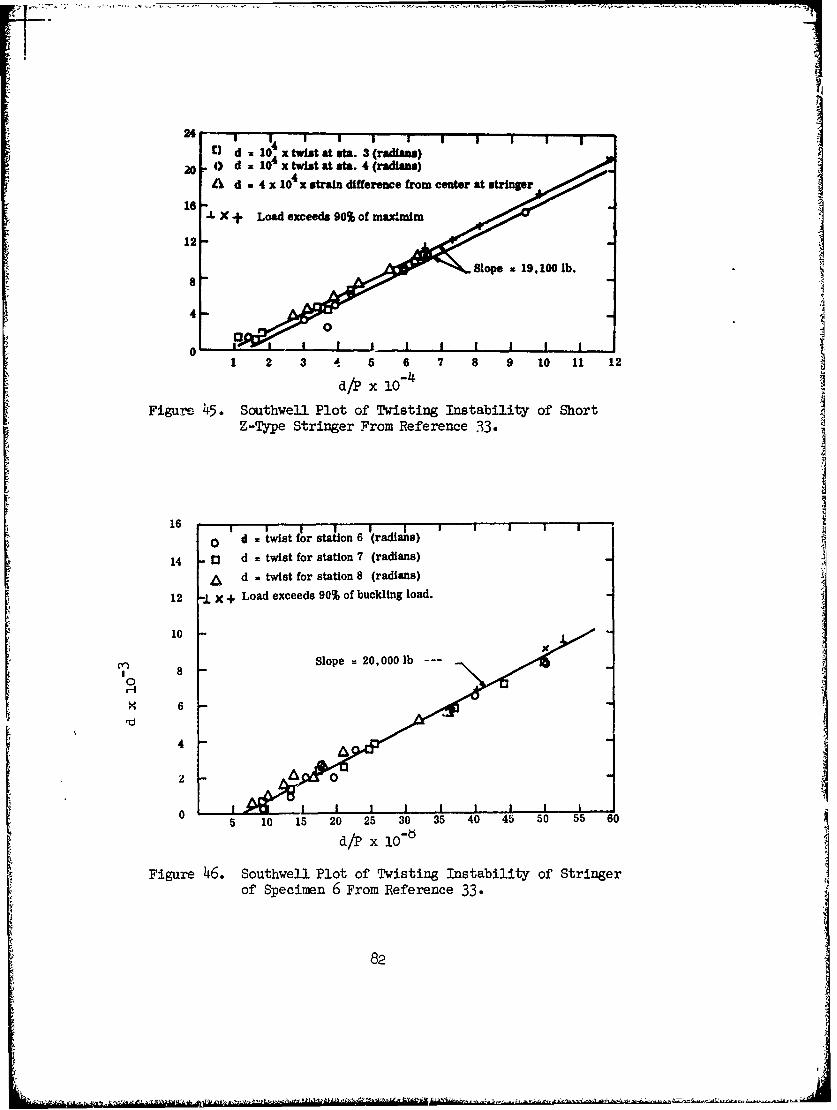
24 1 UCId i 0x twist at st. 3 (adians)
0 4) d x 0xtwistat aft. 4 (radiusa)Ad 4 4xl104 xstrain difference from center attringer
16--L X + Load exceeds 90% of maicimim
12-
8
4
1 2 3 6 7 6 10 11 12
da/P x 0
Figurre 45. Southweli Plot of Twisting Instability of ShortZ-Type Stringer From Reference .33.
Fd 16. twist for station 8 (radians)
10
ro ~Slope =20, 000 lb--0 8
X 6
4
2 _____
0 5 10 15 20 25 30 35 40 45 50 55 60
a/P X1-
Figure 46. Southwell Plot of Twisting Instability of Stringerof Specimen 6 From Reference 33.
82
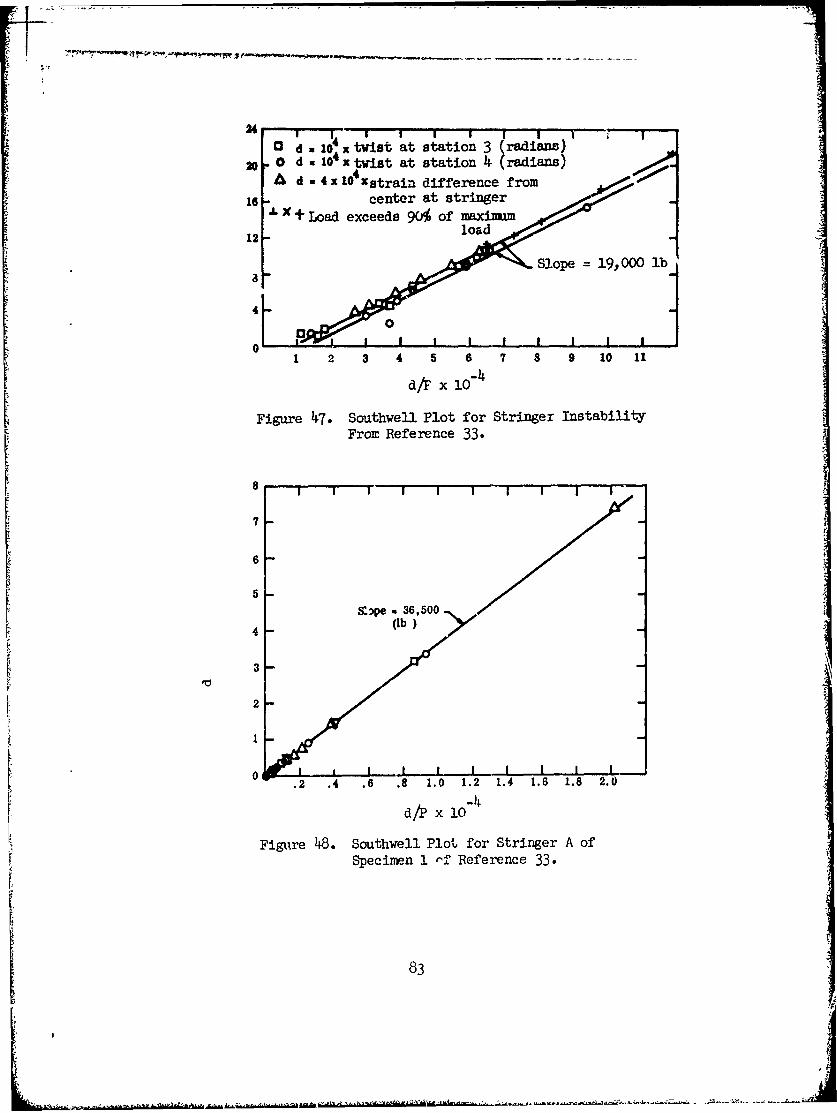
24 ' ...'-rI.. o-
)I I
I d . 104 x twist at station 3 (radians2 0da1i x twist at station 1e (radian2
4 X 10 strain difference from
16 center at stringer. Xoad exceeds 90 of maximam
12 -la
L Slope = 19,000 lb
0 "
1 2 3 4 5 6 7 8 9 10 11
d/ x 10 4
Figure 47. Southwell Plot for Stringer InstabilityFrom Reference 33.
7
6
5
5pe * 36,5004 (1b
3
2
1
O I I I I I I I.2 .4 .6 .8 1.0 1.2 1.4 1.6 1.8 2.0
-4d/P x 10
Figure 48. Southwell Plot for Stringer A of
Specimen I -' Reference 33.
83

Generally speaking, references to the Southwell Plot define the displace-ment parameter as a motion normal to the direction of loading. Rowever, itis relatively simple to demonstrate that there is a one-to-one correspondencebetween this deflection and some strain parameter in the plan15 of the body.The first report to utilize this point was that of Tuckerman. Indeed, inthe harmonic test previously discussed with respect to his report, thedetermination of the Southwell Plots was made using strains on the surfaceof the column. The linear relationship between normal displacement andelastic bending component strains for flat plates is demonstrated here inFigure 49 from tests made in conjunction with the flat plate studies con-ducted at Stanford University and those previously mentioned. The use ofthe Southwell Plots baseJu 9 n 3 gtrin measurements also has been outlinedand verified by Gregory ' ' for application to struts.
Thus, concern has been mainly with elastic structural instabilities ichhave been produced by usual force systems. However, in 1961 Queinecanalytically studied the behavior of a centrally heated "flat" circalarplate with free edges and checked these results experimentally. In thecourse of his work, he treated the problem using both the linear andnonlinear theories. A most important step was taken when the authorcorrelated the test results with theory. "Ue revealed, on the basis oflinear plate theory which included the potssibility of a constant initialgeometric imperfection, the validity of the Southwell Plot for this partic-ular loading. Also, a deflection-squared law (82) was derived using thelarge displacement analysis and this was correlated with some experimentaldata.
The basis of Queinec's analyses is as follows. The temperature distributicnand edge conditions were assumed to be perfectly axisymmetric. 'ne platewas considered to be of uniform thickness, at uniform temperature, andfree from stresses in its initial state. The temperature variation throughthe thickness was neglected, as was the effect of gravity forces. The usualbending theory assumptions were made.
The general equations of plate bending (Kgrman equations) modified fortemperature effects were used.
D 2VW= U' 2b2 U 2w2 b 2 U b2w
222 + T 2
2V2U = _ c 2 a w, 2 b2W ~ 2 w1 (74i)
- +~ )-bX2 B
These equations, transformed into polar coordinates and reduced for theaxisymmetric case, are
8481i
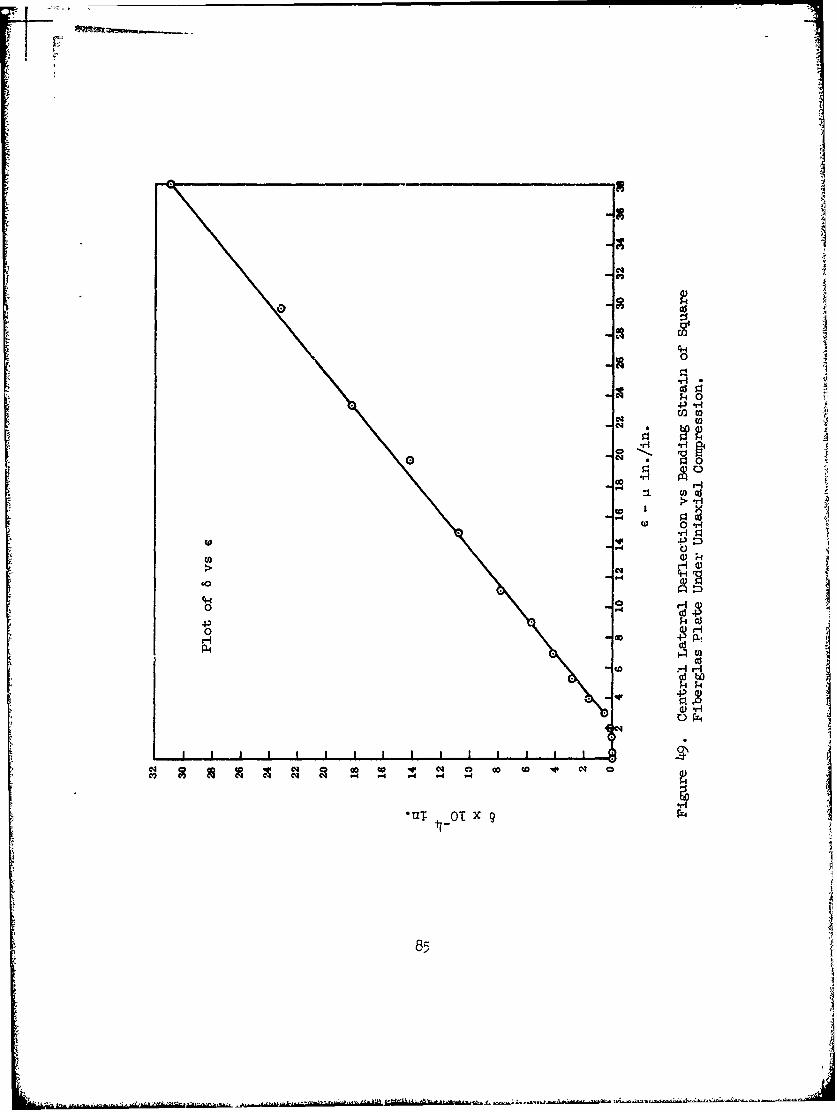
Cd $3k 043-
too
-0-
0 00
PL4co
caCc
0 P4
OD to v N 0 OD to v Na.) 4 If
(AT 0v-4
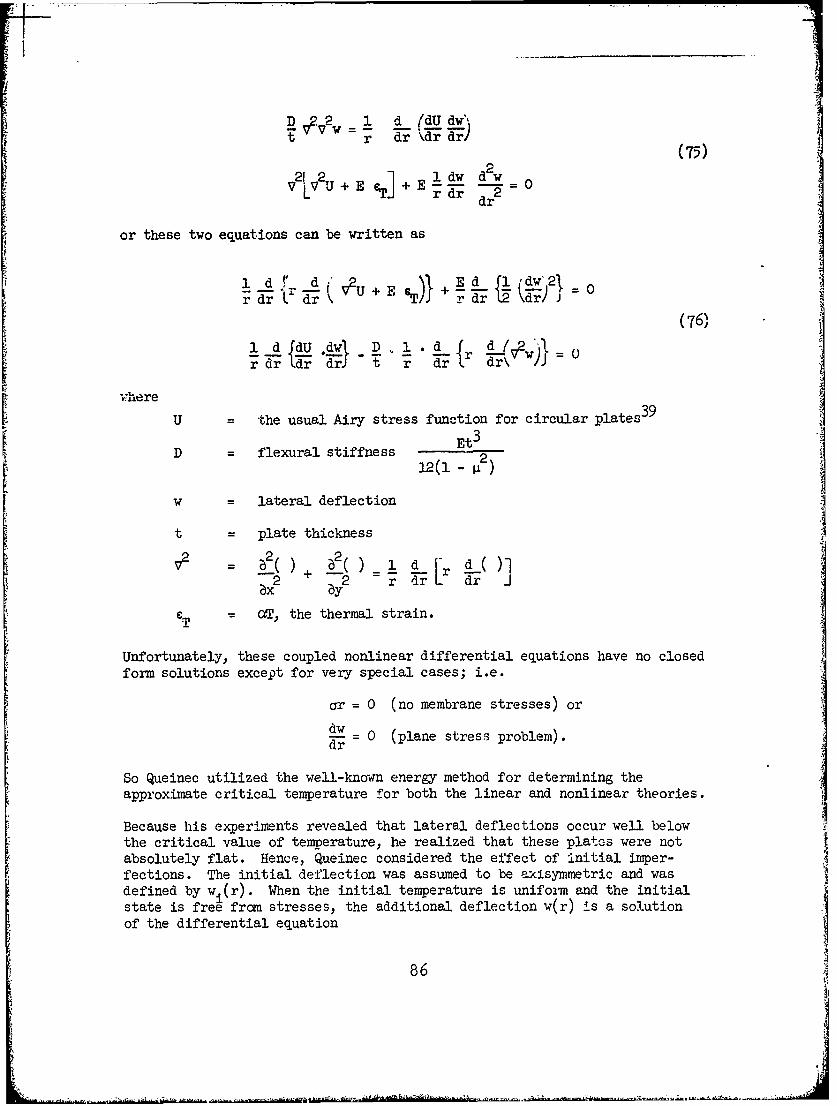
D v22 1 d dw'
rr ( d d r (27
or these two equations can be written as
1 dr dv( + +Ed L ,dw'21 0
rd.rd r E T r dr ,\r,) =
(76)
1 D. d r T dr drJ t r dr dr\ _
,Ahere
U the usual Airy stress function for circular plates3 9
D flexural stiffness 2
w lateral deflection
t plate thickness
V2 2 2 L(2 6y2 r drL dr J
T T the thermal strain.
Unfortunately, these coupled nonlinear differential equations have no closed
form solutions except for very special cases; i.e.
ar = 0 (no membrane stresses) or
d-E = 0 (plane stress problem).dr
So Queinec utilized the well-known energy method for determining theapproximate critical temperature for both the linear and nonlinear theories.
Because his experiments revealed that lateral deflections occur well belowthe critical value of temperature, he realized that these plates were notabsolutely flat. Hence, Queinec considered the effect of initial imper-
fections. The initial deflection was assumed to be axisymmetric and wasdefined by wi(r). When the initial temperature is uniform and the initial
state is free from stresses. the additional deflection w(r) is a solutionof the differential equation
86
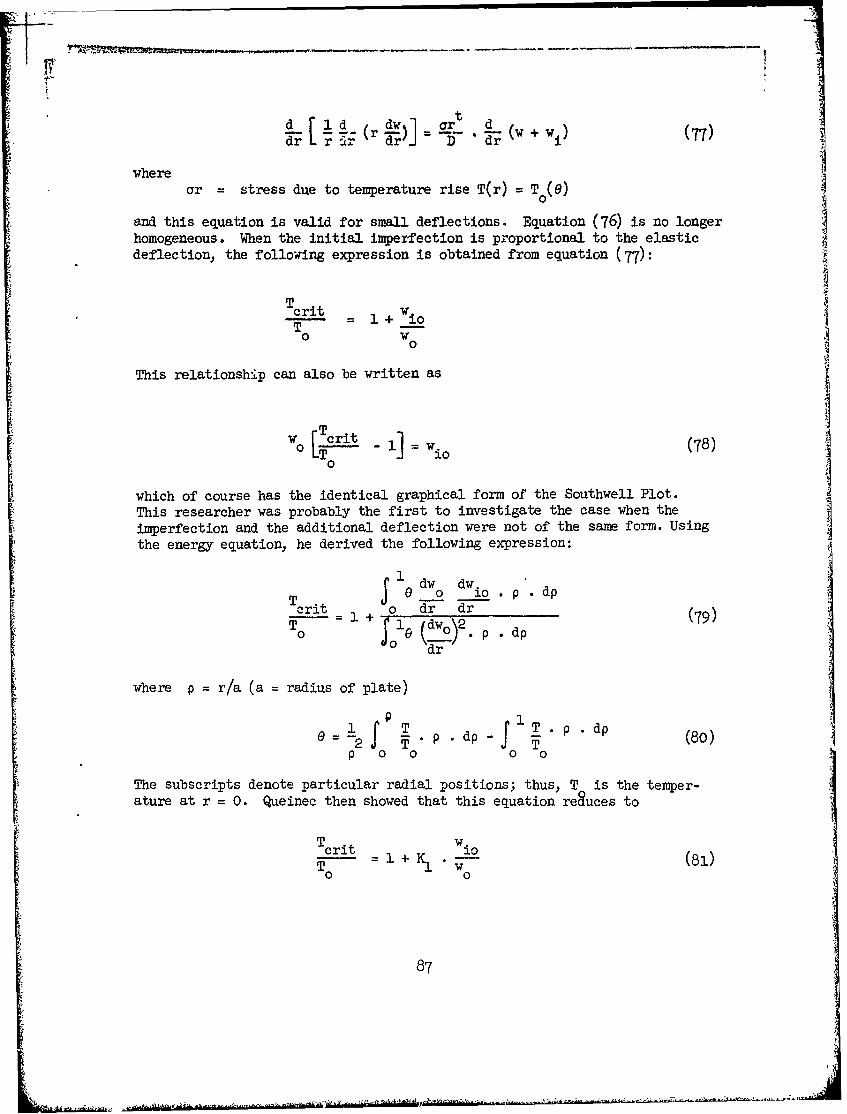
-t
d r dr di d( (77)
wherear = stress due to temperature rise T(r) = To(e)
and this equation is valid for small deflections. Equation (76) is no longerhomogeneous. When the initial imperfection is proportional to the elasticdeflection, the following expression is obtained from equation (77):
Ticrit = 1 + Wio
0 w
0
This relationship can also be written as
w rLt I] =w. (78)0 UT .o (8
0
which of course has the identical graphical form of the Southwell Plot.
This researcher was probably the first to investigate the case when the
imperfection and the additional deflection were not of the same form. Using
the energy equation, he derived the following expression:
1O 'TS0dw 0dW io.. p d
Tcrit 0 dr dr (9
7r
where p = r/a (a radius of plate)
e 1 T d I T p d p (80)2 T o o T
The subscripts denote particular radial positions; thus, T is the temper-ature at r = 0. Queinec then showed that this equation reduces to
Tcrit WioT I + K, • - (l
0 0
87
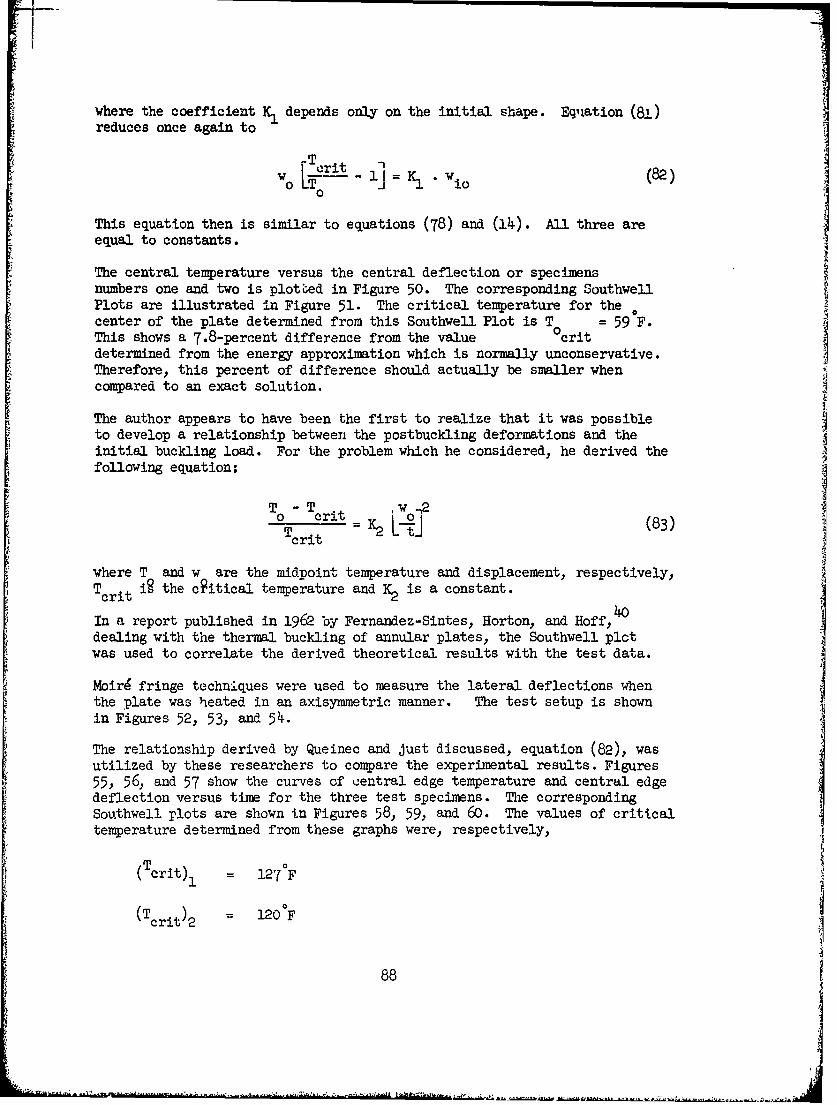
where the coefficient K, depends only on the initial shape. Equation (8)reduces once again to
'W0 -- 1 K io(2
0
This equation then is similar to equations (78) and (14). All three areequal to constants. 4
The central temperature versus the central deflection or specimensnumbers one and two is plottbed in Figure 50. The corresponding SouthwellPlots are illustrated in Figure 51. The critical temperature for thecenter of the plate determined from this Southwell Plot is T = 59 F.This shows a 7.8-percent difference from the value 0critdetermined from the energy approximation which is normally unconservative.Therefore, this percent of difference should actually be smaller whencompared to an exact solution.
The author appears to have been the first to realize that it was possibleto develop a relationship between the postbuckling deformations and theinitial buckling load. For the problem which he considered, he derived thefollowing equation:
T0 -Ti , 2 (3T crit 0crit = K 2 L-- tj (83)
where T and w are the midpoint temperature and displacement, respectively,Tcrit ig the c~itical temperature and K2 is a constant.
In a report published in 1962 by Fernandez-Sintes, Horton, and Hoff,dealing with the thermal buckling of annular plates, the Southwell plctwas used to correlate the derived theoretical results with the test data.
Moir4 fringe techniques were used to measure the lateral deflections whenthe plate was heated in an axisymmetric manner. The test setup is shownin Figures 52, 53, and 54.
The relationship derived by Queinec and just discussed, equation (82), wasutilized by these researchers to compare the experimental results. Figures55, 56, and 57 show the curves of central edge temperature and central edgedeflection versus time for the three test specimens. The correspondingSouthwell plots are shown in Figures 58, 59, and 60. The values of criticaltemperature determined from these graphs were, respectively,
tT(crit) 127°F
(Tcrit)2 = 120°F
88
C (
* - - 1 1kfh~tAL4~W.4 *k ,.~.
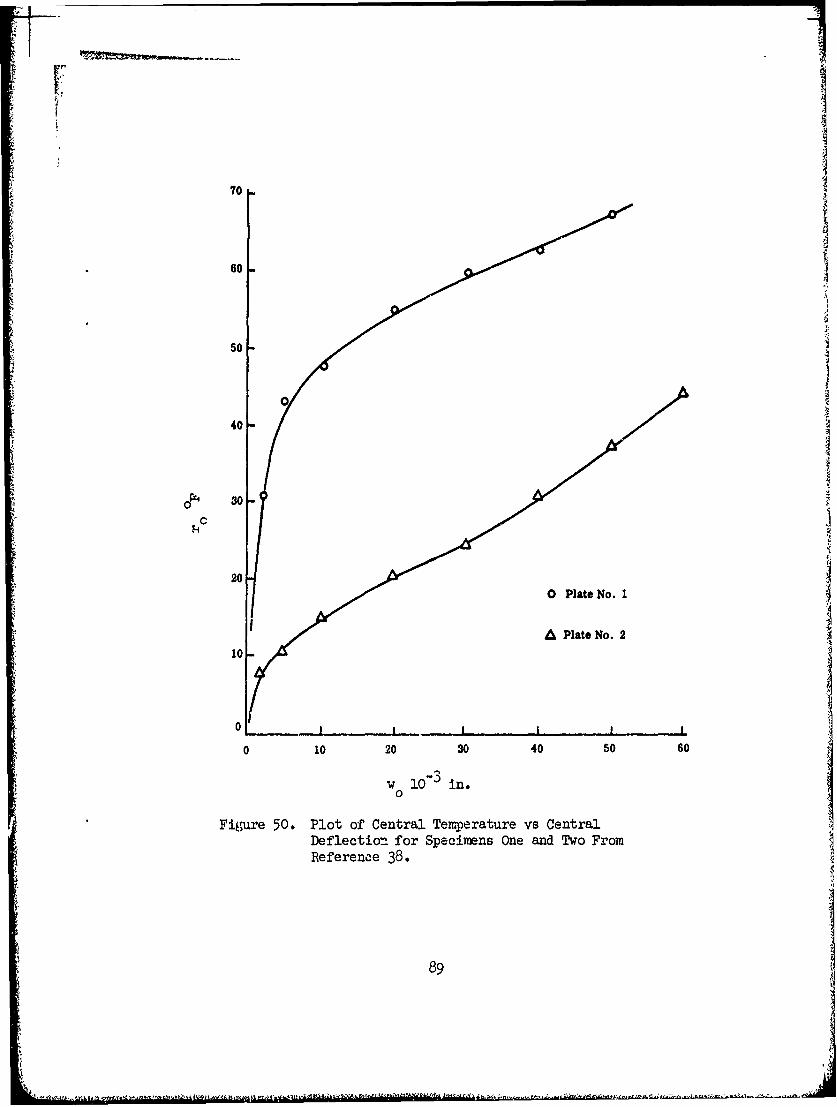
ii
70
160
50
40
oP4 30T
C
0 Plate No. 120
APlate No. 210-
01$
0 10 20 30 40 50 60
w 10 " in.
Figure 50. Plot of Central Temperature vs CentralDeflection for Specimens One and Two FromReference 38.
89
.. ,A
I--
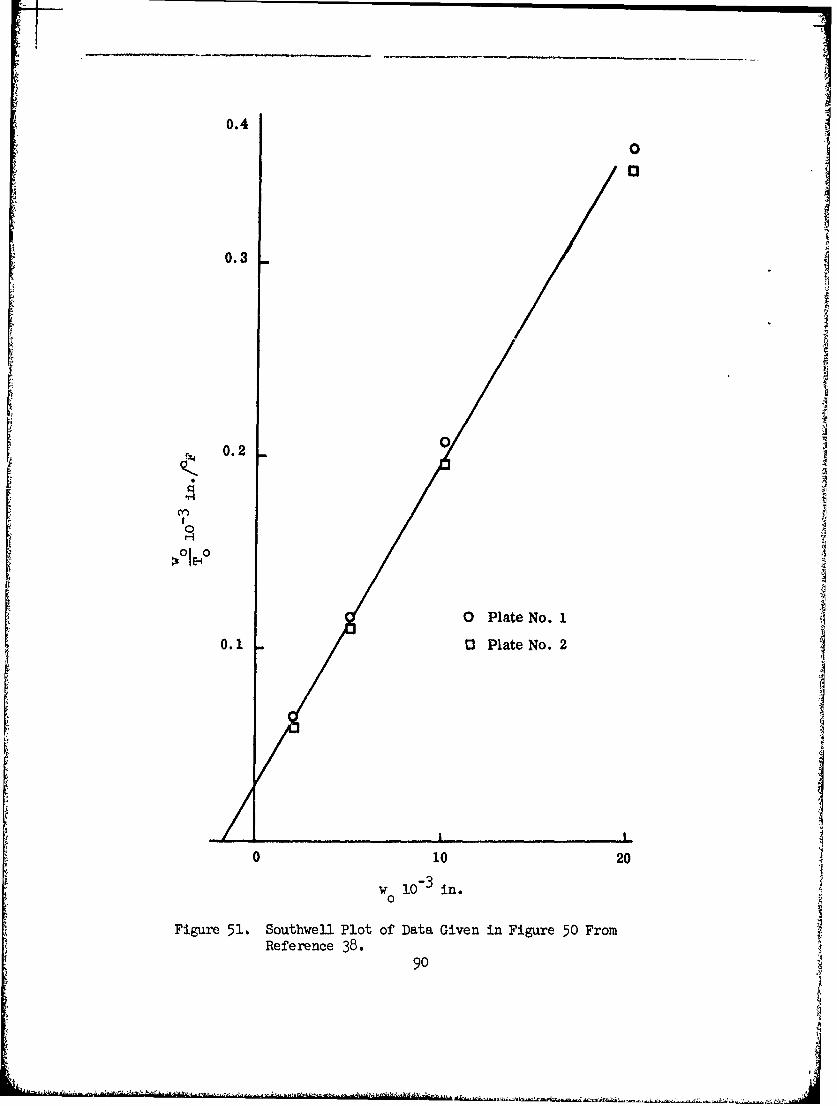
0.4
0
0.3
0.2
0 -
0 Plate No. 1
0.1 .3 Plate No. 2
0 10 20
w 10 in. A0 ,
Figure 51. Southwell Plot of Data Given in Figure 50 FromReference 38.
9o
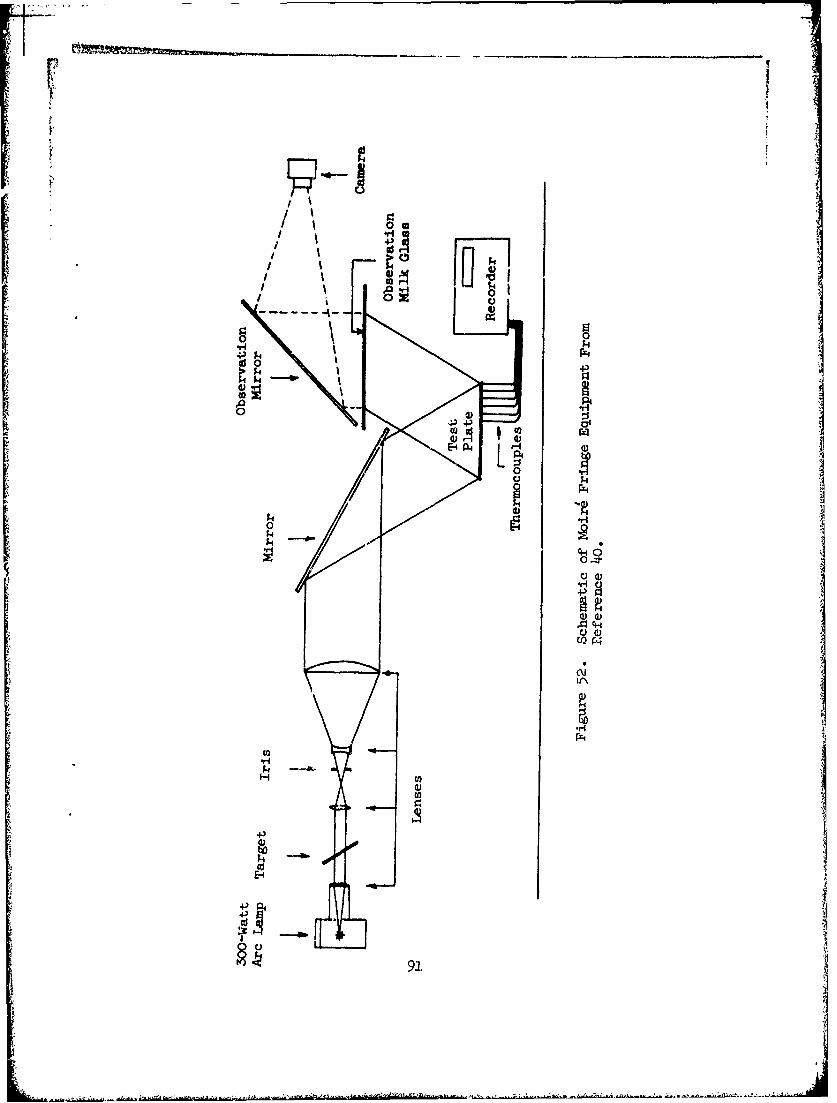
0I
pI 0
0
-4- -E-4
o 0
A P4
0
00 00,
+) P44
4 CU
91.
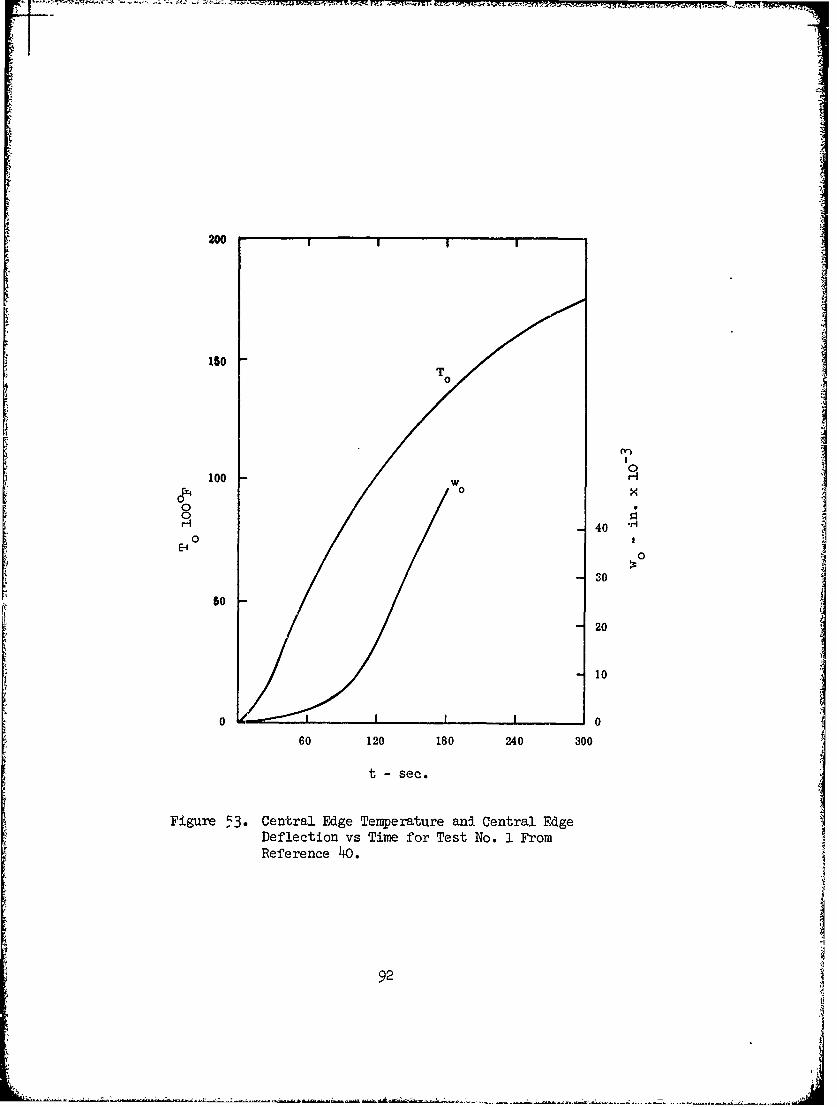
200
T0
0010
00
0 40
0E-10
0
30
so-20
-10
0 0
60 120 180 240 300
t - see.
Figure 53, Central Edge Temperature and Central EdgeDeflection vs Time for Test No. 1 FromReference 40.
92
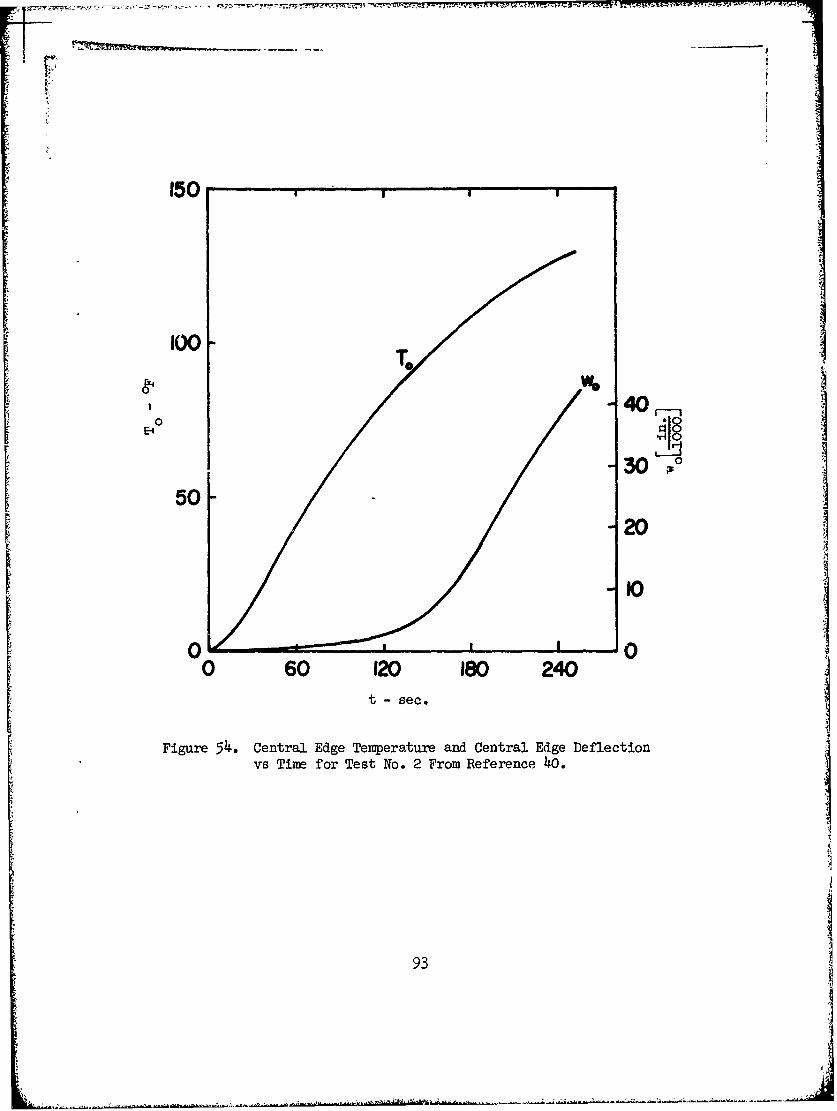
150
100 w.
-40
3050
20
0 0
0 60 120 180 240t - sec.
Figure 54. Central Edge Temperature and Central Edge Deflectionvs Time for Test No. 2 From Reference 40.
93
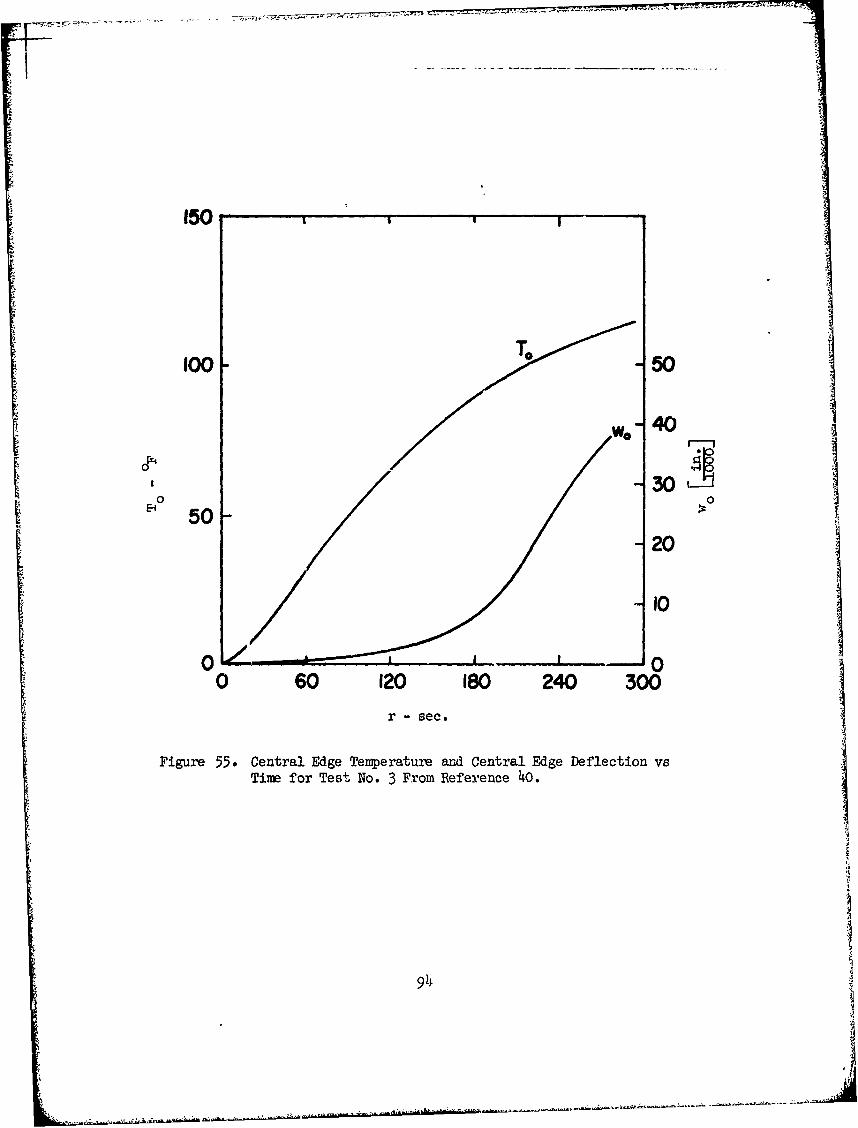
150 p
500 50
40
0 A0-1 50 -~
20
10
0 100 60 120 180 240 300
r - seco
Figure 55. Central Edge Temperature and Central Edge Deflection vsTime for Test No. 3 From Reference 40.
94
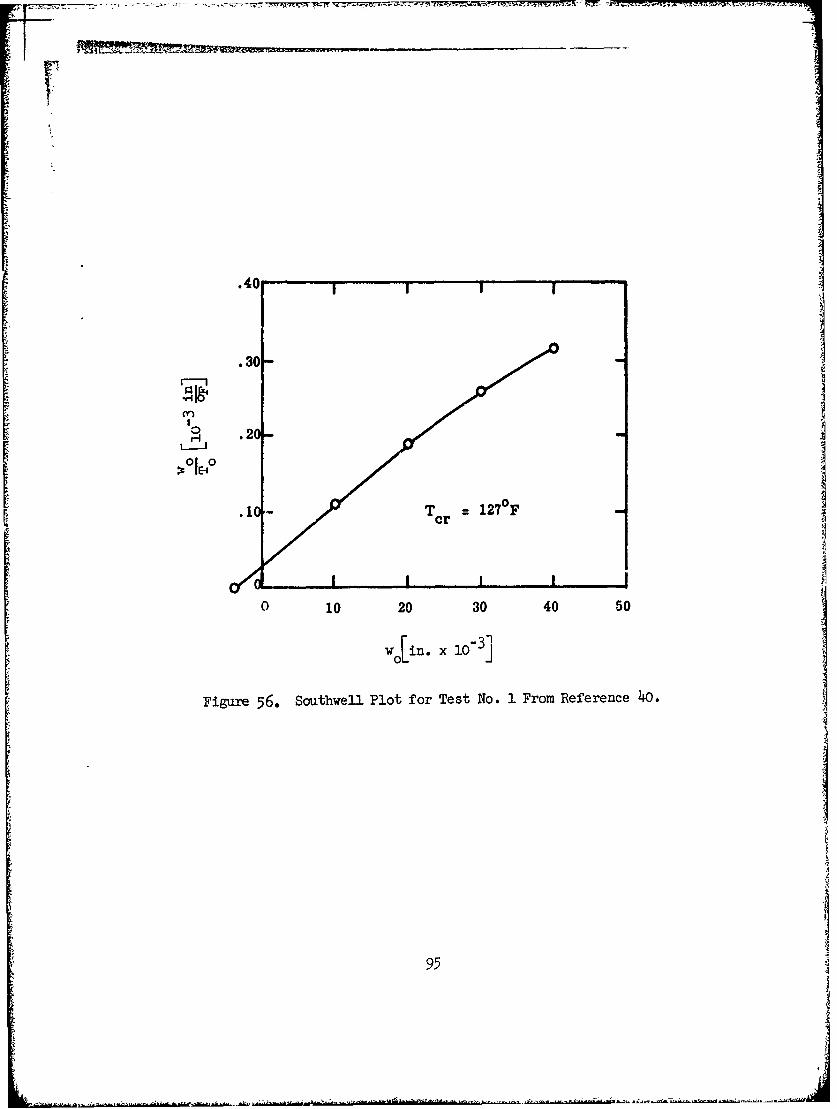
.40.
.30-
av
0 JTcr :2 0
0 10 20 30 40 50
w[in. x 10-3]
Figure 56. Sotithwell Plot for Test No. 1 From Reference 40.
95I
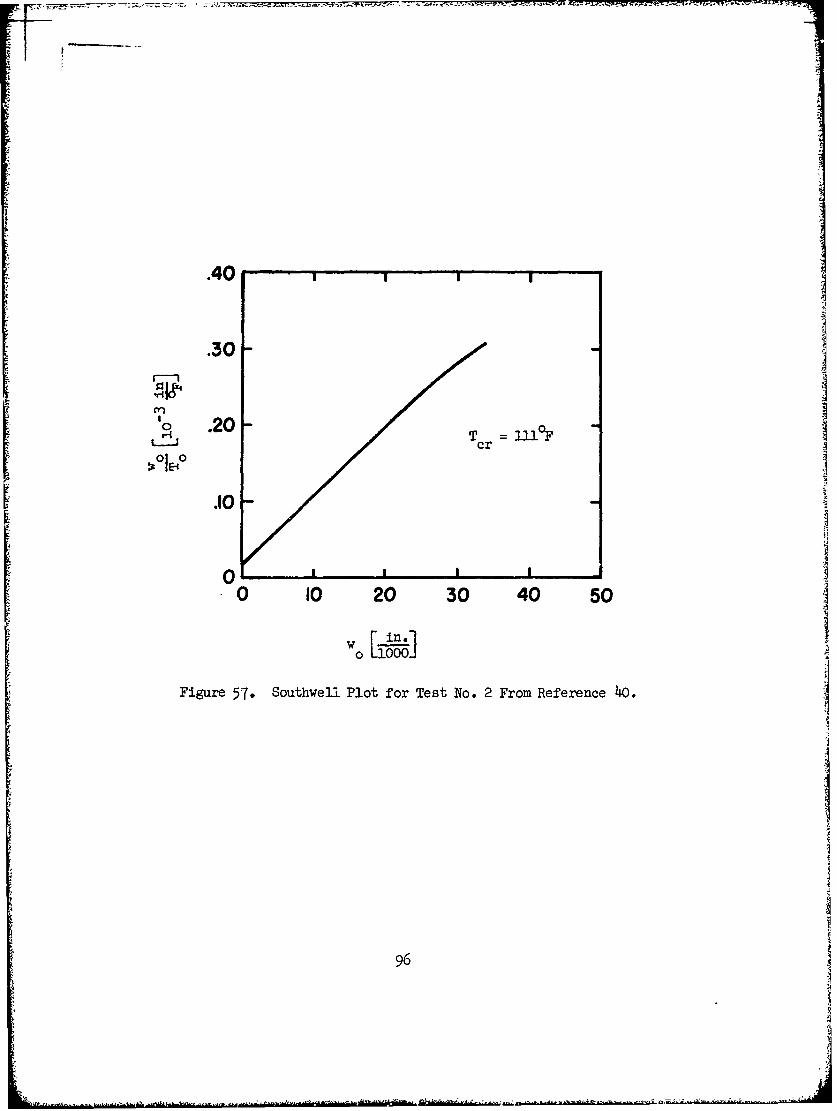
.40
.30-
.20 T -1F
L.:J cr]
.10-
0 ,,I I
0 10 20 30 40 50
o Lz-;"]
Figure 57. Southwelli Plot for Test No. 2 From Reference 40.
96
'" " " "' ' . .. ..-, " ' " • " ' . .. .... - i = .. i ,,: . ".- ', - i '" € '- ' ,, ,. . .., = : , . . ... . . , . .. . : .- . m - ,' .., -, - .. . . ..-:
':t
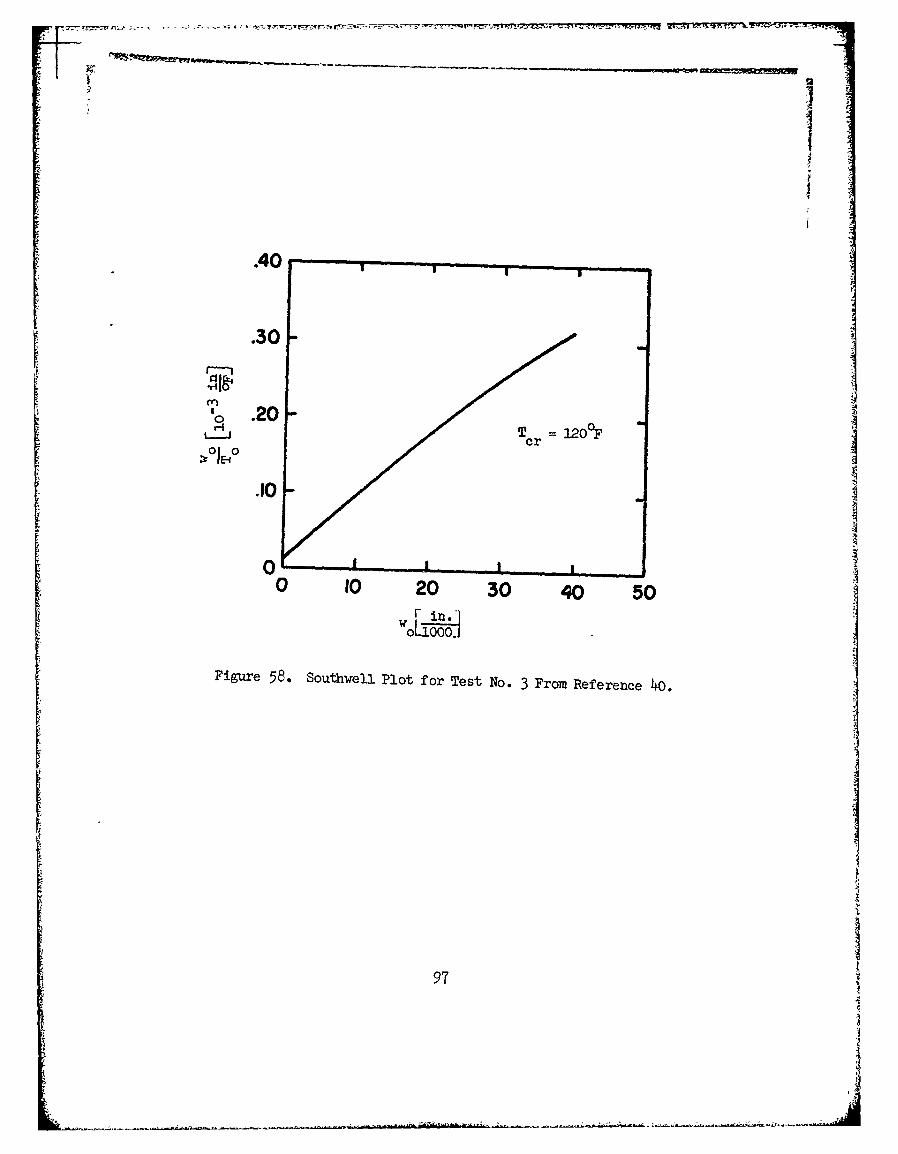
.40 T , 7 M - t
.30
10 .20
O - q. I , T .r 12.10
0I0 10 20 30 40 50
Figure 58. Southwell Plot for Test No. 3 From Reference 40.
97
~A
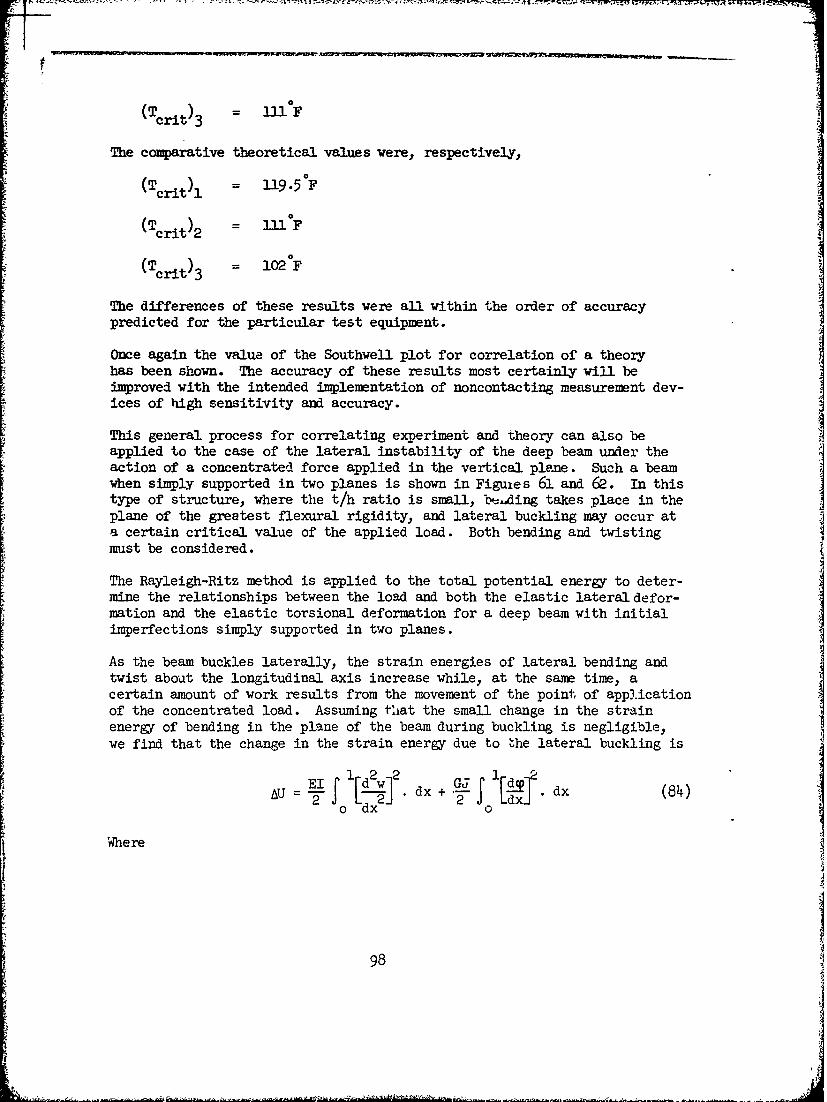
-~---vi 1 ' 'r - ~ -
(T ) = lUFcrit 3
The comparative theoretical values were, respectively,
(Tcit1 = 119.5F
(T Fcrit)2 = liF
(Tit) 3 = 102OF
The differences of these results were all within the order of accuracypredicted for the particular test equipment.
Once again the value of the Southwell plot for correlation of a theoryhas been shown. The accuracy of these results most certainly will be
improved with the intended implementation of noncontacting measurement dev-ices of high sensitivity and accuracy.
This general process for correlating experiment and theory can also beapplied to the case of the lateral instability of the deep beam under theaction of a concentrated force applied in the vertical plane. Such a beamwhen simply supported in two planes is shown in Figuies 61 and 62. In thistype of structure., where the t/h ratio is small, b--.ding takes place in theplane of the greatest flexural rigidity, and lateral buckling may occur at
a certain critical value of the applied load. Both bending and twistingmust be considered.
The Rayleigh-Ritz method is applied to the total potential energy to deter-mine the relationships between the load and both the elastic lateral defor-mation and the elastic torsional deformation for a deep beam with initialimperfections simply supported in two planes.
As the beam buckles laterally, the strain energies of lateral bending andtwist about the longitudinal axis increase while, at the sae time, acertain amount of work results from the movement of the point of applicationof the concentrated load. Assuming t'hat the small change in the strainenergy of bending in the plane of the beam during buckling is negligible,
we find that the change in the strain energy due to the lateral buckling is
Au= d[2 dx+ 20 [d9 dx (84)
Where
98
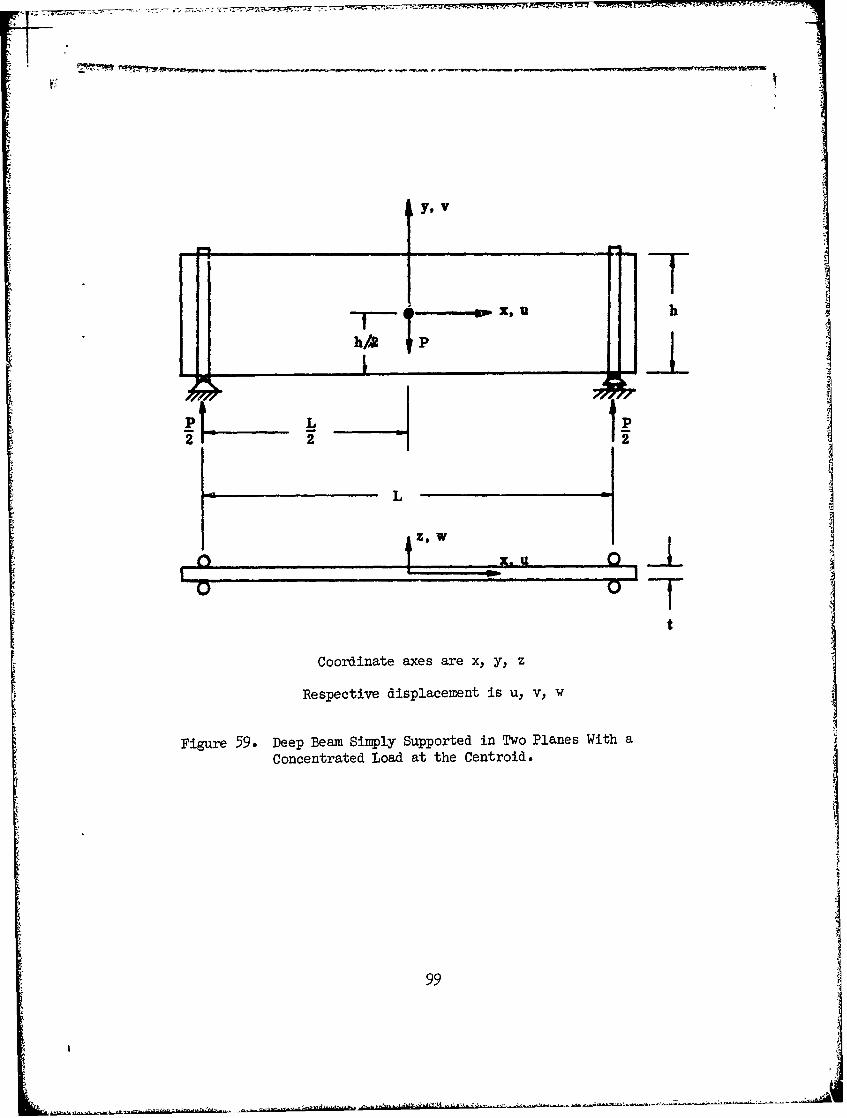
y, V
h/,2 h
Ln L
z, w L
Coordinate axes are x, y, z
Respective displacement is u. v, w
Figure 59. Deep Beam Simply Supported in Two Planes With aConcentrated Load at the Centroid.
99
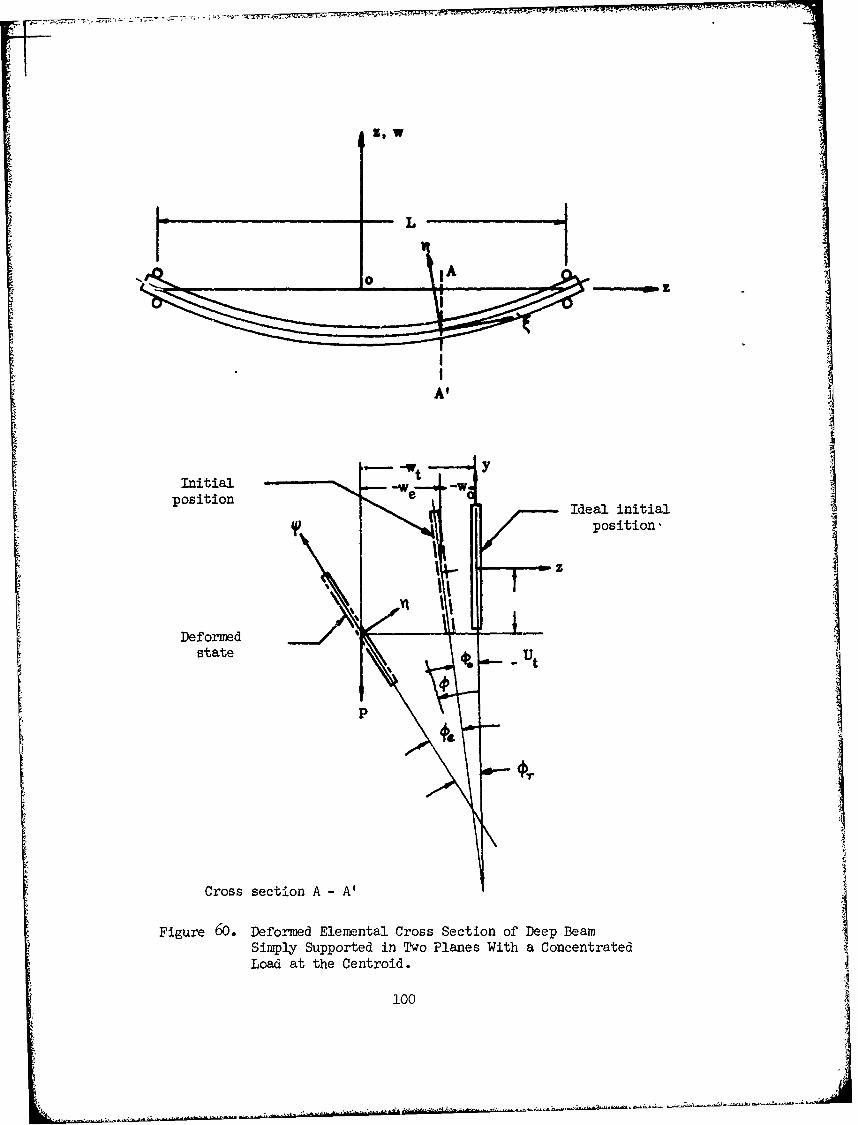
Z, W
IA
At
"-- " t -- -" Y
Initial __position Ideal initial
i __position-
Deformedstate Ut
P
Cross section A - A'
Figure 60. Deformed Elemental Cross Section of Deep BeamSimply Supported in Two Planes With a ConcentratedLoad at the Centroid.
100
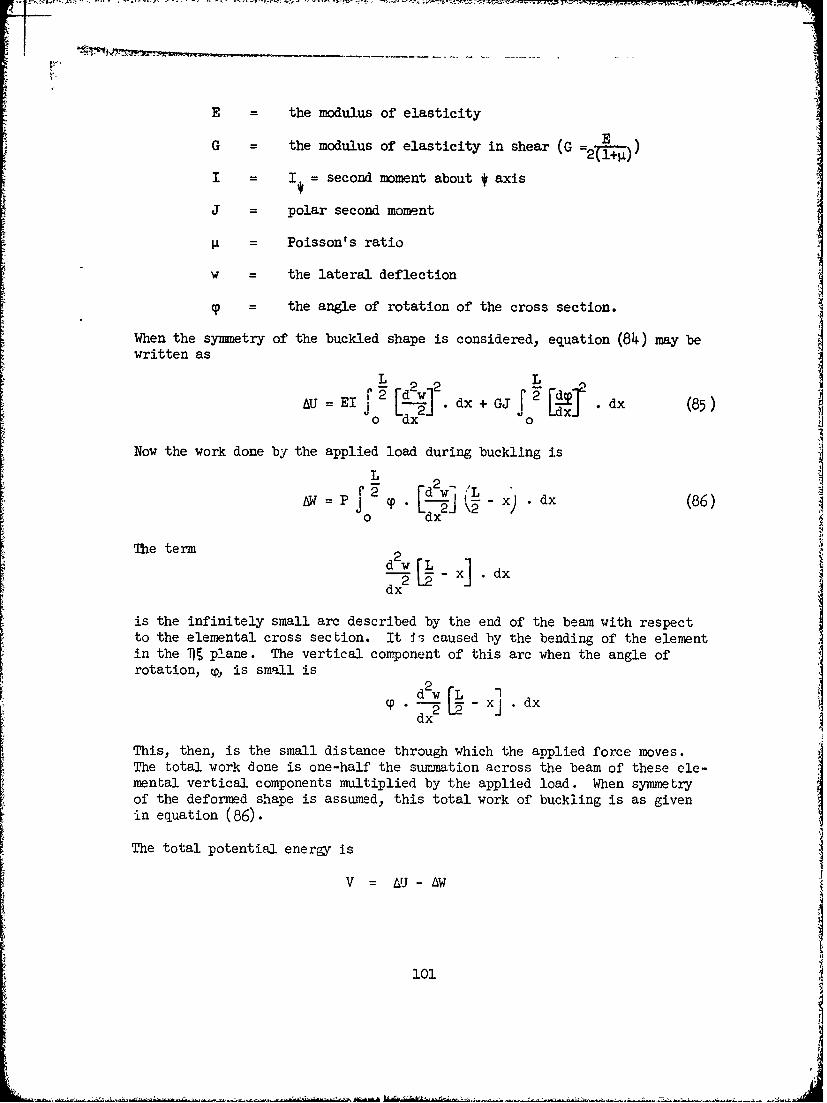
E the modulus of elasticityE
G the modulus of elasticity in shear (G
I I = second moment about * axis
J polar second moment
Poisson's ratio
w the lateral deflection
cp the angle of rotation of the cross section.
When the symnetry of the buckled shape is considered, equation (84) may bewritten as
L 2L
AU = EI 2 dx + GJ F T. dx (85)0o dx o
Now the work done by the applied load during buckling is
L 2&W P c L-j' x) x(6
The term
dx
is the infinitely small arc described by the end of the beam with respectto the elemental cross section. It Is caused by the bending of the elementin the 9§ plane. The vertical component of this arc when the angle ofrotation, t, is small is
2p. -- -x .j dxdx
This, then, is the small distance through which the applied force moves.The total work done is one-half the summation across the beam of these ele-mental vertical components multiplied by the applied load. When symmetryof the deformed shape is assumed, this total work of buckling is as givenin equation (86).
The total potential energy is
V =trj- AW
101
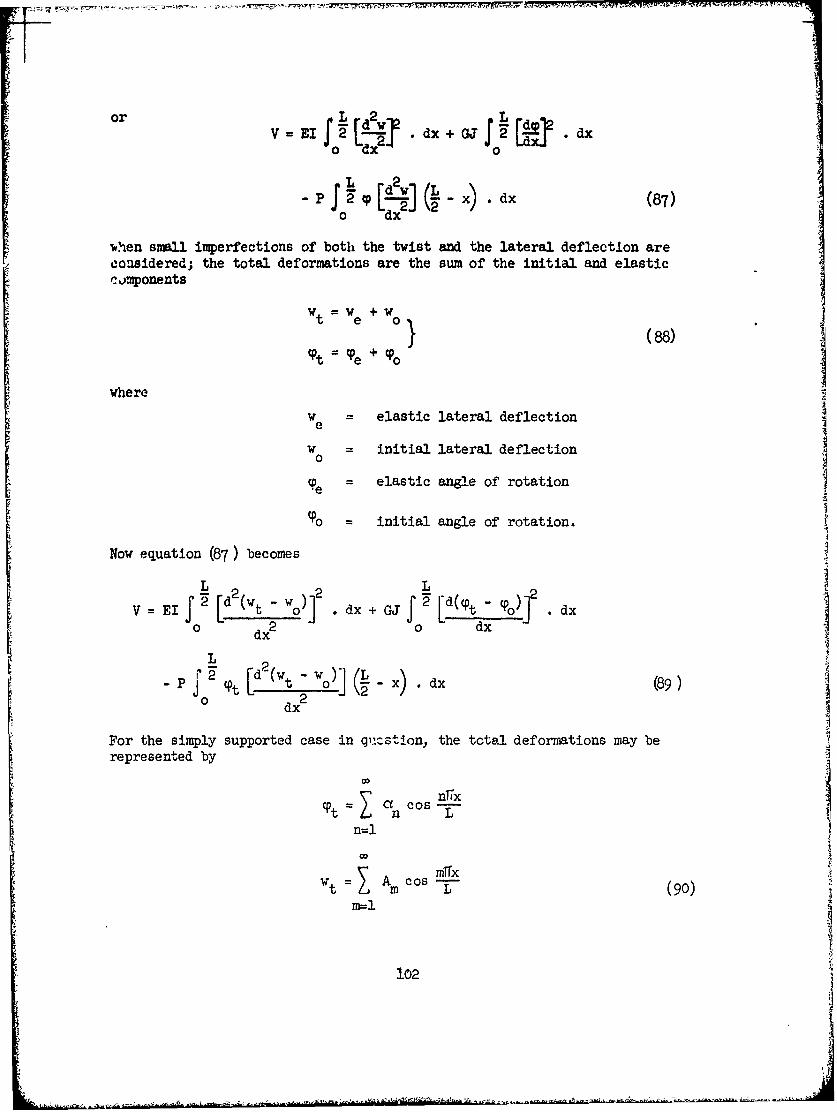
I-I
or L~i~ 2 d+J'[j
2o dx + oJ J2d
PJ I[d -] (L2- x) .cx(87)o dx
.when small imperfections of both the twist and the lateral deflection areconsidered; the total deformations are the sum of the initial and elasticI components
Wt =W +Wt e o(88)
'P e+ To
where
w = elastic lateral deflectione
w = initial lateral deflection0
cp = elastic angle of rotation
To initial angle of rotation.
Now equation (87) becomes
L 2 2 L 2
V=EIJf2 [d (wt o) dx + GJ 2 L t-po) . dx0 dx2 o dx
L
P [d 2 (W - w~j(j (Pt 2 - t 2 0 X) . dx (89)
dx
For the simply supported case in glicstion, the total deformations may berepresented by
=1 cos L-n=l
A TITXi o L (90)
102
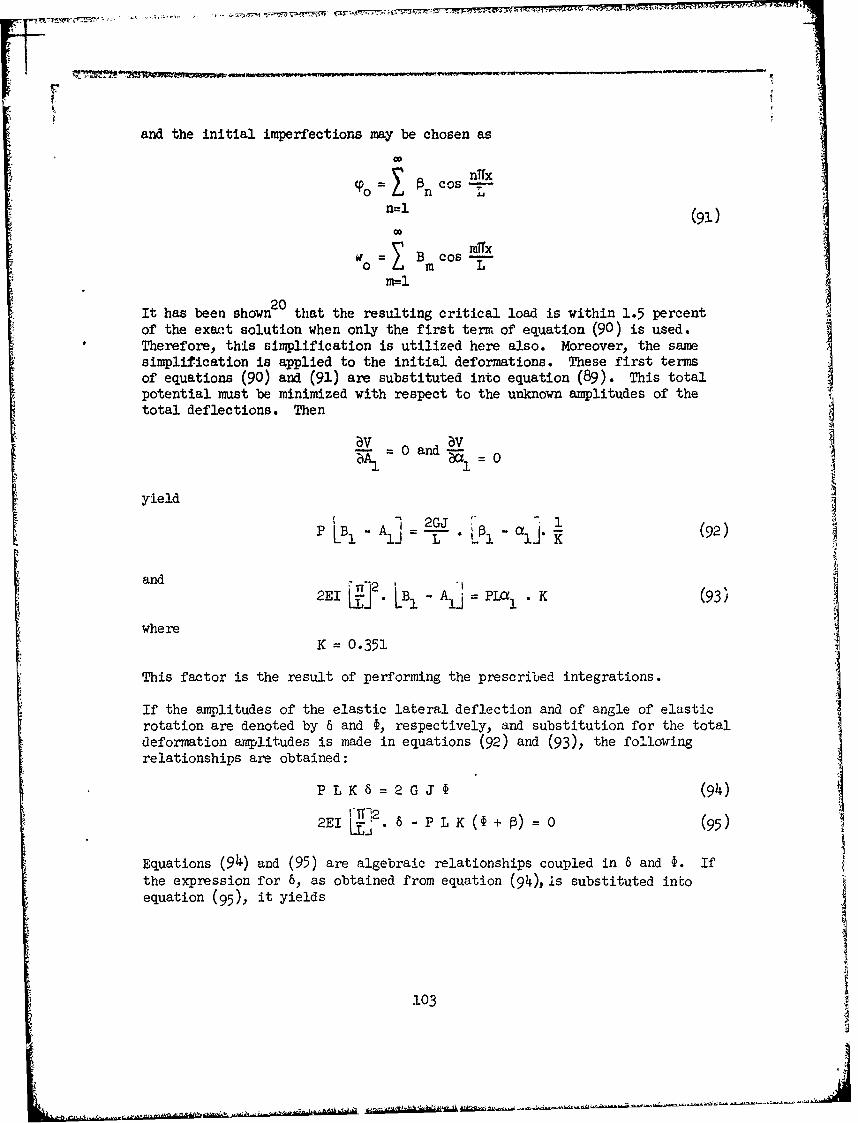
. - , ' . z-
7 f' M,1777
and the initial imperfections may be chosen as
-- Cosnln--
mgl
B Co mTrx= ) Bcos --0 Li m Lm=l
It has been shown20 that the resulting critical load is within 1.5 percentof the exact solution when only the first term of equation (90) is used.Therefore, this simplification is utilized here also. Moreover, the samesimplification is applied to the initial deformations. These first termsof equations (90) and (91) are substituted into equation (89). This totalpotential must be minimized with respect to the unknown amplitudes of thetotal deflections. Then
-= 0 and 2a 0
1yield
2GJ 1P LB, All L -l ± ji.K (92)
and i 'T
2EI j. LB1 Aj= PLal K (931
whereK = 0.351
This factor is the result of performing the prescribed integrations.
If the amplitudes of the elastic lateral deflection and of angle of elasticrotation are denoted by 6 and , respectively, and substitution for the totaldeformation amplitudes is made in equations (92) and (93), the followingrelationships are obtained:
PLK8=2GJ (94) I2E1 . 8 - P L K (@ + P) 0 (95)
Equations (94) and (95) are algebraic relationships coupled in 8 and 1. Ifthe expression for 8, as obtained from equation (94), is substituted intoequation (95), it yields
103
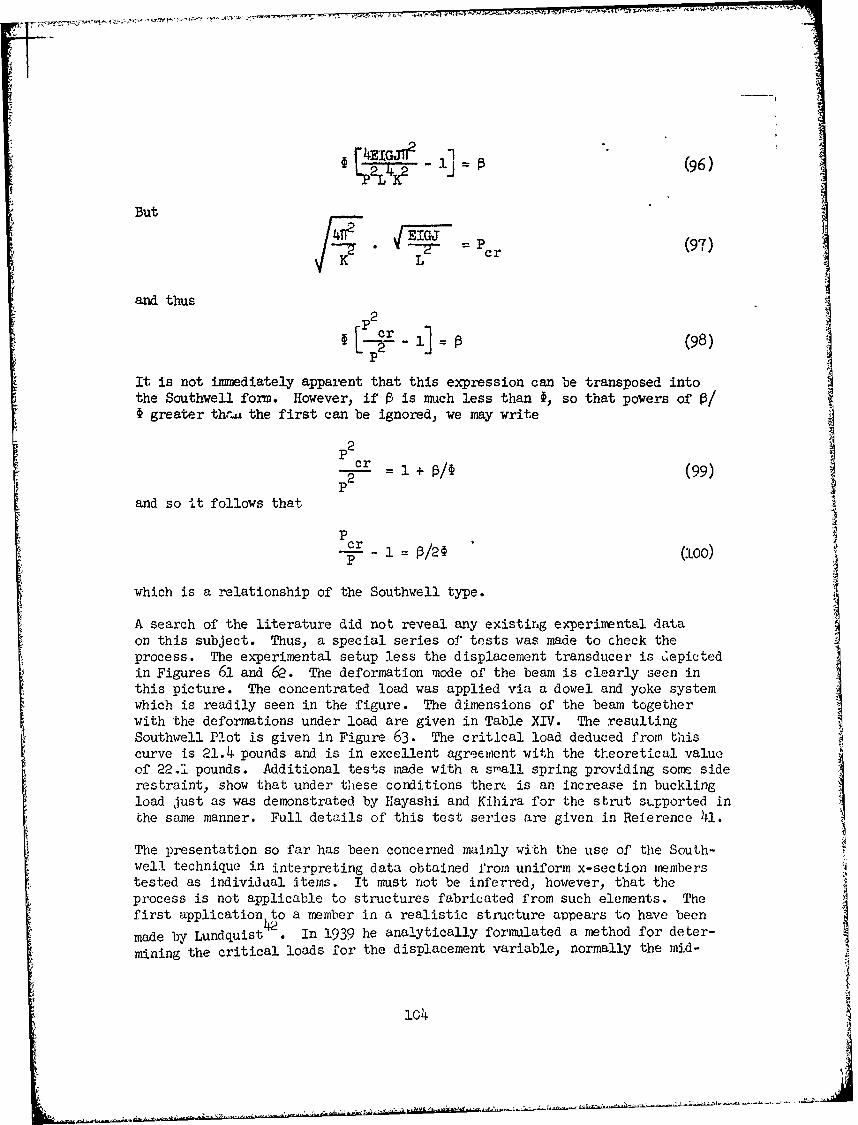
2L4GJ1? ] (96)
But
K Lcr (97)
and thus[cr-1
[L~-1 (98)P
It is not immediately apparent that this expression can be transposed intothe Southwell form. However, if' P is much less than , so that powers of P/greater thr the first can be ignored, we may write
P 2 cr= 1 + (99)2 ,
and so -it follows that
Pcr (:LO0)
which is a relationship of the Southwell type.
A search of the literature did not reveal any existing experimental data
on this subject. Thus, a special series of tests was made to check theprocess. The experimental setup less the displacement transducer is Cepictedin Figures 61 and 62. The deformation mode of the beam is clearly seen inthis picture. The concentrated load was applied via a dowel and yoke systemwhich is readily seen in the figure. The dimensions of the beam togetherwith the deformations under load are given in Table XIV. The resultingSouthwell Plot is given in Figure 63. The critical load deduced from thiscurve is 21.4 pounds and is in excellent agreement with the theoretical valueof 22.i pounds. Additional tests made with a small spring providing some siderestraint, show that under these conditions therc is an increase in bucklingload just as was demonstrated by 11ayashi and Kihira for the strut supported inthe same manner. Full details of this test series are given in Reference 41.
The presentation so far has been concerned mainly with the use of the South-
well technique in interpreting data obtained from uniform x-section memberstested as individaal items. It must not be inferred, however, that theprocess is not applicable to structures fabricated from such elements. Thefirst application to a member in a realistic structure appears to have been
made by Lundquist 4 In 1939 he analytically formulated a method for deter-
mining the critical loads for the displacement variable, normally the mid-
1C4
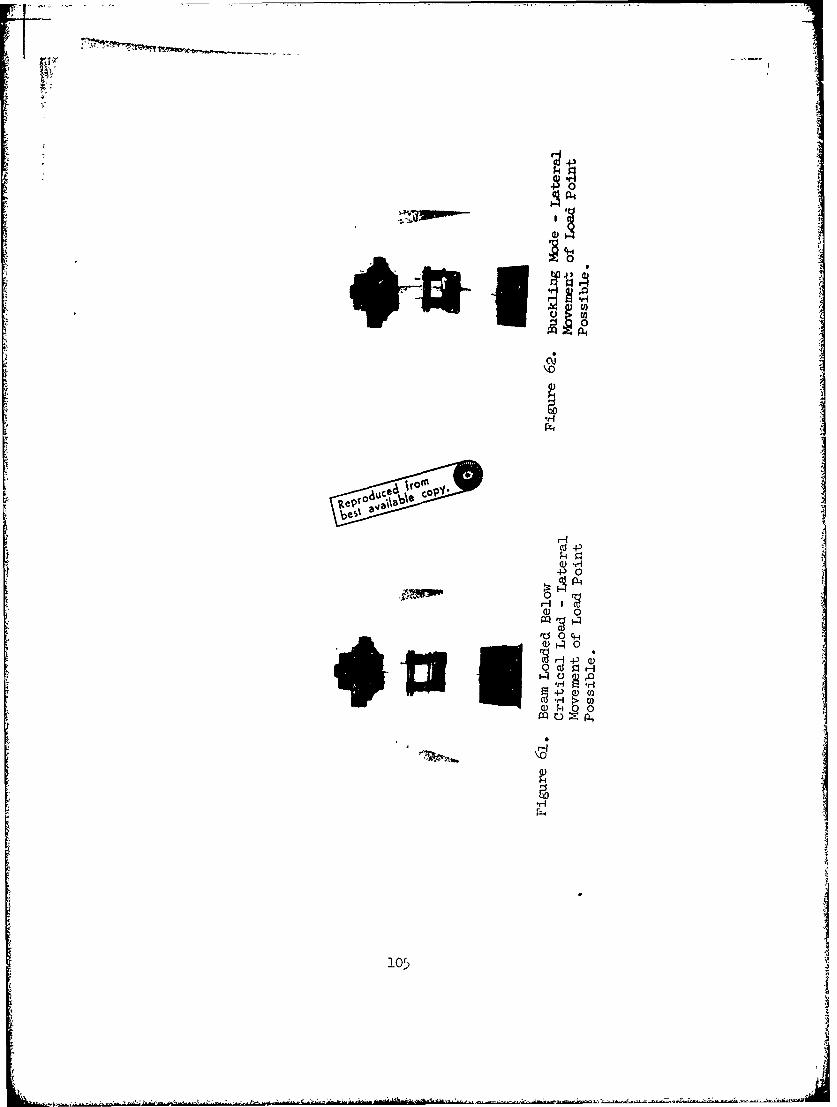
4-
rx1
HI%
a) 0
0) 0
0)
105
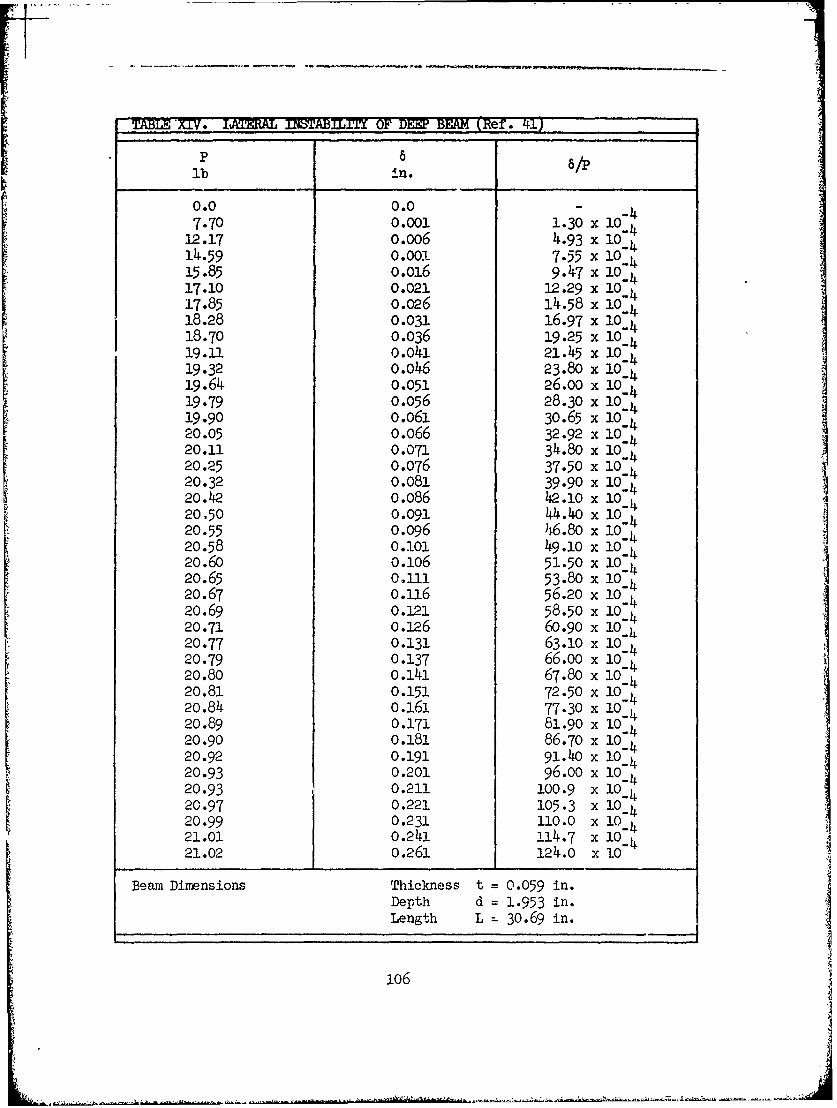
TABLE . LMMZ nOMBIITY OF DEE Ref,
P8lb in.
0.0 0.0 - 47.70 0.001 1.30 x 10_h
12.17 o.oo6 4.93 x 10414.59 0.001 7.55 x 10-15.85 o.o16 9.47 x 10-17.10 0.021 12.29 x 10417.85 0.026 14.58 x 10418.28 0.031 16.97 x 10418.70 0.036 19.25 x 10419.11 0.041 21.45 x 10419.32 0.046 23.80 x 10-19.64 0.051 26.00 x 10419.79 0.056 28.30 x 10⁴l19.90 0.061 30.65 x 10⁴'20.05 0.066 32.92 x 10⁴
20.11 0.071 34.8o x lO420.25 0.076 37.50 x 1020.32 0.081 39.90 x 10⁴-20.42 0.086 42.10 x 10-L20,50 0.091 44.40 x 10420.55 0.096 )t6.80 x 104
20.58 0.101 49.10 x 10420.60 0.106 51.50 x 10⁴h20.65 0.111 53.8o x i-20.67 o.116 56.20 x 10⁴h20.69 0.121 58.50 x 10.420.71 0.126 60.90 x lo420.77 0.131 63.10 x 10420.79 0.137 66.00 x l020.80 0.141 67.80 x 10-"'20.81 0.151 72.50 x 10-420.84 0.161 77.30 x 10-420.89 0.171 81.90 x 10"420.90 0.181 86.70 x 10420.92 0.191 91.40 x 10_420.93 0.201 96.00 x 10_420.93 0.211 100.9 x 10_4
20.97 0.221 105.3 x 10-420.99 0.231 110.0 x 10_421.01 0.241 114.7 x 10421.02 0.261 124.0 x 10
Beam Dimensions Thickness t = 0.059 in.
Depth d = 1.953 in.Length L = 30.69 in.
106
hI
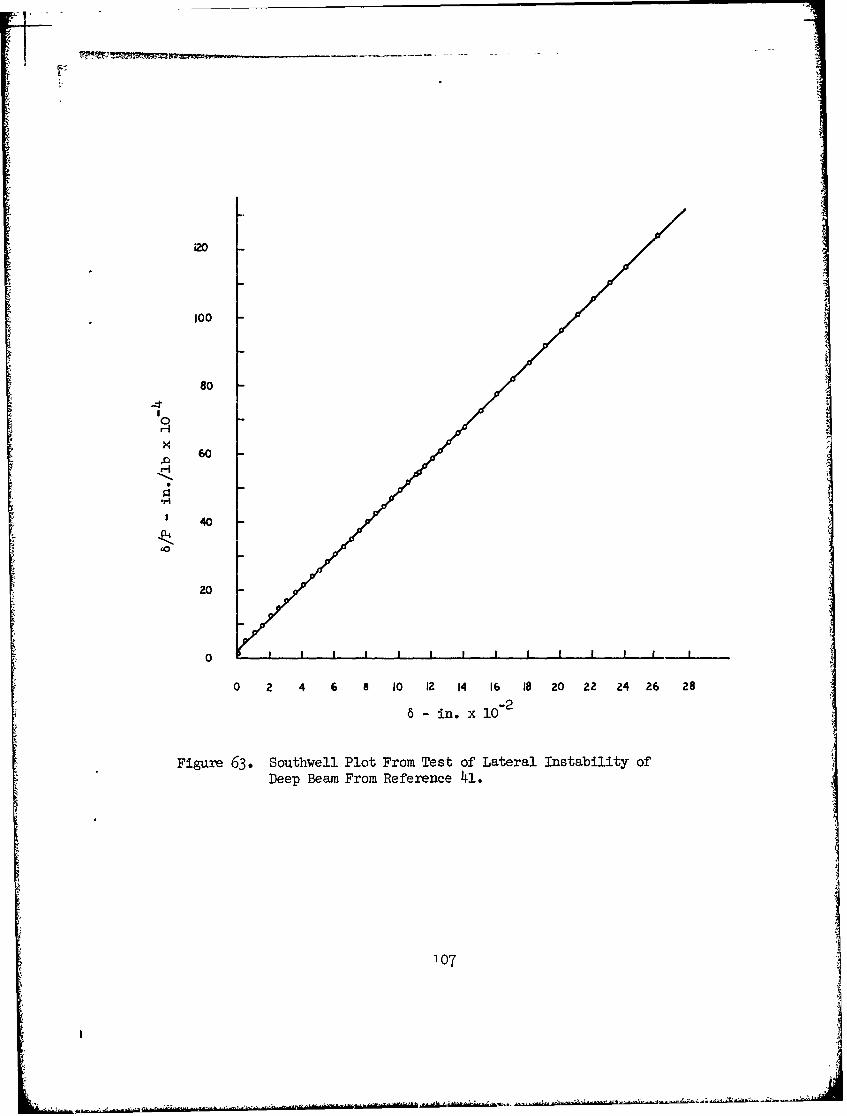
100
80
40
00
60
20
0 ' ' I I . I I I , I I 1 I ! I ,,
0 2 4 6 a 10 12 14 16 18 20 22 24 26 28
8 - in. x 10- 2
Figure 63. Southwell Plot From Test of Lateral Instability ofDeep Beam From Reference 41.
107
point lateral deflection, used for the Southwell representation couldequally well be. chosen as the angle of end rotation. In 1960, Gregory 36
applied the technique to frame structures under torsion and bending. Hd wasable to use the procedure tq develop a design system for lattice girdersliable to lateral buckling.34 The routine followed was to load the medbiE
* in question to a load valu- less than that required to precipitate insta-Lbility and, from the load-displacement relationship thus established, todetermine the effective initial imperfection and the theoretical criticalmoment. From these two experimentally established parameters, he then pred-dicted the probable buckling moment for this real structure.
Ariaratnam1 3 theoretically established the validity of the Southwell typelinear relationship for struts having a variable flexural rigidity andvarious end conditions and for plane frameworks subjected to both flexuraland torsional buckling. In 1963 Stevens and Schmidt 3 proposed a designscheme for frameworks. In this plan they combined the Southwell fonrulationwith an iteration procedure. Thus, they were able to predict the criticalloads in the compression components of the structure.
It is clear from the discussion already given that the key to the correlationof experiment and theory lies, in all cases, in the treatment of a slightlyimperfect system. From this presentation it might be inferred that Ayrtonand Perry were the first to realize that initial and elastic deformationsof a strut could be associated with the Euler load and the actual load. Thisis not so. Admittedly, Euler himself appears to have given consideration tothe initially straight column only. However, an awareness of the influenceof initial curvature has existed since the beginning of the nineteenthcentury. Young,44 in his course of Lectures on Natural Philosophy and theMechanical Arts published in 1807, gave a theorem with regard to this question.This theorem, theorem 323 in his Magnum Opus, states:
"If a beam is naturally of the form which a prismatic beam would acquire,if it were slightly by a longitudinal force, calling its depth, b, its length,e, the circumference of a circle of which the diameter is unity, c, the weightof the modulus of elasticity, m, the natural deviation from rectilinear form,d, and a force applied at the extremities of the axis, f, the total deviationfrom the rectilinear form will be
bbccdmbbccm - 12eef
If Young's equation is rewritten in present-day language, we obtain theformulation
wwt I - P
E
108.
where
= the total deflection
w = the initial deflection0
P= Euler L E1
P = axial load appled
This is identical. with the Southwell formulation, equation (ii), providedit is realized that in his time Young perpetrated Jacob Bernoulli's errorin determining the expression for the second moment ("Moment of Inertia")for the cross-sectional area. Bernoulli had fixed this for a rectangularsection as
bh3
3'
instead of the presently acceptable relationship of
bh3
1-
There is little in the literature between 1807 and 1886 to indicate thatengineers had taken note of Young's contribution, but it seems clear thatmany were aware of the lack of agreement between the Euler theory for aperfect body and reality. Smith,45 a contemporary of Ayrton and Perry,was certainly cognizant of the importance of initial curvature and eccentricloading prior to 1886. He recognized, about this time too, that the loaddisplacement curves for struts subjected to axial compression were hyper-bolic. This is evidenced from a footnote to Ayrton and Perry's report 5 andalso from Reference 45.
That the leaders in the field of engineering mechanics of this era recognizedthe problem and were acquainted with the mathematical relationship ofequation (14) is clear from T. Claxton Fidler's text.4 6 In this treatise of1887 he wrote: "Let R denote the resilient force of the ideal column, equalto EI2/L2, and let A denote the initial deflection, and 8 the elasticdeflection, then
P=RV "A+8
andp .
a n R -P (101)
ClaXLon Fidler's equation (99) is identical to Southwell's equation (14).Therefore, the deflection will now have a certain assignable value dependingon the load P; and if the load is gradually increased the column willexhibit an increasing deflection, or, in other words it will always be in
l09
a condition of stable equilibrium; and looking at formula (99) it is evidentthat when the load P is increased to within a little of the fixed quantity,R, the factor P/R - P will be a very large multiple, and a very smallinitial curvature (A) will then be sufficient to produce a comparativelylarge deflection of the column.
Without doubt, there were other derivations of this basic equation whichwe have not been able to trace, but few, if any, could be more general thanthat of Westergaard.16 In 1922, this author nade a very detailed study ofthe buckling of elastic structures. Where most previous and contemporaryanalyses dealt with buckling from the point of view of the differentialequations of equilibrium, Westergaard's analysis was based upon the use ofa generalized Lagrangian analysis. He made, of course, the usual assumptionswith regard to linearity of stress-strain relationships and considered onlydeflections which were small. In this manner, he was able to show thatthe relationship was by no means restricted to the simple ca umn. Unfortun-ately, like his predecessors, Fidler, Smith,45 and Young, he did notrecognize the potential of his formula for correlating theory and experiment.Neither, of course, did other engineers.
From analysis and by reference to tests made on virtually all practicalcases of tubes, braced structures, and flat plates subjected to in-planeloadings, it has been established in this report that the simple Southwell6
formula
Sc- 1) = constant~cr
is absolutely general and is of great importance in interpreting experimentaldata in all these areas.
Its equal applicability in the area of shell structures is asserted. Thisquestion is discussed in another report.29 The large displacement analysisbriefly mentioned for flat plates under compression and for the circulardisc with a central hot spot is also a method of wide generality and isdiscussed further in a paper to be published shortly.47
It is to be emphasized that the Southwell method calls for diligence inmeasurement of the displacements and for care in interpretation of theresults. It can be a dangerous practice, for example, to use a least-squares-fit method in constructing the line.
110
REFERENCES
1. Euler, L.: METHODUS INVENIENDI LINEAS CURVAS MAXI MINIMIVE ?RPRIETATEGAUDETES, SIVE SOLUTIO PROBLEMATIS IPERIDM CI LATISSIMO SENSUACCEFTI, Additamentum 1, De curvis elasticis; Marcus-Miclaelus Bousquet,p. 267, Lausanne and Geneva, 1744.
2. Hodgkinson, E.: EXPERIMENTAL RESEARCHES ON THE STRENGTH AND OTHERPROPERTIES OF CAST IRON, (Forming a second part to the 4th edition of
* "Tredgold's "Practical Essay on the Strength of Cast Iron and otherMetals"), Vol. II, 4th Ed., John Weale, London, 1842.
3. Euler, L.: SUR LA FORCE DES COLONNES, Mmoires de L'Acad4mie de Berlin,XIII, 1759.
4. Poisson, M.: TRAIT1 DE NG9HANIQUE, Vol. I, 2nd Ed., 1833.
5. Ayrton, W. E., and Perry, John: ON STRUTS, The Engineer, Vol. 62,December 10, 1886, pp. 464-465, and December 24, 186 p. 513-515.
6. Southwell, R. V.: ON THE ANALYSIS OF EXPERIMENTAL OBSERVATIONS INPROBLEMS OF ELASTIC STABILITY, Proceedings of the Royal Society, A,Vol. 135, 1932, pp. 601-616.
7. Donnell, L. H.: ON THE APPLICATION OF SOUTHWELL'S METHOD FOR THEANALYSIS OF BUCKLING TESTS, Stephen Timoshenko 60th Anniversary Volume,MWGraw-Hill Book Company, 1938, pp. 27-38.
8. von Karman, Theodore: UNTER SUGHUNGER UBER KNICK FEST IG KEIT, MITTELUNGER UBER FORSCHUNGSARBEITEN AUF DEM GEBEITE DES INGENIEURWESENS,Vol. 81, 1960.
9. Lundquist, E. E.: GENERALIZED ANALYSIS OF EXPERIMENTAL OBSERVATIONS INPROBLEMS OF ELASTIC STABILITY, NACA TN-658, 1938.
10. Fisher, H. R.: NOTE OF A METHOD OF REPRESENTING SPAR TESTS, A.R.C.Vol. II, R and M no. 1437, February 1933, P. 497.
11. Fisher, H. R.: AN EXTENSION OF SOUTHWELL'S METHOD OF ANALYZINGEXPERIMENTAL OBSERVATIONS IN PROBLEMS OF ELASTIC STABILITY, Proceedingsof the Royal Society, A, Vol. 144, 1934, pp. 609-630.
12. Hayashi, T., and Kihira, M.: ON A METHOD OF EXPERIMENTAL DETER IINATIONOF THE BUCKLING LOAD OF AN ELASTICALLY SUPPORTED COLUMN, Paper presentedat Japan Congress on Testing Materials, Kyoto, Japan, September 1966.
13. Ariaratnam, S. T.: THE SOUTHWELL METHOD FOR PREDICTING CRITICAL LOADSOF ELASTIC STRUCTURES, The Quarterly Journal of Mechanics and AppliedMathematics, Vol. XIV, 1961, pp. 137-153.
14. Hill, H. N.: NOTE ON THE ANALYTICAL TREATMENT OF LATERAL DEFLECTIONMEASUREMENTS FROM TESTS INVOLVING STABILITY PROBLEMS, Unpublished AlcoaReport. 111
ij
15. Tuckerman, L. B.: HETEMOSTATIC LOADING AND CRITICAL ASTATIC LOADS,National Bureau of Standards Research Paper RP 1163, Journal ofResearch NBS, Vol. 22, January 1939, pp. 1-18.
16. Westergaard, H. M.: BUCKLING OF ELASTIC STRUCTURES, Transactionsof the American Society of Civil Engineers, Vol. 85, 1922, pp. 576-654.
17. Bridget, F. J., Jerome, C. C., and Vosseller, A. B.: SOME NEW EXPER-IMENTS ON THE BUCKLING OF THIN WALL CONSTRUCTION, Transactions of theAmerican Society of Mechanical Engineers. Vol. 56, 1934.
18. Gough, H. J., and Cox, H. L.: SOME TESTS ON THE STABILITY OF THINSTRIP MATERIAL UNDER SHEARING FORCES, Proceedings of the Royal Society.A, Vol. 137, 1932, pp. 145-157.
19. Southwell, R. V., and Skan, Sylvia W.: ON THE STABILITY UNDER SHEAR-ING FORCES OF A FLAT ELASTIC STRIP, Proceedings of the Royal Society,A, Vol. 105, 1924, p. 582.
20. Timoshenko, S. P., and Gere, J. M.: THEORY OF ELASTIC STABILITY,
2nd Ed., McGraw-Hill Book Co., 1961.
21. Donnell, L. H.: A NEW THEORY FOR THE BUCKLING OF THIN CYLINDERS UNDERAXIAL COMPRESSION AND BENDING, Transactions of the American Society ofMechanical Enineers, Vol. 56, AER-56-12, November 1934, pp. 795-806.
22. von Karman, Theodore: ENCLYKLOPEADIE DER MATfEMATISCHEN WISSENSCHAFTEN,IV, ART. 27, 1910, p. 349.
23. Yoshiki, M.: A NEW METHOD OF DETERMINING THE CRITICAL BUCKLING POINTSOF RECTANGULAR PLATES IN COMPRESSION, Journal of the Society of AppliedMechanics of Japan, Vol. 3, No. 1, 1947.
24. Yoshiki, M., Fujita, Y., and Yoshida, K.: PLASTIC DESIGN IN STEELSTRUCTURES (6th Report) - COMPRESSIVE STRENGTH OF STRUCTURAL ELEMENTSIN PLASTIC RANGE, Journal of the Society of Naval Architecture ofJapan, No. 118, July 1965.
25. Yoshiki, M., and Fujita, Y.: A NEW METHOD TO DETERMINE THE PLASTICBUCKLING LOAD OF AXIALLY COMPRESSED PLATE FROM EXPERIMENTAL DATA,American Society for Testing and Materials, 69th Annual Meeting,Paper No. 210, 1966.
26. Coan, J. M.: LARGE DEFLECTION THEORY FOR PLATES WITH SMALL INITIALCURVATURE LOADED IN EDGE COMPRESSION, Journal of Applied Mechanics,June 1951, pp. 143-151.
27. Hoff, N. J., Bolay, B. A., and Coan, J. M.: THE DEVELOPMENT OF ATECHNIQUE FOR TESTING STIFF PANELS IN EDGEWISE COMPrbSION, Proceedingsof the Society for Experimental Stress AnalysJs, Vcl. V, No. II,pp. 14-24.
112
-M -FI* e- -
i~i
28. Loo, T. C., and Evan-Iwanowski, R. M.: DEFORMATIONS AND COLLAPSE OFSPHERICAL DOMES SUBJECTED TO UNIFORM PRESSURE AND NORMAL CONCENTRATEDLOADS AT THE APEX, Proceedings of the World Conference on Shell
Structures, San Francisco, 1962.
29. Horton, W. H., and Cundari, F. L.: ON THE APPLICABILITY OF TH,SOUTHWELL PLOT TO THE INTERPRETATION OF TEST DATA OBTAINED FROMINSTABILITY STUDIES OF SHELL BODIES, SUDAAR No. 290, Department ofAeronautics and Astronautics, Stanford University, Agust 1966.
30. Turner, M. J., Martin, H. C., and Weikel, R. C.: FURTHER DEVELOPMENTOF THE STIFFNESS METHOD, AGARD Structures and Materiel Panel, Paris,France, July 1962, Agardograph 72, New York, Pergamon Press, TheMacMillan Co., 1964.
31. Martin, H. C.: LARGE DEFLECTION AND STABILITY ANALYSIS BY THE DIRECTSTIFFNESS METHOD, NASA-JPL Technical Report no. 32-931, August 1, 1966,in which reference is made to the possible application of the Southwellplot to square panels under biaxial load.
32. Walker, A. C.: LOCAL INSTABILITY IN PLATES AD CHANNEL STRUTS, Journalof the Structural Division, Proceedings of the American Society ofCivil Engineers, Vol. 92, No. ST 3, June 1966, pp. 38-55.
33. Ramberg, W., McPherson, A. E., and Levy, S. : EXPERIMENTAL STUDY OF
DEFORMATION AND OF EFFECTIVE WIDTH IN AXIALLY LOADED SHEET-STRINGERPANELS, NACA Technical Note 684, February 1939.
34. Gregory, M. S. : THE USE OF NEAS ED STRAINS TO OBTAIN THE CRITICALLOAD OF A STRUT, C:vil Engineering and Public Works Review, LondonVol. 55., No. 642, January 1960, pp. 80-82.
35. Gregory, M. S.: THE USE OF THE SOUTHWELL PLOT ON STRAINS TO DETERMINETHE FAILURE LOAD OF A LATTICE GIRDER WHEN LATERAL BUC-LING OCCUR,Australian Journal of Applied Science, Vol. 10, No. 4. December 1959,pp. 371-376.
36. Greg ,M. S.: H BUCKLING OF AN EQUILATERAL TRIANGULAR FRAME IN ITS
PLANE, Australian Journal of Applied Science, Vol. 10, No. 4, December195% P.3-67-7387.
37. Gregory, M. S.: THE APPLICATION OF THE SOUTHWELL PLOT ON STRAINS TOPROBLEMS OF ELASTIC TNSTABILITY OF FRAMED STRUCTURES, WHERE BUCKLING OFMEMBERS !N TORSION AND FLEXURE OCCURS, Austrailian Journal of AppliedScience, Vol. II, No. 1, March 1960, pp.---9-64.
38. Queinec, A.: THERYMAL BUCKLING OF CENTRALLY HEATED CIRCULAR PLATES,
SUDAER No. 106, Departrrient of Aeronautics and Astronautics, StanfordUniversity, June 1961.
39. Tinoshenko, S., and GoodLer, J. N.: THEORY OF ELASTICITY, 2nd Ed.,McGraw-Hill Book Co., 1951.
113
40. Fernande4-Sintes, J., Horton, W. H., and Hoff, N. J.: THERMAL BUCKLINGOF ANNULAR PLATES, SUDAER No. 143, Department of Aeronautics and Astro-nautics, Stanford University, December 1962.
41. Way, E.: AN EXPEMIMENTAL STUDY OF THE INSTABILIT1 OF DEEP BEAMS,Engineer's Thesis, under preparation.
h2. Lundquist, E. E.: A METHOD OF ESTIMATING THE CRITICAL BUCKLING LOADFOR STRUCTURAL MEMBERS, NACA Technical Note 717, July 1939.
43. Stevens, L. K., and Schmidt, L. C.: DETERMINATION OF ELASTIC CRITICALLOADS, Journal of the Structural Division, Proceedings of the American
Siety of CiviEnier Vl89NoST6 Part 1, December 1963,_
pp. 137-158.
44. Young, T.: A COURSE OF LECTURES ON NATURAL PHILOSOPHY AND THE MECHANICALARTS, Vol. II, 1st Ed., Sect. IX, London, 1807, p. 47.
45. Smith, R. H., Wheatley, and Wood: STIFFNESS OF STRUTS, The EngineerVol. LXV, January 6, 1888, p. 1.
46. Fidler, T. C.: A PRACTICAL TREATISE ON BRIDGE CONSTRUCTION, 1st Ed.,London, 1887.
47. Horton, W. H., Tenerelli, D., and Willey, B. A.: A COMPARISON OF SMALLAND LARGE DISPLACEMENT METHODS.
114
Related Documents