United States Department of Agriculture Natural Resources Conservation Service Arizona Basin Outlook Report February 1, 2013

Welcome message from author
This document is posted to help you gain knowledge. Please leave a comment to let me know what you think about it! Share it to your friends and learn new things together.
Transcript

United States Department of Agriculture Natural Resources Conservation Service
Arizona Basin Outlook Report February 1, 2013

Issued by Released by Jason Weller Keisha L. Tatem Chief State Conservationist Natural Resources Conservation Service Natural Resources Conservation Service U.S. Department of Agriculture Phoenix, Arizona Basin Outlook Reports And Federal – State – Private Cooperative Snow Surveys
How forecasts are made Most of the annual streamflow in Arizona originates as snowfall that has accumulated in the mountains during the winter and early spring. As the snowpack accumulates, hydrologists estimate the runoff that will occur when it melts. Measurements of snow water equivalent at selected manual snow courses and automated Snow Telemetry (SNOTEL) sites, along with precipitation and streamflow values, are used in statistical and simulation models to prepare runoff forecasts. These forecasts are coordinated between hydrologists in the Natural Resources Conservation Service (NRCS) the National Weather Service, and the Salt River Project. Forecasts of any kind are not perfect. Streamflow forecast uncertainty arises from three primary sources: (1) uncertainty of future weather conditions, (2) uncertainty in the forecasting procedure, and (3) errors in the data. The forecast, therefore, must be interpreted not as a single value but rather as a range of values with specific probabilities of occurrence. The middle of the range is expressed by the 50% exceedance probability forecast, for which there is a 50% chance that the actual flow will be above, and a 50% chance that the actual flow will be below, this value. To describe the expected range around this 50% value, four other forecasts are provided, two smaller values (90% and 70% exceedance probability) and two larger values (30%, and 10% exceedance probability). For example, there is a 90% chance that the actual flow will be more than the 90% exceedance probability forecast. The wider the spread among these values, the more uncertain the forecast. As the season progresses, forecasts become more accurate, primarily because a greater portion of the future weather conditions become known. This is reflected by a narrowing of the range around the 50% exceedance probability forecast. Users should take this uncertainty into consideration when making operational decisions by selecting forecasts corresponding to the level of risk they are willing to assume about the amount of water to be expected. If users anticipate receiving a lesser supply of water, or are concerned about having an adequate water supply, they may want to base their decisions on the 90% or 70% exceedance probability forecasts. On the other hand, if users anticipate receiving too much water, or are concerned about the threat of flooding, they may want to base their decisions on the 30% or 10% exceedance probability forecasts. Regardless of the forecast value users choose, they should be prepared to deal with either more or less water.
The United States Department of Agriculture (USDA) prohibits discrimination in its programs on the basis of race, color, national origin, sex, religion, age, disability, political beliefs and marital or familial status. (Not all prohibited bases apply to all programs.) Persons with disabilities who require alternative means for communication of program information (Braille, large print, audiotape, etc.) should contact USDA's TARGET Center at 202-720-2600 (voice and TDD). To file a complaint, write the Secretary of Agriculture, U.S. Department of Agriculture, Washington, D.C., 20250, or call 1-800-245-6340 (voice) or (202) 720-1127 (TDD). USDA is an equal employment opportunity employer.
For more water supply and resource management information, contact: Dino DeSimone Water Supply Specialist 230 N. First Ave., Suite 509 Phoenix, AZ 85003-1706 Phone: (602) 280-8786 Email: [email protected]
3
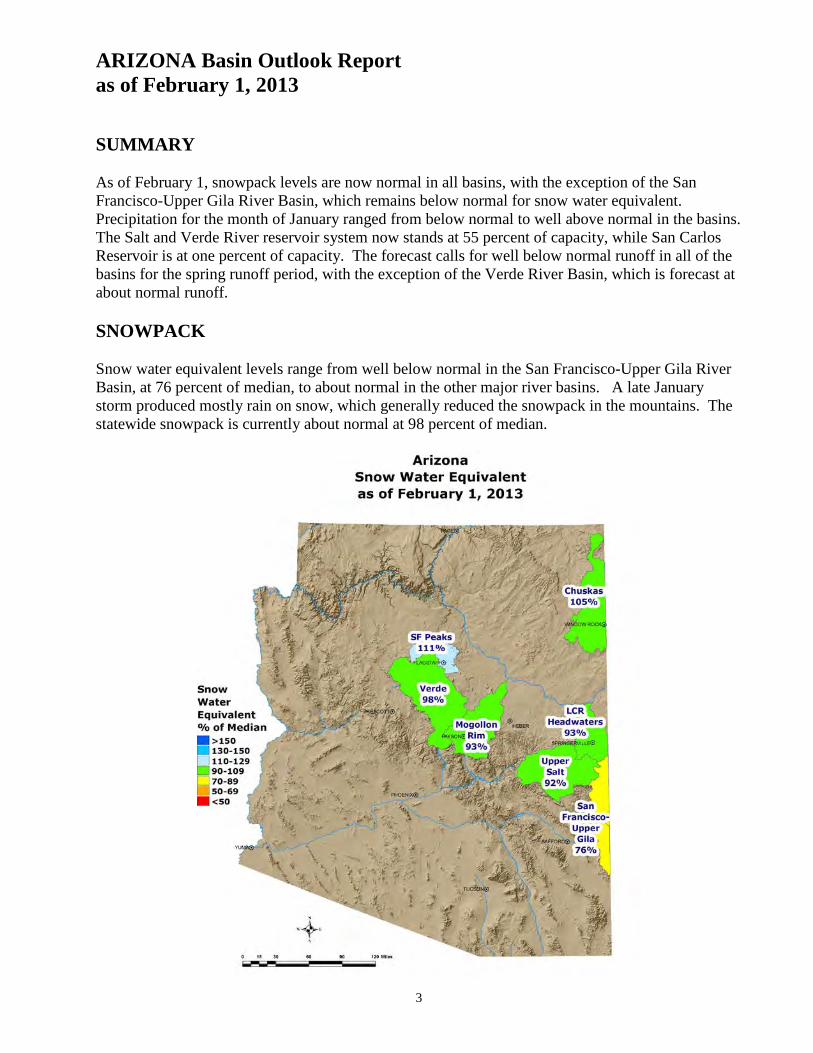
ARIZONA Basin Outlook Report as of February 1, 2013 SUMMARY As of February 1, snowpack levels are now normal in all basins, with the exception of the San Francisco-Upper Gila River Basin, which remains below normal for snow water equivalent. Precipitation for the month of January ranged from below normal to well above normal in the basins. The Salt and Verde River reservoir system now stands at 55 percent of capacity, while San Carlos Reservoir is at one percent of capacity. The forecast calls for well below normal runoff in all of the basins for the spring runoff period, with the exception of the Verde River Basin, which is forecast at about normal runoff. SNOWPACK Snow water equivalent levels range from well below normal in the San Francisco-Upper Gila River Basin, at 76 percent of median, to about normal in the other major river basins. A late January storm produced mostly rain on snow, which generally reduced the snowpack in the mountains. The statewide snowpack is currently about normal at 98 percent of median.

4
PRECIPITATION Mountain data from NRCS SNOTEL sites and Cooperator gages show that January precipitation ranged from 78 percent of average in the San Francisco-Upper Gila River Basin to 149 percent of average in the Verde River Basin. A major storm during the last week of the month produced 5-7 inches of rain and snow at some SNOTEL sites along the Mogollon Rim. Cumulative precipitation since October 1 is now normal in all basins, with the exception of the San Francisco-Upper Gila River Basin, which remains well below normal. Please refer to the precipitation bar graphs found in this report for more information on precipitation levels in the basins. RESERVOIR STORAGE As of February 1, the Salt and Verde River reservoir system stands at 55 percent of capacity. San Carlos Reservoir remains well below normal at only one percent of capacity.
Key storage volumes displayed in thousands of acre-feet (x1000): Reservoir
Current Storage
Last Year Storage
30-Year Average
Storage Capacity
Salt River System 1091.1 1453.2 1240.0 2025.8 Verde River System 167.2 73.4 154.4 287.4 San Carlos Reservoir 8.3 23.7 366.8 875.0 Lyman Lake 4.4 9.5 12.3 30.0 Lake Havasu 580.2 553.9 556.4 619.0 Lake Mohave 1649.8 1627.7 1676.0 1810.0 Lake Mead 13828.0 15022.0 20452.0 26159.0 Lake Powell 12190.0 15648.0 17338.0 24322.0
0.0
200.0
400.0
600.0
800.0
1000.0
1200.0
1400.0
1600.0
Salt Verde San Carlos
Rese
rvoi
r Sto
rage
-100
0's o
f Acr
e-Fe
et
RESERVOIR STORAGE as of FEBRUARY 1
Current Storage
Last Year's Storage
Average (normal)

5
STREAMFLOW As of February 1, the forecast calls for well below normal to normal streamflow for the spring runoff period, ranging from 48 percent of median in the Gila River near Solomon to 103 percent of median in the Verde River above Horseshoe Dam. The updated streamflow forecasts represent an upgrade for the Salt and Verde River Basins and a slight downgrade for the San Francisco-Upper Gila River Basin. Please refer to the basin forecast tables found in this report for more information regarding water supply forecasts.

6
SALT RIVER BASIN as of February 1, 2013 Below normal to well below normal streamflow levels are forecast for the basin. In the Salt River, near Roosevelt, the forecast calls for 63% of median streamflow through May, while at Tonto Creek, the forecast calls for 86% of median streamflow through May. Snow survey measurements show the Salt snowpack to be at 92% of median.
0.0
2.0
4.0
6.0
8.0
10.0
12.0
14.0
1-Ja
n
15-J
an
1-Fe
b
15-F
eb
1-M
ar
15-M
ar
1-A
pr
Wat
er C
onte
nt (i
nche
s)
Mountain Snowpack Salt River Basin
Average Maximum
Minimum Current
0
20
40
60
80
100
120
140
160
Oct Nov Dec Jan Feb Mar
Perc
ent o
f Ave
rage
Precipitation Salt River Basin
Monthly Year-to-date

7
SALT RIVER BASIN as of February 1, 2013 ================================================================================ SALT RIVER BASIN Streamflow Forecasts - February 1, 2013 ================================================================================ | <=== Drier === Future Conditions === Wetter ===> | | | Forecast Pt | ============== Chance of Exceeding * ============== | Forecast | 90% 70% | 50% | 30% 10% | 30 Yr Med Period |(1000AF) (1000AF)|(1000AF) (% MED.)|(1000AF) (1000AF)| (1000AF) ================================================================================ Salt R nr Roosevelt (3) FEB-MAY 79 132 180 63 240 345 285 FEBRUARY 40 103 39 Tonto Ck ab Gun Ck nr Roosevelt (3) FEB-MAY 6.5 17.7 30 86 47 82 35 FEBRUARY 10.0 97 10.3 ================================================================================ * 90%, 70%, 50%, 30%, and 10% chances of exceeding are the probabilities that the actual volume will exceed the volumes in the table. The average and median are computed for the 1981-2010 base period. (1) - The values listed under the 10% and 90% Chance of Exceeding are actually 5% and 95% exceedance levels. (2) - The value is natural volume - actual volume may be affected by upstream water management. (3) - Median value used in place of average. ================================================================================ SALT RIVER BASIN Reservoir Storage (1000AF) End of January ================================================================================ Usable ********** Usable Storage ********* Reservoir Capacity This Year Last Year Average ================================================================================ SALT RIVER RES SYSTEM 2025.8 1091.1 1452.8 1240.0 ================================================================================ SALT RIVER BASIN Watershed Snowpack Analysis - February 1, 2013 ================================================================================ Number of This Year as Percent of Watershed Data Sites Last Year Median ================================================================================ SALT RIVER BASIN 10 96 92 ================================================================================

8
VERDE RIVER BASIN as of February 1, 2013 Normal streamflow levels are forecast for the basin. In the Verde River above Horseshoe Dam, the forecast calls for 103% of median streamflow through May. Snow survey measurements show the Verde snowpack to be at 98% of median.
0.0
2.0
4.0
6.0
8.0
10.0
12.0
14.0
1-Ja
n
15-J
an
1-Fe
b
15-F
eb
1-M
ar
15-M
ar
1-A
pr
Wat
er C
onte
nt (i
nche
s)
Mountain Snowpack Verde River Basin
Average Maximum
Minimum Current
0
20
40
60
80
100
120
140
160
Oct Nov Dec Jan Feb Mar
Perc
ent o
f Ave
rage
Precipitation Verde River Basin
Monthly Year-to-date

9
VERDE RIVER BASIN as of February 1, 2013 ================================================================================ VERDE RIVER BASIN Streamflow Forecasts - February 1, 2013 ================================================================================ | <=== Drier === Future Conditions === Wetter ===> | | | Forecast Pt | ============== Chance of Exceeding * ============== | Forecast | 90% 70% | 50% | 30% 10% | 30 Yr Med Period |(1000AF) (1000AF)|(1000AF) (% MED.)|(1000AF) (1000AF)| (1000AF) ================================================================================ Verde R bl Tangle Ck ab Horseshoe Dam (3 FEB-MAY 52 97 140 103 193 295 136 FEBRUARY 42 120 35 ================================================================================ * 90%, 70%, 50%, 30%, and 10% chances of exceeding are the probabilities that the actual volume will exceed the volumes in the table. The average and median are computed for the 1981-2010 base period. (1) - The values listed under the 10% and 90% Chance of Exceeding are actually 5% and 95% exceedance levels. (2) - The value is natural volume - actual volume may be affected by upstream water management. (3) - Median value used in place of average. ================================================================================ VERDE RIVER BASIN Reservoir Storage (1000AF) End of January ================================================================================ Usable ********** Usable Storage ********* Reservoir Capacity This Year Last Year Average ================================================================================ VERDE RIVER RES SYSTEM 287.4 167.2 74.0 154.4 ================================================================================ VERDE RIVER BASIN Watershed Snowpack Analysis - February 1, 2013 ================================================================================ Number of This Year as Percent of Watershed Data Sites Last Year Median ================================================================================ VERDE RIVER BASIN 11 132 98 SAN FRANCISCO PEAKS 2 150 111 ================================================================================

10
SAN FRANCISCO-UPPER GILA RIVER BASIN as of February 1, 2013 Well below normal streamflow levels are forecast for the basin. In the San Francisco River, at Clifton, the forecast calls for 63% of median streamflow levels through May. In the Gila River, near Solomon, the forecast calls for 48% of median streamflow levels through May. At San Carlos Reservoir, inflow to the lake is forecast at 38% of median through May. Snow survey measurements show the snowpack for this basin to be at 76% of median.
0.0
1.0
2.0
3.0
4.0
5.0
6.0
7.0
8.0
9.0
10.0
1-Ja
n
15-J
an
1-Fe
b
15-F
eb
1-M
ar
15-M
ar
1-A
pr
Wat
er C
onte
nt (i
nche
s)
Mountain Snowpack San Francisco - Upper Gila River
Basin Average Maximum
Minimum Current
0
20
40
60
80
100
120
Oct Nov Dec Jan Feb Mar
Perc
ent o
f Ave
rage
Precipitation San Francisco - Upper Gila River
Basin Monthly Year-to-date

11
SAN FRANCISCO - UPPER GILA RIVER BASIN as of February 1, 2013 ================================================================================ SAN FRANCISCO - UPPER GILA RIVER BASIN Streamflow Forecasts - February 1, 2013 ================================================================================ | <=== Drier === Future Conditions === Wetter ===> | | | Forecast Pt | ============== Chance of Exceeding * ============== | Forecast | 90% 70% | 50% | 30% 10% | 30 Yr Med Period |(1000AF) (1000AF)|(1000AF) (% MED.)|(1000AF) (1000AF)| (1000AF) ================================================================================ Gila R at Gila (3) FEB-MAY 12.0 16.0 23 46 32 48 50 Gila R bl Blue Ck nr Virden (3) FEB-MAY 11.0 15.4 28 44 44 75 63 San Francisco R at Glenwood (3) FEB-MAY 3.8 8.4 13.0 71 19.0 31 18.2 San Francisco R at Clifton (3) FEB-MAY 6.8 19.6 32 63 47 76 51 Gila R nr Solomon (3) FEB-MAY 19.0 34 59 48 91 150 123 FEBRUARY 17.0 74 23 San Carlos Reservoir Inflow (2,3) FEB-MAY 0.0 10.5 31 38 62 128 81 ================================================================================ * 90%, 70%, 50%, 30%, and 10% chances of exceeding are the probabilities that the actual volume will exceed the volumes in the table. The average and median are computed for the 1981-2010 base period. (1) - The values listed under the 10% and 90% Chance of Exceeding are actually 5% and 95% exceedance levels. (2) - The value is natural volume - actual volume may be affected by upstream water management. (3) - Median value used in place of average. ================================================================================ SAN FRANCISCO - UPPER GILA RIVER BASIN Reservoir Storage (1000AF) End of January ================================================================================ Usable ********** Usable Storage ********* Reservoir Capacity This Year Last Year Average ================================================================================ SAN CARLOS 875.0 8.3 23.7 366.8 ================================================================================ SAN FRANCISCO - UPPER GILA RIVER BASIN Watershed Snowpack Analysis - February 1, 2013 ================================================================================ Number of This Year as Percent of Watershed Data Sites Last Year Median ================================================================================ SAN FRANCISCO - UPPER GILA R 11 73 76 ================================================================================

12
LITTLE COLORADO RIVER BASIN as of February 1, 2013 Well below normal streamflow levels are forecast for the basin. In the Little Colorado River, at Lyman Lake, the forecast calls for 61% of median streamflow through June. At Blue Ridge (C.C. Cragin) Reservoir, inflow to the lake is forecast at 55% of median through May. Snowpacks along the southern headwaters of the Little Colorado River, and along the central Mogollon Rim, were both measured at 93% of median.
0.0
2.0
4.0
6.0
8.0
10.0
12.0
14.0
1-Ja
n
15-J
an
1-Fe
b
15-F
eb
1-M
ar
15-M
ar
1-A
pr
Wat
er C
onte
nt (i
nche
s)
Mountain Snowpack Little Colorado River Basin
Average Maximum
Minimum Current
0
20
40
60
80
100
120
140
160
Oct Nov Dec Jan Feb Mar
Perc
ent o
f Ave
rage
Precipitation Little Colorado River Basin
Monthly Year-to-date

13
LITTLE COLORADO RIVER BASIN as of February 1, 2013 ================================================================================ LITTLE COLORADO RIVER BASIN Streamflow Forecasts - February 1, 2013 ================================================================================ | <=== Drier === Future Conditions === Wetter ===> | | | Forecast Pt | ============== Chance of Exceeding * ============== | Forecast | 90% 70% | 50% | 30% 10% | 30 Yr Med Period |(1000AF) (1000AF)|(1000AF) (% MED.)|(1000AF) (1000AF)| (1000AF) ================================================================================ Little Colorado R ab Lyman Lake (3) FEB-JUN 1.59 2.80 4.00 61 5.40 8.10 6.60 Rio Nutria nr Ramah FEB-MAY 0.01 0.18 0.50 36 1.08 2.60 1.40 Ramah Reservoir Inflow (3) FEB-MAY 0.00 0.02 0.27 35 0.79 2.10 0.77 Zuni River ab Black Rock Reservoir (3) FEB-MAY 0.08 0.21 0.35 92 0.54 0.91 0.38 Blue Ridge Reservoir Inflow (3) FEB-MAY 1.7 4.7 9.0 55 12.6 22 16.3 Lake Mary Reservoir Inflow (3) FEB-MAY 1.07 2.10 3.00 70 4.20 6.50 4.30 ================================================================================ * 90%, 70%, 50%, 30%, and 10% chances of exceeding are the probabilities that the actual volume will exceed the volumes in the table. The average and median are computed for the 1981-2010 base period. (1) - The values listed under the 10% and 90% Chance of Exceeding are actually 5% and 95% exceedance levels. (2) - The value is natural volume - actual volume may be affected by upstream water management. (3) - Median value used in place of average. ================================================================================ LITTLE COLORADO RIVER BASIN Reservoir Storage (1000AF) End of January ================================================================================ Usable ********** Usable Storage ********* Reservoir Capacity This Year Last Year Average ================================================================================ LYMAN RESERVOIR 30.0 4.4 9.5 12.3 ================================================================================ LITTLE COLORADO RIVER BASIN Watershed Snowpack Analysis - February 1, 2013 ================================================================================ Number of This Year as Percent of Watershed Data Sites Last Year Median ================================================================================ LITTLE COLORADO - SOUTHERN H 10 91 93 CENTRAL MOGOLLON RIM 4 90 93 ================================================================================

14
CHUSKA MOUNTAINS as of February 1, 2013 Snow survey measurements conducted by staff of the Navajo Nation Water Management Branch show the Chuska snowpack to be at 105% of median. Below normal runoff is forecast for Captain Tom Wash and Kinlichee Creek, and about normal runoff is forecast for Bowl Canyon Creek.
0.0
2.0
4.0
6.0
8.0
10.0
12.0
14.0
1-Ja
n
15-J
an
1-Fe
b
15-F
eb
1-M
ar
15-M
ar
1-A
pr
Wat
er C
onte
nt (i
nche
s)
Mountain Snowpack Chuska Mountains
Average Maximum
Minimum Current
0
0.2
0.4
0.6
0.8
1
1.2
Oct Nov Dec Jan Feb Mar
Perc
ent o
f Ave
rage
Not Available
Precipitation Chuska Mountains Monthly Year-to-date

15
CHUSKA MOUNTAINS as of February 1, 2013 ================================================================================ CHUSKA MOUNTAINS Streamflow Forecasts - February 1, 2013 ================================================================================ | <=== Drier === Future Conditions === Wetter ===> | | | Forecast Pt | ============== Chance of Exceeding * ============== | Forecast | 90% 70% | 50% | 30% 10% | 30 Yr Avg Period |(1000AF) (1000AF)|(1000AF) (% AVG.)|(1000AF) (1000AF)| (1000AF) ================================================================================ Captain Tom Wash nr Two Gray Hills MAR-MAY 0.24 0.96 1.88 72 3.20 6.30 2.60 Bowl Canyon Ck ab Asaayi Lake MAR-MAY 0.44 0.85 1.20 92 1.61 2.30 1.30 Kinlichee Ck MAR-MAY 0.09 0.54 1.21 80 2.30 4.80 1.52 ================================================================================ * 90%, 70%, 50%, 30%, and 10% chances of exceeding are the probabilities that the actual volume will exceed the volumes in the table. The average is computed for the 1981-2010 base period. (1) - The values listed under the 10% and 90% Chance of Exceeding are actually 5% and 95% exceedance levels. (2) - The value is natural volume - actual volume may be affected by upstream water management. (3) - Median value used in place of average. ================================================================================ CHUSKA MOUNTAINS Watershed Snowpack Analysis - February 1, 2013 ================================================================================ Number of This Year as Percent of Watershed Data Sites Last Year Median ================================================================================ CHUSKA MOUNTAINS 6 173 105 DEFIANCE PLATEAU 2 265 110 ================================================================================

16
NORTHWESTERN ARIZONA as of February 1, 2013 On the Colorado River, well below normal inflow to Lake Powell is forecast at 52% of the 30-year average for the forecast period April-July. At the Grand Canyon, measurements conducted by park rangers show the snowpack to be at 88% of median.
0.0
2.0
4.0
6.0
8.0
10.0
12.0
14.0
1-Ja
n
15-J
an
1-Fe
b
15-F
eb
1-M
ar
15-M
ar
1-A
pr
Wat
er C
onte
nt (i
nche
s)
Mountain Snowpack Grand Canyon Arizona
Average Maximum
Minimum Current
0
10
20
30
40
50
60
Oct Nov Dec Jan Feb Mar
Perc
ent o
f Ave
rage
Precipitation Northwestern Arizona
Monthly Year-to-date

17
NORTHWESTERN ARIZONA as of February 1, 2013 ================================================================================ NORTHWESTERN ARIZONA Streamflow Forecasts - February 1, 2013 ================================================================================ | <=== Drier === Future Conditions === Wetter ===> | | | Forecast Pt | ============== Chance of Exceeding * ============== | Forecast | 90% 70% | 50% | 30% 10% | 30 Yr Avg Period |(1000AF) (1000AF)|(1000AF) (% AVG.)|(1000AF) (1000AF)| (1000AF) ================================================================================ Virgin R at Littlefield APR-JUL 17.0 30 46 71 66 101 65 Lake Powell Inflow (2) APR-JUL 1733 2841 3750 52 4785 6536 7160 ================================================================================ * 90%, 70%, 50%, 30%, and 10% chances of exceeding are the probabilities that the actual volume will exceed the volumes in the table. The average is computed for the 1981-2010 base period. (1) - The values listed under the 10% and 90% Chance of Exceeding are actually 5% and 95% exceedance levels. (2) - The value is natural volume - actual volume may be affected by upstream water management. (3) - Median value used in place of average. ================================================================================ NORTHWESTERN ARIZONA Reservoir Storage (1000AF) End of January ================================================================================ Usable ********** Usable Storage ********* Reservoir Capacity This Year Last Year Average ================================================================================ LAKE HAVASU 619.0 580.2 555.8 556.4 LAKE MOHAVE 1810.0 1649.8 1629.0 1676.0 LAKE MEAD 26159.0 13828.0 15022.0 20452.0 LAKE POWELL 24322.0 12190.0 15641.0 17338.0 ================================================================================ NORTHWESTERN ARIZONA Watershed Snowpack Analysis - February 1, 2013 ================================================================================ Number of This Year as Percent of Watershed Data Sites Last Year Median ================================================================================ GRAND CANYON 2 162 88 ================================================================================

18
S N O W S U R V E Y D A T A FEBRUARY 1, 2013 MAP SNOW COURSE ELEV. DATE SNOW WATER LAST MEDIAN NUM. DEPTH CONTENT YEAR 81-10 1. ARBABS FOREST (AK) 7680 1/31 10 3.0 1.0 2.2 2. BAKER BUTTE SNOTEL 7330 2/01 10 3.0 3.3 4.3 3. BAKER BUTTE #2 7700 1/31 19 6.4 7.9 6.9 4. BAKER BUTTE SMT SNTL 7700 2/01 21 7.1 8.5 - 5. BALDY SNOTEL 9220 2/01 22 5.8 6.2 6.4 6. BAR M SNOTEL 6393 2/01 2 1.8 - - 7. BEAVER HEAD 8000 1/31 4 1.3 1.9 2.0 8. BEAVER HEAD SNOTEL 7990 2/01 5 2.0 3.8 3.4 9. BEAVER SPRING 9220 1/30 32 7.7 4.3 7.7 10. BEAVER SPRING SNOTEL 9200 2/01 28 8.4 4.7 - 11. BRIGHT ANGEL 8400 1/31 19 6.3 3.2 5.4 12. BUCK SPRING 7400 2/01 7 1.8 2.6 2.0 13. CHALENDER 7100 1/31 5 1.2 .0 1.8 14. CHALENDER SNOTEL 7100 2/01 7 1.8 1.3 - 15. CHEESE SPRINGS 8600 1/30 14 3.4 4.3 4.2 16. CORONADO TRL SNOTEL 8400 2/01 5 2.5 .6 3.2 17. CORONADO TRAIL 8350 1/31 4 1.2 .0 2.0 18. FLUTED ROCK 7800 1/31 9 2.3 1.0 2.6 19. FORT APACHE 9160 1/30 26 6.7 6.7 6.8 20. FORT VALLEY 7350 1/31 8 2.0 .0 1.8 21. FORT VALLEY SNOTEL 7350 2/01 1 1.7 .0 - 22. FRY SNOTEL 7220 2/01 11 4.0 4.2 5.0 23. GRAND CANYON 7500 1/28 5 .5 1.0 2.3 24. HANNAGAN MDWS SNOTEL 9020 2/01 25 7.3 8.6 8.3 25. HAPPY JACK 7630 1/31 13 3.7 1.7 3.2 26. HAPPY JACK SNOTEL 7630 2/01 18 5.7 3.9 3.8 27. HEBER SNOTEL 7640 2/01 10 3.6 4.2 4.6 28. LAKE MARY 6930 1/31 12 2.8 2.7 3.0 29. MAVERICK FORK SNOTEL 9200 2/01 22 6.4 6.6 6.8 30. MORMON MTN SNOTEL 7500 2/01 17 4.9 3.1 4.0 31. MORMON MT. SUMMIT #2 8470 1/31 26 8.6 5.4 7.7 32. MORMON MTN SUMMIT SN 8500 2/01 19 6.8 4.3 - 33. NEWMAN PARK 6750 1/31 4 1.1 1.6 2.0 34. NUTRIOSO 8500 1/31 3 .7 .0 1.2 35. NUTRIOSO SNOTEL 8500 2/01 1 .6 .0 - 36. PROMONTORY SNOTEL 7900 2/01 23 8.5 8.0 7.2 37. SNOW BOWL #2 11000 1/30 48 11.4 7.2 11.6 38. SNOWSLIDE CYN SNOTEL 9750 2/01 45 12.5 8.7 10.0 39. TSAILE CANYON #1 8160 1/27 15 5.0 2.2 4.8 40. TSAILE CANYON #3 8920 1/27 26 6.9 4.0 6.3 41. WHITE HORSE SNOTEL 7180 2/01 7 2.5 .5 3.4 42. WILDCAT SNOTEL 7850 2/01 13 3.3 4.3 3.0 43. WILLIAMS SKI RUN 7720 1/31 20 5.8 3.5 5.6 44. WORKMAN CREEK SNOTEL 6900 2/01 14 5.5 5.0 4.5

!
!
! !
!
!
!
!!
!
L i t t l eC o l o r a d o
R i v e r
L o w e rS a n J u a n
R i v e rU p p e r
S a n J u a nR i v e r
L o w e r C o l o r a d o R i v e rL e e s F e r r y t o L a k e M e a d
B i l lW i l l i a m s
R i v e r
V e r d eR i v e r
S a l t R i v e r
U p p e rG i l a R i v e r
S a n P e d r oR i v e r
R i oB a v i s p e
R i oA s u n c i o n
S a n t a C r u zR i v e r
R i oS o n o y t a
M i d d l eG i l a R i v e r
A g u a F r i a R i v e r -L o w e r G i l a R i v e r
L o w e rG i l a R i v e r
b e l o wP a i n t e d R o c k D a m
L o w e rC o l o r a d o
R i v e rb e l o w
L a k e M e a d
U p p e r C o l o r a d o R i v e ro f L a k e P o w e l l A r e a
PHOENIX
SHOW LOW
FLAGSTAFF
SPRINGERVILLEPAYSON
WINDOW ROCK
CHINLE
TUCSON
WILLIAMS
GRAND CANYON
1
44
3837
33 28
23
19
1512
11
41
40
18
5
6
43
42
39
36
29
27
24
22
7-8
2-4
9-10
34-35
30-32
25-26
20-21
16-17
13-14
Arizona Snow Survey Data Sites
0 25 50 75 10012.5Miles $October 2012
Data Sources: NRCS / ALRISProjection: UTM Zone 12 Datum: NAD83
Legend
Basin Boundaries
SNOTEL (Snowpack Telemetry) Sites
SNOTEL and Snow Course SitesSnow Course Sites
Related Documents

![Illinois Basin - Market Cycles and Outlook.ppt [Read-Only]thecoalinstitute.org/ckfinder/userfiles/files/Illinois Basin - Market Cycles and...Illinois Basin – Market Cycles and Outlook](https://static.cupdf.com/doc/110x72/5ecb5a97de228e61af6aea59/illinois-basin-market-cycles-and-read-onlythecoalinstituteorgckfinderuserfilesfilesillinois.jpg)