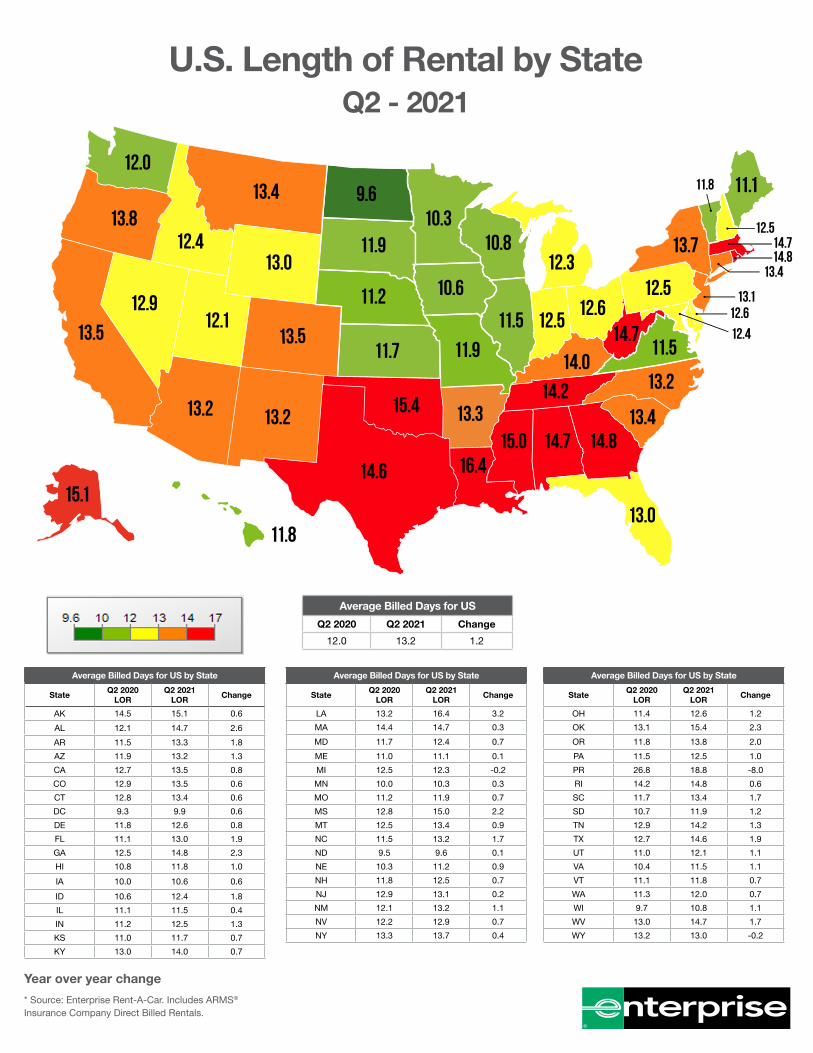
U.S. Length of Rental by State Q2 - 2021 12.0 12.4 13.4 13.0 13.5 13.2 15.1 11.8 14.6 15.4 11.7 11.2 11.9 9.6 10.3 10.6 11.9 13.3 16.4 15.0 14.7 14.8 13.0 13.4 13.2 14.2 14.0 12.5 11.5 10.8 12.3 12.6 12.5 13.7 11.1 14.7 11.5 12.4 12.6 13.1 13.4 14.7 14.8 12.5 11.8 13.2 12.1 13.8 13.5 12.9 Year over year change * Source: Enterprise Rent-A-Car. Includes ARMS ® Insurance Company Direct Billed Rentals. Average Billed Days for US by State State Q2 2020 LOR Q2 2021 LOR Change AK 14.5 15.1 0.6 AL 12.1 14.7 2.6 AR 11.5 13.3 1.8 AZ 11.9 13.2 1.3 CA 12.7 13.5 0.8 CO 12.9 13.5 0.6 CT 12.8 13.4 0.6 DC 9.3 9.9 0.6 DE 11.8 12.6 0.8 FL 11.1 13.0 1.9 GA 12.5 14.8 2.3 HI 10.8 11.8 1.0 IA 10.0 10.6 0.6 ID 10.6 12.4 1.8 IL 11.1 11.5 0.4 IN 11.2 12.5 1.3 KS 11.0 11.7 0.7 KY 13.0 14.0 0.7 Average Billed Days for US by State State Q2 2020 LOR Q2 2021 LOR Change LA 13.2 16.4 3.2 MA 14.4 14.7 0.3 MD 11.7 12.4 0.7 ME 11.0 11.1 0.1 MI 12.5 12.3 -0.2 MN 10.0 10.3 0.3 MO 11.2 11.9 0.7 MS 12.8 15.0 2.2 MT 12.5 13.4 0.9 NC 11.5 13.2 1.7 ND 9.5 9.6 0.1 NE 10.3 11.2 0.9 NH 11.8 12.5 0.7 NJ 12.9 13.1 0.2 NM 12.1 13.2 1.1 NV 12.2 12.9 0.7 NY 13.3 13.7 0.4 Average Billed Days for US by State State Q2 2020 LOR Q2 2021 LOR Change OH 11.4 12.6 1.2 OK 13.1 15.4 2.3 OR 11.8 13.8 2.0 PA 11.5 12.5 1.0 PR 26.8 18.8 -8.0 RI 14.2 14.8 0.6 SC 11.7 13.4 1.7 SD 10.7 11.9 1.2 TN 12.9 14.2 1.3 TX 12.7 14.6 1.9 UT 11.0 12.1 1.1 VA 10.4 11.5 1.1 VT 11.1 11.8 0.7 WA 11.3 12.0 0.7 WI 9.7 10.8 1.1 WV 13.0 14.7 1.7 WY 13.2 13.0 -0.2 Average Billed Days for US Q2 2020 Q2 2021 Change 12.0 13.2 1.2

Welcome message from author
This document is posted to help you gain knowledge. Please leave a comment to let me know what you think about it! Share it to your friends and learn new things together.
Transcript
U.S. Length of Rental by StateQ2 - 2021
12.0
12.4
13.4
13.0
13.5
13.2
15.1
11.8
14.6
15.4
11.7
11.2
11.9
9.610.3
10.6
11.9
13.3
16.415.0 14.7 14.8
13.0
13.4
13.214.2
14.0
12.511.5
10.812.3
12.612.5
13.7
11.1
14.711.5
12.4
12.613.1
13.4
14.714.8
12.5
11.8
13.2
12.1
13.8
13.5
12.9
Year over year change
* Source: Enterprise Rent-A-Car. Includes ARMS® Insurance Company Direct Billed Rentals.
Average Billed Days for US by State
StateQ2 2020
LORQ2 2021
LORChange
AK 14.5 15.1 0.6
AL 12.1 14.7 2.6
AR 11.5 13.3 1.8
AZ 11.9 13.2 1.3
CA 12.7 13.5 0.8
CO 12.9 13.5 0.6
CT 12.8 13.4 0.6
DC 9.3 9.9 0.6
DE 11.8 12.6 0.8
FL 11.1 13.0 1.9
GA 12.5 14.8 2.3
HI 10.8 11.8 1.0
IA 10.0 10.6 0.6
ID 10.6 12.4 1.8
IL 11.1 11.5 0.4
IN 11.2 12.5 1.3
KS 11.0 11.7 0.7
KY 13.0 14.0 0.7
Average Billed Days for US by State
StateQ2 2020
LORQ2 2021
LORChange
LA 13.2 16.4 3.2
MA 14.4 14.7 0.3
MD 11.7 12.4 0.7
ME 11.0 11.1 0.1
MI 12.5 12.3 -0.2
MN 10.0 10.3 0.3
MO 11.2 11.9 0.7
MS 12.8 15.0 2.2
MT 12.5 13.4 0.9
NC 11.5 13.2 1.7
ND 9.5 9.6 0.1
NE 10.3 11.2 0.9
NH 11.8 12.5 0.7
NJ 12.9 13.1 0.2
NM 12.1 13.2 1.1
NV 12.2 12.9 0.7
NY 13.3 13.7 0.4
Average Billed Days for US by State
StateQ2 2020
LORQ2 2021
LORChange
OH 11.4 12.6 1.2
OK 13.1 15.4 2.3
OR 11.8 13.8 2.0
PA 11.5 12.5 1.0
PR 26.8 18.8 -8.0
RI 14.2 14.8 0.6
SC 11.7 13.4 1.7
SD 10.7 11.9 1.2
TN 12.9 14.2 1.3
TX 12.7 14.6 1.9
UT 11.0 12.1 1.1
VA 10.4 11.5 1.1
VT 11.1 11.8 0.7
WA 11.3 12.0 0.7
WI 9.7 10.8 1.1
WV 13.0 14.7 1.7
WY 13.2 13.0 -0.2
Average Billed Days for US
Q2 2020 Q2 2021 Change
12.0 13.2 1.2

U.S. Average Length of Rental by RegionQ2 - 2021
Average Billed Days for US by Region
RegionQ2 2020
LORQ2 2021
LORChange
California 12.7 13.5 0.8
Mid-Atlantic 11.5 12.5 1.0
Midwest 11.2 11.9 0.7
Mountain 12.3 13.0 0.7
Northeast 13.3 13.7 0.4
Northwest 11.3 12.6 1.3
Pacific 11.9 12.7 0.8
Southeast 12.0 14.0 2.0
Southwest 12.6 14.3 1.7
Average Billed Days for US
Q2 2021 Q2 2021 Change
12.0 13.2 1.2
12.6
14.3
13.0 11.9
14.0
13.7
12.513.5
12.7
Year over year change
* Source: Enterprise Rent-A-Car. Includes ARMS® Insurance Company Direct Billed Rentals.

U.S. Length of Rental - Q2 2021
Enterprise Rent-A-Car’s quarterly Length of Rental (LOR) report for the second quarter of 2021 was anticipated for a variety of reasons. For one, we’d be comparing results against a previous year’s second quarter that was unlike any in recent times: the immediate impacts of the COVID-19 pandemic (April, May, and June 2020) that saw a rapid rise in LOR in April, a drop in May and stabilization in June. Secondly, would we see LOR impacts associated with increased travel demand (miles driven are up 28.7% in May 2021 versus May 2020, according to the Federal Highway Administration) and the ongoing supply chain issues seen with new vehicle availability and other segments of the automotive sector?
Average LORIn Q2 2021, average replacement LOR was 13.2 days, up 1.2 from Q2 2020. The increases in overall LOR were seen nationally; only two states (MI, WY) saw slight decreases of 0.2 days each. Louisiana saw the highest increase with an LOR of 16.4 days, an increase of 3.2 days from Q2 2020. Oklahoma saw the next highest LOR at 15.4, up 2.3 days. Ten other states saw average LOR at 14 days or higher (AK, AL, GA, KY, MA, MS, RI, TN, TX, WV). North Dakota came in with the lowest LOR at 9.6, a 0.1-day increase. Three other states (IA, MN, WI) plus DC had average LOR below 11 days. Twenty-five states saw an increase of at least one full day or greater, with six states higher by at least 2 full days (AL, GA, LA, MS, OK, OR).
Drivable ClaimsSimilar to the overall numbers, replacement rentals associated with Drivable claims had an average LOR of 11.5 days, up 1.2 days from Q2 2020. Louisiana also had the highest LOR at 14.4 days (up 2.7 days), followed by Oklahoma at 13.7 days (up 1.8 days) and Mississippi at 13.6 days (up 2.1 days). North Dakota also claimed the lowest Drivable LOR at 8.1 days, only up 0.1 from Q2 2020. Six other states (IA, ME, MN, NE, VA, WI) plus DC had LOR below 10 days. Wyoming and Michigan saw Drivable decreases (0.5 and 0.1 days, respectively), while Maine was flat quarter-over-quarter. All other states plus DC saw increases in Drivable LOR, with 19 states up a full day or greater – four of which (AL, GA, LA, MS) were higher by 2 full days or more.
Non-Drivable ClaimsFor rentals associated with Non-drivable claims, average LOR in the US was 18.7 days, an increase of 0.7 from Q2 2020. Alaska had the highest LOR at 22.9 days, though this is down 0.8 from Q2 2020. West Virginia (22.4, up 2.5 days), Louisiana (22.1, up 3.4 days) and Oklahoma (21.6, up 2.7 days) were the next highest states. DC had the lowest LOR at 15.3 days, which was actually an increase of 0.8 days from Q2 2020). Minnesota was next lowest at 15.5 days, only up 0.3 from Q2 2020. Twenty states saw increases of a full day or greater, with six of those states (AL, ID, LA, MS, OK, WV) seeing increases of two full days or greater. Ten states had Non-drivable decreases, with Wyoming (down 1.9 days) and Washington (down 1.0 days) leading the way. Three other states (IL, HI, NY) were flat versus Q2 2020. Total Loss ClaimsRentals associated with Total Loss claims had an average LOR of 14.2 days in Q2021, up 0.8 days from Q2 2020. Hawaii had the highest Total Loss LOR at 18.8 days, an increase of 3.1 days. Four other states saw LOR of 16 days or greater (CA, LA, NC, WV). North Dakota had the lowest Total Loss LOR at 10.2 days, a 0.3 decrease from Q2 2020. Minnesota was next lowest at 11.8 days, up 0.5 days. Six other states (FL, IA, IL, KS, NE, WI) saw Total Loss LOR below 13 days. Seven states (CT, MA, MT, ND, NH, NJ, NY) plus DC saw Total Loss LOR decrease from Q2 2020 with Massachusetts the most pronounced, coming in at 15.9 days – a drop of 2.3 days from Q2 2020. On the other side, 19 states saw an increase greater than 1 full day. Wyoming was the most pronounced with a Total Loss LOR increase of 5 full days (14.7 in Q2 2021 from 9.7 in Q2 2020). Oregon (up 3.8 days) and Hawaii (up 3.1 days) were also significant increases.
© 2021 Enterprise Rent-A-Car. K06027_US Q2 2021
Parts AvailabilityWhat impact did parts availability, either in general or for specific manufacturers, have on the increase in Length of Rental? PartsTrader considers the impact parts supply has on repair cycle time in three ways: 1. the number of quotes per part, 2. the quoted days of delivery and 3. the average price by part type for over $100 million in monthly parts sales. Greg Horn, PartsTrader’s Chief Innovation Officer commented: “Comparing Q1 2021 to Q2 2021, PartsTrader data shows a slight increase in delivery days from 2.4 in Q1 to 2.7 in Q2. Looking at the number of quotes per part, we saw an increase in the average quote per part, from 6.1 to 6.3 quotes, with no increase in average part price. Additionally, when looking at just OEM parts, delivery times increased from 2.1 to 2.4 days – the identical bump when looking at all part types. The number of quotes per part was 8.1 quotes per OEM part in Q2 2021 and does not indicate a systemic shortage of OEM parts.”
ConclusionAs we continue through 2021 and beyond, several factors may also play a part in average LOR results. Many collision repairers in the U.S. are reporting that repair volume is either near or at pre-pandemic levels. What will be the impacts from the materials and technology that make collision repairs more complicated alongside claims processes regarding artificial intelligence that insurers continue to adopt? What impacts will supply chain disruptions have on new and used car availability? Additionally, will the employee shortages seen in so many industries compound the existing need for technicians in the collision repair space?
Enterprise Rent-A-Car’s Length of Rental (LOR) is a valuable metric for partners to analyze the time it takes between accident and/or vehicle repair start to completed repair. While each of our insurer partners has unique processes, policyholders and needs, the Enterprise team can assist in crafting improved ways to mitigate loss adjustment expense and place more focus on claims process disruptions, which are a large driver of overall claims cycle time and ultimately impact Length of Rental.
The quarterly LOR summary is produced by Enterprise Rent-A-Car. Through its ARMS® Automotive Suite of Products, Enterprise provides collision repair facilities with free cycle time reporting with market comparisons, free text/email capability to update their customers on vehicle repair status, and online reservations. More information is available at armsautosuite.com.
© 2021 Enterprise Rent-A-Car. K06027_US Q2 2021
Related Documents