U.S. Hispanic Population: U.S. Hispanic Population: 2000 2000 Helping You Make Informed Decisions

U.S. Hispanic Population: 2000 Helping You Make Informed Decisions.
Dec 17, 2015
Welcome message from author
This document is posted to help you gain knowledge. Please leave a comment to let me know what you think about it! Share it to your friends and learn new things together.
Transcript
U.S. Hispanic Population: 2000U.S. Hispanic Population: 2000
Helping You Make Informed Decisions
Population Size and CompositionPopulation Size and Composition
12% of the U.S. population is Hispanic.
People of Mexican origin comprise approximately 66% of the U.S. Hispanic population.
Source: Current Population Survey, March 2000, PGP-4
In March 2000, 32.8 million Hispanics lived in the United States.
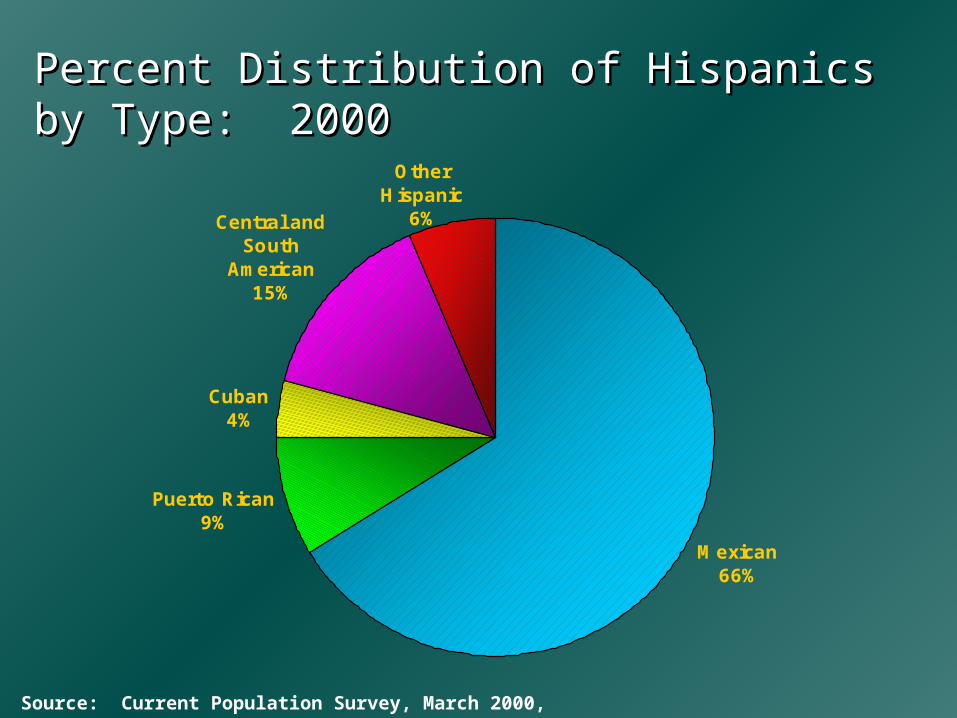
Percent Distribution of HispanicsPercent Distribution of Hispanicsby Type: 2000by Type: 2000
Mexican66%
Puerto Rican9%
Cuban4%
Central and South
American15%
Other Hispanic
6%
Source: Current Population Survey, March 2000, PGP-4
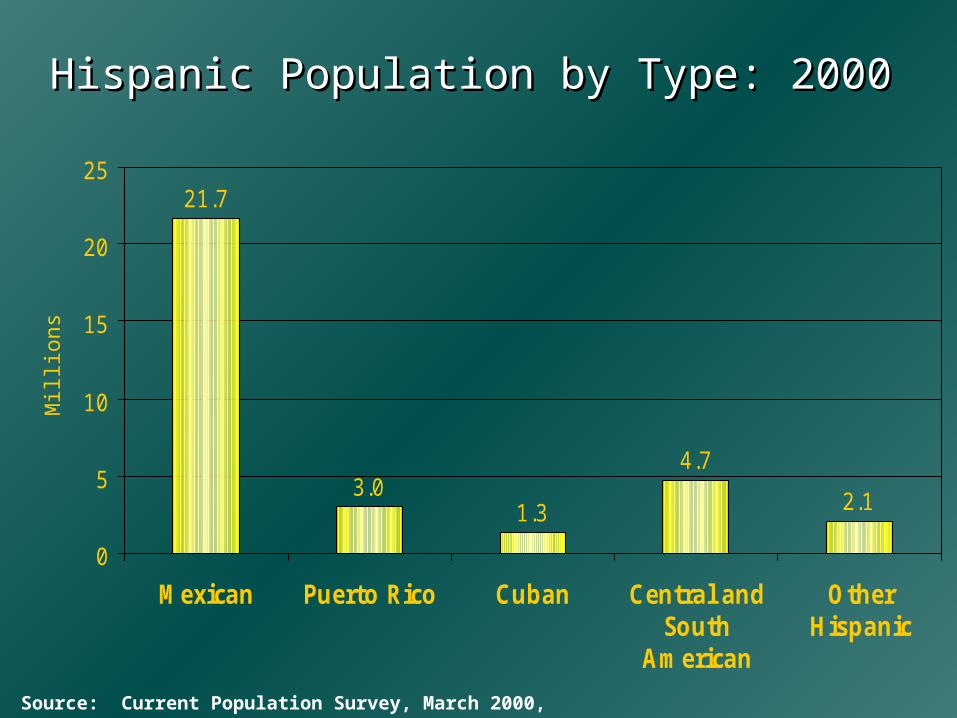
Hispanic Population by Type: 2000Hispanic Population by Type: 2000M
illio
ns
21.7
3.01.3
4.7
2.1
0
5
10
15
20
25
Mexican Puerto Rico Cuban Central andSouth
American
OtherHispanic
Source: Current Population Survey, March 2000, PGP-4
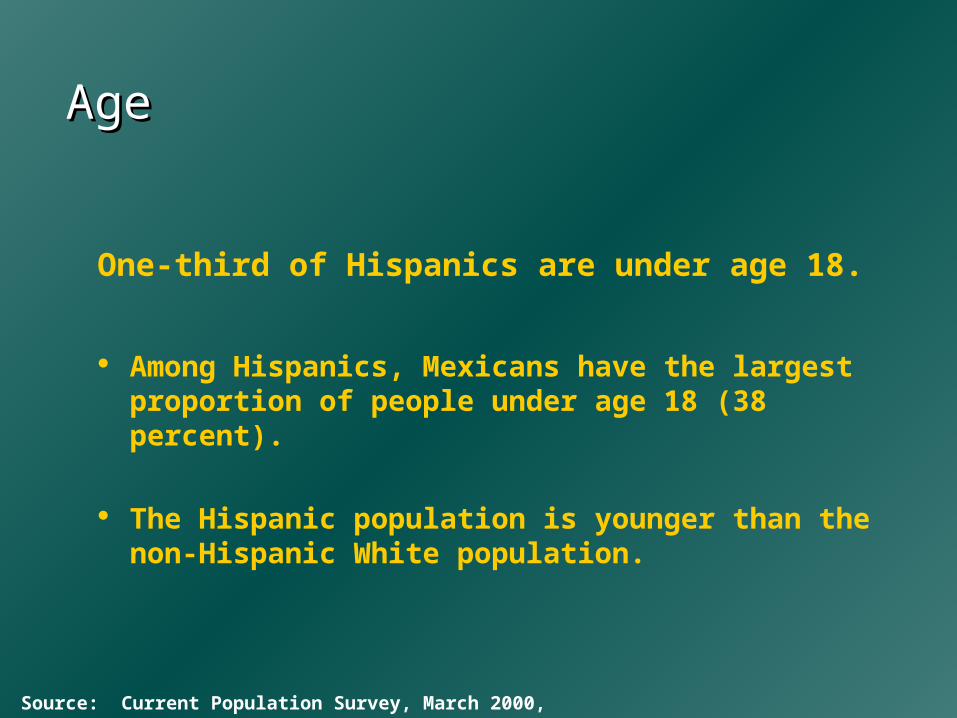
AgeAge
Among Hispanics, Mexicans have the largest proportion of people under age 18 (38 percent).
The Hispanic population is younger than the non-Hispanic White population.
One-third of Hispanics are under age 18.
Source: Current Population Survey, March 2000, PGP-4
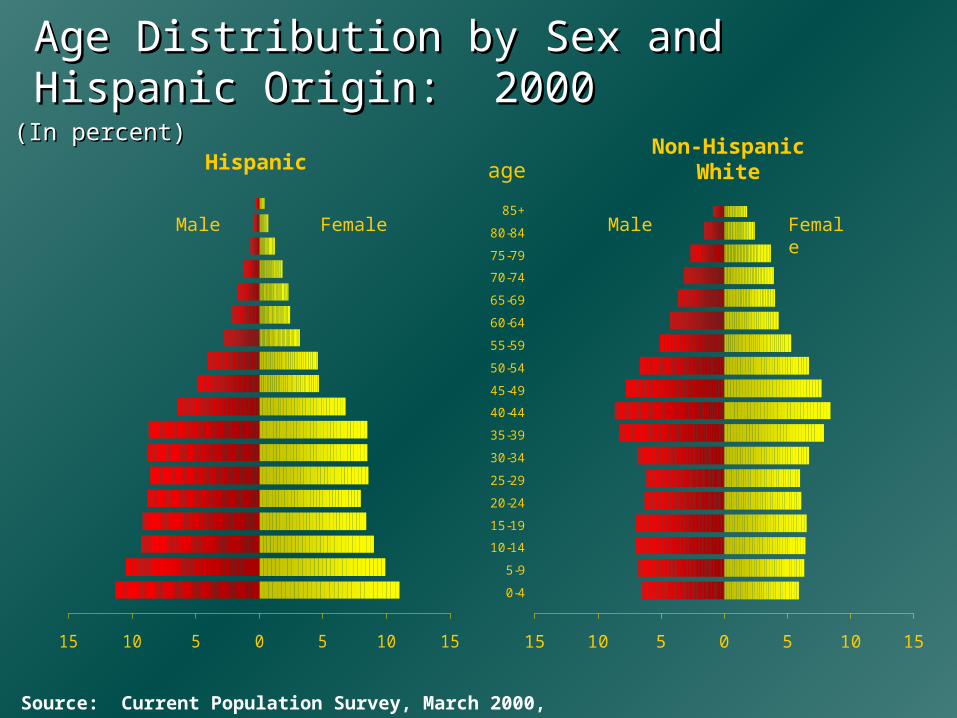
15 10 5 0 5 10 15
0-4
5-9
10-14
15-19
20-24
25-29
30-34
35-39
40-44
45-49
50-54
55-59
60-64
65-69
70-74
75-79
80-84
85+
Age Distribution by Sex and Age Distribution by Sex and Hispanic Origin: 2000Hispanic Origin: 2000
15 10 5 0 5 10 15
Male Female Female
Male
(In percent)(In percent)Hispanic
Non-HispanicWhite
Source: Current Population Survey, March 2000, PGP-4
age
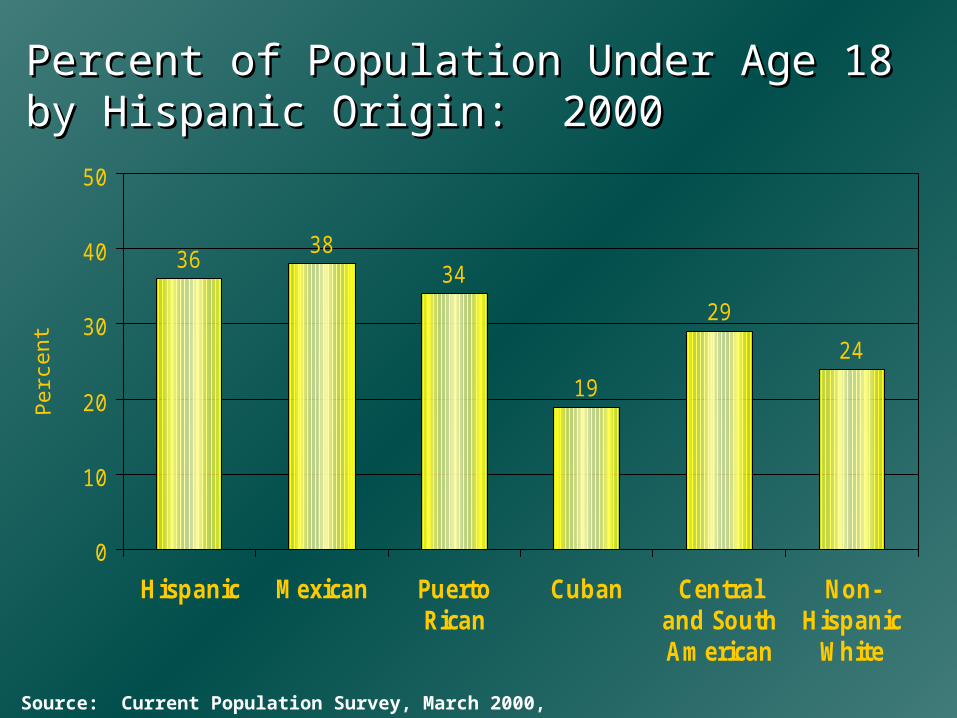
Percent of Population Under Age 18 by Percent of Population Under Age 18 by Hispanic Origin: 2000Hispanic Origin: 2000
Perc
ent
3638
34
19
29
24
0
10
20
30
40
50
Hispanic Mexican PuertoRican
Cuban Centraland SouthAmerican
Non-Hispanic
White
Source: Current Population Survey, March 2000, PGP-4
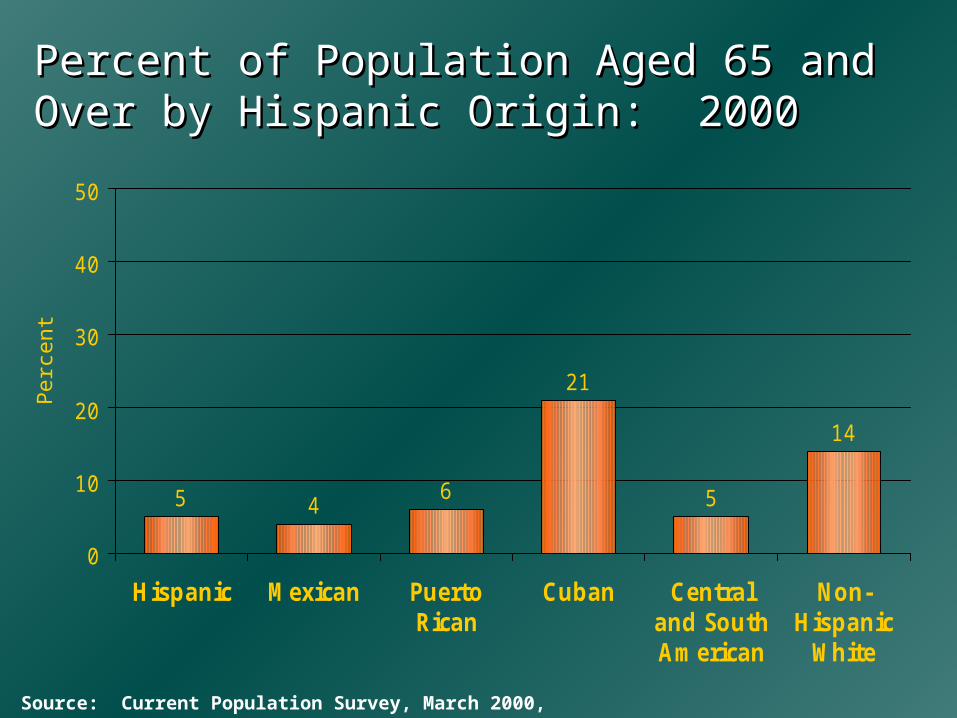
Percent of Population Aged 65 and Over Percent of Population Aged 65 and Over by Hispanic Origin: 2000by Hispanic Origin: 2000
Perc
ent
5 46
21
5
14
0
10
20
30
40
50
Hispanic Mexican PuertoRican
Cuban Centraland SouthAmerican
Non-Hispanic
White
Source: Current Population Survey, March 2000, PGP-4
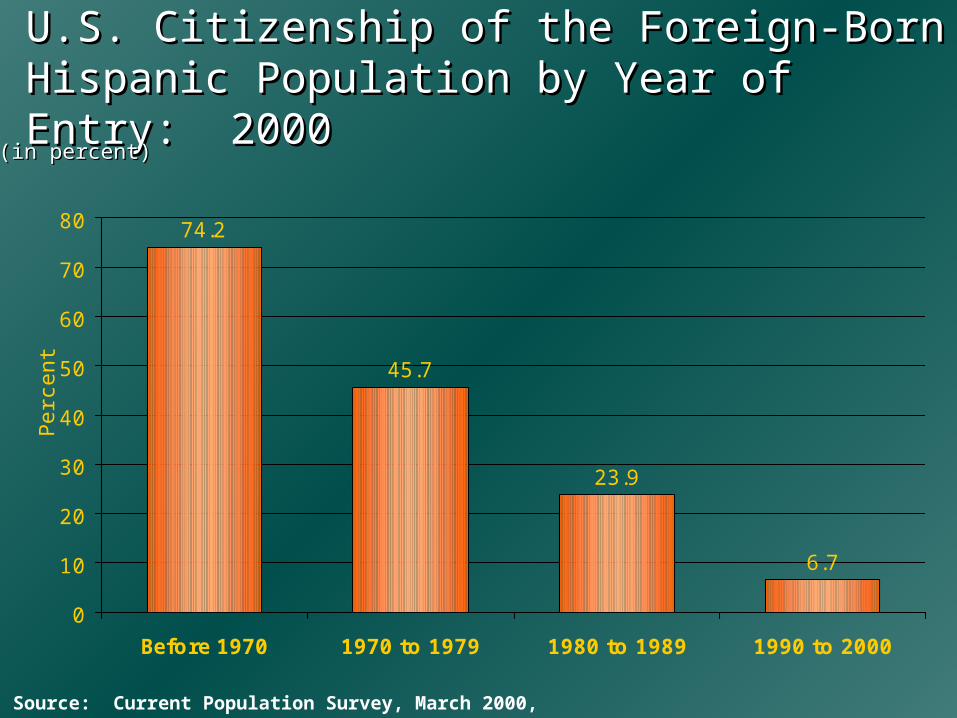
U.S. Citizenship of the Foreign-Born U.S. Citizenship of the Foreign-Born Hispanic Population by Year of Entry: Hispanic Population by Year of Entry: 20002000
(in percent)(in percent)
Perc
ent
74.2
45.7
23.9
6.7
0
10
20
30
40
50
60
70
80
Before 1970 1970 to 1979 1980 to 1989 1990 to 2000
Source: Current Population Survey, March 2000, PGP-4
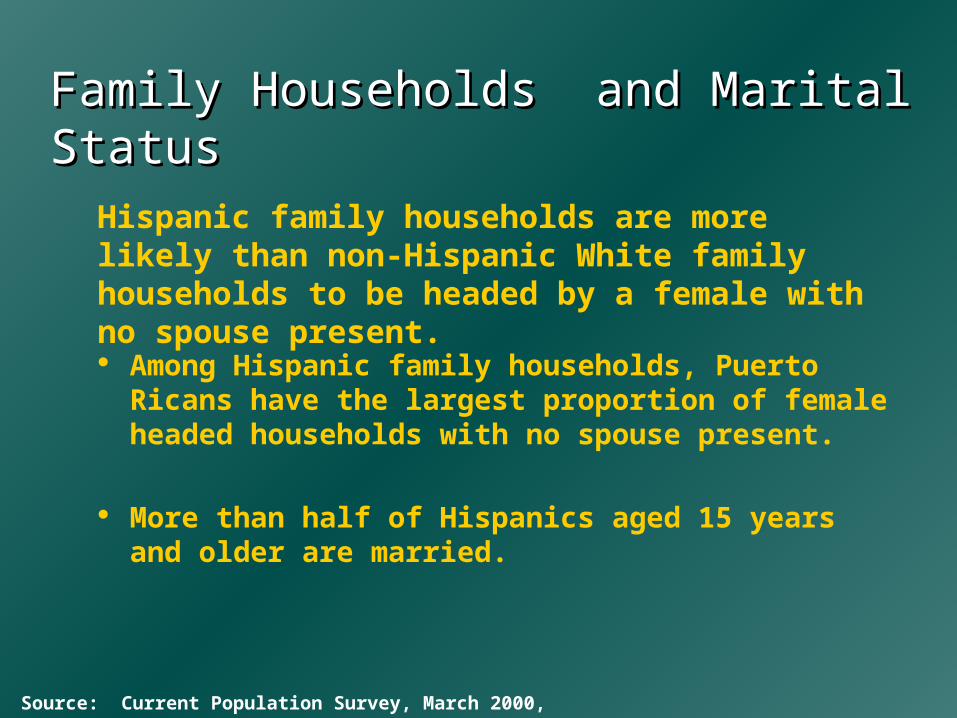
Among Hispanic family households, Puerto Ricans have the largest proportion of female headed households with no spouse present.
More than half of Hispanics aged 15 years and older are married.
Family Households and Marital StatusFamily Households and Marital Status
Hispanic family households are more likely than non-Hispanic White family households to be headed by a female with no spouse present.
Source: Current Population Survey, March 2000, PGP-4
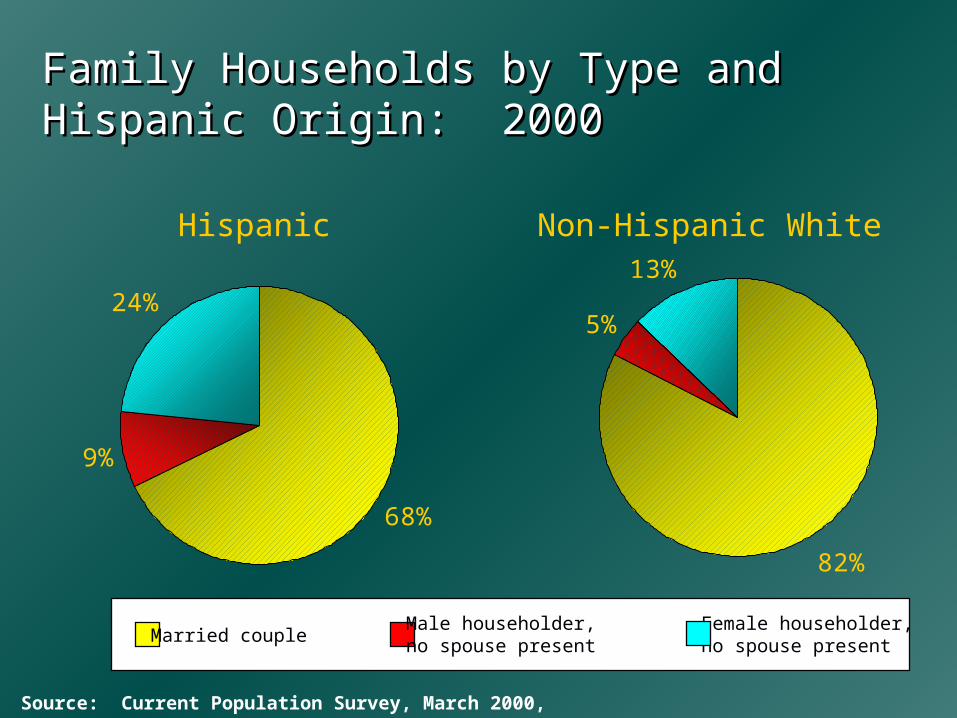
Family Households by Type and Family Households by Type and Hispanic Origin: 2000Hispanic Origin: 2000
Hispanic Non-Hispanic White
Married coupleFemale householder,no spouse present
Male householder,no spouse present
9%
68%
24%
82%
5%
13%
Source: Current Population Survey, March 2000, PGP-4
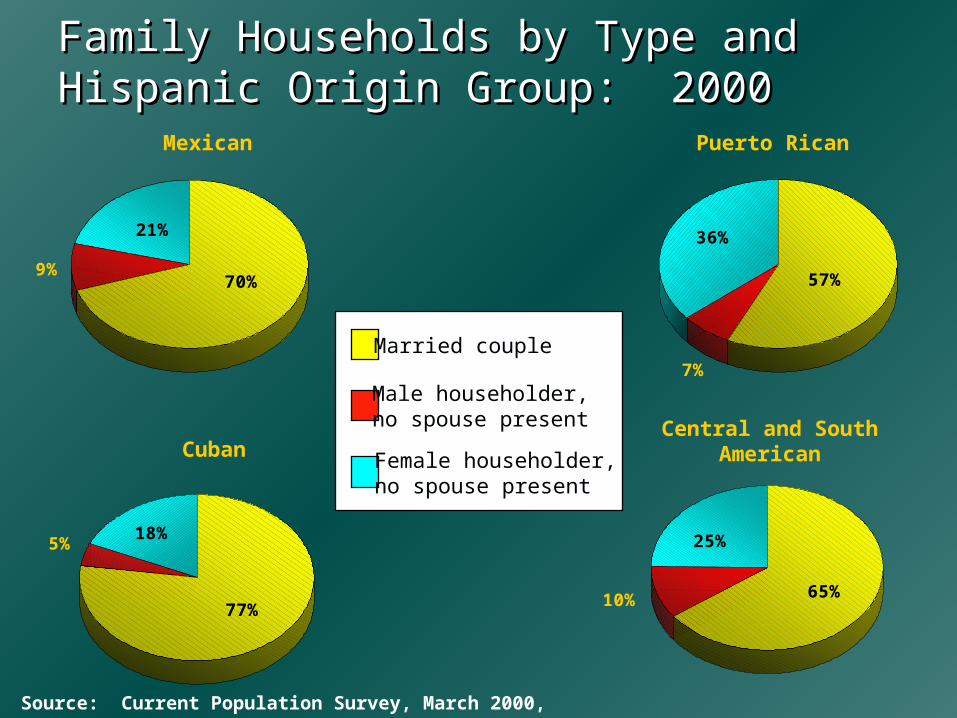
Mexican
Cuban
Puerto Rican
Central and SouthAmerican
57%
36%
7%
10%
25%
65%
Female householder,no spouse present
Married couple
Male householder,no spouse present
Family Households by Type and Family Households by Type and Hispanic Origin Group: 2000Hispanic Origin Group: 2000
70%
21%
9%
77%
18%5%
Source: Current Population Survey, March 2000, PGP-4
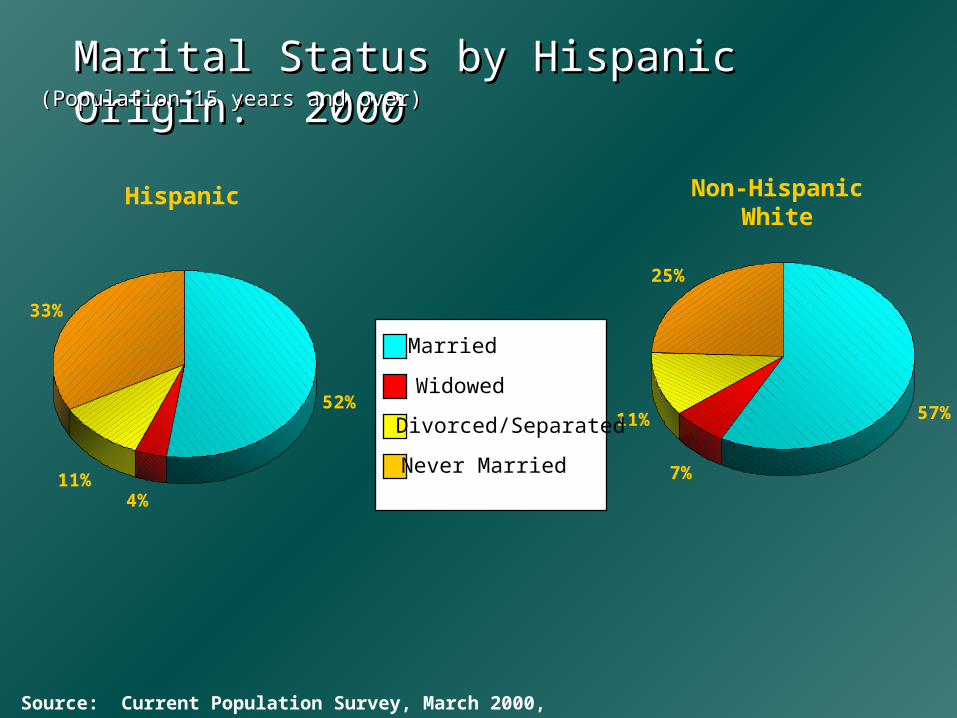
57%
7%
11%
25%
Non-HispanicWhite
52%
4%11%
33%
Married
Widowed
Divorced/Separated
Never Married
Hispanic
Marital Status by Hispanic Origin: Marital Status by Hispanic Origin: 20002000
Source: Current Population Survey, March 2000, PGP-4
(Population 15 years and over)(Population 15 years and over)
Educational AttainmentEducational Attainment
Among Hispanics, Mexicans 25 years and older had the lowest proportion of people with a high school diploma or more.
Cubans 25 years and older had the highest proportion of Hispanics with a bachelor’s degree or more.
Educational attainment of Hispanics lags behind non-Hispanic Whites.
Source: Current Population Survey, March 2000, PGP-4
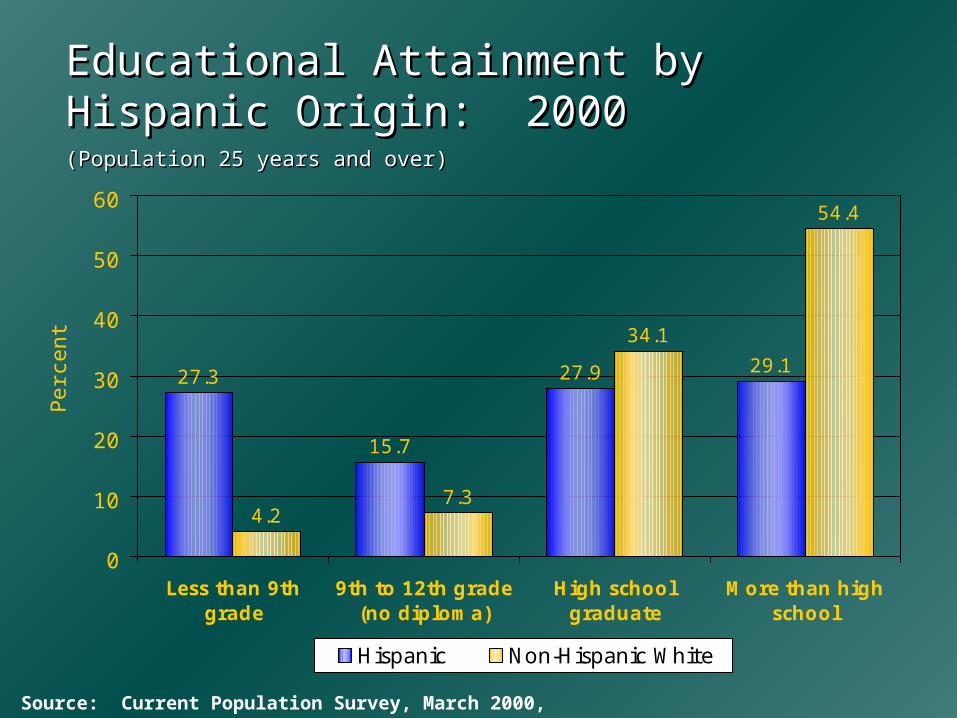
Educational Attainment by Educational Attainment by Hispanic Origin: 2000Hispanic Origin: 2000
Perc
ent
(Population 25 years and over)(Population 25 years and over)
27.3
15.7
27.9 29.1
4.27.3
34.1
54.4
0
10
20
30
40
50
60
Less than 9thgrade
9th to 12th grade(no diploma)
High schoolgraduate
More than highschool
Hispanic Non-Hispanic White
Source: Current Population Survey, March 2000, PGP-4
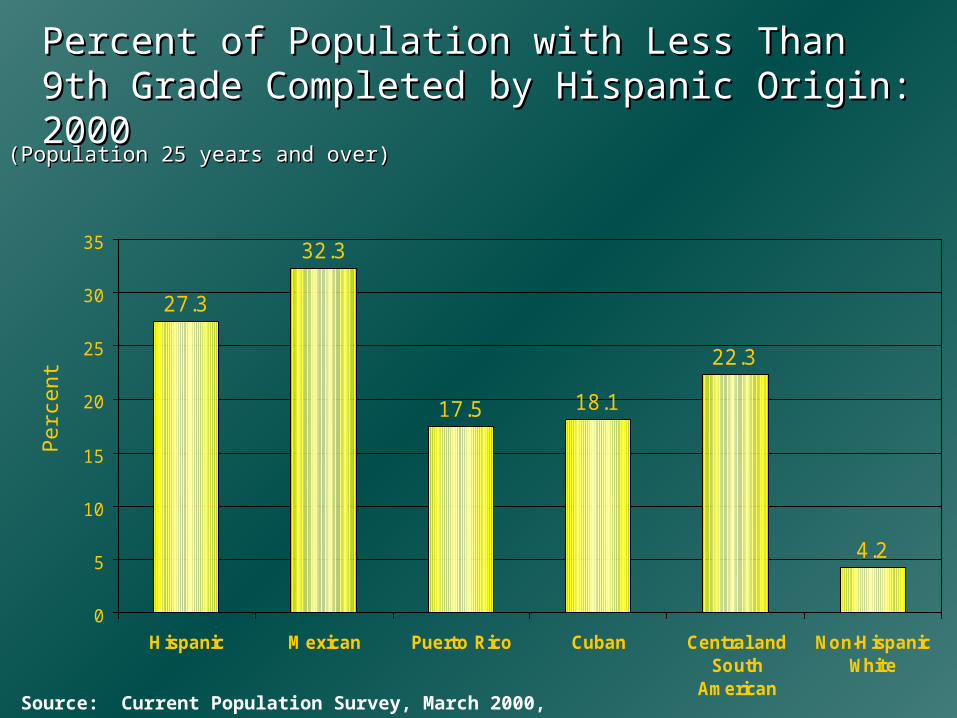
Percent of Population with Less Than Percent of Population with Less Than 9th Grade Completed by Hispanic Origin: 20009th Grade Completed by Hispanic Origin: 2000
Perc
ent
(Population 25 years and over)(Population 25 years and over)
27.3
32.3
17.5 18.1
22.3
4.2
0
5
10
15
20
25
30
35
Hispanic Mexican Puerto Rico Cuban Central andSouth
American
Non-HispanicWhite
Source: Current Population Survey, March 2000, PGP-4
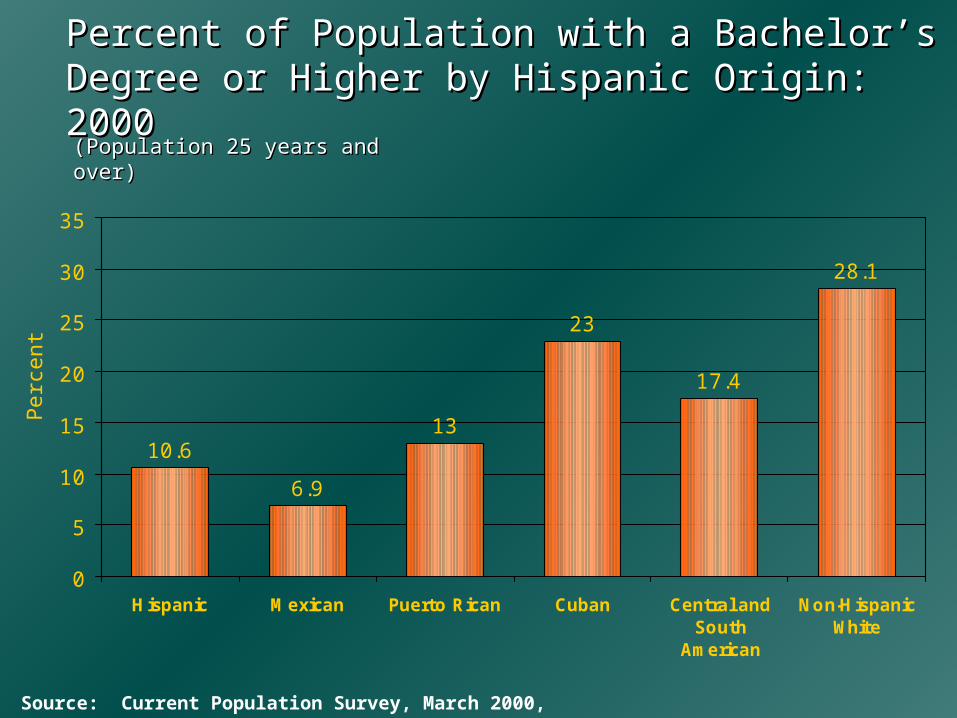
Percent of Population with a Bachelor’s Degree Percent of Population with a Bachelor’s Degree or Higher by Hispanic Origin: 2000or Higher by Hispanic Origin: 2000
Perc
ent
(Population 25 years and over)(Population 25 years and over)
10.6
6.9
13
23
17.4
28.1
0
5
10
15
20
25
30
35
Hispanic Mexican Puerto Rican Cuban Central andSouth
American
Non-HispanicWhite
Source: Current Population Survey, March 2000, PGP-4
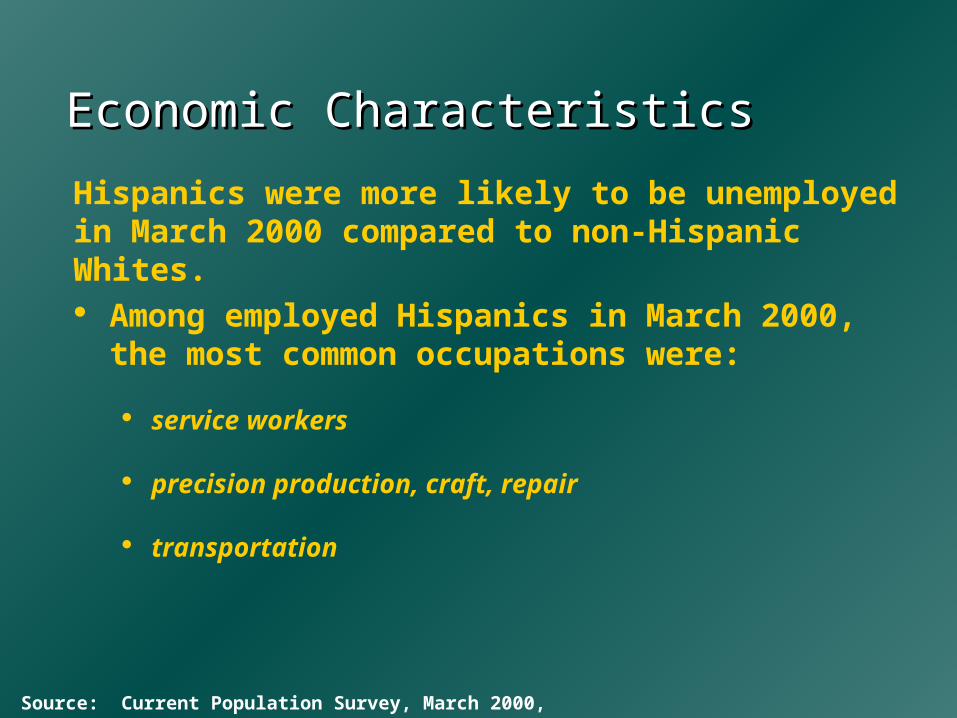
Economic CharacteristicsEconomic Characteristics
Among employed Hispanics in March 2000, the most common occupations were:
service workers
precision production, craft, repair
transportation
Hispanics were more likely to be unemployed in March 2000 compared to non-Hispanic Whites.
Source: Current Population Survey, March 2000, PGP-4
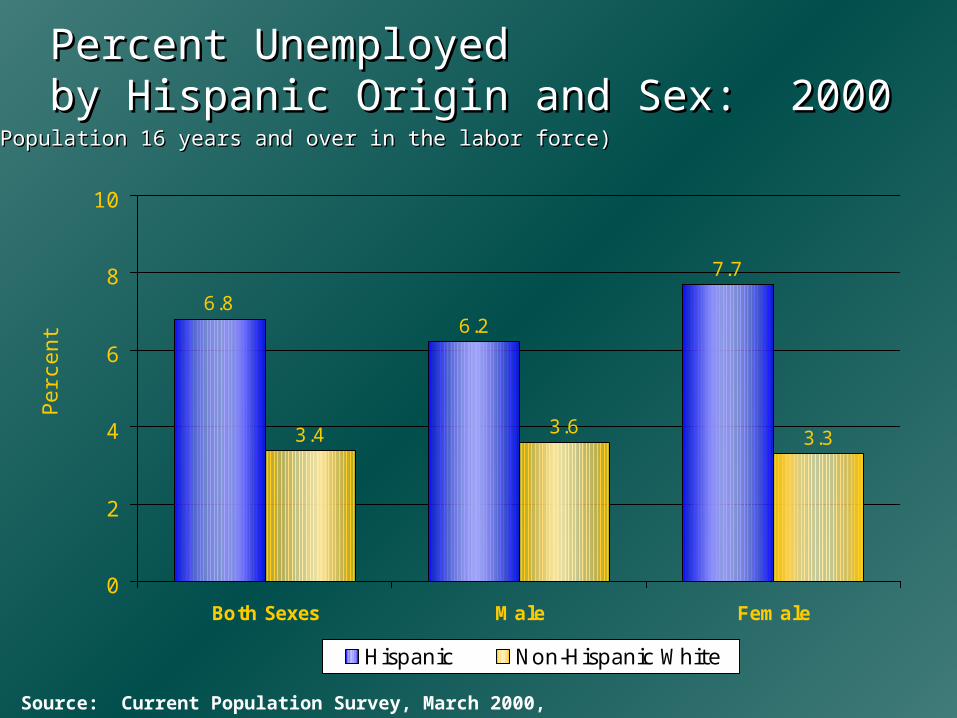
Percent Unemployed Percent Unemployed by Hispanic Origin and Sex: 2000by Hispanic Origin and Sex: 2000
(Population 16 years and over in the labor force)(Population 16 years and over in the labor force)
Perc
ent
6.86.2
7.7
3.4 3.6 3.3
0
2
4
6
8
10
Both Sexes Male Female
Hispanic Non-Hispanic White
Source: Current Population Survey, March 2000, PGP-4
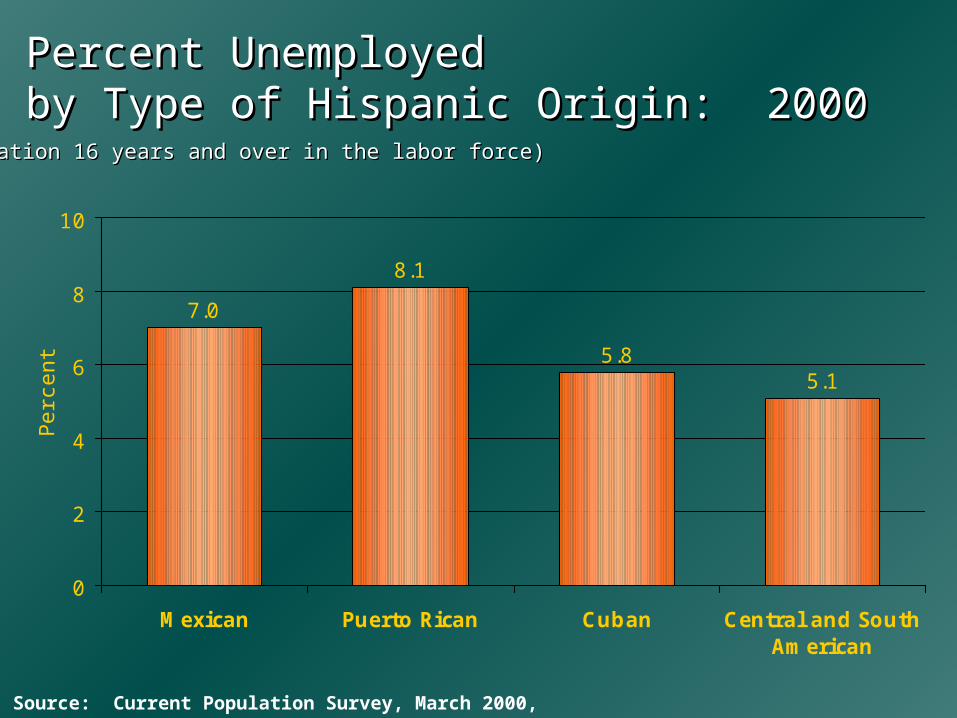
Percent Unemployed Percent Unemployed by Type of Hispanic Origin: 2000by Type of Hispanic Origin: 2000
(Population 16 years and over in the labor force)(Population 16 years and over in the labor force)
Perc
ent
7.0
8.1
5.85.1
0
2
4
6
8
10
Mexican Puerto Rican Cuban Central and SouthAmerican
Source: Current Population Survey, March 2000, PGP-4
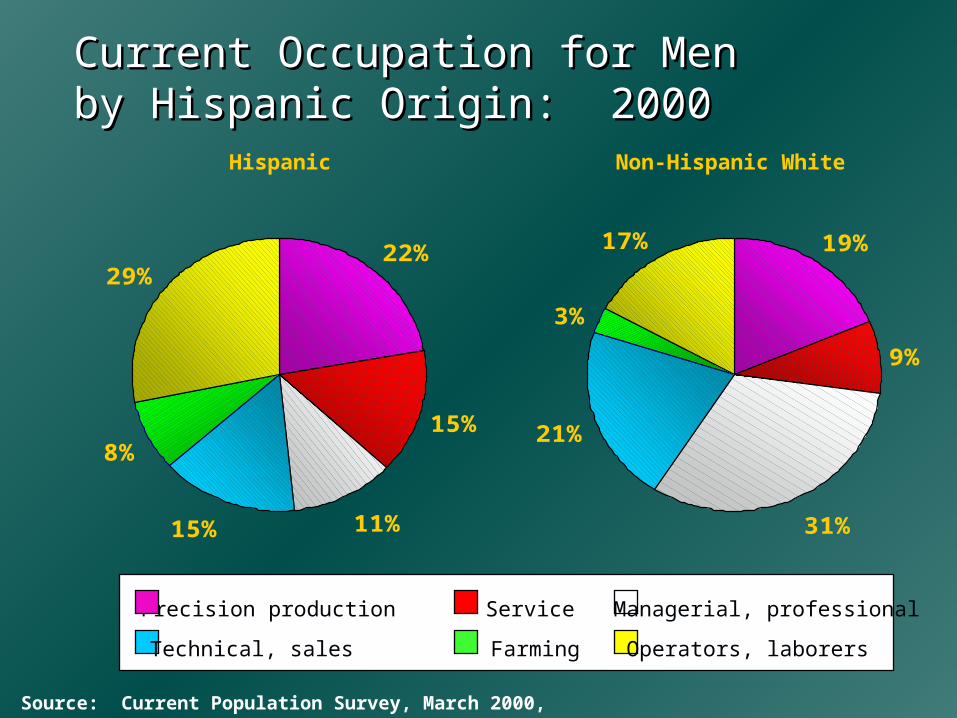
19%
9%
31%
21%
3%
17%22%
15%
11%15%
8%
29%
Current Occupation for Men Current Occupation for Men by Hispanic Origin: 2000by Hispanic Origin: 2000
Hispanic Non-Hispanic White
ServicePrecision production
Farming
Managerial, professional
Technical, sales Operators, laborers
Source: Current Population Survey, March 2000, PGP-4
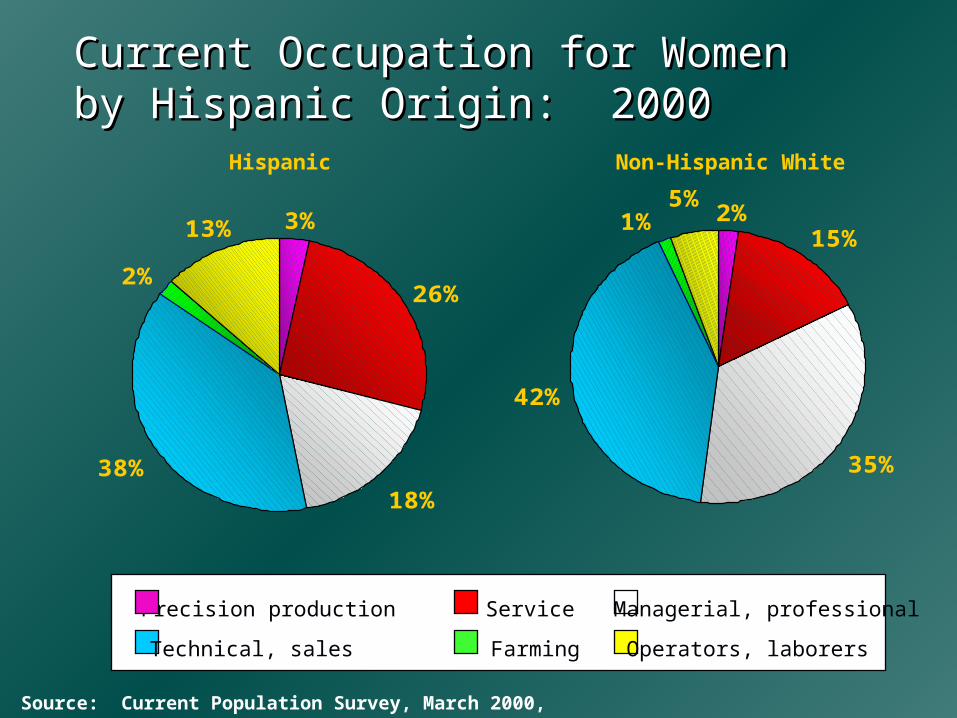
2%15%
35%
42%
1%5%
26%
18%38%
2%
13% 3%
Current Occupation for Women Current Occupation for Women by Hispanic Origin: 2000by Hispanic Origin: 2000
Hispanic Non-Hispanic White
ServicePrecision production
Farming
Managerial, professional
Technical, sales Operators, laborers
Source: Current Population Survey, March 2000, PGP-4
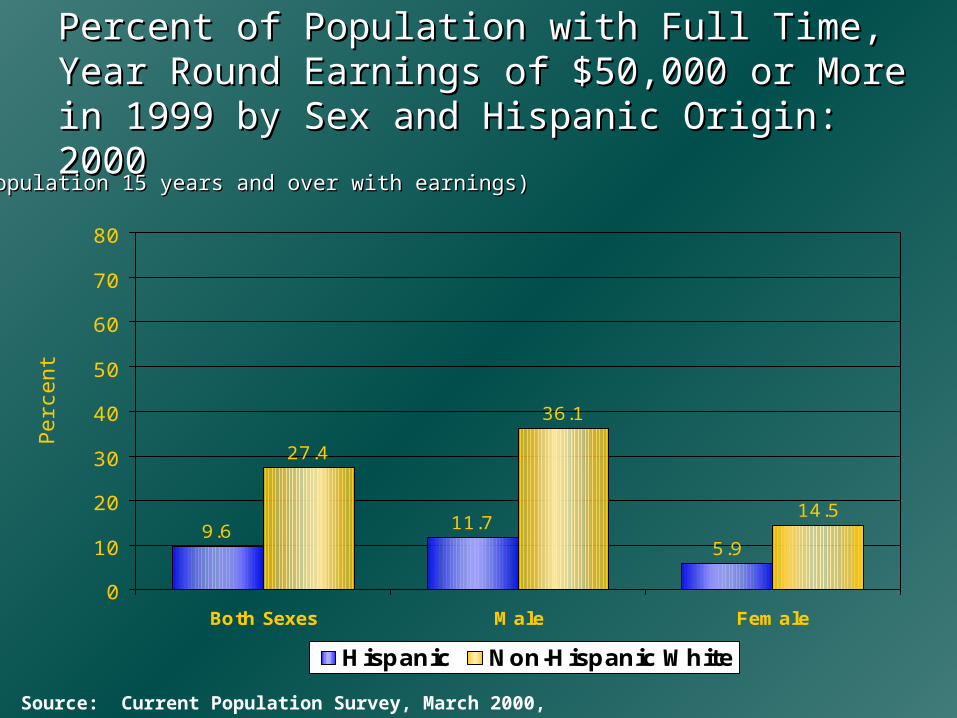
Percent of Population with Full Time, Year Percent of Population with Full Time, Year Round Earnings of $50,000 or More in 1999 Round Earnings of $50,000 or More in 1999 by Sex and Hispanic Origin: 2000by Sex and Hispanic Origin: 2000
Perc
ent
(Population 15 years and over with earnings)(Population 15 years and over with earnings)
9.6 11.75.9
27.4
36.1
14.5
0
10
20
30
40
50
60
70
80
Both Sexes Male Female
Hispanic Non-Hispanic White
Source: Current Population Survey, March 2000, PGP-4
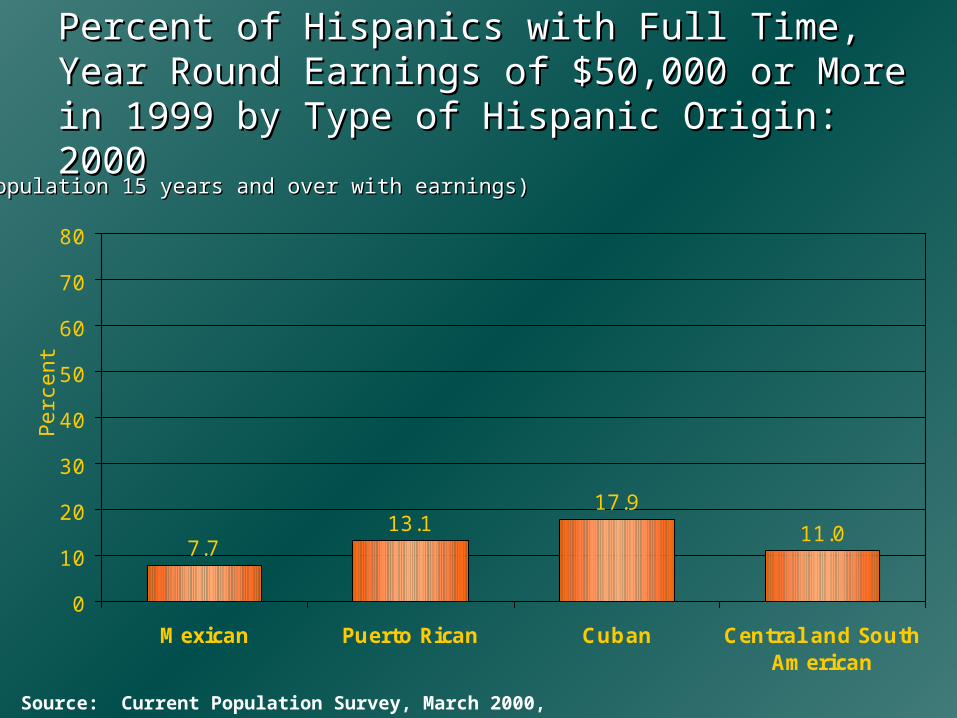
Percent of Hispanics with Full Time, Year Percent of Hispanics with Full Time, Year Round Earnings of $50,000 or More in 1999 Round Earnings of $50,000 or More in 1999 by Type of Hispanic Origin: 2000 by Type of Hispanic Origin: 2000
(Population 15 years and over with earnings)(Population 15 years and over with earnings)
Perc
ent
7.713.1
17.9
11.0
0
10
20
30
40
50
60
70
80
Mexican Puerto Rican Cuban Central and SouthAmerican
Source: Current Population Survey, March 2000, PGP-4
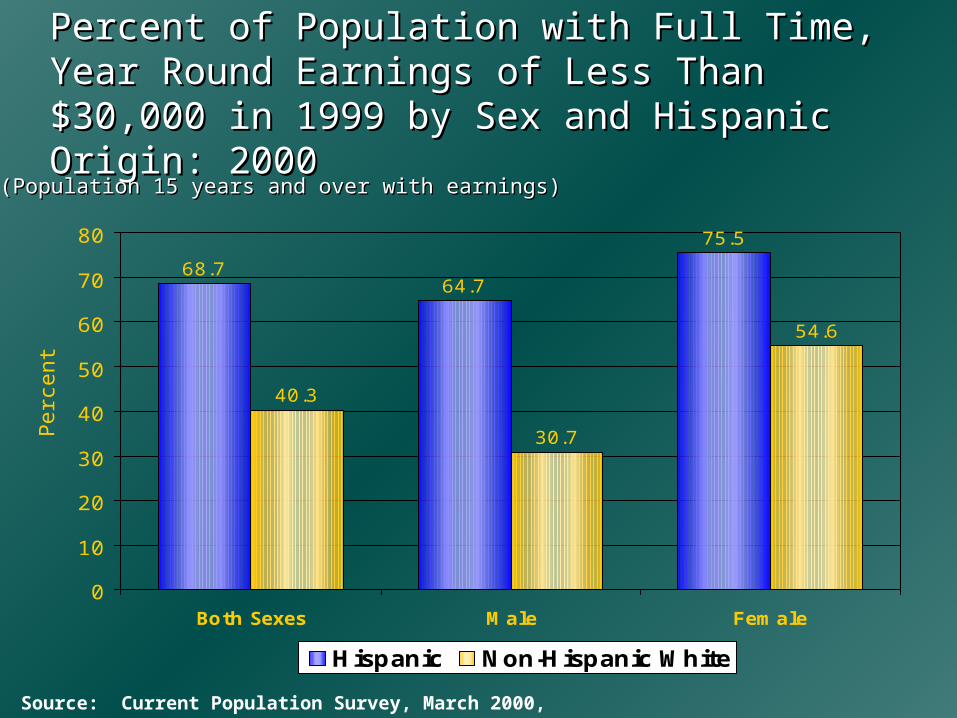
Percent of Population with Full Time, Year Percent of Population with Full Time, Year Round Earnings of Less Than $30,000 in Round Earnings of Less Than $30,000 in 1999 by Sex and Hispanic Origin: 20001999 by Sex and Hispanic Origin: 2000
(Population 15 years and over with earnings)(Population 15 years and over with earnings)
Perc
ent
68.764.7
75.5
40.3
30.7
54.6
0
10
20
30
40
50
60
70
80
Both Sexes Male Female
Hispanic Non-Hispanic White
Source: Current Population Survey, March 2000, PGP-4
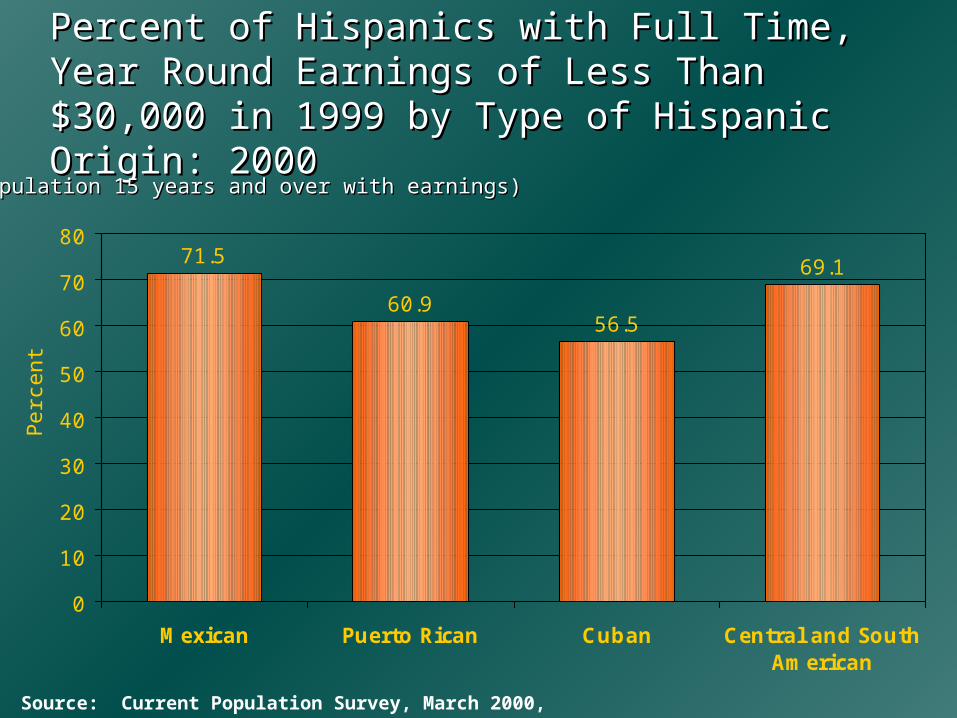
Percent of Hispanics with Full Time, Year Percent of Hispanics with Full Time, Year Round Earnings of Less Than $30,000 in Round Earnings of Less Than $30,000 in 1999 by Type of Hispanic Origin: 20001999 by Type of Hispanic Origin: 2000
(Population 15 years and over with earnings)(Population 15 years and over with earnings)
Perc
ent
71.5
60.956.5
69.1
0
10
20
30
40
50
60
70
80
Mexican Puerto Rican Cuban Central and SouthAmerican
Source: Current Population Survey, March 2000, PGP-4
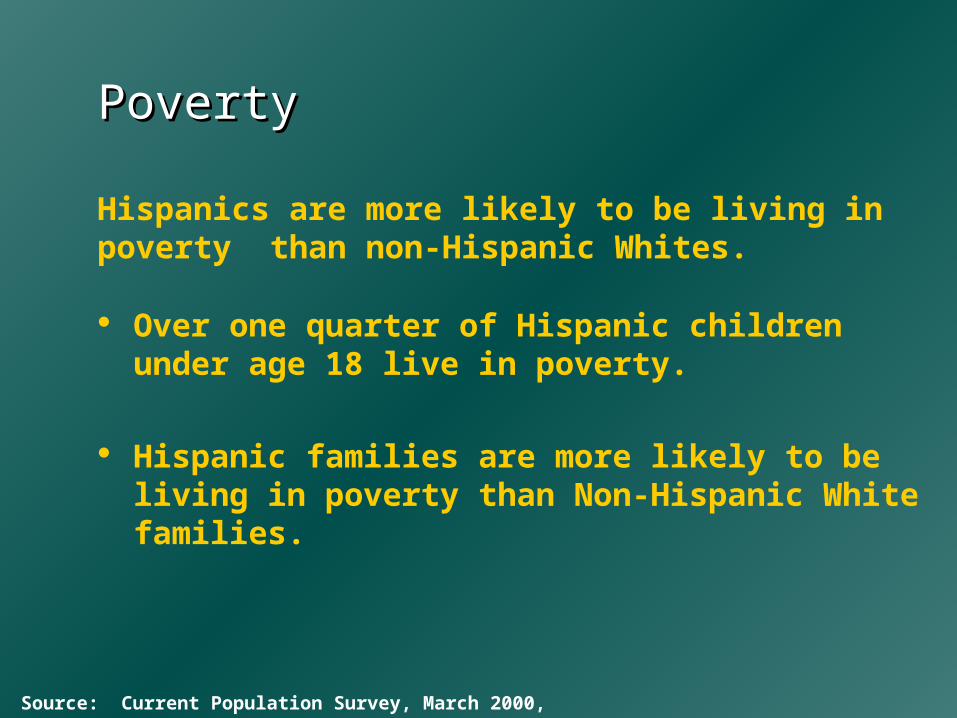
PovertyPoverty
Over one quarter of Hispanic children under age 18 live in poverty.
Hispanic families are more likely to be living in poverty than Non-Hispanic White families.
Hispanics are more likely to be living in poverty than non-Hispanic Whites.
Source: Current Population Survey, March 2000, PGP-4
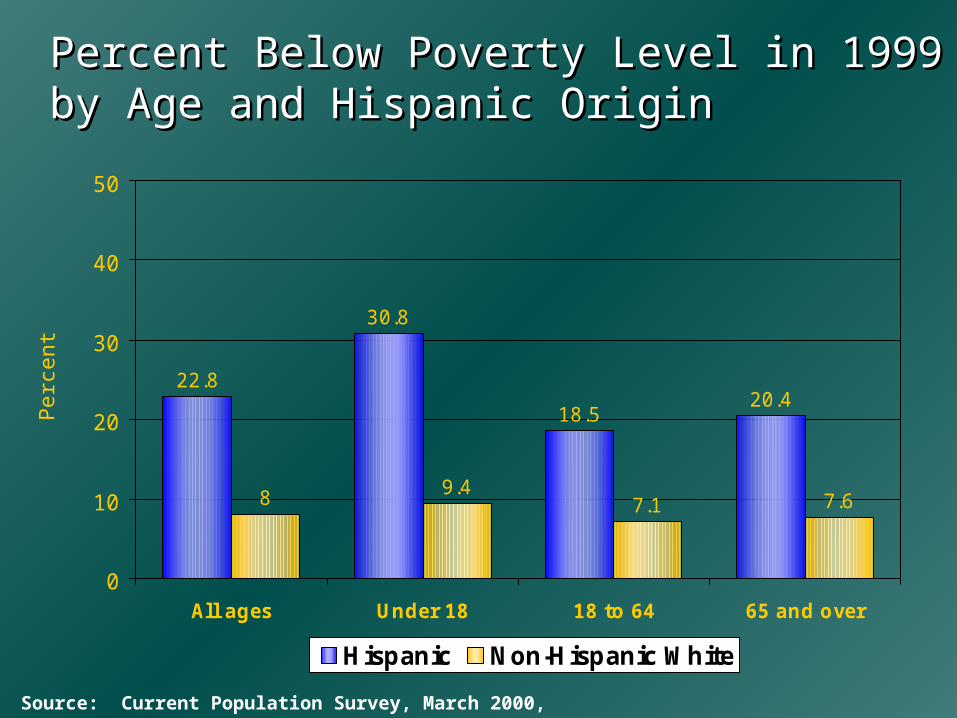
Percent Below Poverty Level in 1999 by Age and Percent Below Poverty Level in 1999 by Age and Hispanic OriginHispanic Origin
Perc
ent
22.8
30.8
18.520.4
8 9.47.1 7.6
0
10
20
30
40
50
All ages Under 18 18 to 64 65 and over
Hispanic Non-Hispanic White
Source: Current Population Survey, March 2000, PGP-4
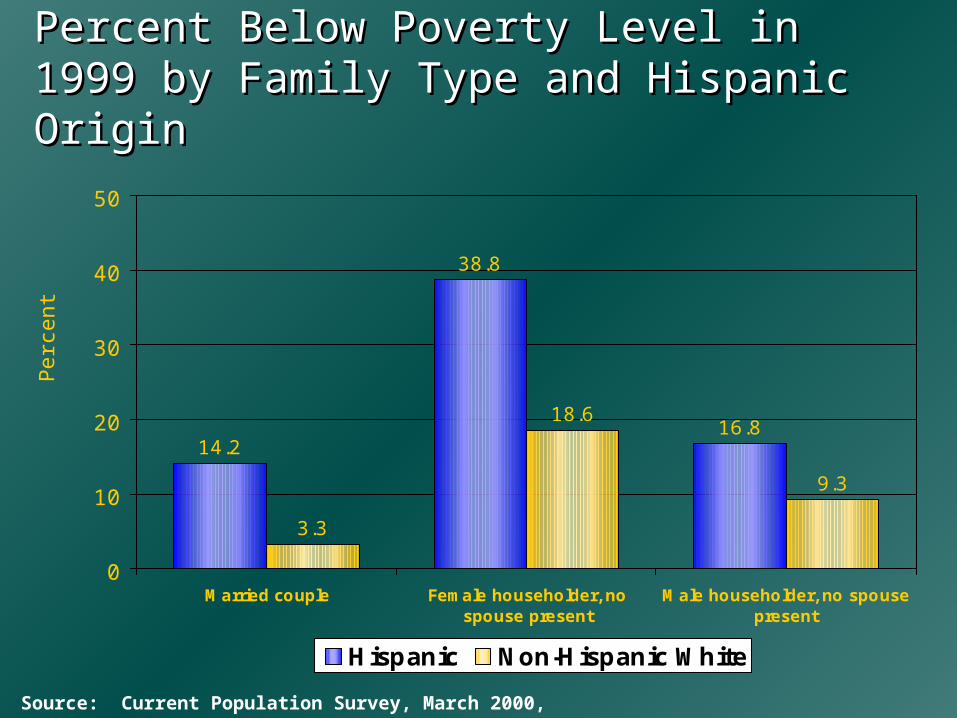
Percent Below Poverty Level in 1999 by Percent Below Poverty Level in 1999 by Family Type and Hispanic OriginFamily Type and Hispanic Origin
Perc
ent
14.2
38.8
16.8
3.3
18.6
9.3
0
10
20
30
40
50
Married couple Female householder, nospouse present
Male householder, no spousepresent
Hispanic Non-Hispanic White
Source: Current Population Survey, March 2000, PGP-4
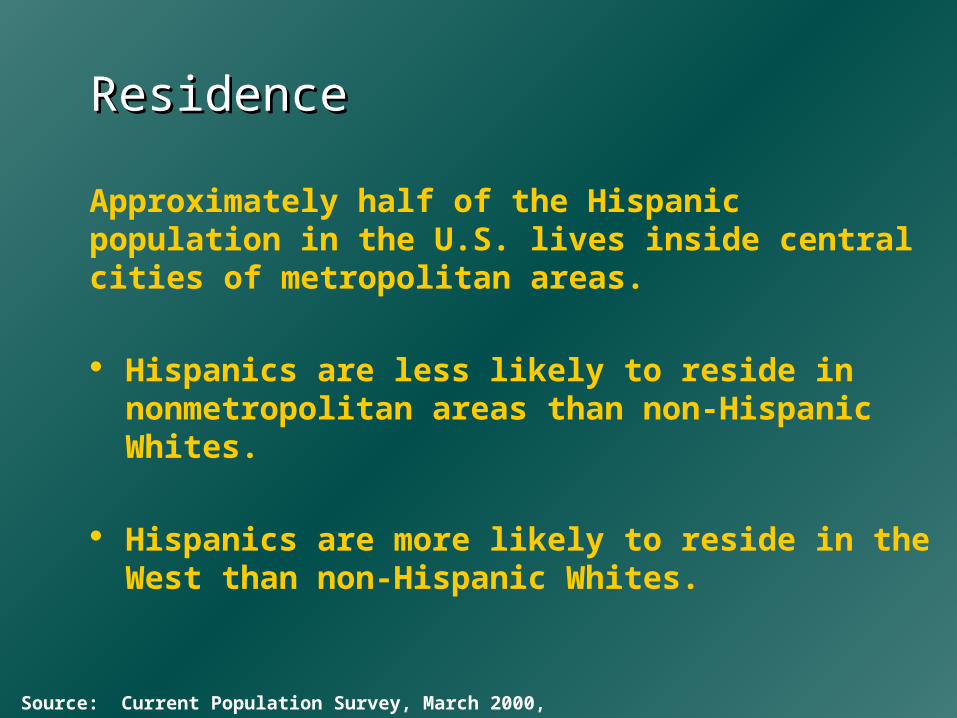
ResidenceResidence
Hispanics are less likely to reside in nonmetropolitan areas than non-Hispanic Whites.
Hispanics are more likely to reside in the West than non-Hispanic Whites.
Approximately half of the Hispanic population in the U.S. lives inside central cities of metropolitan areas.
Source: Current Population Survey, March 2000, PGP-4
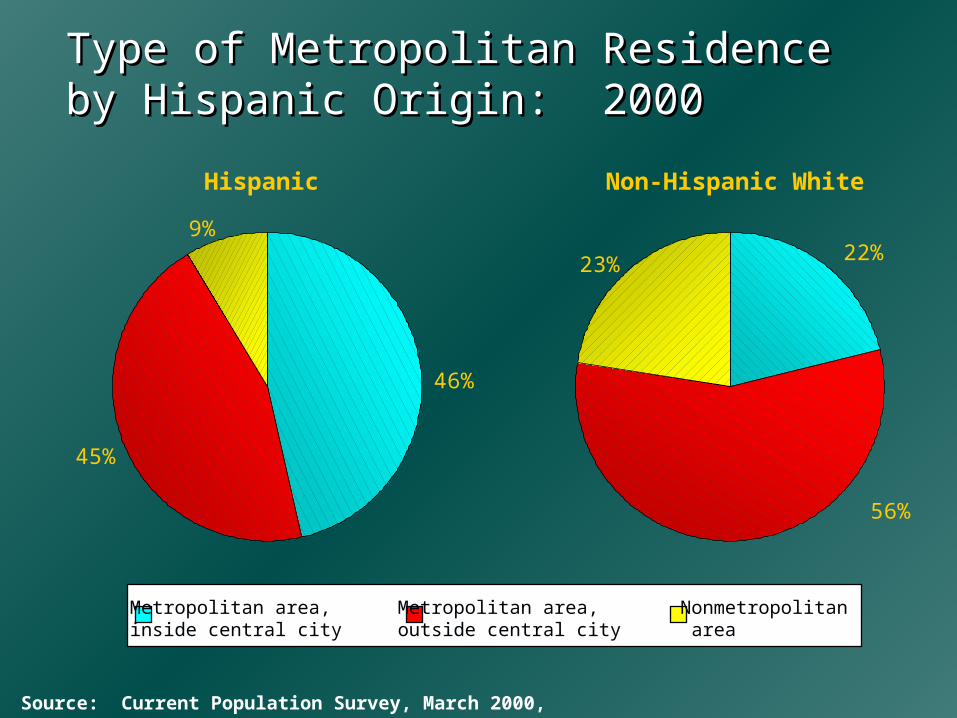
Type of Metropolitan ResidenceType of Metropolitan Residenceby Hispanic Origin: 2000by Hispanic Origin: 2000
Metropolitan area,inside central city
Metropolitan area,outside central city
Nonmetropolitan area
Hispanic Non-Hispanic White
46%
45%
9%22%
56%
23%
Source: Current Population Survey, March 2000, PGP-4
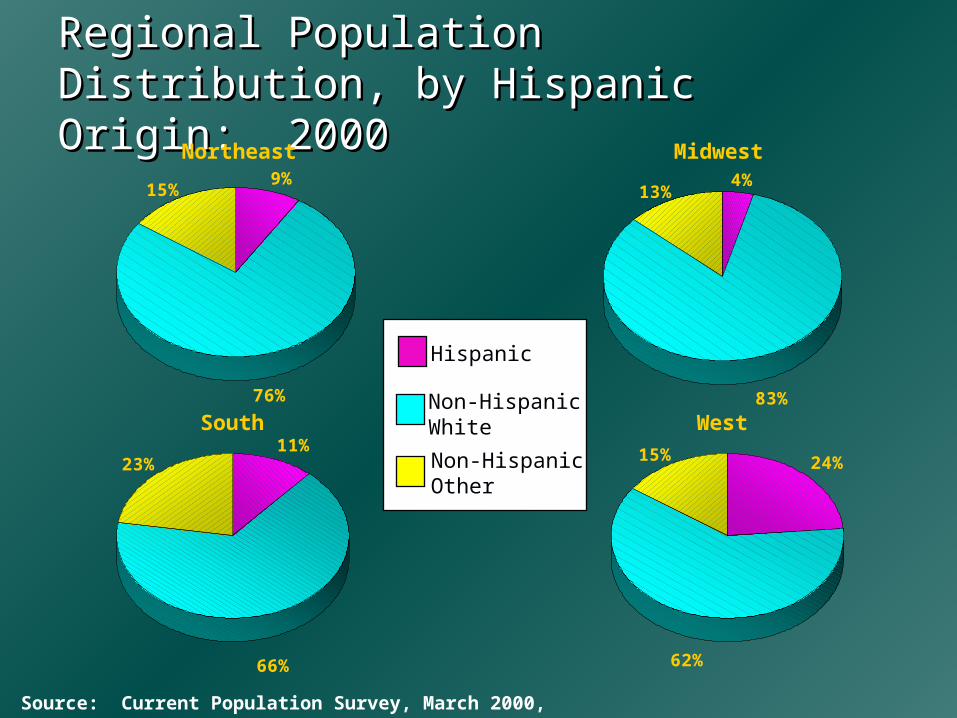
Regional Population Distribution, by Regional Population Distribution, by Hispanic Origin: 2000Hispanic Origin: 2000
Northeast
South
Midwest
West11%
66%
23%
13%
83%
4%
24%
62%
15%
Non-HispanicWhite
Non-HispanicOther
Hispanic
Source: Current Population Survey, March 2000, PGP-4
15%
76%
9%
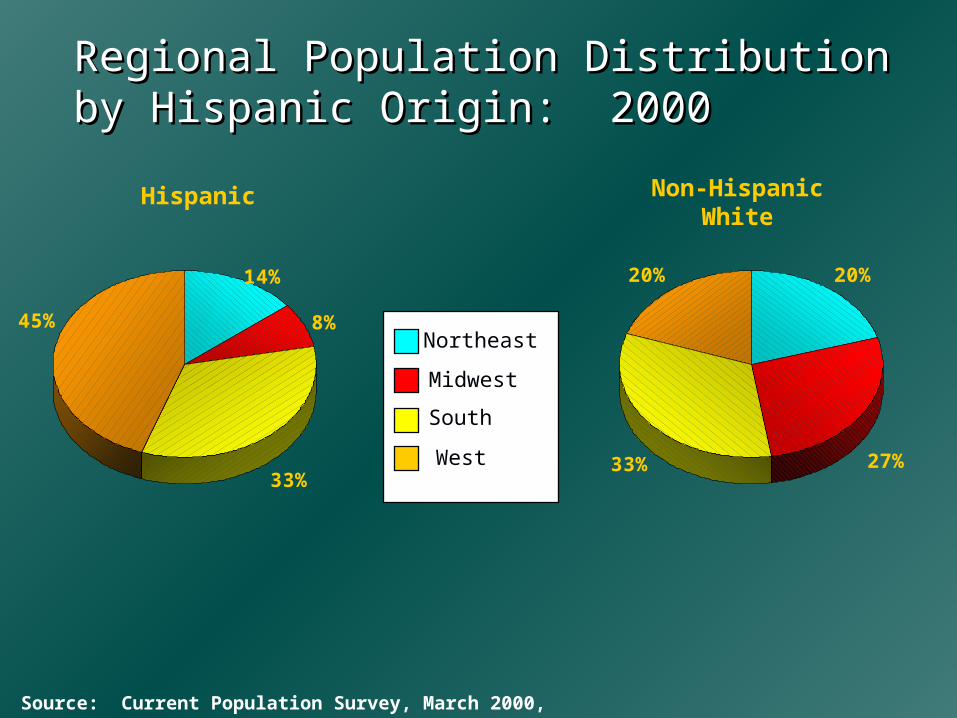
20% 20%
27%33%
Non-HispanicWhite
45%
14%
8%
33%
Northeast
Midwest
South
West
Hispanic
Regional Population DistributionRegional Population Distributionby Hispanic Origin: 2000by Hispanic Origin: 2000
Source: Current Population Survey, March 2000, PGP-4
For more information about the Hispanic For more information about the Hispanic population of the U.S.population of the U.S.
Visit the Census Bureau’s Web sitehttp://www.census.gov
Click on Subjects A-Z and Hispanic
This presentation was produced byThis presentation was produced by
Ethnic and Hispanic Statistics Branch
For information on content please contact: Roberto Ramirez
Phone: 301-457-2403e-mail:[email protected]
Related Documents