Chapter ES EXECUTIVE SUMMARY By USGS World Energy Assessment Team in U.S. Geological Survey Digital Data Series 60 U.S. Geological Survey

Welcome message from author
This document is posted to help you gain knowledge. Please leave a comment to let me know what you think about it! Share it to your friends and learn new things together.
Transcript
Chapter ES
EXECUTIVE SUMMARY
By USGS World Energy Assessment Team
in U.S. Geological Survey Digital Data Series 60
U.S. Geological Survey

ES-ii
Table of Contents
Executive Summary ............................................................................................ ES-1
References Cited ................................................................................................. ES-5
Tables
Table ES-1. World level summary of petroleum estimates for undiscovered
conventional petroleum and reserve growth for oil, gas, and natural gas liquids
(NGL).
Figures
Figure ES-1. Graph showing the mean estimate of the world grown conventional
endowment of oil, gas and NGL as from the 2000 World Assessment. Includes
cumulative production, remaining reserves, and, in conventional accumulations,
mean estimates of reserve growth and undiscovered resources. [in Billion Barrels
of Oil Equivalent (BBOE); production and reserve data largely as of 1/1/96,
Petroconsultants, 1996, NRG and Associates, 1995]
Figure ES-2. Graph comparing the 1994 and 2000 USGS world estimates
exclusive of the U.S. for undiscovered conventional oil, gas and NGL in BBOE.
For each commodity, the estimated reserve growth from the 2000 World
Assessment is also shown. The 1994 assessment by Masters and others (1994)
reported in a 1997 article in the Oil and Gas Journal, v. 95, no. 41, p. 98-104.

ES-1
EXECUTIVE SUMMARY
The U.S. Geological Survey (USGS) World Petroleum Assessment 2000 provides
estimates of the quantities of conventional oil, gas, and natural gas liquids outside
the United States that have the potential to be added to reserves in the next 30
years (1995 to 2025). Excluding the U.S., the mean (expected) volumes of
undiscovered resources are 649 billion barrels of oil (BBO), 4,669 trillion cubic
feet of gas (TCFG), and 207 billion barrels of natural gas liquids (BBNGL). The
estimated mean additions to reserves from discovered fields (potential reserve
growth) are 612 BBO, 3,305 TCFG, and 42 BBNGL (table ES-1, fig. ES-1). Table
ES-1 also shows the uncertainty ranges of these estimates.
The potential additions to reserves from reserve growth are nearly as large as the
estimated undiscovered resource volumes. These estimates imply that 75 percent of
the world’s grown conventional oil endowment and 66 percent of the world’s
grown conventional gas endowment have already been discovered in the areas assessed
(exclusive of the U.S.). Additionally, for these areas, 20 percent of the world's grown
conventional oil endowment and 7 percent of the world's grown conventional gas
endowment had been produced as of the end of 1995 (fig. ES-1).
The USGS undertook this world petroleum assessment in order to provide
impartial, scientifically based, societally relevant petroleum-resource information
essential to the economic and strategic security of the United States.
This assessment is based on extensive geologic studies as opposed to statistical
analysis. A team of more than 40 geoscientists and additional supporting staff
conducted the study over a five-year period from 1995 to 2000. The petroleum

ES-2
assessed occurs in fields exceeding a stated minimum size, which varies between 1
and 20 million barrels of oil equivalent in different areas, and in accumulation
categories judged to be viable in a 30-year forecast span.
The critical geologic controls on petroleum distribution are encompassed by the
Total Petroleum System (TPS) and were studied using this approach. Assessment
Units (AU), within the TPS, were the basic units for assessment. Overall, 159 TPS
and 270 AU were identified in 96 countries and 2 jointly held areas. Of these, 149
TPS and 246 AU in 128 geologic provinces were quantitatively assessed. The
assessed areas were those judged to be significant on a world scale in terms of
known petroleum volumes, geologic potential for new petroleum discoveries, and
political or societal importance. In the course of our geologic analyses, 24 AU
were identified as containing continuous (nonconventional) resources, but these
were not quantitatively assessed.
For each AU, allocations of undiscovered resources were made to the countries,
geologic provinces, regions, and offshore areas (if any) involved. From these
allocated portions, aggregations of estimates were made for higher levels such as to
countries, geologic provinces, and groups of countries including the Organization
of the Petroleum Exporting Countries (OPEC) and the Organization for Economic
Co-operation and Development (OECD).
The United States was not reassessed in this study; estimates previously made by
the USGS in 1995 and the Minerals Management Service in 1996 were used for
comparative purposes.

ES-3
Compared to the last USGS world petroleum assessment (Masters and others, 1994,
1997), undiscovered volumes from this assessment (exclusive of the U.S.) are 20
percent greater for oil, 14 percent smaller for gas, and 130 percent greater for NGL.
The large estimated volumes of oil, gas, and NGL from reserve growth in this
assessment represent a resource category not quantitatively assessed previously for
the world by the USGS (fig. ES-2).
The volume of undiscovered oil estimated in this assessment is larger than that of
the 1994 assessment, due in part to larger estimates for the Middle East and
Atlantic offshore portions of South America and Africa. However, in some areas
the estimated volumes of undiscovered oil were smaller, particularly for Mexico
and China.
The volume of undiscovered gas estimated in this assessment is smaller than that
of the previous world assessment mainly because of smaller estimates for arctic
areas of the Former Soviet Union, some basins in China, and the Alberta Basin of
Canada. The volume of undiscovered NGL estimated in this assessment is much
larger than that of the previous assessment because of more detailed analysis,
coupled with the incorporation of coproduct ratios into the assessment calculations.
Areas assessed in the World Petroleum Assessment 2000 that contain the greatest
volumes of undiscovered conventional oil include the Middle East, northeast
Greenland Shelf, the West Siberian and Caspian areas of the Former Soviet
Union, and the Niger and Congo delta areas of Africa. Significant new
undiscovered oil resource potential was identified in a number of areas with no
significant production history, such as northeast Greenland and offshore Suriname.

ES-4
Areas that contain the greatest volumes of undiscovered conventional gas include
the West Siberia Basin, Barents and Kara Seas shelves of the Former Soviet
Union, the Middle East, and offshore Norwegian Sea. A number of areas were
identified that may contain significant additional undiscovered gas resources where
large discoveries have been made but remain undeveloped. Examples include East
Siberia and the Northwest Shelf of Australia.
Results of USGS World Petroleum Assessment 2000 offer opportunities for many
studies beyond the initial analyses in this report. The material generated by this
effort can serve as a foundation for additional geologic, economic, geopolitical,
and environmental studies.

ES-5
REFERENCES CITED
Gautier, D. L., Dolton, G. L., Takahashi, K. I., and Varnes, K. L.,eds., 1995, 1995
National Assessment of United States Oil and Gas Resources - Results,
Methodology, and Supporting Data: U.S. Geological Survey Digital Data
Series DDS-30.
Masters, C.D., Root, D.H., and Turner, R.M., 1997, World of resource statistics
geared for electronic access: Oil & Gas Journal, v. 95, no. 41, p. 98-104.
Minerals Management Service, 1996, An assessment of the undiscovered
hydrocarbon potential of the Nation’s Outer Continental Shelf: Minerals
Management Service OCS Report MMS 96-0034, 40 p.
NRG Associates, Inc., 1995b, The significant oil and gas fields of Canada
database: Colorado Springs, Colo., NRG Associates, Inc. [Database
available from NRG Associates, Inc., P.O. Box 1655, Colorado Springs, CO
80901 U.S.A.]
Petroconsultants, 1996, Petroleum exploration and production database: Houston,
Texas, Petroconsultants, Inc. [Database available from Petroconsultants,
Inc., P.O. Box 740619, Houston, TX 77274-0619 U.S.A.]
Masters, C.D., Attanasi, E.D., and Root, D.H., 1994, World petroleum assessment
and analysis: Proceedings of the 14th World Petroleum Congress: John
Wiley and Sons, London, p.529-541.
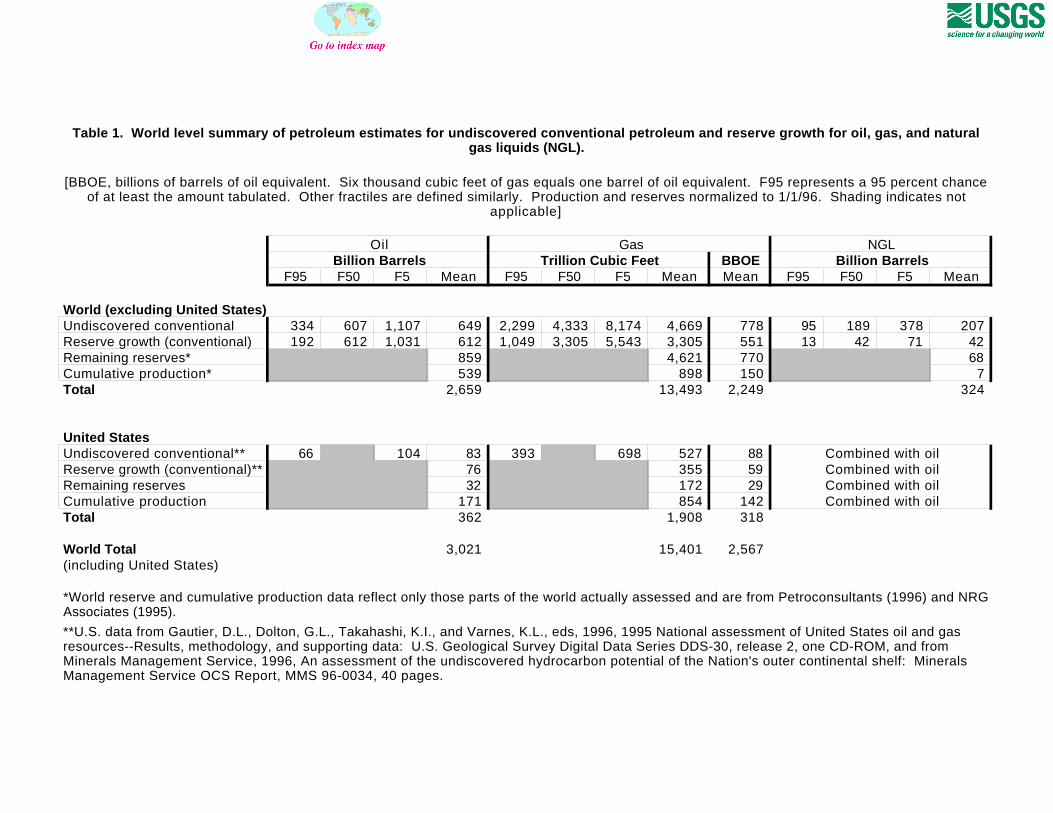
BBOEF95 F50 F5 Mean F95 F50 F5 Mean Mean F95 F50 F5 Mean
World (excluding United States)Undiscovered conventional 334 607 1,107 649 2,299 4,333 8,174 4,669 778 95 189 378 207 Reserve growth (conventional) 192 612 1,031 612 1,049 3,305 5,543 3,305 551 13 42 71 42 Remaining reserves* 859 4,621 770 68 Cumulative production* 539 898 150 7 Total 2,659 13,493 2,249 324
United StatesUndiscovered conventional** 66 104 83 393 698 527 88 Reserve growth (conventional)** 76 355 59 Remaining reserves 32 172 29 Cumulative production 171 854 142 Total 362 1,908 318
World Total 3,021 15,401 2,567 (including United States)
Table 1. World level summary of petroleum estimates for undiscovered conventional petroleum and reserve growth for oil, gas, and natural gas liquids (NGL).
Billion BarrelsGas NGL
Billion Barrels Trillion Cubic FeetOil
Combined with oil
[BBOE, billions of barrels of oil equivalent. Six thousand cubic feet of gas equals one barrel of oil equivalent. F95 represents a 95 percent chance of at least the amount tabulated. Other fractiles are defined similarly. Production and reserves normalized to 1/1/96. Shading indicates not
applicable]
**U.S. data from Gautier, D.L., Dolton, G.L., Takahashi, K.I., and Varnes, K.L., eds, 1996, 1995 National assessment of United States oil and gas resources--Results, methodology, and supporting data: U.S. Geological Survey Digital Data Series DDS-30, release 2, one CD-ROM, and from Minerals Management Service, 1996, An assessment of the undiscovered hydrocarbon potential of the Nation's outer continental shelf: Minerals Management Service OCS Report, MMS 96-0034, 40 pages.
*World reserve and cumulative production data reflect only those parts of the world actually assessed and are from Petroconsultants (1996) and NRG Associates (1995).
Combined with oilCombined with oilCombined with oil

539
859
612
649
150
770
551
778
6842 207
0
500
1000
1500
2000
2500
3000
BB
OE
UndiscoveredConventional
Reserve Growth(Conventional)
RemainingReserves
CumulativeProduction
Total2659
Total2249
Total 324
Figure 1. Graph showing the mean estimate of the world grown conventional endowment of oil, gas and NGL as from the 2000World Assessment. Includes cumulative production, remaining reserves, and, in conventional accumulations, mean estimates of reserve growth and undiscovered resources. [in Billion Barrels of Oil Equivalent (BBOE); production and reserve data largely asof 1/1/96, Petroconsultants, 1996, NRG and Associates, 1995]
Mean Oil Mean Gas Mean NGL

Figure 2. Graph comparing the 1994 and 2000 USGS world estimates exclusive of the U.S. for undiscovered conventional oil, gasand NGL in billion barrels of oil equivalent. For each commodity, the estimated reserve growth from the 2000 World Assessment is also shown. The 1994 assessment results are as reported in Masters and others (1997).
0
200
400
600
800
1,000
1,200
1,400
Mean Oil Mean Gas Mean NGLCommodity
Undiscovered (1994)Undiscovered (2000)Reserve Growth (2000)
539
612
649
915
551
778
90
207
42
Estim
ate,
in B
illio
n B
arre
ls o
f Oil
Equi
vale
nt
Related Documents