U.S. Geological Survey Presentation to the New York Drought Management Task Force August 10, 1999 Data-Collection Network Funded in Cooperation with other State, Federal, and local Agencies Web Page ny.usgs.gov

U.S. Geological Survey Presentation to the New York Drought Management Task Force August 10, 1999 Data-Collection Network Funded in Cooperation with other.
Dec 17, 2015
Welcome message from author
This document is posted to help you gain knowledge. Please leave a comment to let me know what you think about it! Share it to your friends and learn new things together.
Transcript

U.S. Geological Survey Presentation to the
New YorkDrought Management
Task Force
August 10, 1999
Data-Collection Network Funded in Cooperation with other State, Federal, and local Agencies
Web Page ny.usgs.gov

Surface Water Conditions
Gary Firda
New York District
Surface-Water Specialist
Mohawk River at Cohoes, NY

EXPLANATION
DIS
CH
AR
GE
, IN
CU
BIC
F
EE
T P
ER
SE
CO
ND 93% 98%
Maximum / Minimum thru WY98 25 / 75% Exceedance thru WY98 Median thru WY98 Current mean monthly discharge95% Exceedance thru WY98
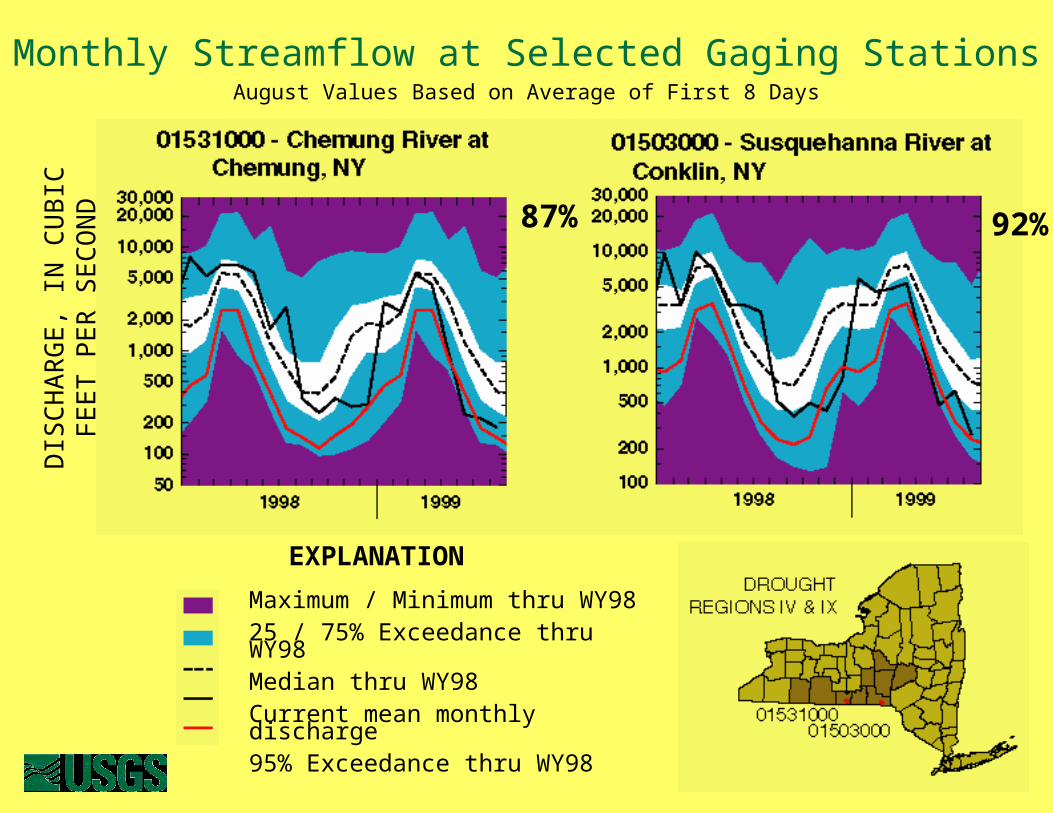
August Values Based on Average of First 8 Days
Monthly Streamflow at Selected Gaging Stations

EXPLANATION
DIS
CH
AR
GE
, IN
CU
BIC
F
EE
T P
ER
SE
CO
ND 99% 98%
Maximum / Minimum thru WY98 25 / 75% Exceedance thru WY98 Median thru WY98 Current mean monthly discharge95% Exceedance thru WY98
August Values Based on Average of First 8 Days
Monthly Streamflow at Selected Gaging Stations

EXPLANATION
DIS
CH
AR
GE
, IN
CU
BIC
F
EE
T P
ER
SE
CO
ND 95% 94%
Maximum / Minimum thru WY98 25 / 75% Exceedance thru WY98 Median thru WY98 Current mean monthly discharge95% Exceedance thru WY98
August Values Based on Average of First 8 Days
Monthly Streamflow at Selected Gaging Stations
EXPLANATION
DIS
CH
AR
GE
, IN
CU
BIC
F
EE
T P
ER
SE
CO
ND 87% 92%
Maximum / Minimum thru WY98 25 / 75% Exceedance thru WY98 Median thru WY98 Current mean monthly discharge95% Exceedance thru WY98
August Values Based on Average of First 8 Days
Monthly Streamflow at Selected Gaging Stations

EXPLANATION
DIS
CH
AR
GE
, IN
CU
BIC
F
EE
T P
ER
SE
CO
ND 100%
Maximum / Minimum thru WY98 25 / 75% Exceedance thru WY98 Median thru WY98 Current mean monthly discharge95% Exceedance thru WY98
August Values Based on Average of First 8 Days
Monthly Streamflow at Selected Gaging Stations

EXPLANATION
DIS
CH
AR
GE
, IN
CU
BIC
F
EE
T P
ER
SE
CO
ND 90% 100%
Maximum / Minimum thru WY98 25 / 75% Exceedance thru WY98 Median thru WY98 Current mean monthly discharge95% Exceedance thru WY98
August Values Based on Average of First 8 Days
Monthly Streamflow at Selected Gaging Stations

EXPLANATION
DIS
CH
AR
GE
, IN
CU
BIC
F
EE
T P
ER
SE
CO
ND
100%93%
Maximum / Minimum thru WY98 25 / 75% Exceedance thru WY98 Median thru WY98 Current mean monthly discharge 95% Exceedance thru WY98
August Values Based on Average of First 8 Days
Monthly Streamflow at Selected Gaging Stations

EXPLANATION
DIS
CH
AR
GE
, IN
CU
BIC
F
EE
T P
ER
SE
CO
ND 89% 63%
Maximum / Minimum thru WY98 25 / 75% Exceedance thru WY98 Median thru WY98 Current mean monthly discharge95% Exceedance thru WY98
August Values Based on Average of First 8 Days
Monthly Streamflow at Selected Gaging Stations

Streamflow Conditions for July 1999
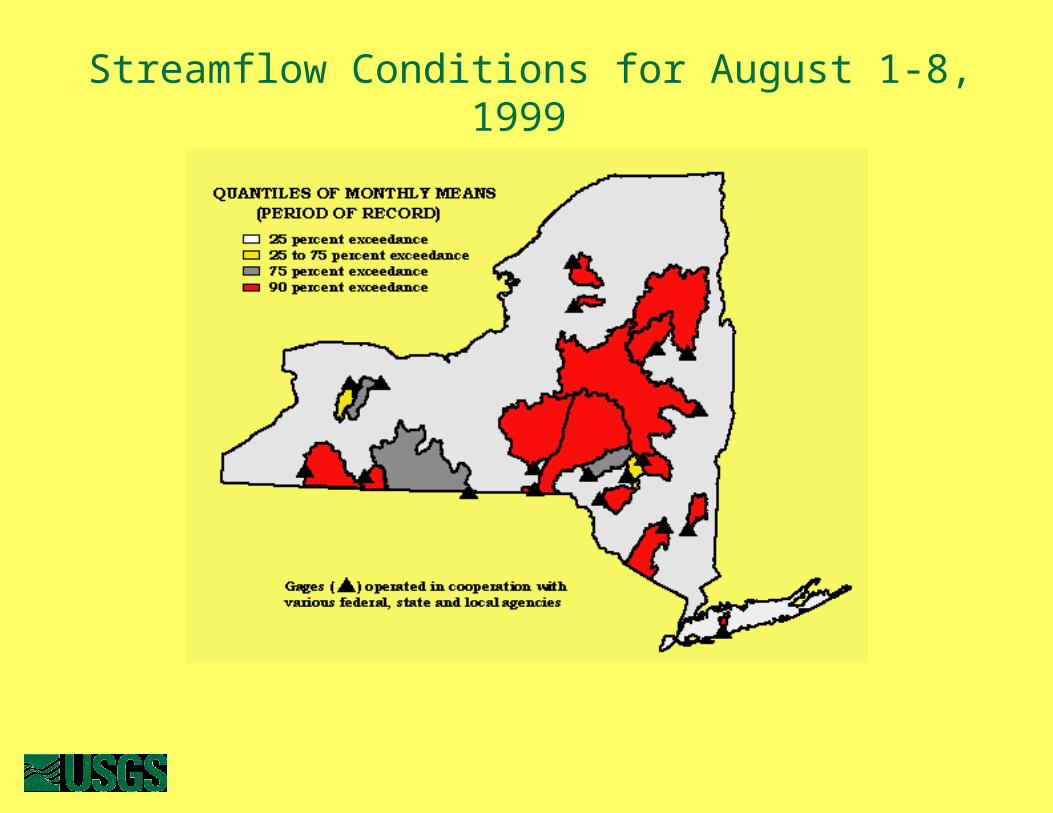
Streamflow Conditions for August 1-8, 1999

About 5 miles downstream of Poughkeepsie’s Water-Supply Intakes.
Salt-Front on 8/10/99at about River-Mile 72
Gaging Station Location
Salt-Front Location in the Hudson River Aug. 10,
1999

Specific Conductance

Location of Salt Front in Hudson RiverData Through August 8, 1999

Ground-Water Conditions
John Williams
New York District
Ground-Water Specialist

Du-1009, Dutchess CountyW
AT
ER
LE
VE
L, I
N F
EE
TB
EL
OW
LA
ND
SU
RF
AC
E
Maximum/Minimum thru WY98 75/25 % Exceedance thru WY98 90 % Exceedance thru WY98 95 % Exceedance thru WY98 Median thru WY98 Current water levels
EXPLANATION
Values through month of July

A-636, Albany CountyW
AT
ER
LE
VE
L, I
N F
EE
TB
EL
OW
LA
ND
SU
RF
AC
E
Maximum/Minimum thru WY98 75/25 % Exceedance thru WY98 90 % Exceedance thru WY98 95 % Exceedance thru WY98 Median thru WY98 Current water levels
EXPLANATIONValues through month of July

Wo-4, Wyoming CountyW
AT
ER
LE
VE
L, I
N F
EE
TB
EL
OW
LA
ND
SU
RF
AC
E
Maximum/Minimum thru WY98 75/25 % Exceedance thru WY98 90 % Exceedance thru WY98 95 % Exceedance thru WY98 Median thru WY98 Current water levels
EXPLANATIONValues through month of July

Sb-472, Steuben CountyW
AT
ER
LE
VE
L, I
N F
EE
TB
EL
OW
LA
ND
SU
RF
AC
E Maximum/Minimum thru WY98 75/25 % Exceedance thru WY98 90 % Exceedance thru WY98 95 % Exceedance thru WY98 Median thru WY98 Current water levels
EXPLANATIONValues through month of July

S5517, Suffolk CountyW
AT
ER
LE
VE
L, I
N F
EE
TB
EL
OW
LA
ND
SU
RF
AC
E
Maximum/Minimum thru WY98 75/25 % Exceedance thru WY98 90 % Exceedance thru WY98 95 % Exceedance thru WY98 Median thru WY98 Current water levels
EXPLANATIONValues through month of July

Federal-State observation well networkValues through month of July
Related Documents