U.S. Economic Outlook William Strauss Senior Economist and Economic Advisor Federal Reserve Bank of Chicago 2019 SMIFC Conference Chicago, IL November 1, 2019

Welcome message from author
This document is posted to help you gain knowledge. Please leave a comment to let me know what you think about it! Share it to your friends and learn new things together.
Transcript

U.S. Economic Outlook
William StraussSenior Economistand Economic AdvisorFederal Reserve Bank of Chicago
2019 SMIFC ConferenceChicago, ILNovember 1, 2019

GDP expanded by 2.0% over the past year
-10
-8
-6
-4
-2
0
2
4
6
8
1990 '92 '94 '96 '98 '00 '02 '04 '06 '08 '10 '12 '14 '16 '18
Real gross domestic productpercent
Quarterly change (saar)
Percent change from a year earlier
The Index of Leading Economic Indicatorshas been edging higher through August
0
20
40
60
80
100
120
1960 '65 '70 '75 '80 '85 '90 '95 '00 '05 '10 '15
Composite Index of 10 Leading IndicatorsIndex (2016=100)

The probability of a recession over the next two quartershas moved higher, but remains low
0
10
20
30
40
50
60
1990 '92 '94 '96 '98 '00 '02 '04 '06 '08 '10 '12 '14 '16 '18
Probablility of a recession - two quarters ahead (Survey of Professional Forecasters)percent

-5.0
-4.0
-3.0
-2.0
-1.0
0.0
1.0
2.0
1990 '92 '94 '96 '98 '00 '02 '04 '06 '08 '10 '12 '14 '16 '18
Monthly
Chicago Fed National Activity Index
Three month average
The Chicago Fed National Activity Index3-month average in September 2019 was a bit below trend

The Sahm Current-Time Unemployment Rate Recession Indicator is well below the 0.5% recession threshold
-0.5
0.0
0.5
1.0
1.5
2.0
2.5
3.0
3.5
4.0
1970 '75 '80 '85 '90 '95 '00 '05 '10 '15
Sahm Current-Time Unemployment Rate Recession Indicatorpercent

The Federal Open Market Committee (FOMC) expectsGDP to grow just above trend in 2019;
and around trend in 2020, 2021 and 2022
-5-4-3-2-10123456
1990 '92 '94 '96 '98 '00 '02 '04 '06 '08 '10 '12 '14 '16 '18 '20 '22
Real gross domestic productpercent change from a year earlier
FOMC
FOMC Central Tendency (September 2019)
2019 2.1 – 2.32020 1.8 – 2.12021 1.8 – 2.02022 1.7 – 2.0
Longer run 1.8 – 2.0

The stock market is near a record high
50
100
150
200
250
300
350
400
450
500
1990 '92 '94 '96 '98 '00 '02 '04 '06 '08 '10 '12 '14 '16 '18
Real S&P 500 stock indexIndex: 1990 = 100
-8
-6
-4
-2
0
2
4
6
1990 '92 '94 '96 '98 '00 '02 '04 '06 '08 '10 '12 '14 '16 '18
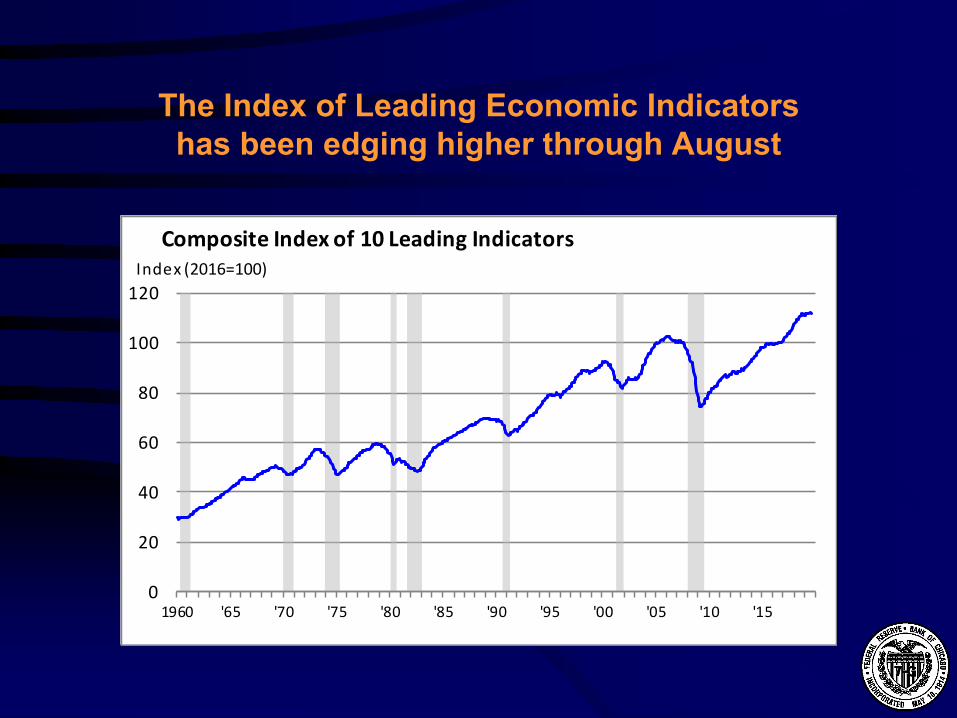
Total employmentpercent
Monthly change (saar)
Percent change from a year earlier
Employment increased by nearly 2.1 million jobsover the past 12 months

3
4
5
6
7
8
9
10
11
1990 '92 '94 '96 '98 '00 '02 '04 '06 '08 '10 '12 '14 '16 '18
Unemployment ratepercent
The unemployment rate was a very low 3.6% in October

3
4
5
6
7
8
9
10
11
1990 '92 '94 '96 '98 '00 '02 '04 '06 '08 '10 '12 '14 '16 '18 '20 '22
Unemployment ratepercent
FOMC
The FOMC forecasts that the unemployment ratewill be below the natural rate through 2022
FOMC Central Tendency (September 2019)
2019 3.6 – 3.72020 3.5 – 3.82021 3.6 – 3.92022 3.7 – 4.0
Longer run 4.0 – 4.3

Wages continue to increase at a moderate ratewhile benefit costs gains are easing
0
1
2
3
4
5
6
7
8
1990 '92 '94 '96 '98 '00 '02 '04 '06 '08 '10 '12 '14 '16 '18
Employment cost indexpercent change from year ago
benefit costs
wages and salaries

There is a very strong correlation between 9-month lead NFIB: planning to raise compensation and
Employment Cost Index: wages and salaries
1.0
1.5
2.0
2.5
3.0
3.5
4.0
4.5
0
5
10
15
20
25
1986 '88 '90 '92 '94 '96 '98 '00 '02 '04 '06 '08 '10 '12 '14 '16 '18 '20
Employment cost index - wages and salaries and NFIB: Companies planning to raise wages and salaries
% of frims
ECI: wages and salaries(private industry workers) - right scale
NFIB: Companies planning to raise worker compensation(9 month lead) - left scale
% y/y
Correlation = 0.83
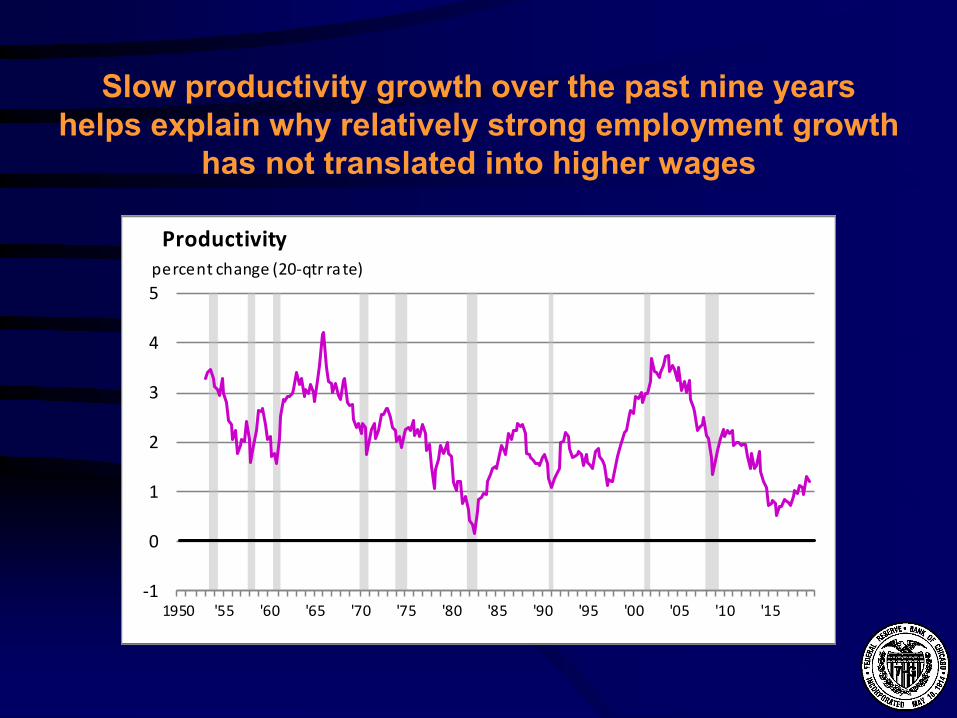
Slow productivity growth over the past nine yearshelps explain why relatively strong employment growth
has not translated into higher wages
-1
0
1
2
3
4
5
1950 '55 '60 '65 '70 '75 '80 '85 '90 '95 '00 '05 '10 '15
Productivitypercent change (20-qtr rate)
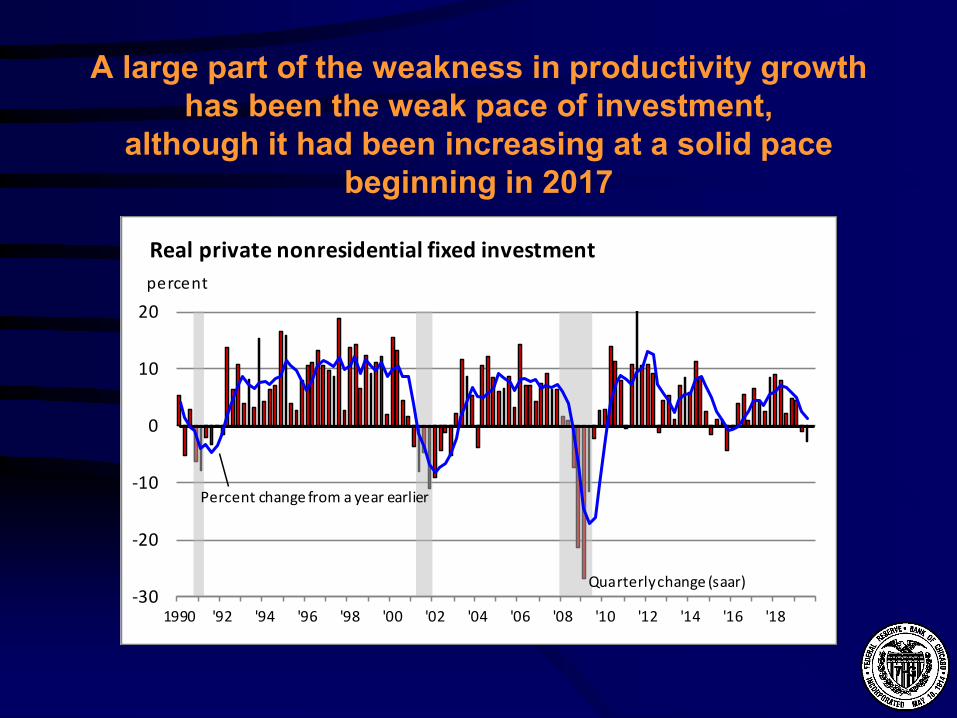
A large part of the weakness in productivity growthhas been the weak pace of investment,
although it had been increasing at a solid pacebeginning in 2017
-30
-20
-10
0
10
20
1990 '92 '94 '96 '98 '00 '02 '04 '06 '08 '10 '12 '14 '16 '18
Real private nonresidential fixed investment percent
Quarterly change (saar)
Percent change from a year earlier

This may help explain the productivitygrowth improvement over the past couple of years
-3-2-1012345678
1950 '55 '60 '65 '70 '75 '80 '85 '90 '95 '00 '05 '10 '15
Productivitypercent change from a year earlier

-15
-10
-5
0
5
10
15
20
1950 '55 '60 '65 '70 '75 '80 '85 '90 '95 '00 '05 '10 '15
Unit labor costpercent
Quarterly change (saar)
Percent change from a year earlier
Improving productivity growth is helping to keep unit labor cost growth down even with compensation rising
-100
-50
0
50
100
150
200
1990 '92 '94 '96 '98 '00 '02 '04 '06 '08 '10 '12 '14 '16 '18
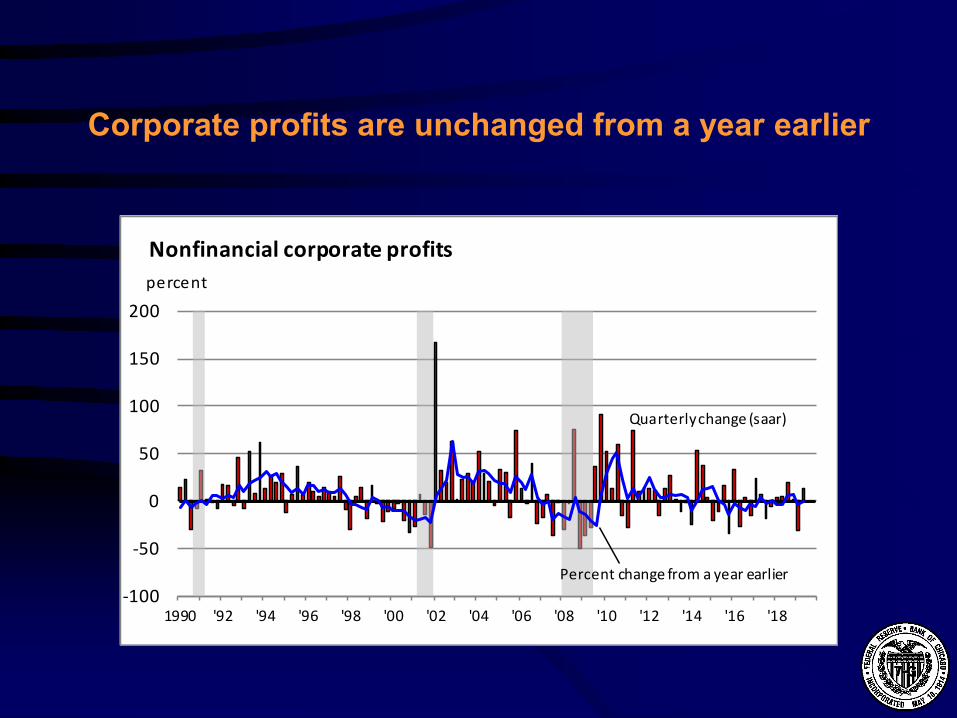
Nonfinancial corporate profitspercent
Quarterly change (saar)
Percent change from a year earlier
Corporate profits are unchanged from a year earlier

-2
-1
0
1
2
3
4
5
6
1990 '92 '94 '96 '98 '00 '02 '04 '06 '08 '10 '12 '14 '16 '18
Personal consumption expenditure - chain price indexpercent change from a year earlier
Inflation is below the Fed target of 2%

0
20
40
60
80
100
120
140
160
1970 '75 '80 '85 '90 '95 '00 '05 '10 '15
Real West Texas Intermediate oil pricedol lars per barrel, 2018 dollars
In large part inflation has been followingthe pattern of energy prices

3
4
5
6
7
8
9
10
1960 '65 '70 '75 '80 '85 '90 '95 '00 '05 '10 '15
Energy goods and services expenditures as a share oftotal consumptionpercent
Expenditures on energy remainwell below the historical average
3
4
5
6
7
8
9
10
1960 '65 '70 '75 '80 '85 '90 '95 '00 '05 '10 '15
Energy goods and services expenditures as a share oftotal consumptionpercent
60s
70s
80s
90s 00s
1960-2018
10s
0
1
2
3
4
5
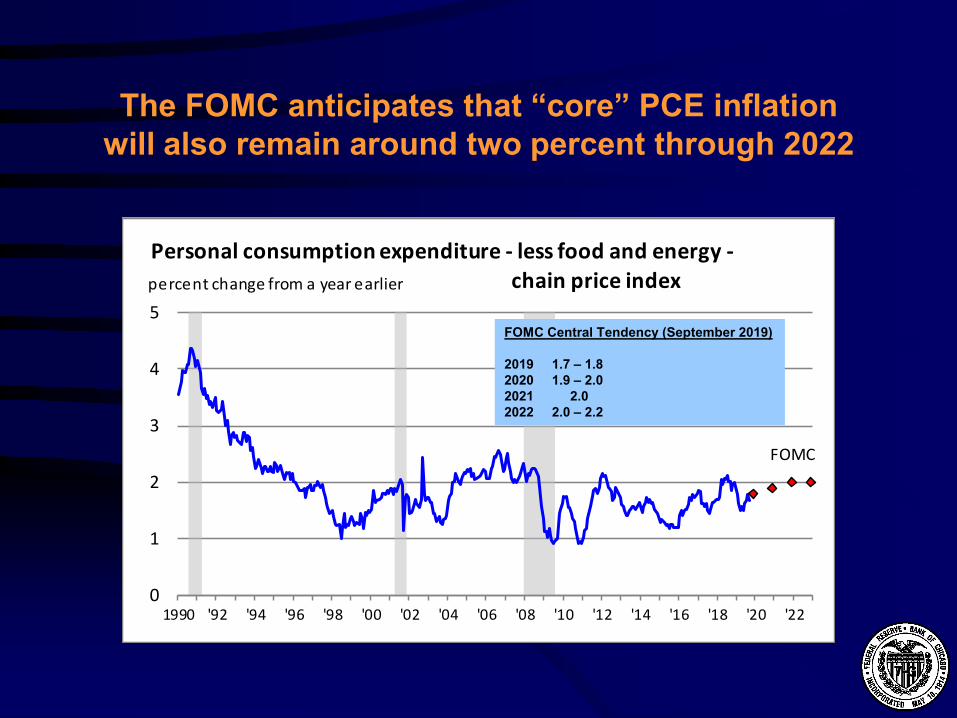
1990 '92 '94 '96 '98 '00 '02 '04 '06 '08 '10 '12 '14 '16 '18
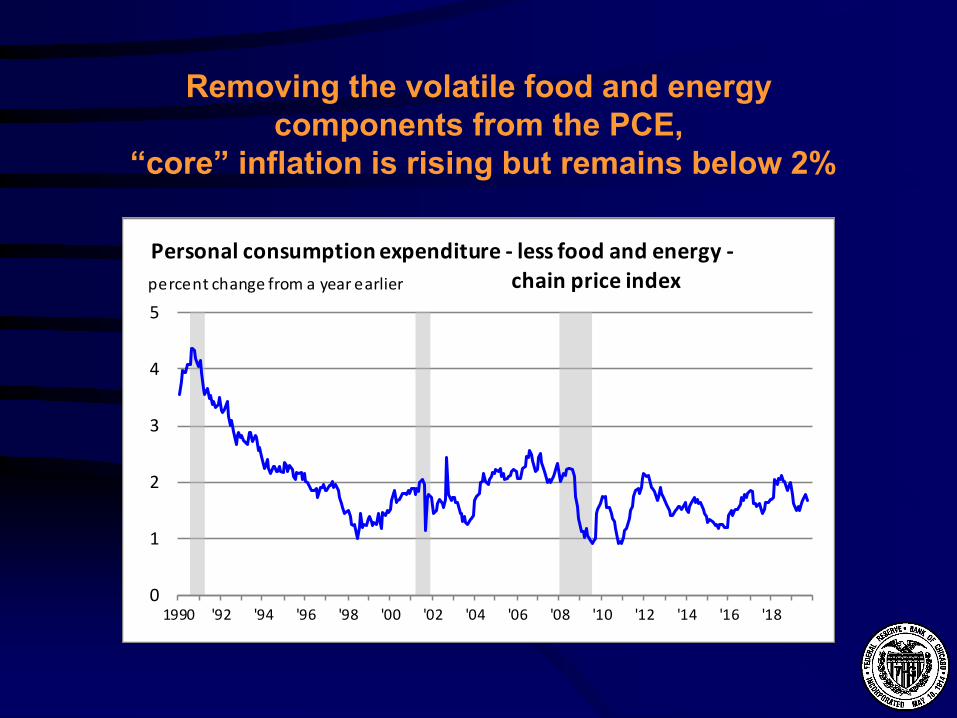
Personal consumption expenditure - less food and energy -chain price indexpercent change from a year earlier
Removing the volatile food and energy components from the PCE,
“core” inflation is rising but remains below 2%

The FOMC anticipates that PCE inflation will be aroundits two percent target in 2020 through 2022
-2
-1
0
1
2
3
4
5
6
1990 '92 '94 '96 '98 '00 '02 '04 '06 '08 '10 '12 '14 '16 '18 '20 '22
Personal consumption expenditure - chain price indexpercent change from a year earlier
FOMC
FOMC Central Tendency (September 2019)
2019 1.5 – 1.6 2020 1.8 – 2.0 2021 2.0 2022 2.0 – 2.2
Longer run 2.0
0
1
2
3
4
5
1990 '92 '94 '96 '98 '00 '02 '04 '06 '08 '10 '12 '14 '16 '18 '20 '22
Personal consumption expenditure - less food and energy -chain price indexpercent change from a year earlier
FOMC
The FOMC anticipates that “core” PCE inflationwill also remain around two percent through 2022
FOMC Central Tendency (September 2019)
2019 1.7 – 1.8 2020 1.9 – 2.02021 2.0 2022 2.0 – 2.2

Inflation Exchange RateReal GDP % change Against Interest Rates% change Annual US Dollar 3-Month
Annual Consumer Prices End of Year End of Year2018 2019 2020 2018 2019 2020 2019 2020 2019 2020
United States 2.9 2.3 1.7 2.4 1.8 2.1 - - 2.12 1.54Canada 1.9 1.5 1.5 2.3 2.0 2.0 1.33 1.31 1.68 1.50Mexico 2.0 0.4 1.2 4.9 3.7 3.5 19.88 20.33 7.70 7.03
Japan 0.8 1.0 0.3 1.0 0.7 1.0 106.7 107.0 -0.08 -0.06South Korea 2.7 1.9 2.1 1.5 0.7 1.3 1,213 1,194 1.46 1.37
United Kingdom 1.4 1.2 1.0 2.5 1.9 2.0 1.22 1.30 0.77 0.82Germany 1.5 0.5 0.7 1.9 1.4 1.4 1.10 1.16 -0.45 -0.41
France 1.7 1.3 1.2 2.1 1.2 1.3 1.10 1.16 -0.45 -0.41Euro Zone 1.9 1.2 1.1 1.8 1.3 1.3 1.10 1.16 -0.45 -0.41
Brazil 1.1 0.9 1.9 3.7 3.7 3.7 4.03 3.94 5.27 5.00Russia 2.3 1.1 1.6 2.9 4.6 4.0 65.42 65.23 7.14 6.79China 6.6 6.1 5.8 2.1 2.5 2.5 7.23 7.19 2.65 2.59India 7.4 5.8 6.6 3.9 3.3 4.0 72.10 71.44 5.88 5.68
Blue Chip Economic Indicators Forecast October 10, 2019
Blue Chip International Consensus Forecasts

Oct-18 No v-18 De c-18 Ja n-19 Fe b -19 Ma r-19 Ap r-19 Ma y-19 Jun-19 Jul-19 Aug 19 Se p 19Glo b a l 52.0 52.0 51.5 50.8 50.6 50.6 50.4 49.8 49.4 49.3 49.5 49.7Unite d Sta te s 55.7 55.3 53.8 54.9 53.0 52.4 52.6 50.5 50.6 50.4 50.3 51.1Ca na d a 53.9 54.9 53.6 53.0 52.6 50.5 49.7 49.1 49.2 50.2 49.1 51.0Me xico 50.7 49.7 49.7 50.9 52.6 49.8 50.1 50.0 49.2 49.8 49.0 49.1Euro zo ne 52.0 51.8 51.4 50.5 49.3 47.5 47.9 47.7 47.6 46.5 47.0 45.7Ge rma ny 52.2 51.8 51.5 49.7 47.6 44.1 44.4 44.3 45.0 43.2 43.5 41.7Fra nce 51.2 50.8 49.7 51.2 51.5 49.7 50.0 50.6 51.9 49.7 51.1 50.1Ita ly 49.2 48.6 49.2 47.8 47.7 47.4 49.1 49.7 48.4 48.5 48.7 47.8Sp a in 51.8 52.6 51.1 52.4 49.9 50.9 51.8 50.1 47.9 48.2 48.8 47.7UK 51.1 53.6 54.2 52.8 52.1 55.1 53.1 49.4 48.0 48.0 47.4 48.3Russ ia 51.3 52.6 51.7 50.9 50.1 52.8 51.8 49.8 48.6 49.3 49.1 46.3Ja p a n 52.9 52.2 52.6 50.3 48.9 49.2 50.2 49.8 49.3 49.4 49.3 48.9China 50.1 50.2 49.7 48.3 49.9 50.8 50.2 50.2 49.4 49.9 50.4 51.4Ind ia 53.1 54.0 53.2 53.9 54.3 52.6 51.8 52.7 52.1 52.5 51.4 51.4Bra zil 51.1 52.7 52.6 52.7 53.4 52.8 51.5 50.2 51.0 49.9 52.5 53.4
Manufacturers’ Purchasing Managers Indexes

More open countries have had better growth

U.S. tariffs used to be much higher

Tariffs: U.S. versus other countries

Tariffs: U.S. versus other countries

Tariffs: Recent threatened tariffscould push the U.S. much higher

The Blue Chip forecast projects a continuingdeterioration in the balance of trade
-1200
-1000
-800
-600
-400
-200
0
2000 '01 '02 '03 '04 '05 '06 '07 '08 '09 '10 '11 '12 '13 '14 '15 '16 '17 '18 '19 '20
Net exportsbi l lions of chained 2012 dollars (saar)
Q3-2019
Blue Chip Forecast

0
500
1,000
1,500
2,000
2,500
1980 '85 '90 '95 '00 '05 '10 '15 '20
Housing startsthousands
Blue Chip Housing StartsForecast (thousands)
Actual Forecast 2018 2019 20201,250 1,254 1,266
The Blue Chip Forecast calls for a continuationof the very gradual recovery in housing
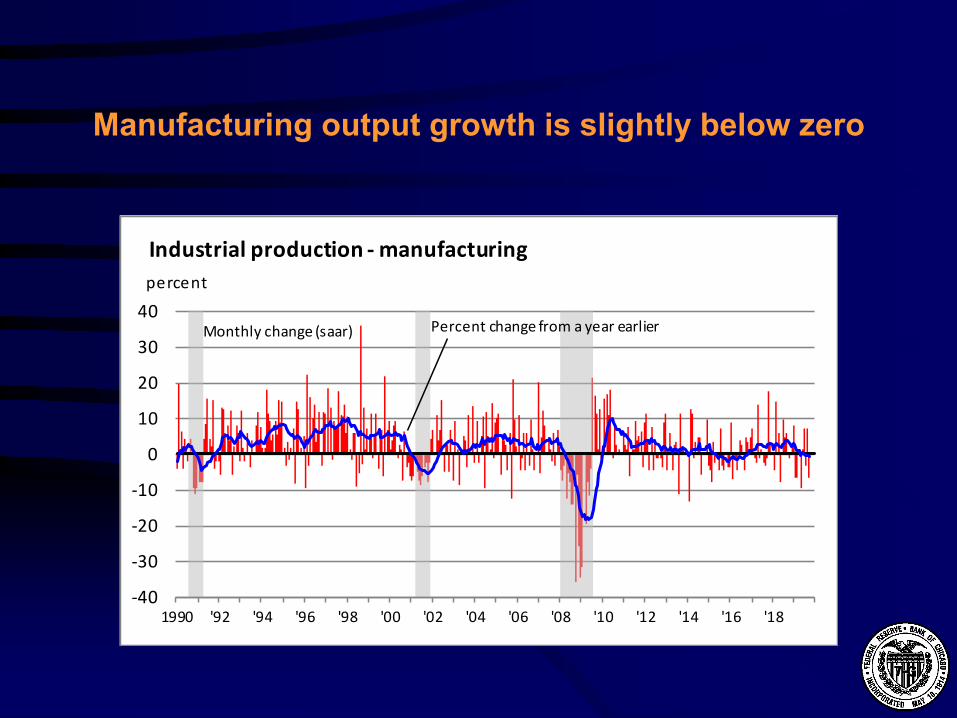
Manufacturing output growth is slightly below zero
-40
-30
-20
-10
0
10
20
30
40
1990 '92 '94 '96 '98 '00 '02 '04 '06 '08 '10 '12 '14 '16 '18
Industrial production - manufacturingpercent
Monthly change (saar) Percent change from a year earlier

62646668707274767880828486
1990 '92 '94 '96 '98 '00 '02 '04 '06 '08 '10 '12 '14 '16 '18
Capacity utilization - manufacturingpercent
The decline in capacity utilization may have bottomed

-25
-20
-15
-10
-5
0
5
10
15
1990 '92 '94 '96 '98 '00 '02 '04 '06 '08 '10 '12 '14 '16 '18
Manufacturing employmentpercent
Monthly change (saar)
Percent change from a year earlier
Manufacturing employment increased by49,000 workers over the past 12 months

Year-to-date light vehicle sales are 17.0 million units in 2019,0.8% below the comparable period from a year earlier
89
10111213141516171819202122
1990 '92 '94 '96 '98 '00 '02 '04 '06 '08 '10 '12 '14 '16 '18
Light vehicle salesmil lions of units (saar)

Year-to-date 2019 light truck sales were 2.8% higher,while year-to-date 2019 passenger car sales were 8.7% lower
3456789
10111213
1990 '92 '94 '96 '98 '00 '02 '04 '06 '08 '10 '12 '14 '16 '18
Passenger car and light truck salesmil lions of units (saar)
light trucks
passenger cars

Light truck market share is at a record high
30
35
40
45
50
55
60
65
70
75
1990 '92 '94 '96 '98 '00 '02 '04 '06 '08 '10 '12 '14 '16 '18
Light truck share of light vehicle market salespercent

Alternative powered vehicles (including hybrids)are a very small fraction of total vehicle sales
0102030405060708090
100
1990 '92 '94 '96 '98 '00 '02 '04 '06 '08 '10 '12 '14 '16 '18
Power-Typepercent of total sales
Alternative
Gasoline and Diesel

Alternative powered vehicles (including hybrids)market share remains below 5%
0
1
2
3
4
5
6
1990 '92 '94 '96 '98 '00 '02 '04 '06 '08 '10 '12 '14 '16 '18
Alternative Powered Vehiclespercent of total sales

Blue Chip forecasts vehicle sales tomove lower this year and in 2020
10
11
12
13
14
15
16
17
18
1980 '85 '90 '95 '00 '05 '10 '15 '20
Vehicle salesmil lions of units
Blue Chip Light-VehicleSales Forecast
Actual Forecast 2018 2019 202017.2 16.8 16.4

-25
-20
-15
-10
-5
0
5
10
2000 '01 '02 '03 '04 '05 '06 '07 '08 '09 '10 '11 '12 '13 '14 '15 '16 '17 '18 '19 '20
Total industrial productionpercent
Quarterly change (saar)
Percent change from a year earlier Q3-2019
Blue Chip IP Forecast
Actual Forecast 2018 2019 20204.0 -0.6 1.1
Industrial production is forecast to fallthis year and increase at a slow pace in 2020

0
2
4
6
8
10
12
14
16
18
2007 2008 2009 2010 2011 2012 2013 2014 2015 2016 2017 2018 2019
Credit spreads between Corporate High Yield and Corporate Aaapercent
Credit spreads between Corporate High Yield securitiesand Corporate Aaa securities have recently moved higher

-3
-2
-1
0
1
2
3
Yield curve - 10-year Treasury note yield minus2-year Treasury bill yieldpercent
1980 '85 '90 '95 '00 '05 '10 '15
The 10-year vs. 2-year Treasury yield curve is very flat

-1
0
1
2
3
Yield curve - 10-year Treasury note yield minus2-year Treasury bill yieldpercent
2000 '02 '04 '06 '08 '10 '12 '14 '16 '18
The 10-year vs. 2-year Treasury yield curve is very flat

-2
-1
0
1
2
3
4
5
Yield curve - 10-year Treasury note yield minus3-month Treasury bill yieldpercent
1980 '85 '90 '95 '00 '05 '10 '15
The 10-year vs. 3-month Treasury yield curvewas slightly inverted

-1
0
1
2
3
4
Yield curve - 10-year Treasury note yield minus3-month Treasury bill yieldpercent
2000 '02 '04 '06 '08 '10 '12 '14 '16 '18
The 10-year vs. 3-month Treasury yield curvewas slightly inverted

-1
0
1
2
3
4
2000 '01 '02 '03 '04 '05 '06 '07 '08 '09 '10 '11 '12 '13 '14 '15 '16 '17 '18 '19 '20
10-year T-Note to 3-month T-Bill spreadpercent
Q3 -2019
percent
Blue Chip Forecast
Blue Chip expects the yield curve to remain inverted throughthe end of the year and then begin to steepen next year

0
1
2
3
4
5
6
7
8
9
1990 '92 '94 '96 '98 '00 '02 '04 '06 '08 '10 '12 '14 '16 '18
Fed Funds ratepercent
The Federal Reserve reduced the Federal Funds rateby 25 basis points in July and
another 25 basis points in September
0
1
2
3
4
5
6
7
8
9
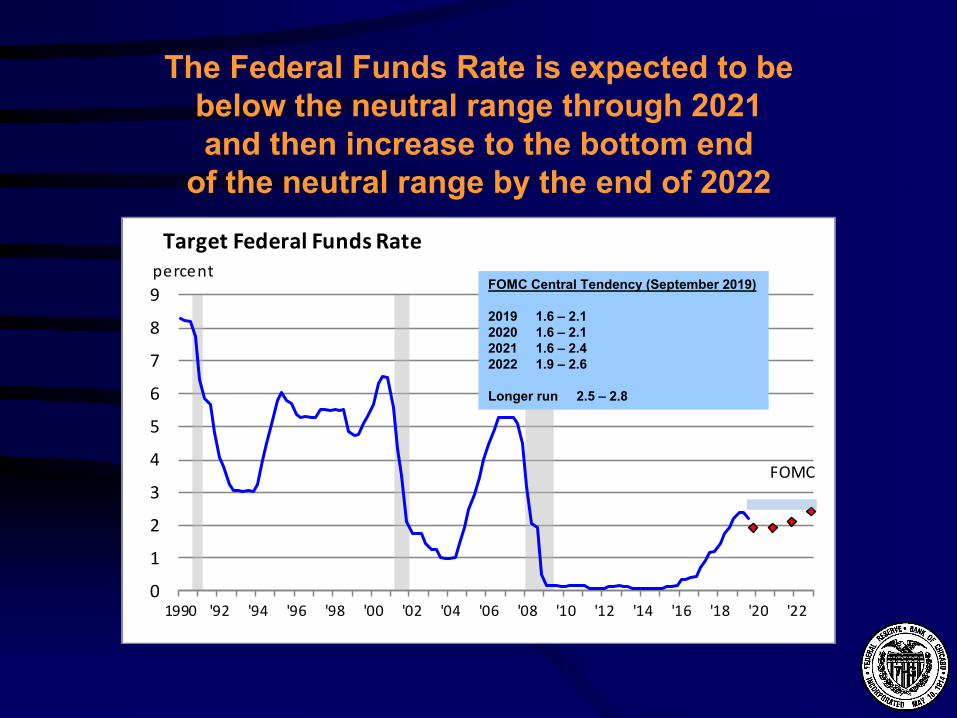
1990 '92 '94 '96 '98 '00 '02 '04 '06 '08 '10 '12 '14 '16 '18 '20 '22
Target Federal Funds Ratepercent
FOMC
The Federal Funds Rate is expected to bebelow the neutral range through 2021and then increase to the bottom end
of the neutral range by the end of 2022
FOMC Central Tendency (September 2019)
2019 1.6 – 2.12020 1.6 – 2.1 2021 1.6 – 2.4 2022 1.9 – 2.6
Longer run 2.5 – 2.8
0
500
1,000
1,500
2,000
2,500
3,000
3,500
4,000
4,500
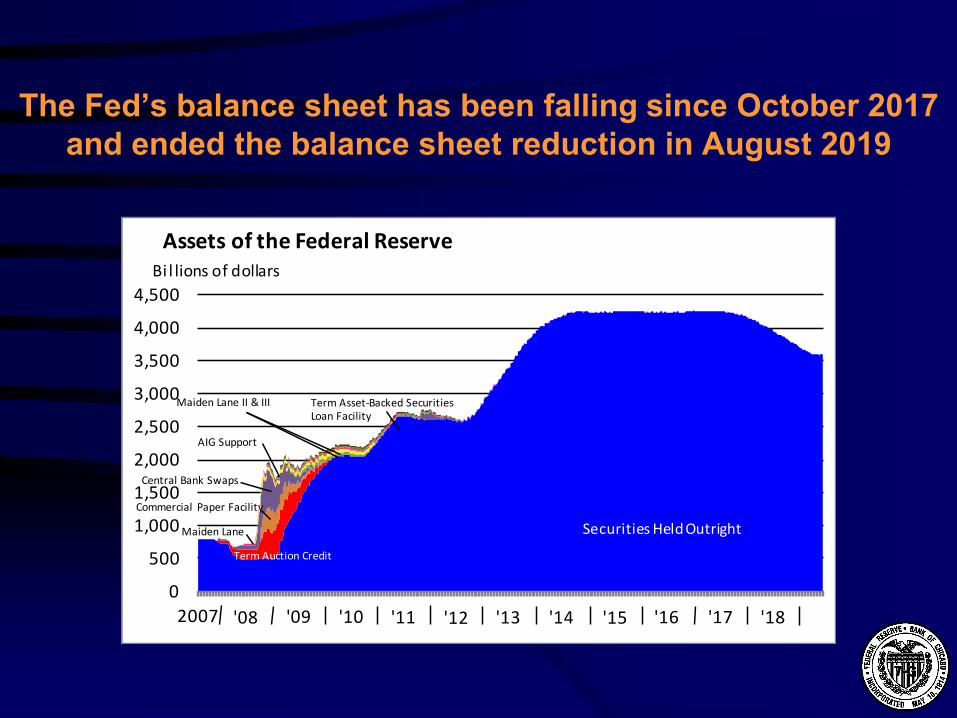
Assets of the Federal ReserveBi l lions of dollars
Term Auction Credit
Securities Held Outright
Central Bank Swaps
Maiden Lane II & III
Commercial Paper Facility
2007 '08 '09
Term Asset-Backed SecuritiesLoan Facility
AIG Support
Maiden Lane
'10 '11 '12 '13 '14 '15 '16 '17 '18
The Fed’s balance sheet has been falling since October 2017and ended the balance sheet reduction in August 2019

•The outlook is for the U.S. economy to expand at a pace justabove trend in 2019 and close to trend in 2020, 2021 and 2022
Summary
•Employment is expected to rise moderately with theunemployment rate remaining very low
•Inflation is forecast be below the Fed’s inflation target this yearand close to it in 2020, 2021 and 2022
•Vehicle sales are anticipated to edge lower this year and in 2020
•Manufacturing output is expected to decrease this yearand then increase at a slow pace in 2020
•Housing is predicted to improve at a modest pace

www.chicagofed.org www.federalreserve.gov
Related Documents