U.S. Department of the Interior U.S. Geological Survey Characterizing the Landscape for Water- Quality Analysis Methods and implementation 2006 National Monitoring Conference, San Jose, CA

U.S. Department of the Interior U.S. Geological Survey Characterizing the Landscape for Water-Quality Analysis Methods and implementation 2006 National.
Dec 21, 2015
Welcome message from author
This document is posted to help you gain knowledge. Please leave a comment to let me know what you think about it! Share it to your friends and learn new things together.
Transcript
U.S. Department of the InteriorU.S. Geological Survey
Characterizing the Landscape for Water-Quality Analysis
Methods and implementation
2006 National Monitoring Conference,
San Jose, CA

Authors
NAWQA National SynthesisCurtis Price ([email protected])
Naomi Nakagaki
Kerie Hitt
Gail Thelin
High Plains Ground Water StudySharon Qi
Overview
About NAWQA Using GIS to describe the landscape Area-weighted transfer techniques Summary

NAWQA Study Units (“Cycle 1”)
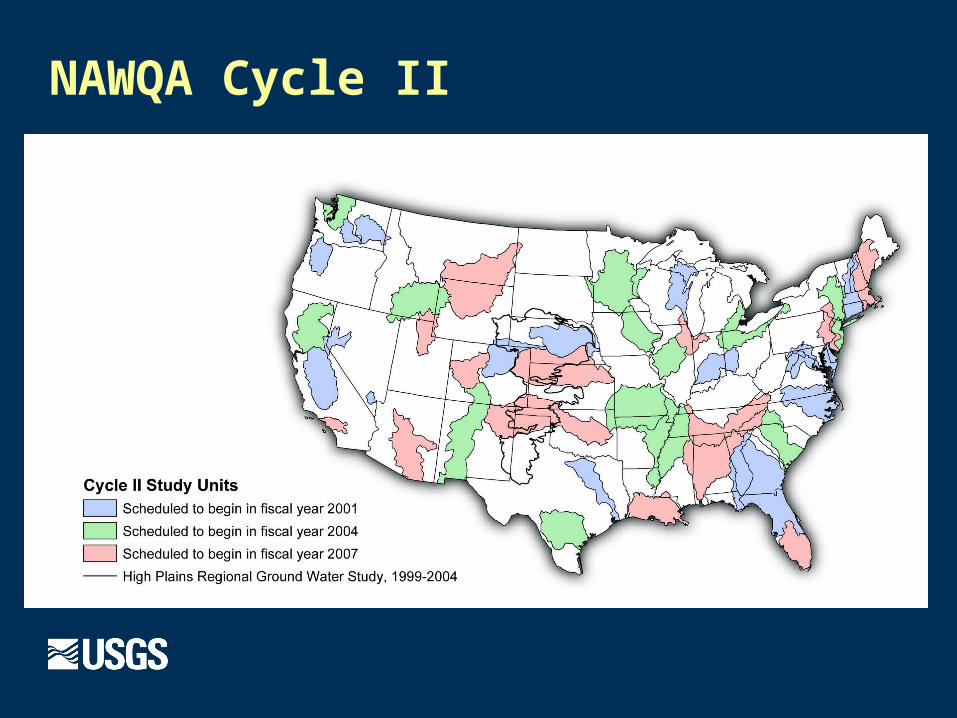
NAWQA Cycle II


http://water.usgs.gov/nawqa/data
Ancillary data
Summarizes the landscape
Used to Put water quality data in context Develop statistical models
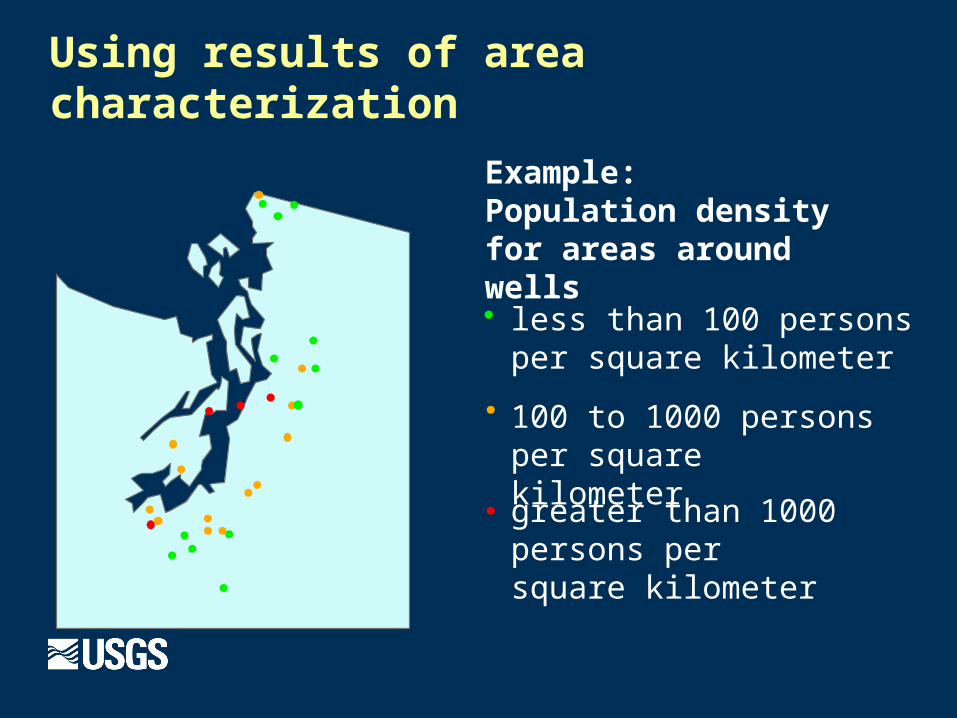
Using results of area characterization
Example: Population density for areas around wells
less than 100 persons per square kilometer
100 to 1000 persons per square kilometer
greater than 1000 persons per square kilometer
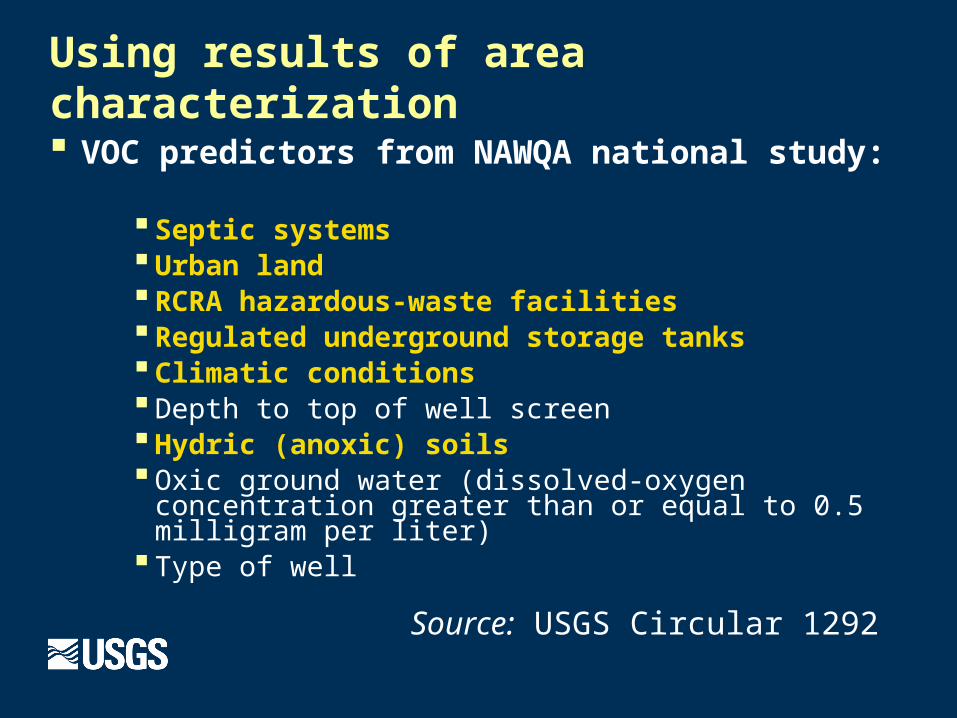
Using results of area characterization
VOC predictors from NAWQA national study:
Septic systems Urban land RCRA hazardous-waste facilities Regulated underground storage tanks Climatic conditions Depth to top of well screen Hydric (anoxic) soils Oxic ground water (dissolved-oxygen concentration
greater than or equal to 0.5 milligram per liter) Type of well
Source: USGS Circular 1292
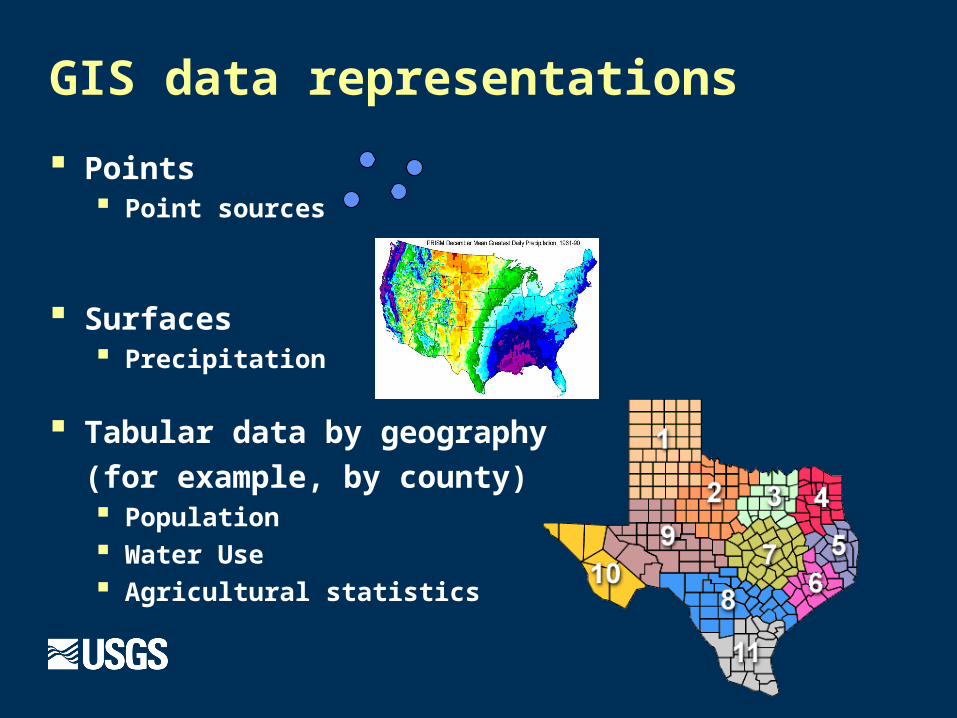
GIS data representations
Points Point sources
Surfaces Precipitation
Tabular data by geography
(for example, by county) Population Water Use Agricultural statistics

One theme (land cover), different representations
categories(areas)
percentages
(grid cells)

Area characterization
Well buffers, well recharge areas
Aquifer areas
Drainage basins
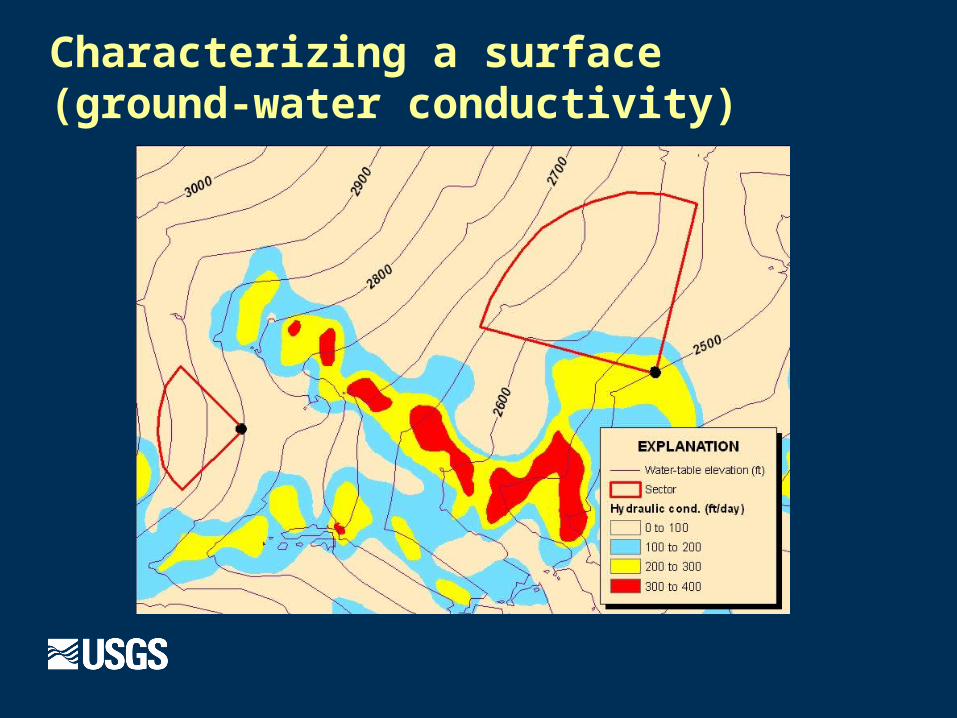
Characterizing a surface (ground-water conductivity)
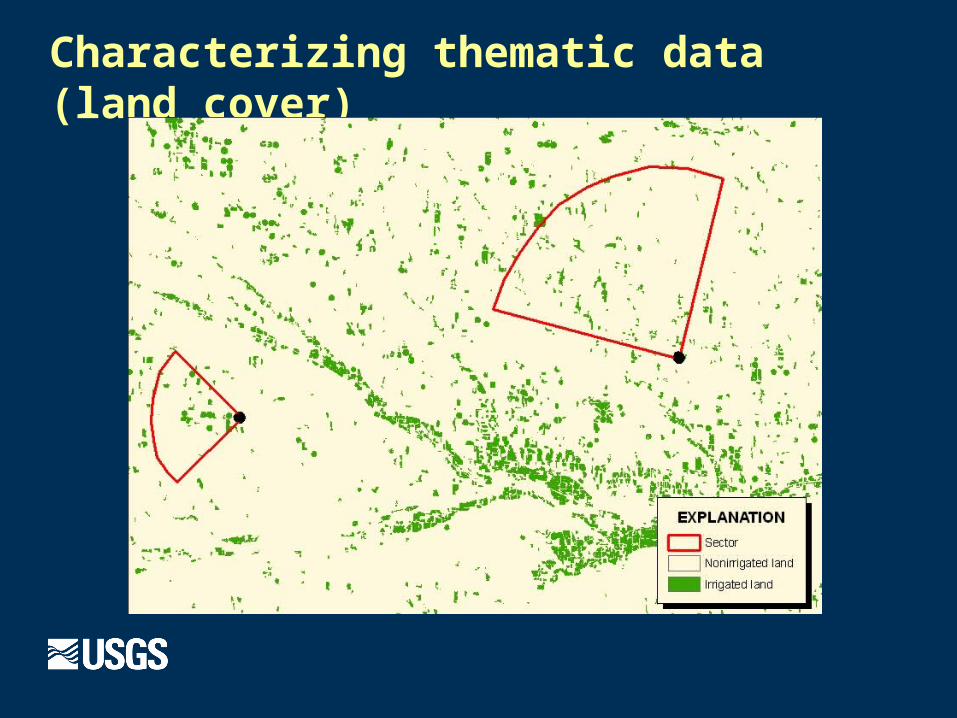
Characterizing thematic data (land cover)

Geocoded data: Census
Data linked to polygons from block to national level
Census data values required for different polygons (drainage basins) that do not coincide with Census polygons
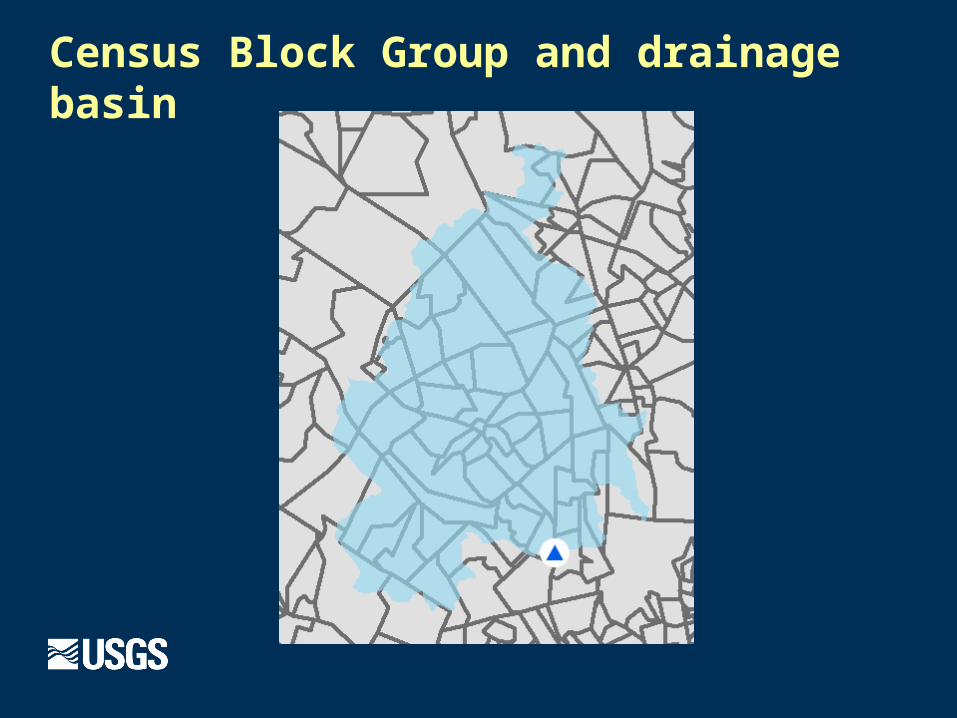
Census Block Group and drainage basin

Attribute transfer methods
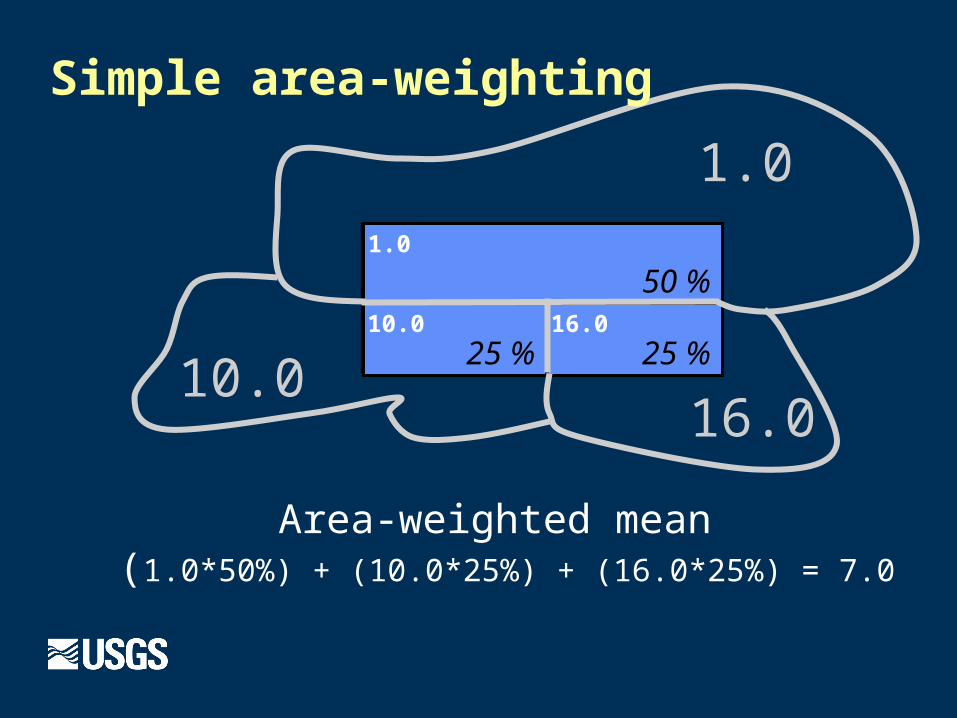
Simple Area-weighted transfer Transfer of data values weighted by area Assumes values evenly distributed
50 %
25 %25 %
1.0
16.010.0
Simple area-weighting
Area-weighted mean(1.0*50%) + (10.0*25%) + (16.0*25%) = 7.0
10.016.0
1.0

Census Block Group and drainage basin
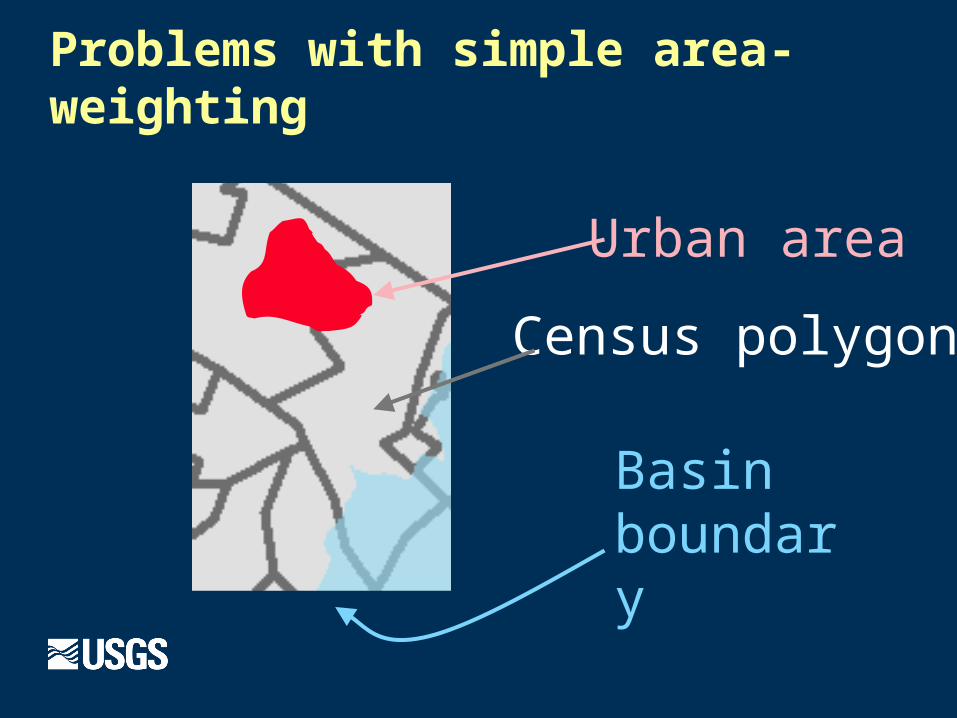
Problems with simple area-weighting
Urban area
Basin boundary
Census polygon
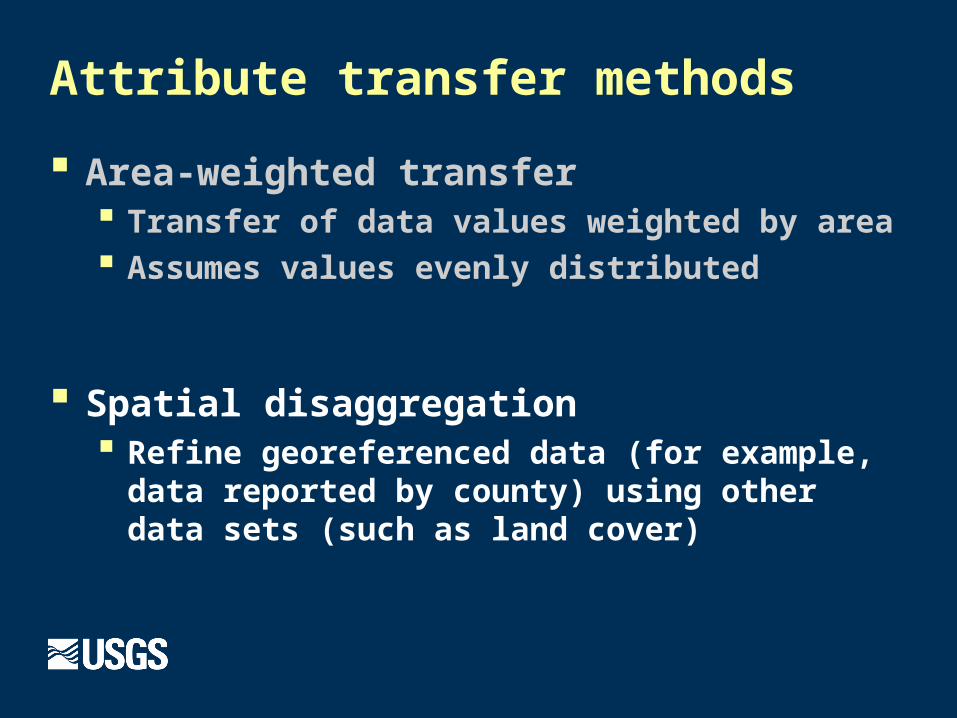
Attribute transfer methods
Area-weighted transfer Transfer of data values weighted by area Assumes values evenly distributed
Spatial disaggregation Refine georeferenced data (for example, data
reported by county) using other data sets (such as land cover)
Summary
Land characterization using GIS has played a key role in NAWQA design, site selection, and analysis of sampling results
Carefully selecting which data sets to use and how to represent them in the GIS is important
Simple area-weighted transfer methods work well, but assume that values are constant in space within a polygon (in this example, Census Block Group)
Related Documents


