Construction costs will remain high despite the decline in oil prices. United States Construction Perspective Q1 2015

U.S. construction trends and outlook (Q1 2015)
Jul 17, 2015
Welcome message from author
This document is posted to help you gain knowledge. Please leave a comment to let me know what you think about it! Share it to your friends and learn new things together.
Transcript
Construction costs will remain high despite the decline in oil prices.
United States Construction
Perspective
Q1 2015

In late 2014, oil prices experienced significant declines due to oversaturated supply and a slowdown in global demand. Prices have since stabilized but at depressed levels. Materials prices were projected to drop in correlation with oil, but high demand for most major construction inputs has kept prices up overall.
Low gas prices typically drive an uptick in demand for retail, e-commerce, and industrial real estate. However, shipping costs remain high due to a decline in available labor, negating much of the oil price savings.
In the office market, the development pipeline continues to expand alongside rents, which increased 3.1 percent this quarter. U.S. markets are set to deliver more than 80 million square feet currently under development. Energy-heavy markets such as Houston are exceptions to this trend, as declining demand stifles the need for new space.
We expect strong demand for most property types and costly construction labor will counter any price relief low oil prices has on materials for the foreseeable future.

National economic trends

$0
$20
$40
$60
$80
$100
$120
July
August
Septem
ber
October
Novem
ber
Decem
ber
January
February
March
April
Crude Spot Price, Cushing OK
-52.2%
Crude oil is selling for half of its June 2014 value, as an
oversupply of crude hits the market.
4
($ per
barrel)
Source: JLL Research, U.S. Energy Information Administration

GDP growth slowed in 2015, despite positive expectations from
economists.
5
-15.0%
-10.0%
-5.0%
0.0%
5.0%
10.0%Overall real GDP growth
Construction component growth
Construction GDP has
increased more quickly than
overall GDP since 2012.
Overall GDP growth in Q1 2015,
far below expectations. 0.2%
Source: JLL Research, Bureau of Economic Activity
(Q-o
-Q c
hang
e)

122000
124000
126000
128000
130000
132000
134000
136000
138000
140000
142000
144000
4800
5000
5200
5400
5600
5800
6000
6200
6400
6600
2010 2011 2012 2013 2014 2015
Construction
Overall Employment
The steady expansion in construction employment since 2012
comes to an end as labor force participation declines.
6
Source: JLL Research, Bureau of Labor Statistics
Con
stru
ctio
n em
ploy
men
t (n
umbe
r of
em
ploy
ees)
O
verall employm
ent (number of em
ployees)
Both construction unemployment and
overall unemployment have seen
approximately 0.0 percent growth in 2015,
as labor participation rates continue to
decline.
0.0
5.0
10.0
15.0
20.0
25.0
30.0
2008 2009 2010 2011 2012 2013 2014 2015
Construction
Overall
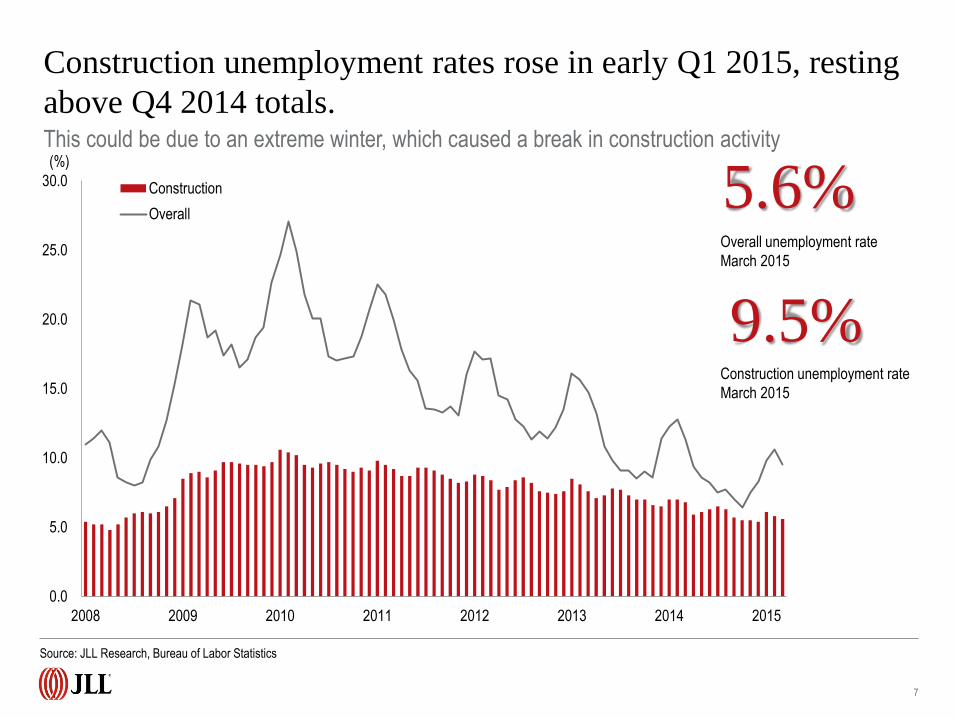
Construction unemployment rates rose in early Q1 2015, resting
above Q4 2014 totals.
7
This could be due to an extreme winter, which caused a break in construction activity
Source: JLL Research, Bureau of Labor Statistics
5.6% Overall unemployment rate
March 2015
9.5% Construction unemployment rate
March 2015
(%)

The Architecture Billings Index began to grow again in March, as
more projects enter the design phase in spring 2015.
8
The ABI serves as a leading economic indicator that leads nonresidential construction activity by approximately 11 months
20
25
30
35
40
45
50
55
60
ABI was 51.7 in
March, as the ABI
rebounds from early
2015 declines.
Source: JLL Research, American Institute of Architects, McGraw-Hill Dodge

The Construction Backlog Index dipped slightly in Q4 2014.
9
Despite this decline, CBI rests 4.4 percent higher than Q4 2013, meaning 2015 will be another
strong year for construction starts.
Source: JLL Research, Associated Builders and Contractors
-21.2% q-o-q.
3.5% q-o-q. C
BI
0.1% q-o-q. C
BI
1.3% q-o-q. C
BI
CB
I
National average
construction backlog
8.7mos This decline can be attributed to
issues in West Coast ports, related
economic uncertainty, and a sharp
decline in public construction.

Cost trends: Labor and materials

The value of nonresidential construction is rebounding since
2011 lows, as demand for new construction grows.
11
$0
$50,000
$100,000
$150,000
$200,000
$250,000
$300,000
$350,000
$400,000
$450,000
2004 2005 2006 2007 2008 2009 2010 2011 2012 2013 2014r 2015r
Value construction put-in-place February y-o-y
Source: JLL Research, U.S. Census
($M)

Construction spend in most major sectors is increasing, though
healthcare spend continues to decline.
12
Source: JLL Research, U.S. Census
Total spend Q1 2015 Percent change year-over-year
Education $74.7 billion 4.6 percent
Manufacturing $60.9 billion 37.9 percent
Commercial $59.7 billion 13.5 percent
Office $48.9 billion 13.5 percent
Healthcare $37.3 billion - 4.1 percent*
Amusement/Recreation $18.3 billion 22.5 percent
* Decline due to decrease in public sector spending, increase in hospital consolidations, and more hospital closings

Construction costs are continuing to grow, despite the slowdown in
energy prices.
13
Source: JLL Research, ENR
The continued growth of labor costs in most major markets enhances overall construction cost
Com
mon labor index: U
nion wage plus fringe benefits
CC
I: 20
-city
ave
rage
of c
omm
on la
bor
rate
s pl
us m
ater
ial i
nput
s
0
5000
10000
15000
20000
25000
30000
0
2000
4000
6000
8000
10000
12000
2004 2005 2006 2007 2008 2009 2010 2011 2012 2013 2014 2015 2016 2017 2018 2019 2020
Nat'l CCI
Materials Index
Labor Index

Costs have increased in all major markets, with the biggest cost
growth in San Francisco: 6.0 percent year-over-year.
14
0
5000
10000
15000
20000
25000
Boston Chicago Denver Los Angeles New York Phoenix Portland SanFrancisco
Seattle Washington,DC
2014
2015
Cost of construction in major markets
Source: JLL Research, RLB
RLB Comparative Cost Index
tracks the bid cost of
construction, including: labor,
materials, contractor, and
overhead costs.

0
5000
10000
15000
20000
25000
30000
35000
40000 ENR labor cost index by city
Want to save money on construction costs? Build in the South.
15
Cities with more land availability and lower labor costs maintain lower overall prices
Labor expenditures are driving the growth in
construction costs: Dallas, New Orleans, and
Atlanta have the lowest labor costs, as well
as the lowest cost overall.
Com
mon
Lab
or In
dex
The Common Labor Index is the labor component of ENR’s Construction Cost Index and tracks the union wage, plus fringe benefits, for laborers.
Source: JLL Research, ENR

Material Price Index indicates continued growth in costs…
16
Source: JLL Research, ENR
ENR Materials Price Index tracks weight price movement of structural steel, portland cement, and 2x4 lumber.
Wei
ghte
d pr
ice
mov
emen
t of s
teel
, cem
ent,
and
lum
ber
1500
1700
1900
2100
2300
2500
2700
2900
3100
3300
3500
2006 2007 2008 2009 2010 2011 2012 2013 2014 2015 2016 2017 2018 2019 2020
Materials Index
Materials costs grew just
1.5% from 2014 and 2015.
… with some notable exceptions, driven by a range of external
factors.
17
Material March prices: percent change Y-o-Y
Aluminum Sheet -1.1%
Asphalt Paving 1.5%
Cement 1.5%
Concrete Block 4.8%
Copper Pipe -9.9%
Diesel Fuel -40.7%
Fabricated Steel 1.1%
Gypsum Board 22.6%
Lumber/Softwood 4.0%
Plywood 2.1%
PVC Water Pipe 2.8%
Ready-Mix Concrete -0.2%
Sheet Metal 2.2%
• Overproduction of copper and steel has created a glut
on the market, with supply outstripping demand,
driving down price growth.
• Cement is posting historically high price increases,
thanks to increasing demand.
• Plywood and gypsum wallboard are also growing, as
demand for these materials grows. This demand
expansion is due to job market growth, consumer
confidence, and an increase in construction projects.
Source: JLL Research, ENR
-0.4% price decline in March 2015

Decline in diesel fuel cost will not decrease the overall value of
construction, but some sectors will contract as a result.
18
Source: JLL Research, ENR
-45.0%
-40.0%
-35.0%
-30.0%
-25.0%
-20.0%
-15.0%
-10.0%
-5.0%
0.0%
July August September October November December January February
Annual percent change in diesel fuel prices: Monthly 2014-2015
Energy price declines will
disproportionately affect manufacturing:
the sector may decline 25 percent over
the next year.
10% Projected increase of
construction put in place
value, despite downturn
in prices.

Construction starts and put-in- place

Q1 2015 office starts are down from Q1 2014, though still well
above 2012 levels, indicating demand for new stock is still high.
20
Source: JLL Research, CoStar, McGraw Hill
13.4 m.s.f. 22.2 m.s.f. 20.8 m.s.f.
Q1 2012
11.6 m.s.f.
Q1 2013 Q1 2014 Q1 2015
21
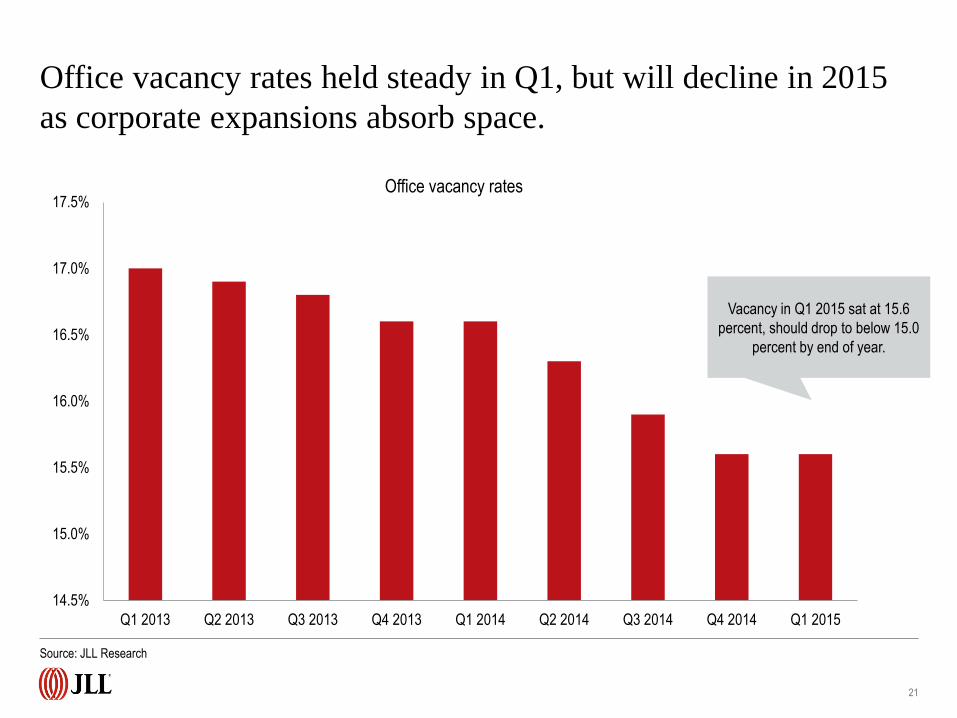
14.5%
15.0%
15.5%
16.0%
16.5%
17.0%
17.5%
Q1 2013 Q2 2013 Q3 2013 Q4 2013 Q1 2014 Q2 2014 Q3 2014 Q4 2014 Q1 2015
Office vacancy rates
Vacancy in Q1 2015 sat at 15.6
percent, should drop to below 15.0
percent by end of year.
Source: JLL Research
Office vacancy rates held steady in Q1, but will decline in 2015
as corporate expansions absorb space.

50,000
100,000
150,000
200,000
250,000
300,000
350,000
400,000
450,000 Value of construction put-in-place
The dollar value of construction put-in-place has declined in Q1
2015, though it is still substantially higher than pre-recession
lows.
22
Source: JLL Research, Census Bureau
($M)

Office and industrial construction continue to rise, despite oil
prices slowing the building surge in Houston.
23
Source: JLL Research, CoStar Group
Industrial construction
Retail construction
122.8 m.s.f. under
construction
Q1 2014
Q1 2015
Q1 2014
Q1 2015 157.7 m.s.f under
construction
57.2 m.s.f. under
construction
43.0 m.s.f. under
construction
Q1 2014
Q1 2015
Office construction
Q1 2014
86.8 m.s.f. under
construction
22.2 m.s.f. under
construction

Office completions in 2015 are twice the amount of Q1 2014, as
2014’s starts are delivered to the market.
24
Source: JLL Research
0
20,000,000
40,000,000
60,000,000
80,000,000
100,000,000
120,000,000
140,000,000
2000 2001 2002 2003 2004 2005 2006 2007 2008 2009 2010 2011 2012 2013 2014 Q12015
Ann
ual c
ompl
etio
ns (
s.f.)
Q1 2015 Completion
totals: 8.7 m.s.f. vs.
Q1 2014: 4.3 m.s.f.

The amount of vacant sublease space nationally has declined, as
firms begin scooping up empty, prime subleases.
25
Source: JLL Research
30,000,000
40,000,000
50,000,000
60,000,000
70,000,000
80,000,000
90,000,000
100,000,000
2009 2010 2011 2012 2013 2014 2015
Sub
leas
e sp
ace
(s.f.
)
Despite the decline nationally, energy-rich
markets have seen a huge jump in sublease
space available. Houston has seen 3.0 M.S.F.
of new sublease space enter the market since
January 2015.
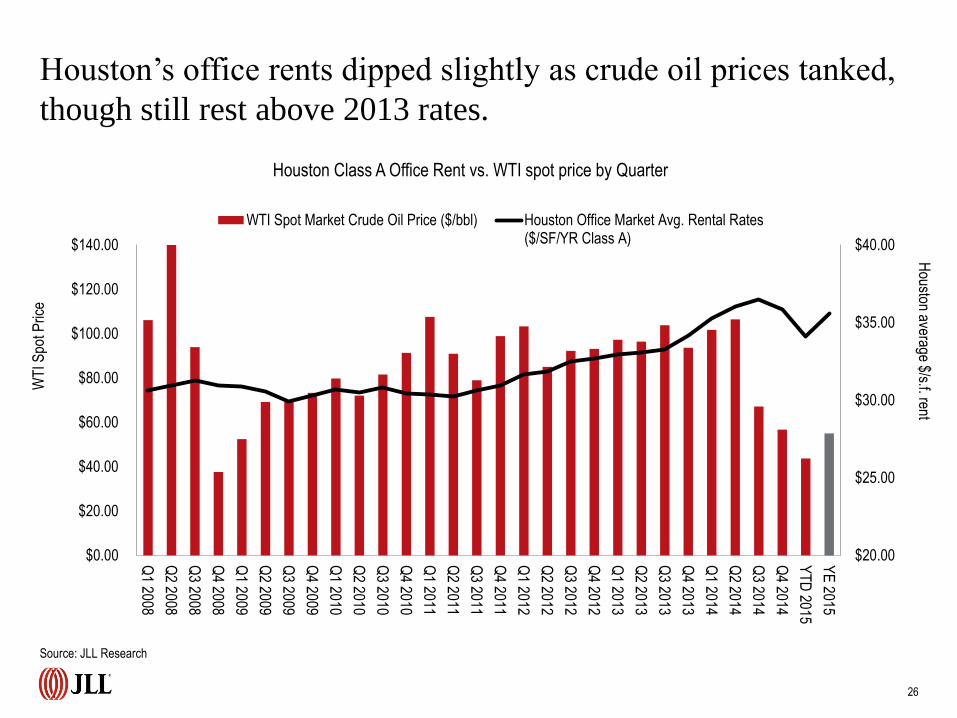
Houston’s office rents dipped slightly as crude oil prices tanked,
though still rest above 2013 rates.
26
Source: JLL Research
$20.00
$25.00
$30.00
$35.00
$40.00
$0.00
$20.00
$40.00
$60.00
$80.00
$100.00
$120.00
$140.00
Q1 2008
Q2 2008
Q3 2008
Q4 2008
Q1 2009
Q2 2009
Q3 2009
Q4 2009
Q1 2010
Q2 2010
Q3 2010
Q4 2010
Q1 2011
Q2 2011
Q3 2011
Q4 2011
Q1 2012
Q2 2012
Q3 2012
Q4 2012
Q1 2013
Q2 2013
Q3 2013
Q4 2013
Q1 2014
Q2 2014
Q3 2014
Q4 2014
YT
D 2015
YE
2015
Houston average $/s.f. rent
WT
I Spo
t Pric
e
Houston Class A Office Rent vs. WTI spot price by Quarter
WTI Spot Market Crude Oil Price ($/bbl) Houston Office Market Avg. Rental Rates($/SF/YR Class A)
Portland, Seattle, and Washington DC have the most uniform and
lowest office construction costs of all markets.
27
Source: JLL Research, Rider Levett Bucknell
$0
$50
$100
$150
$200
$250
$300
$350
$400
Boston Chicago Denver LosAngeles
New York Phoenix Portland SanFrancisco
Seattle WashingtonDC
($ p.s.f.) Range of office construction costs in major markets
Phoenix has the lowest
construction cost thanks to
available land and low-cost
labor.

5.08 M.S.F Boston
Office construction is seeing rapid growth nationally, particularly in
the Southeast and Northwest, while it has slowed in Houston and the
Northeast.
28
Source: JLL Research
7.14 M.S.F. Dallas
6.91 M.S.F. Seattle
2.07 M.S.F.
Portland
3.13 M.S.F San
Francisco
1.62 M.S.F.
San Diego
3.66 M.S.F.
Phoenix
2.34 M.S.F. Denver
12.59 M.S.F.
Houston
3.13 M.S.F.
Chicago
1.57 M.S.F.
Charlotte
7.2 M.S.F
New York City
2.13 M.S.F.
DC
3.84 M.S.F.
Philadelphi
a
1.62 M.S.F. Atlanta
The dollar value for
construction starts in
Georgia is up 13 percent.
Q1 2015 under construction

0
50,000,000
100,000,000
150,000,000
200,000,000
250,000,000
300,000,000
350,000,000
400,000,000
450,000,000
2000 2001 2002 2003 2004 2005 2006 2007 2008 2009 2010 2011 2012 2013 2014 Q12015
Industrial completions in Q1 2015 grew 27 percent from Q4
2014.
29
Source: JLL Research, CoStar
Ann
ual c
ompl
etio
ns
(s.f)

$0
$2
$4
$6
$8
$10
$12
$14
$16
$18
$20
Consumer
Confidence Index
30
Source: JLL Research, US Census
Consumer confidence is increasing as oil prices decline, spurring
firms to invest in growing warehouse and e-commerce space..
($B) U.S. total warehouse construction put-in-place
2.5
points

Industrial construction costs remain lower than office.
31
Source: JLL Research, Rider Levett Bucknell
Highest cost stock is in Los Angeles and San Francisco, mainly due to land and labor costs
$0.0
$20.0
$40.0
$60.0
$80.0
$100.0
$120.0
$140.0
$160.0
$180.0
Boston Chicago Denver LosAngeles
New York Phoenix Portland SanFrancisco
Seattle WashingtonDC
($ p.s.f.) Range of warehouse construction costs in major markets
20.1 M.S.F. Inland Empire
2.6 M.S.F.
Phoenix
3.3 M.S.F.
East Bay
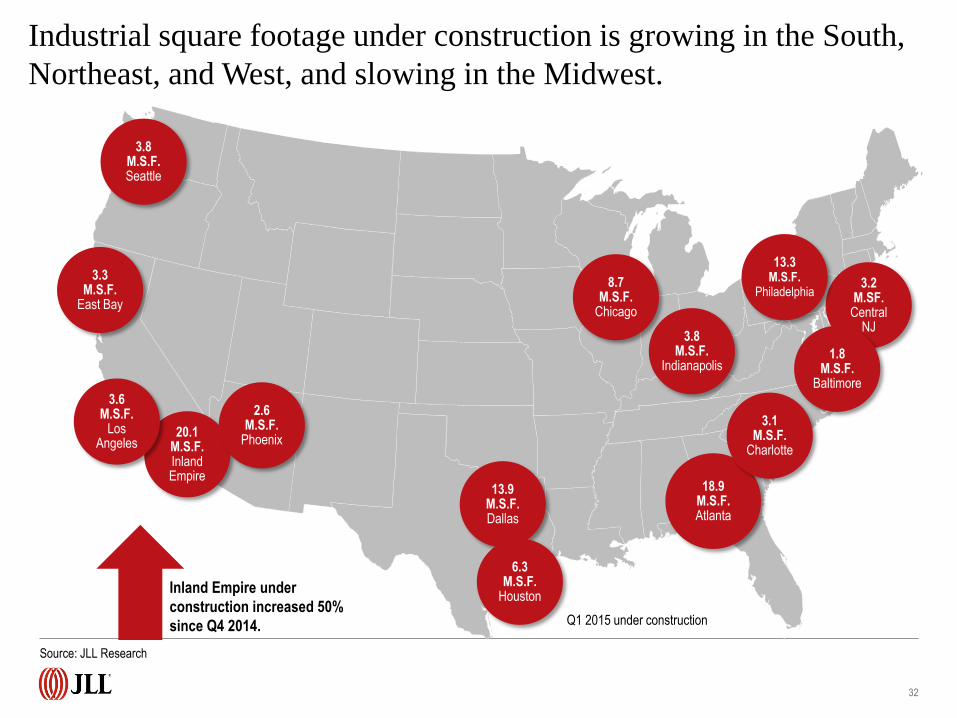
Industrial square footage under construction is growing in the South,
Northeast, and West, and slowing in the Midwest.
32
Source: JLL Research
13.9 M.S.F. Dallas
3.8 M.S.F. Seattle
3.6 M.S.F.
Los Angeles
3.2 M.SF. Central
NJ 3.8
M.S.F. Indianapolis
6.3 M.S.F.
Houston
8.7 M.S.F.
Chicago
1.8 M.S.F.
Baltimore
18.9 M.S.F. Atlanta
3.1 M.S.F.
Charlotte
13.3 M.S.F.
Philadelphia
Inland Empire under
construction increased 50%
since Q4 2014. Q1 2015 under construction
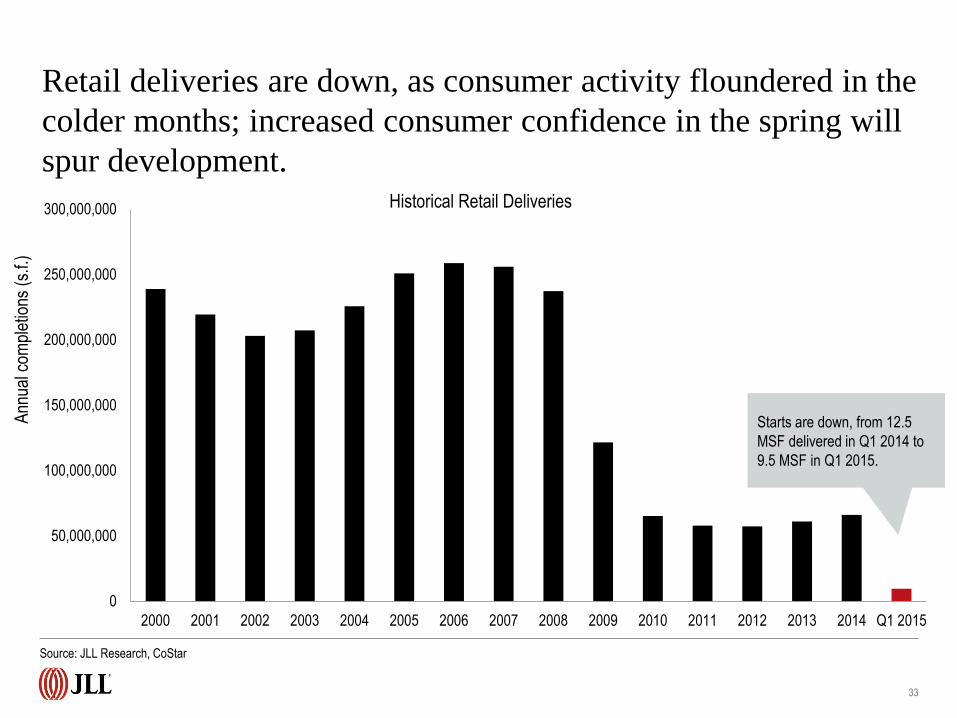
Retail deliveries are down, as consumer activity floundered in the
colder months; increased consumer confidence in the spring will
spur development.
33
Source: JLL Research, CoStar
Ann
ual c
ompl
etio
ns (
s.f.)
0
50,000,000
100,000,000
150,000,000
200,000,000
250,000,000
300,000,000
2000 2001 2002 2003 2004 2005 2006 2007 2008 2009 2010 2011 2012 2013 2014 Q1 2015
Historical Retail Deliveries
Starts are down, from 12.5
MSF delivered in Q1 2014 to
9.5 MSF in Q1 2015.

1,150
1,200
1,250
1,300
1,350
1,400
1,450
1,500
$18
$19
$19
$20
$20
$21
$21
$22
$22
$23
$23
2007 2008 2009 2010 2011 2012 2013 2014
Wages Employment
34
Source: JLL Research
Despite lower oil prices a shortage in trucker employment keeps
delivery costs high.
Wages and employment in trucking industry
Ave
rage
hou
rly w
age
Thousands of E
mployees

San Francisco and Los Angeles have the highest-price prime
retail construction cost; Denver remains the lowest cost.
35
Source: JLL Research
$0.0
$50.0
$100.0
$150.0
$200.0
$250.0
$300.0
Boston Chicago Denver LosAngeles
New York Phoenix Portland SanFrancisco
Seattle WashingtonDC
($ p.s.f.) Range of retail construction costs in major markets

Significant retail square footage is under construction in the
South, Northeast, and Southern California markets.
36
Retail demand will increase as
consumer confidence grows
across 2015.
Source: JLL Research
3.5 M.S.F. Dallas
0.3 M.S.F. Seattle
0.7 M.S.F. Denver
0.3 M.S.F.
San Francisco
1.6 M.S.F.
Los Angeles
1.0 M.S.F. Orange County
0.5 M.S.F. Atlanta
1.7 M.S.F.
Houston
2.1 M.S.F.
Chicago
0.62 M.S.F. Tampa
1.0 M.S.F.
New York City
1.2 M.S.F.
DC
0.7 M.S.F.
Philadelphia
1.6 M.S.F. Boston
Q1 2015 under construction
Overview and outlook
38
Source: JLL Research
Houston construction will grind to a halt. Sublease vacancy is high and this is creating opportunities for firms to
move into new, premium space. Construction starts declined in this quarter.
San Francisco’s office market is growing and expensive. Vacancy rates have declined almost 1.0 percent since
Q4 2014 as demand for trophy space skyrockets. At the same time, San Francisco has seen the largest growth in
construction costs across Q1.
The Southeast remains a strong market for construction. Markets boast a large amount of available land, along
with relatively cheap labor costs in most states. Charlotte office starts were up from 379,587 square feet in 2014 to
1.6 million square feet in Q1 2015 as companies cash in on the region’s growth.
New York City remains the most expensive market, driven by high labor costs and demand.
Retail starts are up in Seattle, as they remain stagnant across the rest of the country. Retail companies are
optimistic that 2015 will see more growth, thanks to increased consumer confidence.
1.
2.
3.
4.
5.
Key construction markets

39
Source: JLL Research, IBISWorld
Construction costs continue to grow, even as starts begin to slow across most major markets.
Though materials costs are rising overall, supply gluts will drive down prices of major commodities,
including copper and steel. The high cost of concrete will continue to balance out this decline.
Demand from downstream markets will remain strong, despite the dropping oil prices. Corporate profits are
projected to increase 2.6 percent annually to 2020, bolstering demand for new construction.
In some markets, replacement costs are lower than purchase prices, meaning constructing new space is
more cost-effective than renting existing space.
Higher consumer spending, as a result of declining oil prices, increasing employment, and growing consumer
confidence, will bolster retail and e-commerce demand, which will lead to increased construction demand in
these sectors.
The construction industry usually lags overall economic recovery by one to two years; the industry is
still in the early stages of its recovery and will continue to grow in response to overall economic growth.
1.
2.
3.
4.
5.
What’s next for construction?

© Copyright 2015 Jones Lang LaSalle
Thank you
Dana Westgren
Research Analyst- Industry, Project and Development Services
tel +1 312-228-2867
Related Documents