Revised March 10, 2010 U.S.-CHINA ECONOMIC AND SECURITY REVIEW COMMISSION HEARING ON “U.S. DEBT TO CHINA: IMPLICATIONS AND REPERCUSSIONS” FEBRUARY 25, 2010 The U.S.-China Economic Relationship: Shifts and Twists in the Balance of Power Eswar S. Prasad Tolani Senior Professor of Trade Policy, Cornell University Senior Fellow and New Century Chair in International Economics, Brookings Institution Chairmen Wessel and Cleveland, and honorable members of the Commission, thank you for the opportunity to share with you my views on the implications of rising Chinese ownership of U.S. debt for the relationship between the two economies. The lopsided nature of trade and financial flows between the U.S. and China has complicated this relationship, tightening the economic entanglements between the two economies and making them more contentious. The U.S. receives a large volume of low- cost imports from China and has also gotten help in financing a significant part of its budget and current account deficits. China remains quite dependent on U.S. export markets and continues to look to U.S. Treasury bond markets to park a large portion of its rapidly rising stock of foreign exchange reserves. Over the past year, the U.S. has become less dependent on China’s financing of its deficits, particularly as the U.S. private saving rate has gone up and the current account deficit has fallen. Nevertheless, given the sheer scale of the U.S. deficit financing requirement—a budget deficit of about $1.6 trillion in 2010 and prospects of nearly $9 trillion of deficits over the next decade—sentiments in bond and currency markets are fragile. A precipitous action by China to shift aggressively out of U.S. dollar- denominated instruments, or even an announcement of such an intention, could act as a trigger that nervous market sentiments coalesce around, leading to a sharp fall in bond prices and the value of the U.S. dollar. However, such a move would not be without cost for China. Certainly, China would like to tear itself away from the U.S. Treasury market but faces the prospect of a capital loss on its large accumulated stock of holdings (on a mark-to-market, domestic currency basis) if U.S. Treasury bond prices were to fall as a result of a spike in interest rates or if the renminbi were to appreciate in value relative to the U.S. dollar. But the U.S. leaves itself vulnerable as China might well view these costs as worth bearing in order to preserve its national sovereignty or if trade and other economic disputes with the U.S. came to a head. Indeed, I will argue that the direct costs could in fact be rather modest from the Chinese perspective.

Welcome message from author
This document is posted to help you gain knowledge. Please leave a comment to let me know what you think about it! Share it to your friends and learn new things together.
Transcript
Revised March 10, 2010
U.S.-CHINA ECONOMIC AND SECURITY REVIEW COMMISSION
HEARING ON “U.S. DEBT TO CHINA: IMPLICATIONS AND REPERCUSSIONS”
FEBRUARY 25, 2010
The U.S.-China Economic Relationship: Shifts and Twists in the Balance of Power
Eswar S. Prasad
Tolani Senior Professor of Trade Policy, Cornell University
Senior Fellow and New Century Chair in International Economics, Brookings Institution
Chairmen Wessel and Cleveland, and honorable members of the Commission, thank you for the opportunity to share with you my views on the implications of rising Chinese ownership of U.S. debt for the relationship between the two economies. The lopsided nature of trade and financial flows between the U.S. and China has complicated this relationship, tightening the economic entanglements between the two economies and making them more contentious. The U.S. receives a large volume of low-cost imports from China and has also gotten help in financing a significant part of its budget and current account deficits. China remains quite dependent on U.S. export markets and continues to look to U.S. Treasury bond markets to park a large portion of its rapidly rising stock of foreign exchange reserves. Over the past year, the U.S. has become less dependent on China’s financing of its deficits, particularly as the U.S. private saving rate has gone up and the current account deficit has fallen. Nevertheless, given the sheer scale of the U.S. deficit financing requirement—a budget deficit of about $1.6 trillion in 2010 and prospects of nearly $9 trillion of deficits over the next decade—sentiments in bond and currency markets are fragile. A precipitous action by China to shift aggressively out of U.S. dollar-denominated instruments, or even an announcement of such an intention, could act as a trigger that nervous market sentiments coalesce around, leading to a sharp fall in bond prices and the value of the U.S. dollar. However, such a move would not be without cost for China. Certainly, China would like to tear itself away from the U.S. Treasury market but faces the prospect of a capital loss on its large accumulated stock of holdings (on a mark-to-market, domestic currency basis) if U.S. Treasury bond prices were to fall as a result of a spike in interest rates or if the renminbi were to appreciate in value relative to the U.S. dollar. But the U.S. leaves itself vulnerable as China might well view these costs as worth bearing in order to preserve its national sovereignty or if trade and other economic disputes with the U.S. came to a head. Indeed, I will argue that the direct costs could in fact be rather modest from the Chinese perspective.
2
The prospect of economic and political disputes ratcheting up has been elevated by an increasing imbalance in this relationship. For instance, in recent months, China has aggressively sought to shift the narrative about the financial crisis and its aftermath by arguing that global current account imbalances had little or nothing to do with the crisis. Moreover, even as the world economy is recovering, China has argued that it is loose U.S. monetary policy alone that may be fueling asset price bubbles around the world. Whatever the merits of these arguments, the forcefulness with which Chinese leaders have put forward these narratives indicates their strong perception that the balance in the bilateral relationship has shifted decisively in their favor. This assertive tone is likely to continue as China’s economy becomes larger and its influence both in the Asian region and abroad becomes more pervasive. In fact, the bargaining strengths of the two countries are finely balanced. But the changing perceptions set up a dangerous game of chicken that could spin out of control if unrealistic expectations and the desire to pander to domestic audiences trumps rational collective policymaking in one or both countries. In my testimony, I will lay out some key facets of this complicated bilateral relationship, present my prognosis for how this relationship is likely to evolve, and then discuss how to manage some of the potentially contentious aspects of this relationship. Trade and Financial Dependence between the Two Economies1 Trade between the two economies has continued to increase in volume and the U.S. remains one of China’s major export markets. Chinese exports to the U.S. rose from $100 billion in 2000 to $296 billion in 2009, while imports rose from $16 billion to $70 billion. A central question is whether rising volumes of trade between the two economies have made them more important as mutual trading partners. Interestingly, exports to the U.S. accounted for a relatively stable share of about 21 percent of China’s overall exports from 1998 to 2006 (Figure 1). During 2007-2009, the share of China’s exports going to the U.S. fell to about 18 percent. The share of U.S. exports going to China has risen gradually over the years but is still under 5 percent. These numbers probably understate the true importance of China’s dependence on the U.S. export market. In terms of sheer volume, U.S. imports still account for a significant share of world final consumption demand. Moreover, a great deal of intra-Asian trade is the result of proliferation of cross-country supply chains facilitated by falling costs of transportation and logistics. IMF analysis suggests that about one-third of the value added component of exports from Asia is still accounted for by the U.S. Thus, a slowdown in U.S. demand could lead to slower growth in other economies that export large quantities to the U.S. and thereby have indirect knock-on effects on Chinese export growth to those economies as well.
1 This section and the next one draw on Eswar Prasad and Grace Gu, 2009, “An Awkward Dance: China and the United States,” Brookings Institution Policy Note.

3
As a source of U.S. imports, China’s share has increased steadily, climbing to 15 percent of total U.S. imports by 2009. China’s dependence on U.S. imports, by contrast, has fallen over time, with imports from the U.S. accounting for about 7 percent of China’s imports since the mid-2000s. Many of the thorny issues in the bilateral relationship between these two countries can be traced to the evolution of the rising bilateral U.S. trade deficit with China. This deficit rose from about $84 billion in 2000 to nearly $227 billion in 2009 (about 1.6 percent of U.S. GDP). In 2009, the deficit with China amounted to nearly two-thirds of the overall U.S. trade deficit of $365 billion, compared to about one-third in 2008 (see Figure 2). The U.S. current account deficit, which had hit $800 billion in 2006, declined slightly in 2007-08. The crisis-induced recession in the U.S. has shrunk the deficit to $370 billion in 2009. China’s current account surplus fell to $284 billion in 2009 (Table 1). But, as discussed below, it is likely that, as the U.S. and global economic recoveries become entrenched, structural forces will again lead to an expansion of the U.S. current account deficit and China’s current account surplus. The IMF, for instance, forecasts that the U.S. current account deficit will rise to about $400 billion in 2011 while China’s current account surplus could top $500 billion. China’s nominal exchange relative to the dollar was flat for a decade until July 2005, when there was a step appreciation of 2 percent of the renminbi (see Figure 3). Over the next three years, the renminbi racked up a cumulative nominal appreciation of 18 percent against the dollar and a slightly lower appreciation in real effective terms. However, since July 2008, the renminbi has remained tightly pegged to the dollar, riding up with the U.S. dollar as it strengthened due to the safe-haven effect during the global financial crisis and down with the U.S. dollar since March 2009, when that effect began to wear off. This has reversed some of the appreciation of the trade-weighted measure of China’s real effective exchange rate, which is now up about 14 percent relative to its level in July 2005. Chinese currency policy, which involves heavy intervention in the foreign exchange market to prevent the renminbi’s appreciation against the U.S. dollar, has resulted in a rapid rise in foreign exchange reserves (see Figure 4). After a tiny net increase in the first quarter of 2009, reserve accumulation picked up in pace and remained strong for the remainder of the year. At the end of 2009, China’s total stock of foreign exchange reserves stood at $2.4 trillion. China’s international investment position has improved steadily to a net asset position of $1.5 trillion at the end of 2008 (Table 2). The value of China’s foreign assets now far exceeds the value of its external liabilities. Foreign exchange reserves account for about two-thirds of China’s gross foreign assets. It is not easy to estimate the “equilibrium” value of the renminbi—the level it would settle at if China’s capital account were open and there was no government intervention in the foreign exchange market. The fact that the People’s Bank of China has consistently intervened in just one direction and by massive amounts—as indicated by its accumulation of foreign exchange reserves—suggests that the renminbi would appreciate significantly, conditional on capital outflows being relatively restricted, if China’s central bank stopped intervening in the foreign exchange market.
4
Private and Official Financial Flows Financial flows between the two economies have increased but, while private flows remain modest, official flows have become more lopsided over time. The major financial link between the two countries remains Chinese official purchases of dollar-denominated financial assets. Contrary to the popular notion of U.S. firms investing heavily in China, official foreign direct investment (FDI) flows from the U.S. to China peaked at $5.4 billion in 2002 and have remained at a modest level around $3 billion a year since 2005 (Figure 5). This low number could partially be due to American companies’ use of offshore financial centers to channel FDI flows to China. Nevertheless, all available data indicate that most FDI flows to China are from other Asian countries that are integrating their supply chains with China. FDI from China to the U.S. remains very modest. China does not make public the currency denomination or composition of its foreign exchange reserves. U.S. data from the government’s Treasury International Capital System (TIC) database are potentially misleading as they capture the location rather than identity of a purchaser of U.S. instruments. For instance, China’s purchases of Treasury bonds routed through a U.K. bank would be counted as a purchase by a U.K. resident or institution. Notwithstanding these caveats, the TIC data capture some interesting trends. Estimates based on TIC data suggest that Chinese holdings of U.S. Treasury securities amounted to about $895 billion at the end of 2009 (see Table 3, Panel B). More than one-third of China’s holdings of foreign exchange reserves are in U.S. Treasury securities. The true proportion is likely to be higher for the reasons noted above.2 It is intriguing that, even based on these data, the share of China’s reserve accumulation going into U.S. Treasuries in 2008 was much higher than during the period 2004-07. During 2009, there was initially some month-to-month whipsawing from net sales to net purchases of U.S. Treasuries. In the latter half of the year, there was a discernible shift away from short-term Treasury bills to longer-term Treasury notes (see Table 3A for monthly TIC data related to China). Apprehensions, based on TIC data for the last few months of 2009, that China may be dumping U.S. Treasuries might be an overstatement. Some analysts have argued that China might simply be shifting out of U.S. short-term Treasury bills, which currently have a very low yield, to longer-term Treasury notes that have a higher yield and that these purchases of Treasury notes are being channeled through intermediaries in the U.K. and elsewhere. This is plausible but not entirely convincing. Given the relatively flat U.S. yield curve and the high levels of U.S. deficits and debt, which the Chinese have expressed considerable concerns about, this hardly seems like a propitious time to lock into long-term U.S. government bonds for the sake of modestly higher returns. 2 The data in this note were revised on March 1, 2010 to incorporate the re-benchmarking of the end-June 2009 TIC data; these revised data were released on February 26, 2010. Analysts believe that the actual stock of Chinese holdings of U.S. Treasury instruments is likely to be about $150-200 billion higher than the reported number. For example, see Brad Setser and Arpana Pandey, 2009, “China’s $1.7 Trillion Bet,” Council on Foreign Relations Working Paper.

5
Prognosis for the Bilateral Economic Relationship Paradoxically, the crisis is likely to intensify the awkward embrace between the two economies. In the short run, China needs export growth in order to maintain job growth and preserve social stability. As China continues to run current account surpluses by exporting to the U.S. and other advanced country markets, it has little alternative to buying U.S. Treasuries with the reserves it accumulates while managing its exchange rate. The U.S. will continue to need willing buyers for the debt issued to finance its budget deficit, especially if the household saving rate starts drifting back towards pre-crisis levels. Hasn’t the Chinese economy’s dramatic growth performance during the crisis shown that it has become less dependent on export markets in the West, especially as GDP growth remained strong despite a decline in the trade surplus during 2009? Answering this question requires a retrospective look at the Chinese growth model. There are two distinct features of the Chinese growth process in the decade before the crisis, when GDP growth averaged about 10 percent per annum.3 First, investment accounted for more than half of overall GDP growth, with net exports playing an important role as well since 2005 (see Figure 6). Private consumption, by contrast, has not been a key driver of growth. Second, even high GDP growth has not translated into much employment growth, with overall net employment growth averaging only about 1 percent over the last decade.4 Thus, the Chinese government has had to cope with the twin challenges of rebalancing growth towards domestic consumption in order to make growth more welfare-enhancing for its citizens and of generating higher employment growth in order to maintain social stability. To counter the aftershocks of the crisis, the Chinese government embarked on a massive fiscal and monetary stimulus program in the latter half of 2008. In addition to a large expansion of government spending, it directed the state-owned banks to make credit freely available. The banks dutifully went on an unprecedented lending spree, amounting to nearly $1.5 trillion (or about one-third of China’s GDP) in 2009, a pace that has continued into January 2010. It’s a good bet that most of this lending went to large state enterprises, favored clients of the state banks. With cheap and plentiful money, along with subsidized inputs such as energy and land, conditions were ripe for a massive investment boom, which amounted to nearly 90 percent of GDP growth in 2009.5 This investment boom is creating excess capacity in many industries such as steel, aluminum and glass that already had some spare capacity to begin with. Down the road, this could dampen employment and household income growth. Banks fear a resurgence of bad loans on their books if consumption demand doesn’t grow fast enough to soak up 3 For more details, see Eswar Prasad, 2009, “Is China’s Growth Miracle Built to Last?” China Economic Review, Vol. 20, pp. 103–123. 4 The annual growth rate of non-agricultural employment averaged around 2.5 percent during this period, although this in turn has to be set against the growth rate of non-agricultural output, which has been 2-3 percentage points higher than that of overall GDP. 5 Increases in private and government consumption demand amounted to about 45 percent of GDP growth, but this was offset by a large negative contribution of net exports to growth as the trade balance fell sharply in 2009 relative to 2008.
6
the output from the new factories. Moreover, the Chinese household saving rate has trended upward in recent years; the economic uncertainty associated with the crisis and the weak global economic recovery are likely to increase saving for precautionary purposes.6 In short, the stimulus could end up actually worsening the balance of growth by tilting it even more towards growth led by investment rather than private consumption. The only solution then is to export the fruits of this investment. Thus, investment-led growth sets the stage for export-led growth, exactly the reverse of the balanced private consumption-led economy that Chinese leaders want. The reliance on exports, as noted earlier, is also because it is a key source of net job growth. As the U.S. recovery strengthens, imports are likely to rise, leading to a further deterioration of the U.S. overall trade deficit as well as its bilateral trade deficit with China. China’s overall current account balance is likely to continue to increase and, as the global economic recovery progresses, China will continue running large trade surpluses and accumulating foreign exchange reserves at a rapid rate. Thus, we could be in for a repeat of the global current account imbalances in 2006-07, typified by large U.S. current account deficits and Chinese current account surpluses. How Dependent is the U.S. on Financing from China? Based on data from TIC and other U.S. sources, it is possible to construct a profile of the owners of U.S. government debt held by the public, which stood at $7.8 trillion at the end of December 2009. China’s share of total outstanding U.S. government debt held by the public has risen steadily over the years, but fell slightly in the latter half of 2009 and now stands at 11 percent (or about one-quarter of all U.S. debt held by foreigners). This represents about a 0.6 percentage point increase relative to the share in August 2009, consistent with the rise of about $100 billion in China’s overt holdings of U.S. Treasuries from August to December 2009. Debt issued by government-sponsored enterprises (GSEs) such as Fannie Mae and Freddie Mac, which amounted to about $7.2 trillion as of September 2009, represents a liability of the U.S. government as well. China’s share of outstanding U.S. agency bonds was 6.4 percent in 2007 but fell below 6 percent in 2009. In short, even based on official data that probably understate the true picture, China has contributed to a significant proportion of U.S. government debt financing in recent years. If one were to take the TIC data literally, China has apparently cut its shares of holdings of net U.S. public and agency debt in the latter half of 2009. As noted earlier, this conclusion based on TIC data should be interpreted with considerable caution. While it is difficult to ascertain exactly what share of U.S. government debt is held by China, the TIC data do allow us to put some bounds on this calculation. Identified Chinese holdings of U.S. Treasuries and GSE debt amounted to about $1.3 trillion at the end of 2009 ($895 billion + $405 billion; see Table 4, last panel). Based on the widely-held assumption that about 70 percent of Chinese foreign exchange reserves are in dollar-denominated bonds and also assuming that the remainder that are not accounted for in
6 See Marcos Chamon and Eswar Prasad, 2010, “Why Are Saving Rates of Urban Households in China Rising?” American Economic Journal: Macroeconomics, Vol. 2, No. 1, pp 93–130.
7
TIC are all in Treasuries, this would imply an additional holding of about $380 billion in Treasuries.7 This would amount to a total of $1.34 trillion, or 17 percent of outstanding U.S. net public debt (excluding GSE debt).8 In other words, it is a significant but not overwhelming share. Is it a credible threat that China could dump a significant share of its holdings of U.S. Treasuries? Many analysts argue that any threat by China to shift a large portion of its reserves out of U.S. government paper is just bluster as such a move would impose huge costs on China itself. But these costs tend to get overstated in popular discussions of the matter. Let us examine each aspect of these costs.
1. If interest rates in the U.S. spiked as a consequence of Chinese actions, there would be a capital loss to China on the value of its Treasury bond holdings. This is correct on a mark-to-market basis, but it is likely that China has a hold-to-maturity approach on its bond portfolio, given that it has such a large stock of reserves and has no immediate liquidity needs. Hence, the actual capital loss may not be significant enough to feature in the political calculus.
2. A plunge in the value of the dollar against other major currencies would reduce
the domestic currency (renminbi) value of China’s dollar-denominated holdings. This is indeed accurate. But only if the renminbi appreciated relative to the dollar. Otherwise, China would lose a modest amount on the value of its euro and yen holdings and this would be more than made up for by the benefits of higher trade competitiveness if the renminbi rode down with the dollar against other major currencies.
3. Currency appreciation would lead to a big loss on reserve holdings in local
currency terms. If the renminbi appreciated substantially relative to the dollar, as economists believe it eventually must given the much higher productivity growth in China relative to the U.S., China would certainly take a capital loss. But this is likely to be at least partially offset by seigniorage revenue that China can get as it moves forward in tandem on exchange rate flexibility and capital account liberalization. By preparing the ground for the internationalization of the renminbi, China stands to gain some of the benefits that accrue to an international reserve currency, although this might happen only over a period of a decade or so. China is already taking measures to foster the adoption of the renminbi in trade and financial transactions in Asia.
In short, any Chinese threat to move aggressively out of Treasuries is a reasonably credible threat as the short-term costs to the Chinese of such an action are not likely to be large. But can China make a big difference to U.S. interest rates given that its share of the financing of the U.S. budget deficit has fallen over time? The answer lies not in the
7 $2.4 trillion × 0.70 = $1.68 trillion - $895 billion - $405 billion = $380 billion. 8 China’s share of total foreign holdings of U.S. Treasuries would then be about 36 percent. Of course, the total share of all foreign holdings of U.S. Treasuries would not be affected under the assumption that all of China’s purchases were through non-U.S. intermediaries.

8
absolute amounts of financing that China brings to the table, but in how its actions could serve as a trigger around which nervous market sentiments could coalesce. Given that there are no clear prospects of reining in exploding deficits and debt in the U.S., especially if one factors in rising health care and entitlement costs, changes in availability of deficit financing at the margin can have potentially large consequences. The real constraint to any Chinese desire to shift significantly out of investing in U.S. Treasuries may actually have more to do with the sheer size of the U.S. Treasury bond market relative to other available investments, including euro and yen government bonds. Through the China Investment Corporation--its sovereign wealth fund, which has a capital base of $200 billion--China has been seeking to diversity its investments into a broader range of asset classes. But this is a modest amount relative to the overall size of China’s foreign assets. The reality is that, so long as China continues to accumulate reserves at a pace of around $400 billion a year, there are few relatively safe investments other than U.S. government bond markets that are deep and liquid enough to absorb a significant portion of such massive inflows.9 Getting the Balance Right The U.S. has been supportive of China getting its rightful place on the global economic stage. The Obama administration has actively supported a more prominent role for China at the IMF and other multilateral institutions such as the Financial Stability Board. The administration has also played a key role in supporting the ascendance of the G-20 rather than the G-7 as being the agenda-setting body on the global economic stage, effectively giving China a more prominent seat at the table in key policy discussions. These are logical—indeed, necessary—steps to make these institutions more inclusive and effective in dealing with the many global challenges that lie ahead. While greater Chinese influence in international economic affairs is inevitable, the U.S. has played an important role in speeding up this realignment. The question remains whether the U.S. is gaining sufficient leverage from its importance to the Chinese economy and its initiatives to give China a more prominent place on the world stage. Indeed, the shifting narratives noted earlier seem to have put the U.S. administration on the defensive in its dealings with China. Here are some steps the Obama administration needs to take to rebalance this relationship:
Get real on deficit reduction. The simple reality is that the U.S. has to summon the political will to decisively tackle its mammoth budget deficit and rising public
9 A related point is made by Goldberg (2010), who documents the prominent role of the dollar in international debt markets. She notes that the dollar has maintained its dominance in the issuance of international debt securities despite all the talk about the decline in the role of the dollar in world capital markets. See Linda Goldberg, 2010, “Is the International Role of the Dollar Changing?” Federal Reserve Bank of New York Current Issues in Economics and Finance, Vol. 16 No. 1, January.
9
debt, which have contributed to its current account deficits and dependence on funds flowing in from the rest of the world. Otherwise, the U.S. will become increasingly vulnerable to external influences. In the absence of a clear commitment and a credible plan to bring down the deficit through a combination of revenue increases and expenditure reductions, the U.S. will face a worsening balance of power in its relationship with China.
Be more assertive in this bilateral relationship. My view is that mollification of
China on economic and political issues is no longer the right approach. The administration’s actions—including certain statements by Secretary Geithner and Secretary Clinton during their respective visits to Beijing—have fed into the perception that the U.S. is on the defensive in this bilateral relationship. On human rights issues, in particular, the U.S. cannot be seen to be backing down as a result of economic pressures.
Elicit the support of other emerging markets and developing countries in
influencing Chinese currency and other economic policies. Rather than focusing on the effects of China’s currency on the U.S.-China bilateral trade balance, the implications of China’s currency policy for its own economic stability and those of other emerging markets should be highlighted. Greater currency flexibility could have considerable long-term benefits for China by allowing its monetary policy to become more independent, reducing its dependence on exports and rebalancing its economy towards domestic consumption. This would be good for China’s growth and would also make a useful contribution to the stability of the international financial system.10 It would also ease the pressure on other emerging markets that are facing a dire loss of competitiveness relative to China if their currencies appreciate while China’s doesn’t, complicating their macroeconomic policy management.
Continue to foster high-level engagements among leaders of the two nations
through the Strategic and Economic Dialogue and other avenues. Building up trust at these higher levels will be important to ensure that low-level disputes with minor direct ramifications don’t spin out of control as pandering to domestic constituencies could lock the two nations into a cycle of confrontation that escalates disputes to a more damaging level.
Setting the China-U.S. relationship on an even keel is important not just for the principals but also for the broader world economy as the cooperative or conflicted nature of this relationship will set the tone for progress on a number of multilateral issues, including global macroeconomic stability, reform of the international monetary system and tackling climate change.
10 See “Exchange Rate Flexibility in China: Why it Really Matters and How to Make Progress” Eswar Prasad’s testimony at the Senate Finance Committee hearing on “The Role of Currency in the U.S.-China Relationship” March 28, 2007. Available at http://prasad.aem.cornell.edu Also see Eswar Prasad and Raghuram Rajan, 2006, “Modernizing China’s Growth Paradigm,” American Economic Review, Vol. 96, No. 2, pp. 331-36.

Figure 1. Relative Importance of China and U.S.
as Import and Export Markets(in percent)
0
5
10
15
20
25
1996 1997 1998 1999 2000 2001 2002 2003 2004 2005 2006 2007 2008 2009
U.S. Exports to China as a share of total U.S. Exports
China's Exports to U.S. as a share of total China's Exports
Importance of U.S. market for China's exports
Importance of China's market for U.S. exports
4
6
8
10
12
14
16
1996 1997 1998 1999 2000 2001 2002 2003 2004 2005 2006 2007 2008 2009
U.S. Imports to China as a share of total U.S. Imports
China's Imports to U.S. as a share of total China's Imports
Source: CEIC and author's calculations.
Importance of U.S. as a source of China's imports
Importance of China as a source of U.S. imports
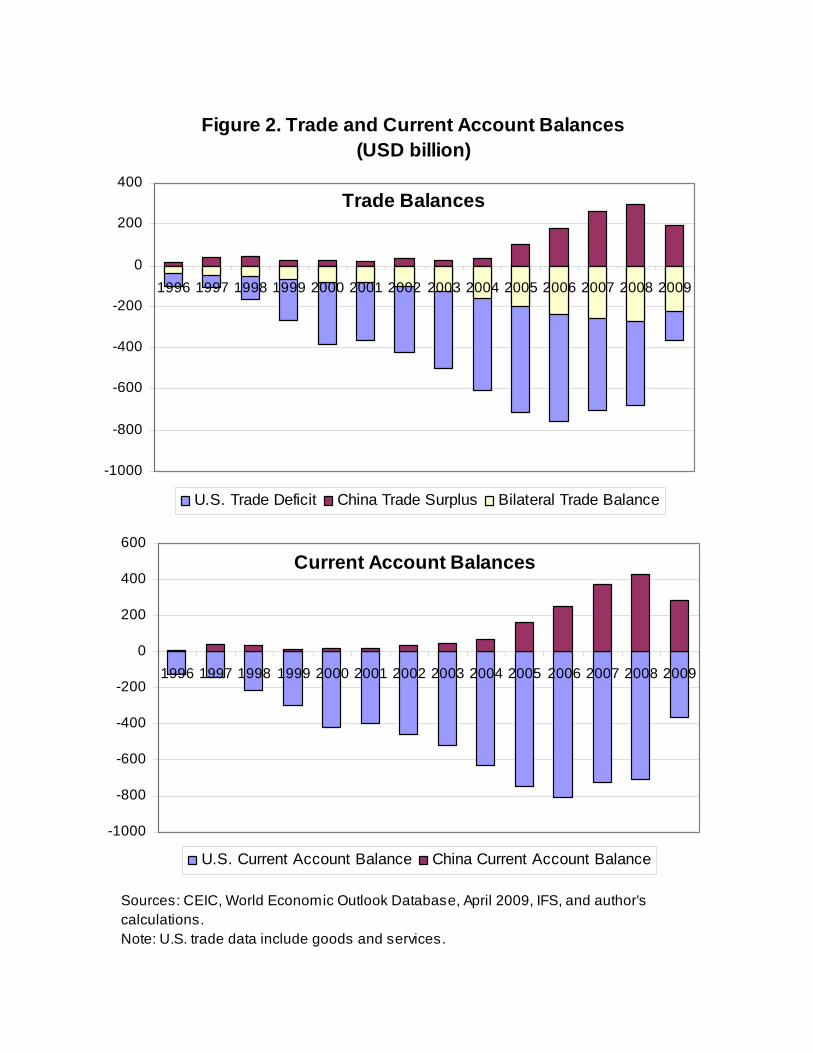
Figure 2. Trade and Current Account Balances(USD billion)
Trade Balances
-1000
-800
-600
-400
-200
0
200
400
1996 1997 1998 1999 2000 2001 2002 2003 2004 2005 2006 2007 2008 2009
U.S. Trade Deficit China Trade Surplus Bilateral Trade Balance
Current Account Balances
-1000
-800
-600
-400
-200
0
200
400
600
1996 1997 1998 1999 2000 2001 2002 2003 2004 2005 2006 2007 2008 2009
U.S. Current Account Balance China Current Account Balance
Sources: CEIC, World Economic Outlook Database, April 2009, IFS, and author's calculations. Note: U.S. trade data include goods and services.

Figure 3. Exchange Rates
Nominal Exchange Rates
4
5
6
7
8
9
10
11
12
Jan
-96
Se
p-9
6
Ma
y-9
7
Jan
-98
Se
p-9
8
Ma
y-9
9
Jan
-00
Se
p-0
0
Ma
y-0
1
Jan
-02
Se
p-0
2
Ma
y-0
3
Jan
-04
Se
p-0
4
Ma
y-0
5
Jan
-06
Se
p-0
6
Ma
y-0
7
Jan
-08
Se
p-0
8
Ma
y-0
9
Spot Exchange Rate: RMB to USD
Spot Exchange Rate: Period Avg: RMB to EURO
Effective Exchange Rate Indices
85
90
95
100
105
110
115
120
125
130
Jan
-96
Oct
-96
Jul-
97
Ap
r-9
8
Jan
-99
Oct
-99
Jul-
00
Ap
r-0
1
Jan
-02
Oct
-02
Jul-
03
Ap
r-0
4
Jan
-05
Oct
-05
Jul-
06
Ap
r-0
7
Jan
-08
Oct
-08
Jul-
09
China's Nominal Effective Exchange Rate Index: 2005=100
China's Real Effective Exchange Rate Index: 2005=100
Sources: CEIC, BIS, IFS, and author's calculations.
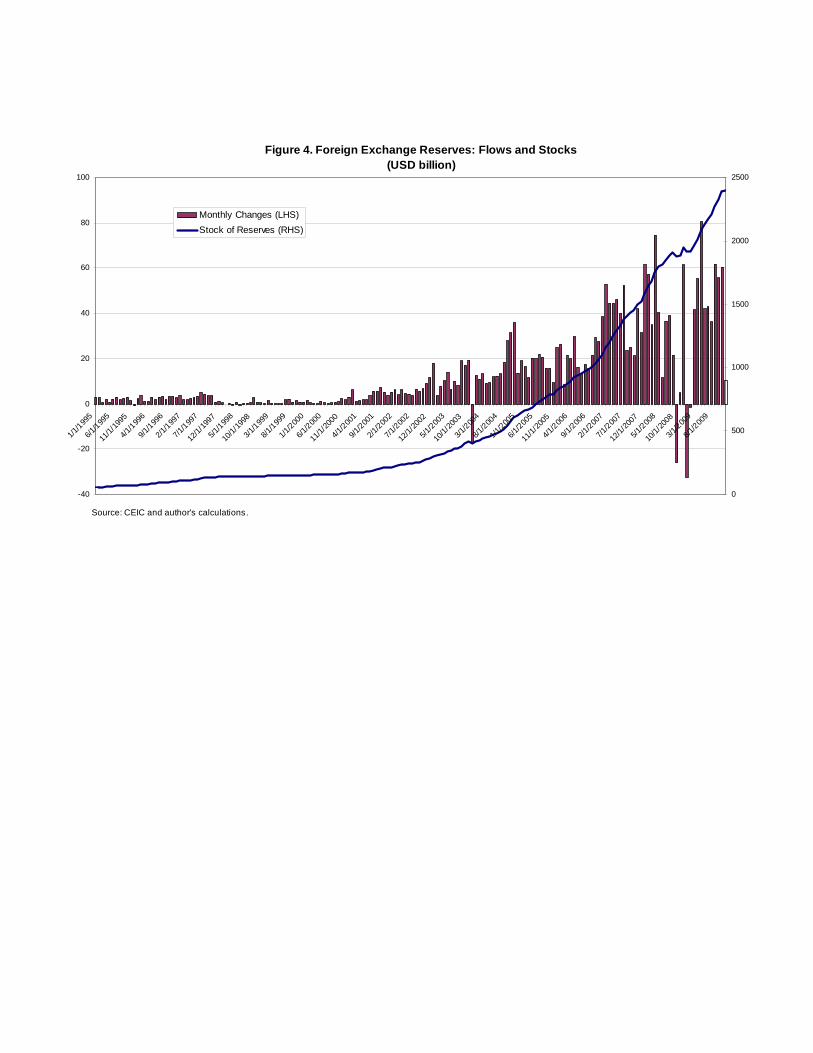
Figure 4. Foreign Exchange Reserves: Flows and Stocks (USD billion)
-40
-20
0
20
40
60
80
100
1/1/
1995
6/1/
1995
11/1
/199
5
4/1/
1996
9/1/
1996
2/1/
1997
7/1/
1997
12/1
/199
7
5/1/
1998
10/1
/199
8
3/1/
1999
8/1/
1999
1/1/
2000
6/1/
2000
11/1
/200
0
4/1/
2001
9/1/
2001
2/1/
2002
7/1/
2002
12/1
/200
2
5/1/
2003
10/1
/200
3
3/1/
2004
8/1/
2004
1/1/
2005
6/1/
2005
11/1
/200
5
4/1/
2006
9/1/
2006
2/1/
2007
7/1/
2007
12/1
/200
7
5/1/
2008
10/1
/200
8
3/1/
2009
8/1/
2009
0
500
1000
1500
2000
2500
Monthly Changes (LHS)
Stock of Reserves (RHS)
Source: CEIC and author's calculations.
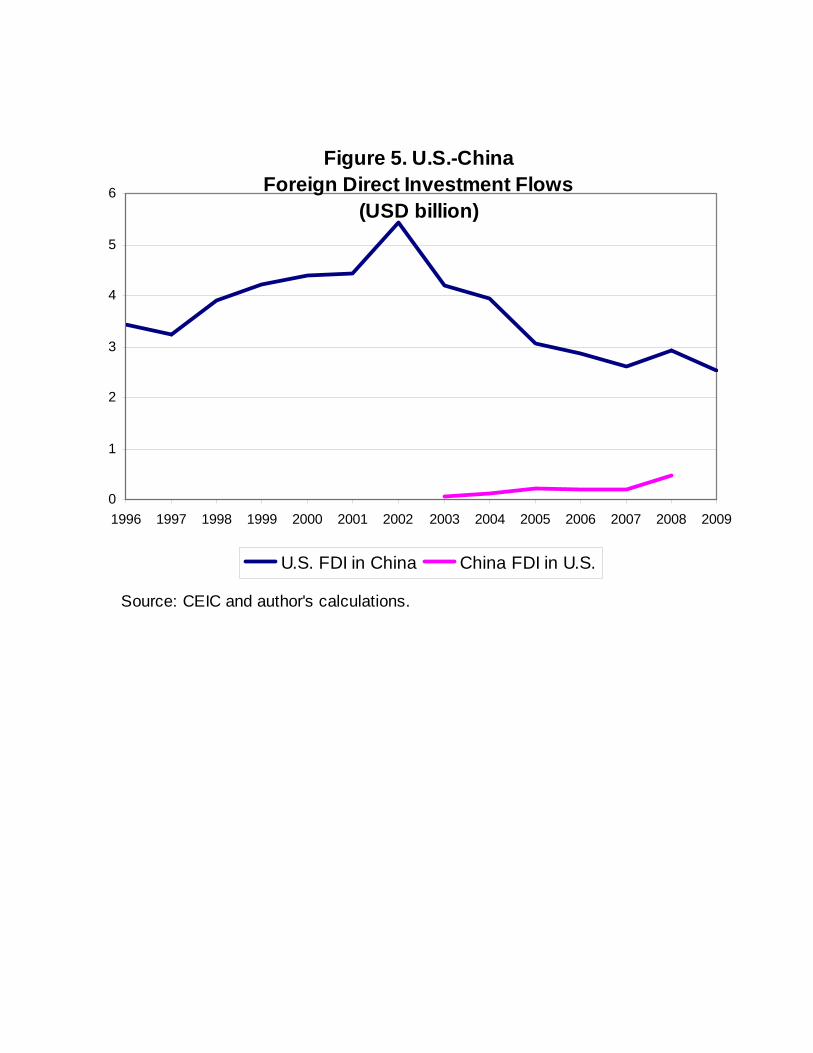
Figure 5. U.S.-China Foreign Direct Investment Flows
(USD billion)
0
1
2
3
4
5
6
1996 1997 1998 1999 2000 2001 2002 2003 2004 2005 2006 2007 2008 2009
U.S. FDI in China China FDI in U.S.
Source: CEIC and author's calculations.
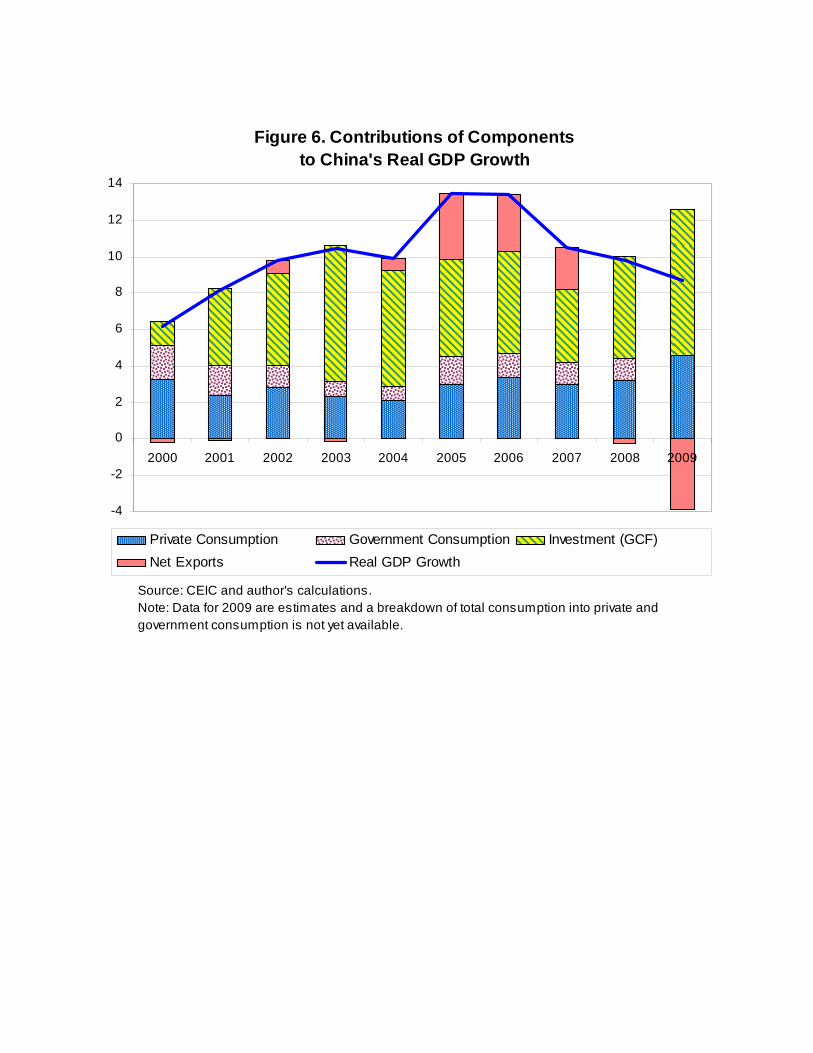
Figure 6. Contributions of Components to China's Real GDP Growth
-4
-2
0
2
4
6
8
10
12
14
2000 2001 2002 2003 2004 2005 2006 2007 2008 2009
Private Consumption Government Consumption Investment (GCF)
Net Exports Real GDP Growth
Source: CEIC and author's calculations. Note: Data for 2009 are estimates and a breakdown of total consumption into private and government consumption is not yet available.

Table 1. The Balance of Payments
(in billions of US dollars)
1997 1998 1999 2000 2001 2002 2003 2004 2005 2006 2007 2008 2009
Gross international reserves 143.4 149.8 158.3 168.9 218.7 295.2 412.2 618.6 825.6 1072.6 1547.3 1966.2 2399.2
(in percent of GDP) 15.0 14.7 14.6 14.1 16.5 20.3 25.1 32.0 36.8 40.8 45.8 45.4 48.9
Change in international reserves 34.9 6.4 8.5 10.5 49.8 76.5 117.0 206.3 207.0 247.0 474.7 418.9 433.0
A. Current account balance 37.0 31.5 21.1 20.5 17.4 35.4 45.9 68.7 160.8 249.9 371.8 426.1 284.1
(in percent of GDP) 3.9 3.1 1.9 1.7 1.3 2.4 2.8 3.6 7.2 9.5 11.0 9.8 5.8
Merchandise trade balance 46.2 46.6 36.0 34.5 34.0 44.2 44.7 59.0 134.2 217.7 315.4 360.7 249.3
(in percent of GDP) 4.9 4.6 3.3 2.9 2.6 3.0 2.7 3.1 6.0 8.3 9.3 8.3 5.1
B. Capital account balance 21.0 -6.3 5.2 2.0 34.8 32.3 52.7 110.7 63.0 10.0 73.5 19.0 -
FDI, net 41.7 41.1 37.0 37.5 37.4 46.8 47.2 53.1 67.8 60.3 121.4 94.3 36.5
C. Errors and omissions, net -22.3 -18.7 -17.8 -11.9 -4.9 7.8 18.4 27.0 -16.8 -12.9 16.4 -26.1 -
Memorandum Items:
Non-FDI capital account balance
(including errors and omissions) -42.9 -66.1 -49.6 -47.4 -7.4 -6.7 23.9 84.6 -21.6 -63.2 -31.5 -101.4 -
Nominal GDP 953 1019 1083 1198 1325 1454 1641 1932 2244 2626 3382 4327 4909.2
Sources: CEIC, IFS and author's calculations.
Note: The non-FDI capital account balance is the capital account balance minus net FDI plus net errors and omissions.

Table 2. International Investment Position
(in billions of U.S. dollars)
2004 2005 2006 2007 2008
Net Position 293 423 662 1022 1519
A. Assets 930 1223 1627 2288 2920
1. FDI 53 65 91 116 169
2. Portfolio 92 117 265 285 252
Equity 0 0 2 20 21
Debt 92 117 264 265 231
3. Other investment 167 216 252 427 533
4. Reserve assets 619 826 1081 1547 1966
Foreign exchange reserves 610 819 1066 1528 1946
B. Liabilities 637 800 965 1266 1401
1. FDI 369 472 614 704 876
2. Portfolio 57 77 121 147 161
Equity 43 64 107 129 144
Debt 13 13 14 18 17
3. Other investment 212 252 300 362 364
Source: State Administration of Foreign Exchange website.
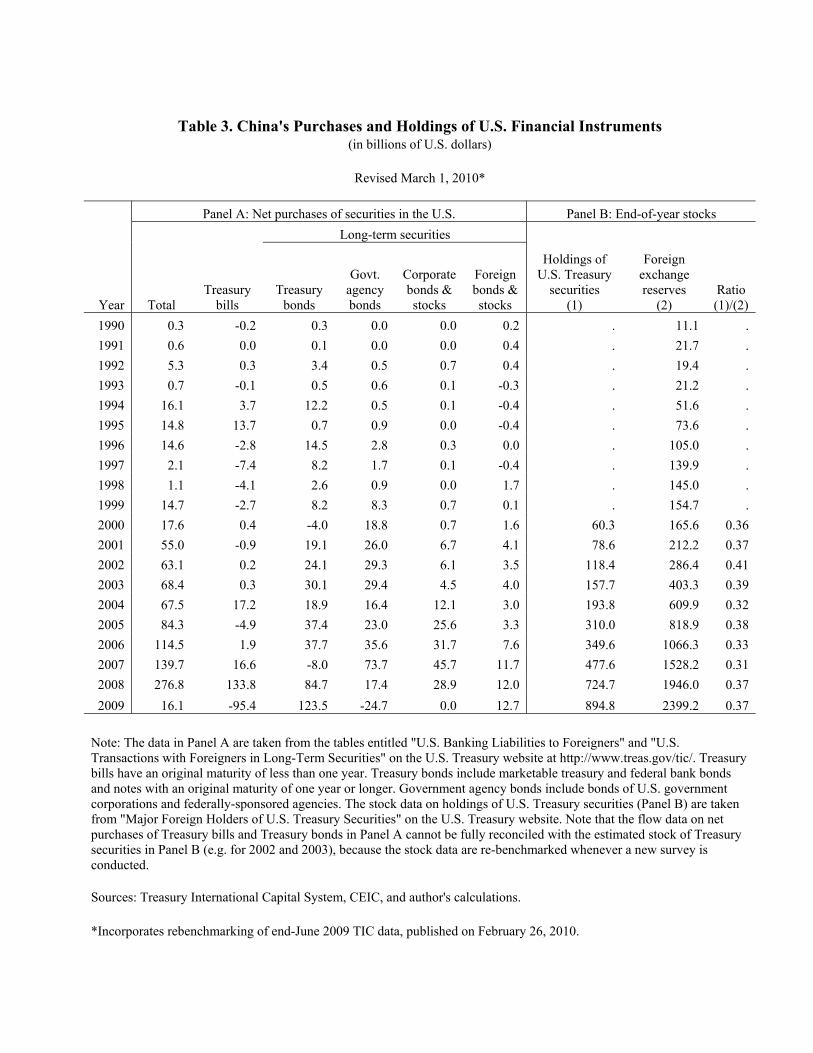
Table 3. China's Purchases and Holdings of U.S. Financial Instruments
(in billions of U.S. dollars)
Revised March 1, 2010* Panel A: Net purchases of securities in the U.S. Panel B: End-of-year stocks Long-term securities
Year Total Treasury
bills Treasury
bonds
Govt. agency bonds
Corporate bonds & stocks
Foreign bonds & stocks
Holdings of U.S. Treasury
securities (1)
Foreign exchange reserves
(2) Ratio (1)/(2)
1990 0.3 -0.2 0.3 0.0 0.0 0.2 . 11.1 . 1991 0.6 0.0 0.1 0.0 0.0 0.4 . 21.7 . 1992 5.3 0.3 3.4 0.5 0.7 0.4 . 19.4 . 1993 0.7 -0.1 0.5 0.6 0.1 -0.3 . 21.2 . 1994 16.1 3.7 12.2 0.5 0.1 -0.4 . 51.6 . 1995 14.8 13.7 0.7 0.9 0.0 -0.4 . 73.6 . 1996 14.6 -2.8 14.5 2.8 0.3 0.0 . 105.0 . 1997 2.1 -7.4 8.2 1.7 0.1 -0.4 . 139.9 . 1998 1.1 -4.1 2.6 0.9 0.0 1.7 . 145.0 . 1999 14.7 -2.7 8.2 8.3 0.7 0.1 . 154.7 . 2000 17.6 0.4 -4.0 18.8 0.7 1.6 60.3 165.6 0.36 2001 55.0 -0.9 19.1 26.0 6.7 4.1 78.6 212.2 0.37 2002 63.1 0.2 24.1 29.3 6.1 3.5 118.4 286.4 0.41 2003 68.4 0.3 30.1 29.4 4.5 4.0 157.7 403.3 0.39 2004 67.5 17.2 18.9 16.4 12.1 3.0 193.8 609.9 0.32 2005 84.3 -4.9 37.4 23.0 25.6 3.3 310.0 818.9 0.38 2006 114.5 1.9 37.7 35.6 31.7 7.6 349.6 1066.3 0.33 2007 139.7 16.6 -8.0 73.7 45.7 11.7 477.6 1528.2 0.31 2008 276.8 133.8 84.7 17.4 28.9 12.0 724.7 1946.0 0.37 2009 16.1 -95.4 123.5 -24.7 0.0 12.7 894.8 2399.2 0.37
Note: The data in Panel A are taken from the tables entitled "U.S. Banking Liabilities to Foreigners" and "U.S. Transactions with Foreigners in Long-Term Securities" on the U.S. Treasury website at http://www.treas.gov/tic/. Treasury bills have an original maturity of less than one year. Treasury bonds include marketable treasury and federal bank bonds and notes with an original maturity of one year or longer. Government agency bonds include bonds of U.S. government corporations and federally-sponsored agencies. The stock data on holdings of U.S. Treasury securities (Panel B) are taken from "Major Foreign Holders of U.S. Treasury Securities" on the U.S. Treasury website. Note that the flow data on net purchases of Treasury bills and Treasury bonds in Panel A cannot be fully reconciled with the estimated stock of Treasury securities in Panel B (e.g. for 2002 and 2003), because the stock data are re-benchmarked whenever a new survey is conducted. Sources: Treasury International Capital System, CEIC, and author's calculations. *Incorporates rebenchmarking of end-June 2009 TIC data, published on February 26, 2010.
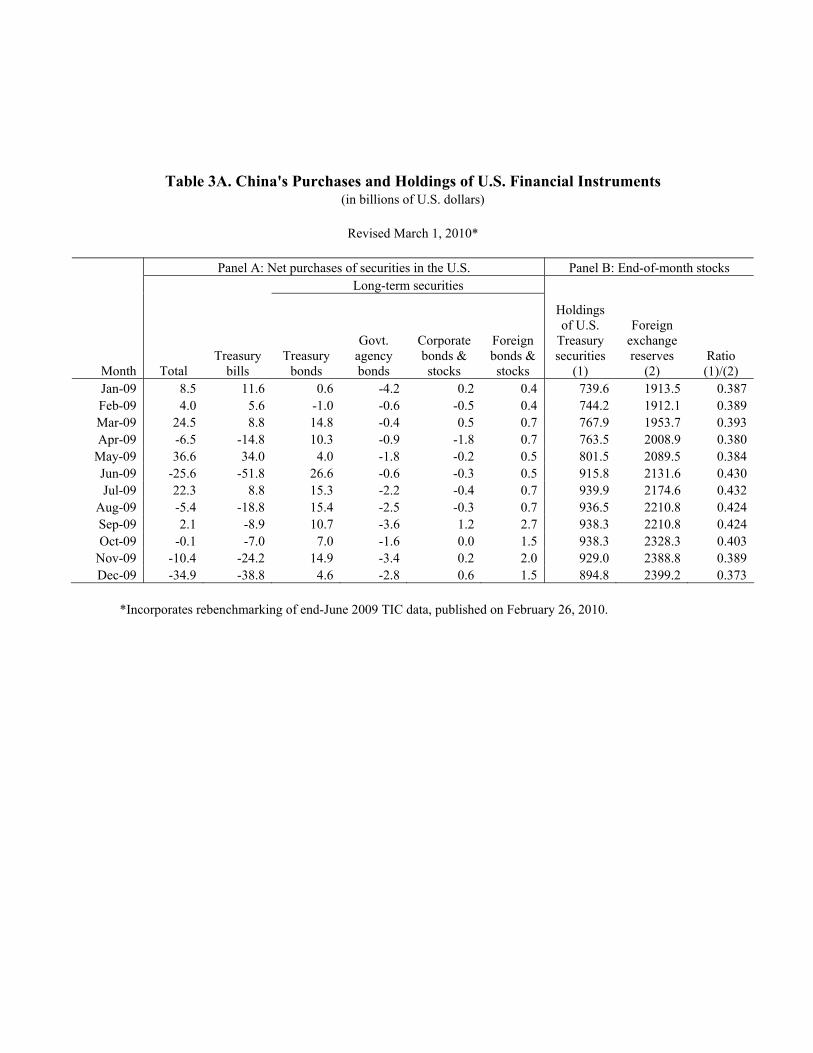
Table 3A. China's Purchases and Holdings of U.S. Financial Instruments (in billions of U.S. dollars)
Revised March 1, 2010*
Panel A: Net purchases of securities in the U.S. Panel B: End-of-month stocks Long-term securities
Month Total Treasury
bills Treasury
bonds
Govt. agency bonds
Corporate bonds & stocks
Foreign bonds & stocks
Holdings of U.S.
Treasury securities
(1)
Foreign exchange reserves
(2) Ratio (1)/(2)
Jan-09 8.5 11.6 0.6 -4.2 0.2 0.4 739.6 1913.5 0.387 Feb-09 4.0 5.6 -1.0 -0.6 -0.5 0.4 744.2 1912.1 0.389 Mar-09 24.5 8.8 14.8 -0.4 0.5 0.7 767.9 1953.7 0.393 Apr-09 -6.5 -14.8 10.3 -0.9 -1.8 0.7 763.5 2008.9 0.380
May-09 36.6 34.0 4.0 -1.8 -0.2 0.5 801.5 2089.5 0.384 Jun-09 -25.6 -51.8 26.6 -0.6 -0.3 0.5 915.8 2131.6 0.430 Jul-09 22.3 8.8 15.3 -2.2 -0.4 0.7 939.9 2174.6 0.432
Aug-09 -5.4 -18.8 15.4 -2.5 -0.3 0.7 936.5 2210.8 0.424 Sep-09 2.1 -8.9 10.7 -3.6 1.2 2.7 938.3 2210.8 0.424 Oct-09 -0.1 -7.0 7.0 -1.6 0.0 1.5 938.3 2328.3 0.403
Nov-09 -10.4 -24.2 14.9 -3.4 0.2 2.0 929.0 2388.8 0.389 Dec-09 -34.9 -38.8 4.6 -2.8 0.6 1.5 894.8 2399.2 0.373
*Incorporates rebenchmarking of end-June 2009 TIC data, published on February 26, 2010.

Table 4. China's Holdings of U.S. Government Debt (in billions of U.S. dollars)
Revised March 10, 2010*
March 30, 2000 June 30, 2007 December 31, 2009
Treasuries Agencies Treasuries Agencies Treasuries Agencies Total Outstanding Held by the Public 3,519 3,334 4,943 6,077 7,811 7,181 Total Held by Foreigners 884 261 2,194 1,413 3,689 1,449 China's Holdings 71 20 477 387 895 405 China's Share of Foreign Holdings 8.0% 7.5% 21.8% 27.4% 24.3% 28.0%China's Share of Total Outstanding 2.0% 0.6% 9.7% 6.4% 11.5% 5.6%Foreign Share of Total Outstanding 25.1% 7.8% 44.4% 23.3% 47.2% 20.2% Note (1): For the purposes of this table, Treasury is defined as "debt held by public." Including "Intragovernmental holdings" Total Treasury Debt on March 30, 2000 was $5.8 trillion and on December 31, 2009 it was $12.3 trillion. The number of total agencies outstanding held by the public in the table is up to only September 30, 2009.
Note (2): The TIC System contains data on all Chinese holdings, not just by the Chinese government. Some of the Treasury and Agency holdings reported in this table may not be held by the State Administration of Foreign Exchange. Sources: TIC System, Federal Reserve Flow of Funds, and Treasury's Bureau of Public Debt.
*Incorporates rebenchmarking of end-June 2009 TIC data, published on February 26, 2010.
Related Documents