186 August 2008 U.S. Affiliates of Foreign Companies Operations in 2006 By Thomas Anderson T HE current-dollar value added of majority-owned U.S. affiliates of foreign companies grew 12 percent in 2006—the fastest rate of increase since 2000, when affiliate value added was boosted by record levels of new foreign direct investment, according to prelimi- nary statistics derived from the Bureau of Economic Analysis’ most recent annual survey of foreign direct investment in the United States. The 2006 increase, which was driven mostly by expansion of existing affil- iate operations, was roughly double the growth rate of current-dollar value added for the U.S. economy as a whole; as a result, the affiliate share of total U.S. private industry value added rose from 5.8 percent in 2005 to 6.1 percent in 2006. The 12 percent increase in value added by majority- owned nonbank U.S. affiliates (“U.S. affiliates”) in 2006—from $550 billion to $615 billion—was sub- stantially higher than the 7 percent increase in 2005 (table 1). 1 In comparison, total U.S. current-dollar value added in nonbank private industries increased 6 percent in 2006, following an increase of 7 percent in 2005. As a result of the faster growth by affiliates in 2006, the share of U.S. nonbank private industry value added accounted for by U.S. affiliates rose from 5.8 percent in 2005 to 6.1 percent in 2006, the highest affil- iate share since 1988 (the earliest year for which esti- mates of the value added of majority-owned affiliates are available) (chart 1). Much of the 2006 increase in affiliate value added reflected expanded production by existing affiliates, particularly in pharmaceuticals manufacturing, secu- rities brokerage services, insurance services, and sup- port activities for oil and gas extraction. New 1. This article focuses on the operations of nonbank U.S. affiliates that are majority-owned by foreign direct investors. The Bureau of Economic Anal- ysis (BEA) also collects annual data on the operations of nonbank U.S. affil- iates that are owned 50 percent or less by foreign direct investors; however, beginning with the 2002 benchmark survey, the data for these affiliates are less extensive than those for majority-owned affiliates. (Data on the opera- tions of bank affiliates have been collected only in benchmark survey years. BEA has proposed to collect these data annually, beginning with 2008 data.) Selected data on the operations of all (majority-owned and minority- owned) nonbank U.S. affiliates are presented in tables that can be accessed on BEA’s Web site at <www.bea.gov/international/di1fdiop.htm>. Major- ity-owned companies account for much of the foreign direct investment in the United States. In 2006, majority-owned nonbank U.S. affiliates accounted for 92 percent of the employment of all nonbank U.S. affiliates. investments by foreign multinational companies—in- cluding acquisitions of U.S. companies by existing U.S. affiliates—were an important but secondary factor in the increase in affiliate value added and were partly offset by the effect of foreign sales or liquidations of Table 1. Value Added and Employment of Majority-Owned Nonbank U.S. Affiliates of Foreign Companies, 1988–2006 Value added Employment Millions of dollars As a percentage of U.S. private industry value added Thousands of workers As a percentage of U.S. private industry employment 1988 .................................. 146,424 3.8 3,119.0 3.5 1989 .................................. 168,547 4.0 3,573.4 3.9 1990 .................................. 190,477 4.3 3,841.7 4.2 1991 .................................. 207,126 4.6 3,991.3 4.4 1992 .................................. 214,781 4.5 3,903.9 4.3 1993 .................................. 223,008 4.4 3,851.7 4.1 1994 .................................. 244,690 4.5 3,954.0 4.1 1995 .................................. 254,938 4.5 4,022.6 4.0 1996 .................................. 283,422 4.7 4,155.6 4.1 1997 .................................. 313,655 4.9 4,269.1 4.1 1998 .................................. 353,860 5.2 4,669.5 4.3 1999 .................................. 397,295 5.6 5,064.3 4.6 2000 .................................. 447,287 5.9 5,656.5 5.0 2001 .................................. 417,122 5.4 5,594.3 4.9 2002 .................................. 460,609 5.8 5,425.4 4.9 2003 .................................. 475,062 5.7 5,244.4 4.7 2004 .................................. 511,474 5.7 5,131.5 4.5 2005 r ................................ 549,569 5.8 5,201.6 4.5 2006 p ................................ 614,685 6.1 5,330.5 4.6 Percent change from preceding year 1989 .................................. 15.1 ........................... 14.6 ........................... 1990 .................................. 13.0 ........................... 7.5 ........................... 1991 .................................. 8.7 ........................... 3.9 ........................... 1992 .................................. 3.7 ........................... –2.2 ........................... 1993 .................................. 3.8 ........................... –1.3 ........................... 1994 .................................. 9.7 ........................... 2.7 ........................... 1995 .................................. 4.2 ........................... 1.7 ........................... 1996 .................................. 11.2 ........................... 3.3 ........................... 1997 .................................. 10.7 ........................... 2.7 ........................... 1998 .................................. 12.8 ........................... 9.4 ........................... 1999 .................................. 12.3 ........................... 8.5 ........................... 2000 .................................. 12.6 ........................... 11.7 ........................... 2001 .................................. –6.7 ........................... –1.1 ........................... 2002 .................................. 10.4 ........................... –3.0 ........................... 2003 .................................. 3.1 ........................... –3.3 ........................... 2004 .................................. 7.7 ........................... –2.2 ........................... 2005 r ................................ 7.4 ........................... 1.4 ........................... 2006 p ................................ 11.8 ........................... 2.5 ........................... p Preliminary r Revised NOTES. For improved comparability with U.S.-affiliate value added, U.S. private industry value added was adjusted to exclude value added in depository institutions and private households, imputed rental income from owner-occupied housing, and business transfer payments. For the latest estimates of U.S. private industry value added, see Brian M. Lindberg and Justin M. Monaldo, “Annual Industry Accounts: Advance Statistics on GDP by Industry for 2007” SURVEY OF CURRENT BUSINESS 88 (May 2008): 38–50. For improved comparability with U.S.-affiliate employment, U.S. private industry employment was adjusted to exclude employment in depository institutions and private households. For consistency with the coverage of the data on U.S. private industry employment, U.S.-affiliate employment in Puerto Rico, in “other U.S. areas,” and in “foreign” was excluded from the U.S.-affiliate totals when the employment shares were computed.

Welcome message from author
This document is posted to help you gain knowledge. Please leave a comment to let me know what you think about it! Share it to your friends and learn new things together.
Transcript

186 August 2008
U.S. Affiliates of Foreign Companies
Operations in 2006
By Thomas Anderson
THE current-dollar value added of majority-owned U.S. affiliates of foreign companies grew 12 percent
in 2006—the fastest rate of increase since 2000, when affiliate value added was boosted by record levels of new foreign direct investment, according to preliminary statistics derived from the Bureau of Economic Analysis’ most recent annual survey of foreign direct investment in the United States. The 2006 increase, which was driven mostly by expansion of existing affiliate operations, was roughly double the growth rate of current-dollar value added for the U.S. economy as a whole; as a result, the affiliate share of total U.S. private industry value added rose from 5.8 percent in 2005 to 6.1 percent in 2006.
The 12 percent increase in value added by majority-owned nonbank U.S. affiliates (“U.S. affiliates”) in 2006—from $550 billion to $615 billion—was substantially higher than the 7 percent increase in 2005 (table 1).1 In comparison, total U.S. current-dollar value added in nonbank private industries increased 6 percent in 2006, following an increase of 7 percent in 2005. As a result of the faster growth by affiliates in 2006, the share of U.S. nonbank private industry value added accounted for by U.S. affiliates rose from 5.8 percent in 2005 to 6.1 percent in 2006, the highest affiliate share since 1988 (the earliest year for which estimates of the value added of majority-owned affiliates are available) (chart 1).
Much of the 2006 increase in affiliate value added reflected expanded production by existing affiliates, particularly in pharmaceuticals manufacturing, securities brokerage services, insurance services, and support activities for oil and gas extraction. New
1. This article focuses on the operations of nonbank U.S. affiliates that are majority-owned by foreign direct investors. The Bureau of Economic Analysis (BEA) also collects annual data on the operations of nonbank U.S. affiliates that are owned 50 percent or less by foreign direct investors; however, beginning with the 2002 benchmark survey, the data for these affiliates are less extensive than those for majority-owned affiliates. (Data on the operations of bank affiliates have been collected only in benchmark survey years. BEA has proposed to collect these data annually, beginning with 2008 data.) Selected data on the operations of all (majority-owned and minority-owned) nonbank U.S. affiliates are presented in tables that can be accessed on BEA’s Web site at <www.bea.gov/international/di1fdiop.htm>. Majority-owned companies account for much of the foreign direct investment in the United States. In 2006, majority-owned nonbank U.S. affiliates accounted for 92 percent of the employment of all nonbank U.S. affiliates.
investments by foreign multinational companies—including acquisitions of U.S. companies by existing U.S. affiliates—were an important but secondary factor in the increase in affiliate value added and were partly offset by the effect of foreign sales or liquidations of
Table 1. Value Added and Employment of Majority-Owned Nonbank U.S. Affiliates of Foreign Companies, 1988–2006
Value added Employment
Millions of dollars
As a percentage of U.S. private
industry value added
Thousands of workers
As a percentage of U.S. private
industry employment
1988.................................. 146,424 3.8 3,119.0 3.5 1989.................................. 168,547 4.0 3,573.4 3.9 1990.................................. 190,477 4.3 3,841.7 4.2 1991.................................. 207,126 4.6 3,991.3 4.4 1992.................................. 214,781 4.5 3,903.9 4.3 1993.................................. 223,008 4.4 3,851.7 4.1 1994.................................. 244,690 4.5 3,954.0 4.1 1995.................................. 254,938 4.5 4,022.6 4.0 1996.................................. 283,422 4.7 4,155.6 4.1 1997.................................. 313,655 4.9 4,269.1 4.1 1998.................................. 353,860 5.2 4,669.5 4.3 1999.................................. 397,295 5.6 5,064.3 4.6 2000.................................. 447,287 5.9 5,656.5 5.0 2001.................................. 417,122 5.4 5,594.3 4.9 2002.................................. 460,609 5.8 5,425.4 4.9 2003.................................. 475,062 5.7 5,244.4 4.7 2004.................................. 511,474 5.7 5,131.5 4.5 2005 r ................................ 549,569 5.8 5,201.6 4.5 2006 p................................ 614,685 6.1 5,330.5 4.6
Percent change from preceding year
1989.................................. 15.1 ........................... 14.6 ........................... 1990.................................. 13.0 ........................... 7.5 ........................... 1991.................................. 8.7 ........................... 3.9 ........................... 1992.................................. 3.7 ........................... –2.2 ........................... 1993.................................. 3.8 ........................... –1.3 ........................... 1994.................................. 9.7 ........................... 2.7 ........................... 1995.................................. 4.2 ........................... 1.7 ........................... 1996.................................. 11.2 ........................... 3.3 ........................... 1997.................................. 10.7 ........................... 2.7 ........................... 1998.................................. 12.8 ........................... 9.4 ........................... 1999.................................. 12.3 ........................... 8.5 ........................... 2000.................................. 12.6 ........................... 11.7 ........................... 2001.................................. –6.7 ........................... –1.1 ........................... 2002.................................. 10.4 ........................... –3.0 ........................... 2003.................................. 3.1 ........................... –3.3 ........................... 2004.................................. 7.7 ........................... –2.2 ........................... 2005 r ................................ 7.4 ........................... 1.4 ........................... 2006 p................................ 11.8 ........................... 2.5 ...........................
p Preliminary r Revised NOTES. For improved comparability with U.S.-affiliate value added, U.S. private industry value added was
adjusted to exclude value added in depository institutions and private households, imputed rental income from owner-occupied housing, and business transfer payments.
For the latest estimates of U.S. private industry value added, see Brian M. Lindberg and Justin M. Monaldo, “Annual Industry Accounts: Advance Statistics on GDP by Industry for 2007” SURVEY OF CURRENT BUSINESS 88 (May 2008): 38–50.
For improved comparability with U.S.-affiliate employment, U.S. private industry employment was adjusted to exclude employment in depository institutions and private households.
For consistency with the coverage of the data on U.S. private industry employment, U.S.-affiliate employment in Puerto Rico, in “other U.S. areas,” and in “foreign” was excluded from the U.S.-affiliate totals when the employment shares were computed.

187 August 2008 SURVEY OF CURRENT BUSINESS
affiliates or of their subsidiary units.2
Employment by majority-owned U.S. affiliates rose 2.5 percent in 2006, following an increase of 1.4 percent in 2005, the first increases in affiliate employment since 2000. Total U.S. employment in private industries rose 1.8 percent in 2006; as a consequence, the share of U.S. employment in private industries ticked up from 4.5 percent to 4.6 percent.3 The increase in affiliate employment was largely due to acquisitions by existing affiliates, especially in manufacturing and food services and drinking places (restaurants). Entry into the United States by new affiliates also contributed to the growth in employment. Despite these increases, the share of employment accounted for by affiliates remained below the 5.0 percent peak recorded in 2000.
The following are additional highlights of the operations of U.S. affiliates in 2006:
● The United Kingdom continued to be the largest investing country in terms of value added, followed by Japan and Germany.
● Affiliates’ shares of U.S. employment by industry were highest in mining and manufacturing.
● Affiliates’ shares of employment by state were high
2. According to data from BEA’s survey of new foreign investments, outlays by foreign direct investors to acquire or establish businesses in the United States increased substantially, from $91 billion in 2005 to $165 billion in 2006, but they were still below the levels reached in each of the years in 1998–2000 (when outlays for new investment ranged from $215 billion in 1998 to $336 billion in 2000); see Louise Ku-Graf, “Foreign Direct Investment in the United States: New Investment in 2007,” SURVEY OF CURRENT
BUSINESS 88 (June 2008): 32–39. 3. Because U.S. affiliates tend to be concentrated in industrial sectors with
relatively high value added per employee (such as manufacturing, mining, and wholesale trade) their share of U.S. employment has consistently been lower than their share of U.S. value added.
CharChartt 1.1. Majority-Owned Nonbank UMajority-Owned Nonbank U.S.-Affiliate Share.S.-Affiliate Share of Uof U.S..S. VVaalue Adlue Added and Emploded and Employment in Privyment in Privateate Industries,Industries, 1988–20061988–2006
U.S. Bureau of Economic Analysis
Percent
1988 90 92 94 96 98 2000 02 04 06
6.5
6
5.5
5
4.5
4
3.5
Value added
Employment
est in South Carolina and Connecticut. ● Affiliates continued to account for a large share of
both U.S. imports and U.S. exports of goods—26 percent of imports and 19 percent of exports.
● Research and development (R&D) spending by U.S. affiliates rose 10 percent to $34.3 billion. This article examines changes in value added, em
ployment, exports and imports of goods, and R&D activity of U.S. affiliates of foreign companies in 2006. For each of these measures, changes are examined both in the aggregate and for each major investing country. For value added, changes are also examined by industry of affiliate and industry of the foreign owner. For employment, changes are examined by industry of affiliate and by state. Several additional measures of U.S.affiliate operations are presented in tables at the end of this article.
Value Added In 2006, the current-dollar value added of majority-owned nonbank U.S. affiliates increased 12 percent, to $615 billion, while total U.S. current-dollar value added rose 6 percent. As a consequence, the share of value added in private industry accounted for by U.S. affiliates rose to 6.1 percent.
Reduction in Data Available for U.S. Affiliates In order to align its programs with the available resources, BEA is reducing the detail and modifying the reporting criteria on the annual survey of the operations of U.S. affiliates of foreign multinational companies. Effective with the data year 2008, some data items will be dropped from the survey, reporting thresholds will be raised, and statistical sampling will be expanded. In conjunction with these changes, the level of detail published by country and by industry will be reduced to ensure that the published statistics continue to meet standards for statistical quality. Although statistics on U.S. affiliates will become less comprehensive, key data series will be maintained, including those on employment, value added, trade in goods, R&D expenditures, and sales of services.
These changes are part of a larger group of programmatic changes that BEA is making in order to align its work with current funding levels. In the international area, BEA also plans cutbacks in its annual survey of U.S. multinational companies, and it will eliminate its survey of new foreign direct investments, following the collection of data on transactions in 2008. Information on the Bureauwide program reductions is available at <www.bea.gov/agency/ availability_and_quality_of_data.htm>.

188 U.S. Affiliates of Foreign Companies August 2008
By country of ownership In 2006, seven major investing countries—Canada, France, Germany, Japan, the Netherlands, Switzerland, and the United Kingdom—accounted for more than three-fourths of the value added of majority-owned nonbank affiliates (table 2 and chart 2). In 2006, as has been the case for many years, affiliates with ultimate beneficial owners (UBOs) in the United Kingdom accounted for the largest share of affiliate value added (see the box “Key Terms”). British-owned affiliates accounted for slightly less than 20 percent of affiliate value added and for about 1 percent of total U.S. value added in private industries. Japanese-owned affiliates accounted for the second-largest share of affiliate value added (12 percent), and German-owned affiliates accounted for the third-largest share (11 percent).
Among the seven largest investing countries, Swiss-owned affiliates recorded the largest increases in affiliate value added in both dollar and percentage terms. Their value added rose by $13.4 billion, or 37 percent. The increase was due largely to new investment and expansions in existing affiliate operations in “finance (except depository institutions) and insurance” and in pharmaceuticals manufacturing.4 In finance (except
4. In the remainder of this article “banks” refers to “depository institutions,” which is the industry title that appears in the tables.
banks) and insurance, the increase reflected both expansions in business activity (particularly by affiliates in the securities brokerage industry) and affiliate acquisitions of U.S. firms. In pharmaceuticals, Swiss-owned affiliates increased production significantly. As a result of these increases, Switzerland moved from seventh- to sixth-largest investing country in terms of value added, exchanging places with the Netherlands.
Value added by French-owned affiliates rose a substantial 18 percent, driven by acquisitions and expansion of existing affiliates in manufacturing and food services. Value added by Canadian-owned affiliates also rose 18 percent, driven by increased productivity among mining affiliates and the entry of new affiliates in finance.
For German- and Netherlands-owned affiliates, growth in value added was more modest. Value added by German-owned affiliates rose 4 percent, as increases in finance (except banks) and insurance were largely offset by decreases in manufacturing. Value added by Netherlands-owned affiliates rose 3 percent, as increases in wholesale and retail trade were largely offset by declines in insurance.
Among other investing countries, value added increased substantially for affiliates with UBOs in Denmark (52 percent), the United Kingdom Islands, Caribbean (48 percent), and Ireland (46 percent). Value-added growth by Danish-owned affiliates was
Table 2. Value Added of Majority-Owned Nonbank U.S. Affiliates by Country of Ultimate Beneficial Owner, 2001–2006
Millions of dollars Percentage of all–countries total Addendum: Percent
change in affiliate
value added, 2006
2001 2002 2003 2004 2005 2006 2001 2002 2003 2004 2005 2006
All countries ............................................................ 417,122 460,609 475,062 511,474 549,569 614,685 100.0 100.0 100.0 100.0 100.0 100.0 11.8
Canada ................................................................................. 31,702 35,496 35,486 40,231 48,103 56,738 7.6 7.7 7.5 7.9 8.8 9.2 18.0
Europe .................................................................................. 270,144 299,965 313,054 332,450 355,682 392,437 64.8 65.1 65.9 65.0 64.7 63.8 10.3 Belgium ............................................................................. 5,925 6,997 6,927 8,080 7,110 7,169 1.4 1.5 1.5 1.6 1.3 1.2 0.8 Denmark............................................................................ 1,188 2,738 3,019 3,117 2,114 3,215 0.3 0.6 0.6 0.6 0.4 0.5 52.1 Finland .............................................................................. (D) 3,877 3,709 3,731 3,758 4,155 (D) 0.8 0.8 0.7 0.7 0.7 10.6 France ............................................................................... 35,444 40,947 41,186 44,026 49,867 58,937 8.5 8.9 8.7 8.6 9.1 9.6 18.2 Germany ........................................................................... 46,882 59,434 63,242 64,977 65,379 67,918 11.2 12.9 13.3 12.7 11.9 11.0 3.9 Ireland ............................................................................... 3,109 3,291 3,226 3,525 4,122 5,996 0.7 0.7 0.7 0.7 0.7 1.0 45.5 Italy.................................................................................... 4,665 5,824 5,380 6,354 7,487 9,321 1.1 1.3 1.1 1.2 1.4 1.5 24.5 Netherlands....................................................................... 36,188 39,102 43,327 41,686 44,546 45,784 8.7 8.5 9.1 8.2 8.1 7.4 2.8 Sweden ............................................................................. 10,803 11,972 12,088 12,086 12,681 11,206 2.6 2.6 2.5 2.4 2.3 1.8 –11.6 Switzerland........................................................................ 29,097 30,809 31,217 33,646 36,680 50,113 7.0 6.7 6.6 6.6 6.7 8.2 36.6 United Kingdom................................................................. 89,151 90,124 94,230 105,032 113,929 120,265 21.4 19.6 19.8 20.5 20.7 19.6 5.6 Other ................................................................................. (D) 4,850 5,501 6,189 8,011 8,358 (D) 1.1 1.2 1.2 1.5 1.4 4.3
Latin America and Other Western Hemisphere ................ 30,075 36,737 34,453 38,832 41,112 50,030 7.2 8.0 7.3 7.6 7.5 8.1 21.7 Bermuda............................................................................ 14,949 21,745 18,541 21,449 21,313 25,438 3.6 4.7 3.9 4.2 3.9 4.1 19.4 Mexico ............................................................................... 2,660 3,299 2,964 3,195 4,835 5,914 0.6 0.7 0.6 0.6 0.9 1.0 22.3 United Kingdom Islands, Caribbean.................................. 2,022 1,995 2,487 2,230 3,035 4,484 0.5 0.4 0.5 0.4 0.6 0.7 47.7 Venezuela.......................................................................... (D) (D) (D) (D) (D) (D) (D) (D) (D) (D) (D) (D) n.a. Other ................................................................................. (D) (D) (D) (D) (D) (D) (D) (D) (D) (D) (D) (D) n.a.
Africa .................................................................................... (D) 981 916 1,135 953 1,086 (D) 0.2 0.2 0.2 0.2 0.2 13.9
Middle East .......................................................................... 8,308 7,439 8,391 9,511 10,169 12,729 2.0 1.6 1.8 1.9 1.9 2.1 25.2 Saudi Arabia...................................................................... 6,307 5,105 5,615 6,415 6,821 7,064 1.5 1.1 1.2 1.3 1.2 1.1 3.6 Other ................................................................................. 2,000 2,334 2,776 3,096 3,348 5,665 0.5 0.5 0.6 0.6 0.6 0.9 69.2
Asia and Pacific ................................................................... 69,960 74,947 77,155 82,082 85,694 93,625 16.8 16.3 16.2 16.0 15.6 15.2 9.3 Australia ............................................................................ 6,224 6,565 8,121 9,315 6,995 7,992 1.5 1.4 1.7 1.8 1.3 1.3 14.3 Japan................................................................................. 57,735 61,099 62,168 65,032 70,064 75,800 13.8 13.3 13.1 12.7 12.7 12.3 8.2 Korea, Republic of ............................................................. 1,303 2,094 1,993 2,342 2,238 2,785 0.3 0.5 0.4 0.5 0.4 0.5 24.5 Other ................................................................................. 4,698 5,188 4,873 5,394 6,398 7,047 1.1 1.1 1.0 1.1 1.2 1.1 10.1
United States ....................................................................... (D) 5,044 5,608 7,233 7,855 8,041 (D) 1.1 1.2 1.4 1.4 1.3 2.4
D suppressed to avoid disclosure of data of individual companies. n.a. Not available.

189 August 2008 SURVEY OF CURRENT BUSINESS
CharChartt 2.2. InInvesting-Countrvesting-Countryy Shares ofShares of VVaaluelue AdAdded of Uded of U.S..S. Affiliates,Affiliates, 20062006
Percent
Canada (9.2%)
Other (22.6%) France (9.6%)
Germany (11.0%)
Japan (12.3%)
Netherlands (7.4%)
Switzerland (8.2%)
United Kingdom (19.6%)
U.S. Bureau of Economic Analysis
driven largely by increases in transportation and warehousing and in wholesale trade. The increase by affiliates with UBOs in the United Kingdom Islands, Caribbean was mainly due to increases in finance and in support services for oil and gas extraction. The growth in value added by Irish-owned affiliates reflected acquisitions, including acquisitions of U.S. affiliates from foreign investors in other UBO countries. Value added also rose substantially for affiliates with UBOs in Israel, Bahrain, Kuwait, and the United Arab Emirates (included in “Other” under Middle East in table 2), partly as a result of new investments. Value added of affiliates with UBOs in Sweden fell 12 percent in 2006 because of selloffs of subsidiaries by several affiliates.
By industry of UBO In 2006, affiliates whose UBOs were private entities accounted for over 97 percent of total U.S. affiliate value
added (table 3). The remaining 3 percent was accounted for by affiliates owned by government or government-related enterprises. Of the affiliates owned by private entities, those whose UBOs were businesses accounted for 88 percent of total affiliate value added, and those whose UBOs were individuals, estates, or trusts accounted for 9 percent.
By industry of affiliate In 2006, manufacturing continued to account for the largest share of affiliate value added (43 percent); however, the share was down slightly from 2005 (45 percent) and continued a downward trend that began in the late 1990s (table 4). Wholesale trade, which includes several affiliates that also have substantial secondary operations in manufacturing, accounted for the second-largest share of affiliate value added (17 percent) and was also down slightly from 2005 (from 18 percent).5 Among other sectors, the share of affiliate
5. Each U.S. affiliate is classified in the industry that accounts for the largest portion of its sales; however, many large affiliates are involved in a variety of business activities. Changes in the mix of these activities may result in changes in an affiliate’s industry classification.
Data Availability This article summarizes the preliminary statistics from the 2006 annual survey of foreign direct investment in the United States. More detailed statistics will be posted this fall in files that can be downloaded at no charge from BEA’s Web site at <www.bea.gov>. Revised estimates will be released in 2009.
Detailed statistics on U.S. affiliate operations for 1977–2006 are also available on BEA’s Web site.
For more information on these products and how to access them, see the guide to BEA information on direct investment at <www.bea.gov>.
Table 3. Value Added of Majority-Owned Nonbank U.S. Affiliates by Industry of Ultimate Beneficial Owner, 2002–2006
Millions of dollars Percentage of all-industries total
2002 2003 2004 2005 2006 2002 2003 2004 2005 2006
All industries.............................................................. 460,609 475,062 511,474 549,569 614,685 100.0 100.0 100.0 100.0 100.0
Government and government-related entities ....................... 13,626 15,755 17,356 16,437 17,332 3.0 3.3 3.4 3.0 2.8
Individuals, estates, and trusts .............................................. 39,619 42,400 45,173 50,091 56,944 8.6 8.9 8.8 9.1 9.3
Mining.................................................................................... 16,121 19,597 22,467 23,615 26,954 3.5 4.1 4.4 4.3 4.4
Manufacturing........................................................................ 252,240 248,078 260,507 276,912 294,783 54.8 52.2 50.9 50.4 48.0
Wholesale and retail trade .................................................... 31,483 32,433 35,418 37,176 42,245 6.8 6.8 6.9 6.8 6.9
Information ............................................................................ 19,144 19,548 22,282 19,489 27,899 4.2 4.1 4.4 3.5 4.5
Depository institutions and bank holding companies ............ 8,631 6,788 9,259 11,065 11,864 1.9 1.4 1.8 2.0 1.9
Finance (except depository institutions) and insurance ........ 8,712 18,489 18,718 22,123 31,929 1.9 3.9 3.7 4.0 5.2
Professional, scientific, and technical services ..................... 13,076 13,726 16,170 19,825 23,109 2.8 2.9 3.2 3.6 3.8
Other ..................................................................................... 44,331 42,494 64,124 72,836 81,625 9.6 8.9 12.5 13.3 13.3

190 U.S. Affiliates of Foreign Companies August 2008
value added accounted for by affiliates in finance (except banks) and insurance increased the most, from 5 percent in 2005 to 7 percent in 2006.
Value added by manufacturing affiliates rose 8 percent in 2006, from $246.2 billion to $266.9 billion. More than half of the increase was in computers and electronic products and in chemicals. In computers and electronic products, value added grew 26 percent, driven largely by acquisitions. In chemicals, value added grew 19 percent, driven largely by expanded production by existing affiliates.
Outside of manufacturing, value added growth was
Acknowledgments The 2006 annual survey of foreign direct investment in the United States was conducted under the direction of Patricia E. Abaroa. Charles R. Gravitz supervised the processing of the survey. The following staff contributed to the processing and editing of the survey reports: George M. Bogachevsky, Chester C. Bra-ham, Polly Y. Cheung, Karen M. Dennison, Constance T. Deve, Lonnie Hunter, Nazre Jamil, Julie A. Lampe, Marites R. Lucero, Emelia A. Marfo-Sarbeng, Demetria A. McCormick, Gregory L. McCormick, Sreedhar Pidathala, Makia M. Riley, Ronald L. Ross, Clarence D. Smith, John R. Starnes, and Christopher J. Stein.
Computer programming for data estimation and for the generation of tables was provided by Tara L. O’Brien, Neeta B. Kapoor, and Karen E. Poffel.
strong in finance (except banks) and insurance (41 percent), real estate and rental and leasing (27 percent), and information (16 percent). In finance (except banks) and insurance, the increase was largely attributable to securities and insurance affiliates. In real estate and rental and leasing, the increase was mostly accounted for by affiliates in commercial real estate. In information, the increase was accounted for by existing affiliates and the reclassification of some affiliates from other industries into information due to changes in the industry composition of their sales.
Employment In 2006, employment by affiliates rose 2.5 percent, to 5,331,000 employees, following an increase of 1.4 percent in 2005. The increase in 2005 was the first since 2000. Despite these increases, employment by affiliates in 2006 was still 326,000 employees below the peak level of 5,657,000 reached in 2000. Total U.S. employment by nonbank private enterprises also rose in 2006 but at a slightly slower pace, 1.9 percent. As a consequence, the share of U.S. private industry employment accounted for by affiliates edged up from 4.5 percent in 2005 to 4.6 percent in 2006. Like the level of employment, the share of U.S. employment accounted for by affiliates remained below the 5.0 percent peak recorded in 2000.
By industry As has been the case for many years, the U.S. affiliate share of employment at the sector level in 2006 was
Table 4. Value Added of Majority-Owned Nonbank U.S. Affiliates by Industry of Affiliate, 2001–2006
Millions of dollars Percentage of all-industries total Addendum: Percent
change in affiliate
value added, 2006
2001 2002 2003 2004 2005 2006 2001 2002 2003 2004 2005 2006
All industries ................................................... 417,122 460,609 475,062 511,474 549,569 614,685 100.0 100.0 100.0 100.0 100.0 100.0 11.8
Manufacturing.............................................................. 200,506 229,245 220,637 226,992 246,159 266,893 48.1 49.8 46.4 44.4 44.8 43.4 8.4 Food .......................................................................... 10,832 14,303 9,268 12,897 15,037 15,466 2.6 3.1 2.0 2.5 2.7 2.5 2.9 Beverages and tobacco products .............................. (D) 5,678 7,142 6,287 7,425 8,555 (D) 1.2 1.5 1.2 1.4 1.4 15.2 Petroleum and coal products..................................... (D) (D) 18,373 21,397 22,161 22,483 (D) (D) 3.9 4.2 4.0 3.7 1.5 Chemicals ................................................................. 39,512 45,034 47,307 45,290 49,753 58,953 9.5 9.8 10.0 8.9 9.1 9.6 18.5 Plastics and rubber products..................................... 7,636 9,460 9,553 9,596 10,687 10,586 1.8 2.1 2.0 1.9 1.9 1.7 –0.9 Nonmetallic mineral products .................................... 14,367 15,144 14,913 16,351 19,188 21,739 3.4 3.3 3.1 3.2 3.5 3.5 13.3 Primary metals .......................................................... 8,254 5,590 4,029 9,584 12,986 12,244 2.0 1.2 0.8 1.9 2.4 2.0 –5.7 Fabricated metal products ......................................... 6,382 7,390 7,767 5,897 7,017 7,054 1.5 1.6 1.6 1.2 1.3 1.1 0.5 Machinery.................................................................. 19,077 21,055 19,712 21,744 19,845 13,667 4.6 4.6 4.1 4.3 3.6 2.2 –31.1 Computers and electronic products .......................... 21,004 23,082 18,782 12,938 16,082 20,198 5.0 5.0 4.0 2.5 2.9 3.3 25.6 Electrical equipment, appliances, and components .. 12,536 4,481 5,235 5,150 7,874 13,563 3.0 1.0 1.1 1.0 1.4 2.2 72.3 Transportation equipment.......................................... 29,048 36,848 34,800 35,623 34,251 37,461 7.0 8.0 7.3 7.0 6.2 6.1 9.4 Other ......................................................................... (D) (D) 23,755 24,237 23,854 24,923 (D) (D) 5.0 4.7 4.3 4.1 4.5
Wholesale trade........................................................... 81,462 75,657 86,568 97,947 99,689 106,868 19.5 16.4 18.2 19.2 18.1 17.4 7.2 Petroleum and petroleum products ........................... (D) 27,138 30,290 33,305 31,707 32,962 (D) 5.9 6.4 6.5 5.8 5.4 4.0 Other ......................................................................... (D) 48,519 56,278 64,642 67,982 73,907 (D) 10.5 11.8 12.6 12.4 12.0 8.7
Retail trade .................................................................... 24,800 26,486 27,843 29,362 30,862 31,822 5.9 5.8 5.9 5.7 5.6 5.2 3.1
Information .................................................................... 8,247 24,297 26,049 30,326 28,814 33,360 2.0 5.3 5.5 5.9 5.2 5.4 15.8
Finance (except depository institutions) and insurance 17,305 15,216 22,961 25,280 29,053 40,914 4.1 3.3 4.8 4.9 5.3 6.7 40.8
Real estate and rental and leasing................................ 9,502 9,647 9,928 12,192 12,582 15,955 2.3 2.1 2.1 2.4 2.3 2.6 26.8
Professional, scientific, and technical services ............. 14,923 16,426 16,694 19,075 20,186 22,531 3.6 3.6 3.5 3.7 3.7 3.7 11.6
Other industries............................................................. 60,377 63,634 64,383 70,298 82,224 96,342 14.5 13.8 13.6 13.7 15.0 15.7 17.2
D Suppressed to avoid disclosure of data of individual companies.

191 August 2008 SURVEY OF CURRENT BUSINESS
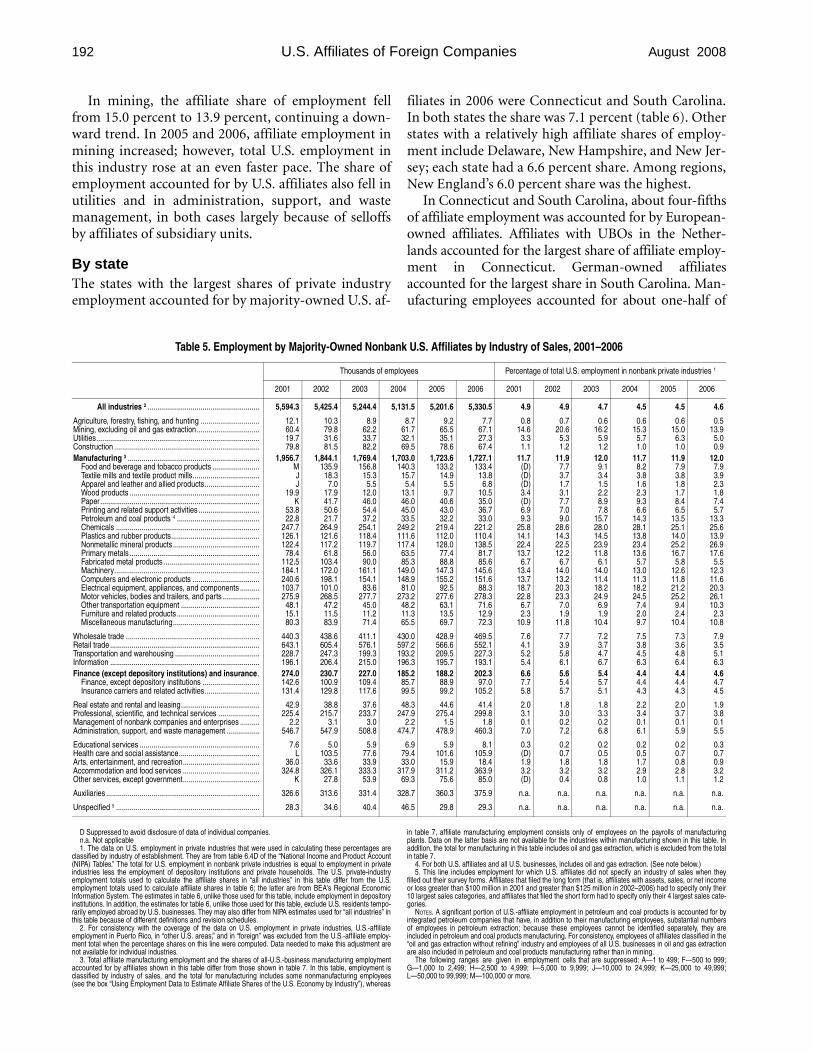
highest in mining (13.9 percent) (table 5).6 Affiliates also accounted for a relatively high share of employment in manufacturing (12.0 percent) and wholesale trade (7.9 percent). In contrast, affiliates accounted for very small shares of employment in service-oriented industries such as educational services (0.3 percent) and health care and social assistance (0.7 percent).
In manufacturing, the U.S. affiliate share edged up for a second consecutive year, from 11.9 percent to 12.0 percent, as affiliate employment in manufacturing rose in the face of a decrease in total U.S. manufacturing employment. The share of employment accounted for by affiliates rose in several manufacturing industries, notably nonmetallic mineral products, primary metals, and other transportation equipment. In nonmetallic mineral products, the share rose from 25.2 percent in 2005 to 26.9 percent in 2006, partially as a
6. The estimates of U.S.-affiliate employment shares are derived from data on affiliate employment broken down by industry of sales, a basis which approximates the establishment-based disaggregation of the corresponding data for all U.S. businesses. See the box “Using Employment Data to Estimate Affiliate Shares of the U.S. Economy by Industry.” Because employment by industry of sales more precisely reflects the industrial composition of affiliate business activities than data by industry of affiliate, the industry presentation in this section is more detailed than that presented in the section on value added by industry of affiliate.
result of expansion by existing affiliates in the cement industry. In primary metals, the share rose from 16.7 percent to 17.6 percent, because of both the expansion of existing affiliates and the entry of new affiliates into the iron and steel industry. In other transportation equipment, the share rose from 9.4 percent to 10.3 percent, largely because of expansions by existing affiliates in aerospace product and parts manufacturing.
Outside of manufacturing, affiliate shares of employment also increased in several sectors. In wholesale trade, the share rose from 7.3 percent to 7.9 percent because of the entry of new affiliates and the acquisitions of U.S. companies by existing affiliates. In transportation and warehousing, the share grew from 4.8 percent to 5.1 percent, because of expansions by existing affiliates and the entry of several new affiliates in the transit and ground passenger transportation industries. In accommodation and food services, the share rose from 2.8 percent to 3.2 percent as a result of acquisitions by existing affiliates in food services. In professional, scientific and technical services, the share rose from 3.7 percent to 3.8 percent, continuing a several years long trend. The largest increases in this industry were among affiliates in computer system design and related services.
Using Employment Data to Estimate Affiliate Shares of the U.S. Economy by Industry The data on employment are used to estimate affiliate In the classification by industry of sales, the data on shares of the U.S. economy by industry on the basis of the affiliate employment and sales are distributed among all North American Industry Classification System (NAICS) of the industries in which the affiliate reports sales. As a because these data can be disaggregated by industry of result, employment classified by industry of sales should sales, a basis that approximates the disaggregation of the approximate that classified by industry of establishment data for all U.S. businesses by industry of establishment.1 (or plant), because an affiliate that has an establishment Thus, using the data on affiliate employment, the affiliate in an industry usually also has sales in that industry.3
shares of the U.S. economy can be calculated at a greater In contrast, in the classification by industry of affiliate, level of industry detail than is possible using the value- all of the operations data (including the employment added estimates or other data, which can only be disag- data) for an affiliate are assigned to that affiliate’s “prigregated on the basis of industry of affiliate.2 mary” industry—that is, the industry in which it has the
most sales.4 As a result, any affiliate operations that take place in secondary industries will be classified as opera
1. The data for all U.S. businesses used to compute the affiliate shares tions in the primary industry. of employment by NAICS industry are from the national income and
product accounts (see table 5, footnote 1). 2. Establishment-level data from a joint project of BEA and the Cen- 3. An exception is the case where one establishment of an affiliate pro
sus Bureau can be used to calculate affiliate shares at an even greater vides all of its output to another establishment of that affiliate. For level of detail. For affiliate shares based on establishment data for six- example, if an affiliate operates both a metal mine and a metal-manudigit manufacturing and five-digit nonmanufacturing NAICS indus- facturing plant and if the entire output of the mine is used by the man-tries for 2002, see Foreign Direct Investment in the United States: Estab- ufacturing plant, all of the affiliate’s sales would be in metal lishment Data for 2002. Similar data on a NAICS basis are available for manufacturing, and none, in metal mining. Thus, when the affiliate’s 1997, and data on a Standard Industrial Classification basis are available employment is distributed by industry of sales, all of it would be classifor 1987 and 1992. Data for manufacturing industries only are available fied in manufacturing, even though some of the employees work in an for 1988–91. These publications and SURVEY articles that analyze these establishment in mining. data are available on the BEA’s Web site at <www.bea.gov>, under 4. An affiliate’s primary industry is based on a breakdown of the affil“Operations of Multinational Companies” and then under “Product iates sales by BEA’s NAICS-based International Surveys Industry classi-Guide for Foreign Direct Investment in the United States.” fication.
192 U.S. Affiliates of Foreign Companies August 2008
In mining, the affiliate share of employment fell from 15.0 percent to 13.9 percent, continuing a downward trend. In 2005 and 2006, affiliate employment in mining increased; however, total U.S. employment in this industry rose at an even faster pace. The share of employment accounted for by U.S. affiliates also fell in utilities and in administration, support, and waste management, in both cases largely because of selloffs by affiliates of subsidiary units.
By state The states with the largest shares of private industry employment accounted for by majority-owned U.S. af
filiates in 2006 were Connecticut and South Carolina. In both states the share was 7.1 percent (table 6). Other states with a relatively high affiliate shares of employment include Delaware, New Hampshire, and New Jersey; each state had a 6.6 percent share. Among regions, New England’s 6.0 percent share was the highest.
In Connecticut and South Carolina, about four-fifths of affiliate employment was accounted for by European-owned affiliates. Affiliates with UBOs in the Netherlands accounted for the largest share of affiliate employment in Connecticut. German-owned affiliates accounted for the largest share in South Carolina. Manufacturing employees accounted for about one-half of
Table 5. Employment by Majority-Owned Nonbank U.S. Affiliates by Industry of Sales, 2001–2006
Thousands of employees Percentage of total U.S. employment in nonbank private industries 1
2001 2002 2003 2004 2005 2006 2001 2002 2003 2004 2005 2006
All industries 2 ......................................................... 5,594.3 5,425.4 5,244.4 5,131.5 5,201.6 5,330.5 4.9 4.9 4.7 4.5 4.5 4.6
Agriculture, forestry, fishing, and hunting .............................. 12.1 10.3 8.9 8.7 9.2 7.7 0.8 0.7 0.6 0.6 0.6 0.5 Mining, excluding oil and gas extraction................................ 60.4 79.8 62.2 61.7 65.5 67.1 14.6 20.6 16.2 15.3 15.0 13.9 Utilities................................................................................... 19.7 31.6 33.7 32.1 35.1 27.3 3.3 5.3 5.9 5.7 6.3 5.0 Construction .......................................................................... 79.8 81.5 82.2 69.5 78.6 67.4 1.1 1.2 1.2 1.0 1.0 0.9 Manufacturing 3 ................................................................... 1,956.7 1,844.1 1,769.4 1,703.0 1,723.6 1,727.1 11.7 11.9 12.0 11.7 11.9 12.0
Food and beverage and tobacco products ........................ M 135.9 156.8 140.3 133.2 133.4 (D) 7.7 9.1 8.2 7.9 7.9 Textile mills and textile product mills.................................. J 18.3 15.3 15.7 14.9 13.8 (D) 3.7 3.4 3.8 3.8 3.9 Apparel and leather and allied products............................ J 7.0 5.5 5.4 5.5 6.8 (D) 1.7 1.5 1.6 1.8 2.3 Wood products .................................................................. 19.9 17.9 12.0 13.1 9.7 10.5 3.4 3.1 2.2 2.3 1.7 1.8 Paper................................................................................. K 41.7 46.0 46.0 40.6 35.0 (D) 7.7 8.9 9.3 8.4 7.4 Printing and related support activities ............................... 53.8 50.6 54.4 45.0 43.0 36.7 6.9 7.0 7.8 6.6 6.5 5.7 Petroleum and coal products 4 .......................................... 22.8 21.7 37.2 33.5 32.2 33.0 9.3 9.0 15.7 14.3 13.5 13.3 Chemicals ......................................................................... 247.7 264.9 254.1 249.2 219.4 221.2 25.8 28.6 28.0 28.1 25.1 25.6 Plastics and rubber products............................................. 126.1 121.6 118.4 111.6 112.0 110.4 14.1 14.3 14.5 13.8 14.0 13.9 Nonmetallic mineral products ............................................ 122.4 117.2 119.7 117.4 128.0 138.5 22.4 22.5 23.9 23.4 25.2 26.9 Primary metals .................................................................. 78.4 61.8 56.0 63.5 77.4 81.7 13.7 12.2 11.8 13.6 16.7 17.6 Fabricated metal products ................................................. 112.5 103.4 90.0 85.3 88.8 85.6 6.7 6.7 6.1 5.7 5.8 5.5 Machinery.......................................................................... 184.1 172.0 161.1 149.0 147.3 145.6 13.4 14.0 14.0 13.0 12.6 12.3 Computers and electronic products .................................. 240.6 198.1 154.1 148.9 155.2 151.6 13.7 13.2 11.4 11.3 11.8 11.6 Electrical equipment, appliances, and components .......... 103.7 101.0 83.6 81.0 92.5 88.3 18.7 20.3 18.2 18.2 21.2 20.3 Motor vehicles, bodies and trailers, and parts................... 275.9 268.5 277.7 273.2 277.6 278.3 22.8 23.3 24.9 24.5 25.2 26.1 Other transportation equipment ........................................ 48.1 47.2 45.0 48.2 63.1 71.6 6.7 7.0 6.9 7.4 9.4 10.3 Furniture and related products .......................................... 15.1 11.5 11.2 11.3 13.5 12.9 2.3 1.9 1.9 2.0 2.4 2.3 Miscellaneous manufacturing............................................ 80.3 83.9 71.4 65.5 69.7 72.3 10.9 11.8 10.4 9.7 10.4 10.8
Wholesale trade .................................................................... 440.3 438.6 411.1 430.0 428.9 469.5 7.6 7.7 7.2 7.5 7.3 7.9 Retail trade ............................................................................ 643.1 605.4 576.1 597.2 566.6 552.1 4.1 3.9 3.7 3.8 3.6 3.5 Transportation and warehousing ........................................... 228.7 247.3 199.3 193.2 209.5 227.3 5.2 5.8 4.7 4.5 4.8 5.1 Information ............................................................................ 196.1 206.4 215.0 196.3 195.7 193.1 5.4 6.1 6.7 6.3 6.4 6.3 Finance (except depository institutions) and insurance. 274.0 230.7 227.0 185.2 188.2 202.3 6.6 5.6 5.4 4.4 4.4 4.6
Finance, except depository institutions ............................. 142.6 100.9 109.4 85.7 88.9 97.0 7.7 5.4 5.7 4.4 4.4 4.7 Insurance carriers and related activities............................ 131.4 129.8 117.6 99.5 99.2 105.2 5.8 5.7 5.1 4.3 4.3 4.5
Real estate and rental and leasing........................................ 42.9 38.8 37.6 48.3 44.6 41.4 2.0 1.8 1.8 2.2 2.0 1.9 Professional, scientific, and technical services ..................... 225.4 215.7 233.7 247.9 275.4 299.8 3.1 3.0 3.3 3.4 3.7 3.8 Management of nonbank companies and enterprises .......... 2.2 3.1 3.0 2.2 1.5 1.8 0.1 0.2 0.2 0.1 0.1 0.1 Administration, support, and waste management ................. 546.7 547.9 508.8 474.7 478.9 460.3 7.0 7.2 6.8 6.1 5.9 5.5
Educational services ............................................................. 7.6 5.0 5.9 6.9 5.9 8.1 0.3 0.2 0.2 0.2 0.2 0.3 Health care and social assistance......................................... L 103.5 77.6 79.4 101.6 105.9 (D) 0.7 0.5 0.5 0.7 0.7 Arts, entertainment, and recreation....................................... 36.0 33.6 33.9 33.0 15.9 18.4 1.9 1.8 1.8 1.7 0.8 0.9 Accommodation and food services ....................................... 324.8 326.1 333.3 317.9 311.2 363.9 3.2 3.2 3.2 2.9 2.8 3.2 Other services, except government....................................... K 27.8 53.9 69.3 75.6 85.0 (D) 0.4 0.8 1.0 1.1 1.2
Auxiliaries .............................................................................. 326.6 313.6 331.4 328.7 360.3 375.9 n.a. n.a. n.a. n.a. n.a. n.a.
Unspecified 5 ......................................................................... 28.3 34.6 40.4 46.5 29.8 29.3 n.a. n.a. n.a. n.a. n.a. n.a.
D Suppressed to avoid disclosure of data of individual companies. n.a. Not applicable 1. The data on U.S. employment in private industries that were used in calculating these percentages are
classified by industry of establishment. They are from table 6.4D of the “National Income and Product Account (NIPA) Tables.” The total for U.S. employment in nonbank private industries is equal to employment in private industries less the employment of depository institutions and private households. The U.S. private-industry employment totals used to calculate the affiliate shares in “all industries” in this table differ from the U.S. employment totals used to calculate affiliate shares in table 6; the latter are from BEA’s Regional Economic Information System. The estimates in table 6, unlike those used for this table, include employment in depository institutions. In addition, the estimates for table 6, unlike those used for this table, exclude U.S. residents temporarily employed abroad by U.S. businesses. They may also differ from NIPA estimates used for “all industries” in this table because of different definitions and revision schedules.
2. For consistency with the coverage of the data on U.S. employment in private industries, U.S.-affiliate employment in Puerto Rico, in “other U.S. areas,” and in “foreign” was excluded from the U.S.-affiliate employment total when the percentage shares on this line were computed. Data needed to make this adjustment are not available for individual industries.
3. Total affiliate manufacturing employment and the shares of all-U.S.-business manufacturing employment accounted for by affiliates shown in this table differ from those shown in table 7. In this table, employment is classified by industry of sales, and the total for manufacturing includes some nonmanufacturing employees (see the box “Using Employment Data to Estimate Affiliate Shares of the U.S. Economy by Industry”), whereas
in table 7, affiliate manufacturing employment consists only of employees on the payrolls of manufacturing plants. Data on the latter basis are not available for the industries within manufacturing shown in this table. In addition, the total for manufacturing in this table includes oil and gas extraction, which is excluded from the total in table 7.
4. For both U.S. affiliates and all U.S. businesses, includes oil and gas extraction. (See note below.) 5. This line includes employment for which U.S. affiliates did not specify an industry of sales when they
filled out their survey forms. Affiliates that filed the long form (that is, affiliates with assets, sales, or net income or loss greater than $100 million in 2001 and greater than $125 million in 2002–2006) had to specify only their 10 largest sales categories, and affiliates that filed the short form had to specify only their 4 largest sales categories.
NOTES. A significant portion of U.S.-affiliate employment in petroleum and coal products is accounted for by integrated petroleum companies that have, in addition to their manufacturing employees, substantial numbers of employees in petroleum extraction; because these employees cannot be identified separately, they are included in petroleum and coal products manufacturing. For consistency, employees of affiliates classified in the “oil and gas extraction without refining” industry and employees of all U.S. businesses in oil and gas extraction are also included in petroleum and coal products manufacturing rather than in mining.
The following ranges are given in employment cells that are suppressed: A—1 to 499; F—500 to 999; G—1,000 to 2,499; H—2,500 to 4,999; I—5,000 to 9,999; J—10,000 to 24,999; K—25,000 to 49,999; L—50,000 to 99,999; M—100,000 or more.

193 August 2008 SURVEY OF CURRENT BUSINESS
the employment by affiliates in South Carolina but ac- 16,100, or 8 percent, largely as a result of acquisitions by counted for only about one-fourth of the employment affiliates in manufacturing and finance. In Illinois, em-by affiliates in Connecticut (table 7). ployment rose by 14,500, or 6 percent, mainly as a result
About four-fifths of the states recorded gains in em- of acquisitions made by existing affiliates in manufacployment by affiliates in 2006, notably Florida, Illinois, turing. and New Jersey. In Florida, affiliate employment rose by Employment by affiliates declined in a few states. 17,300, or 8 percent, mainly as a result of acquisitions by The largest declines were in Oregon and Rhode Island. existing U.S. affiliates in cement manufacturing and In Oregon, employment by affiliates fell 6,700, or 13 wholesale trade. In New Jersey, employment rose by percent, largely as a result of cutbacks in employment
Table 6. Employment by Majority-Owned Nonbank U.S. Affiliates by State, 2001–2006
Thousands of employees Percentage of total private industry employment in the state or area 1
2001 2002 2003 2004 2005 2006 2001 2002 2003 2004 2005 2006
Total 2.................................................... 5,594.3 5,425.4 5,244.4 5,131.5 5,201.6 5,330.5 4.9 4.8 4.7 4.5 4.5 4.5 New England........................................................ 435.3 419.2 401.4 390.5 363.5 368.8 7.0 6.8 6.6 6.4 5.9 6.0
Connecticut ....................................................... 117.4 111.0 105.5 102.1 102.0 104.9 7.9 7.6 7.3 7.0 7.0 7.1 Maine ................................................................ 32.8 31.7 29.4 28.4 24.4 24.4 6.4 6.2 5.7 5.5 4.7 4.7 Massachusetts .................................................. 209.9 196.9 188.4 182.0 167.2 173.0 7.0 6.7 6.5 6.3 5.8 5.9 New Hampshire................................................. 41.0 41.1 41.7 40.8 35.7 37.1 7.4 7.5 7.7 7.4 6.4 6.6 Rhode Island ..................................................... 23.5 27.5 26.1 26.3 24.3 19.5 5.6 6.5 6.1 6.1 5.6 4.5 Vermont............................................................. 10.7 11.1 10.3 11.0 9.9 9.8 4.1 4.3 4.0 4.2 3.8 3.7
Mideast ................................................................. 1,042.2 996.1 988.1 968.7 993.1 1,015.5 5.6 5.4 5.4 5.2 5.3 5.4 Delaware ........................................................... 24.4 22.4 28.1 27.5 25.4 25.2 6.6 6.1 7.7 7.3 6.7 6.6 District of Columbia ........................................... 17.7 17.4 15.8 15.1 16.9 17.3 3.9 3.8 3.5 3.3 3.6 3.6 Maryland ........................................................... 106.4 105.4 102.9 100.6 105.2 104.1 5.1 5.1 5.0 4.8 4.9 4.8 New Jersey........................................................ 239.4 228.3 224.0 218.4 214.4 230.5 6.9 6.7 6.6 6.4 6.2 6.6 New York ........................................................... 415.5 386.8 384.2 380.5 388.6 389.3 5.7 5.4 5.4 5.3 5.4 5.3 Pennsylvania ..................................................... 238.7 235.8 233.1 226.5 242.6 249.0 4.7 4.7 4.7 4.5 4.8 4.8
Great Lakes.......................................................... 941.0 920.3 895.5 864.2 871.5 886.9 4.9 4.9 4.8 4.6 4.7 4.7 Illinois ................................................................ 274.2 262.9 252.5 232.4 228.6 243.1 5.2 5.1 4.9 4.5 4.4 4.7 Indiana .............................................................. 142.0 133.2 134.7 133.7 143.1 148.0 5.5 5.2 5.3 5.2 5.5 5.7 Michigan............................................................ 204.7 202.9 204.6 202.4 202.4 195.5 5.2 5.2 5.4 5.3 5.3 5.2 Ohio................................................................... 220.8 214.2 208.0 207.8 211.3 213.3 4.5 4.5 4.4 4.4 4.5 4.5 Wisconsin.......................................................... 99.3 107.1 95.6 87.9 86.2 87.2 4.1 4.4 4.0 3.6 3.5 3.5
Plains.................................................................... 300.1 284.8 276.1 270.2 282.2 292.6 3.8 3.4 3.3 3.2 3.3 3.4 Iowa................................................................... 38.8 36.6 38.7 37.4 39.5 40.2 3.1 3.0 3.1 3.0 3.1 3.1 Kansas .............................................................. 36.0 34.9 31.4 31.9 41.9 46.5 3.2 3.1 2.9 2.9 3.7 4.1 Minnesota.......................................................... 87.8 88.1 85.5 85.2 84.8 86.5 3.7 3.8 3.7 3.6 3.6 3.6 Missouri............................................................. 102.7 91.5 87.2 84.0 82.7 85.7 4.4 3.9 3.8 3.6 3.5 3.6 Nebraska........................................................... 20.1 18.7 19.0 19.8 18.0 18.7 2.6 2.4 2.5 2.6 2.3 2.4 North Dakota..................................................... 8.2 7.4 7.8 6.3 7.2 8.3 3.1 2.8 2.9 2.3 2.6 2.9 South Dakota .................................................... 6.6 7.6 6.5 5.6 8.0 6.7 2.1 2.4 2.1 1.8 2.5 2.0
Southeast............................................................. 1,393.8 1,361.3 1,314.5 1,284.7 1,278.7 1,329.8 5.1 5.1 4.9 4.7 4.6 4.6 Alabama ............................................................ 75.5 75.1 72.6 72.4 69.6 73.6 4.7 4.8 4.6 4.5 4.3 4.4 Arkansas ........................................................... 35.8 35.7 32.2 31.5 33.8 33.7 3.6 3.6 3.3 3.2 3.4 3.3 Florida ............................................................... 257.7 252.1 247.8 237.6 230.7 248.0 4.0 3.9 3.8 3.6 3.3 3.5 Georgia ............................................................. 195.0 191.2 183.9 177.5 167.7 173.6 5.7 5.7 5.6 5.3 4.9 4.9 Kentucky............................................................ 90.9 88.4 87.9 86.1 86.7 91.0 6.0 5.9 5.9 5.7 5.6 5.8 Louisiana........................................................... 51.1 50.5 49.2 50.4 53.3 49.7 3.2 3.2 3.1 3.2 3.4 3.2 Mississippi......................................................... 21.5 25.8 21.7 25.4 25.4 25.7 2.3 2.8 2.4 2.8 2.8 2.7 North Carolina................................................... 223.0 214.8 203.8 199.2 200.1 209.4 6.7 6.6 6.3 6.1 6.0 6.1 South Carolina .................................................. 129.1 133.0 126.8 121.9 110.6 114.3 8.4 8.7 8.3 7.9 7.0 7.1 Tennessee......................................................... 134.2 130.1 128.5 129.5 134.2 140.3 5.7 5.6 5.5 5.5 5.6 5.7 Virginia .............................................................. 154.5 141.9 138.9 134.8 145.7 150.8 5.3 4.9 4.8 4.5 4.8 4.9 West Virginia ..................................................... 25.7 22.7 21.4 18.4 20.9 19.9 4.4 3.9 3.8 3.2 3.6 3.4
Southwest ............................................................ 484.7 457.0 444.4 448.0 476.7 489.4 4.1 3.9 3.8 3.8 3.9 3.8 Arizona .............................................................. 57.0 57.5 58.0 64.2 68.5 71.1 2.9 3.0 3.0 3.1 3.2 3.1 New Mexico....................................................... 13.5 12.8 11.6 12.7 13.3 14.2 2.3 2.2 2.0 2.1 2.1 2.2 Oklahoma.......................................................... 40.0 33.9 34.5 32.9 36.0 35.9 3.3 2.8 2.9 2.8 3.0 2.9 Texas ................................................................. 374.2 352.8 340.3 338.2 358.9 368.2 4.6 4.4 4.3 4.2 4.3 4.3
Rocky Mountain .................................................. 136.2 136.8 131.8 131.1 134.4 138.3 3.5 3.6 3.5 3.4 3.4 3.3 Colorado............................................................ 81.3 77.7 72.3 71.7 73.8 75.9 4.2 4.1 3.9 3.8 3.8 3.8 Idaho ................................................................. 11.3 12.5 11.6 13.2 13.0 13.0 2.3 2.6 2.4 2.7 2.5 2.4 Montana ............................................................ 5.7 5.9 5.5 6.5 6.5 6.8 1.8 1.8 1.9 1.9 1.9 1.9 Utah................................................................... 30.4 32.3 34.0 30.6 32.1 34.6 3.3 3.5 3.7 3.3 3.3 3.3 Wyoming ........................................................... 7.5 8.5 8.4 9.0 9.0 8.0 4.0 4.5 4.4 4.6 4.4 3.7
Far West ............................................................... 832.4 823.1 762.7 744.9 772.4 781.2 4.6 4.6 4.3 4.1 4.2 4.1 Alaska ............................................................... 10.5 12.6 11.7 12.2 12.0 12.2 4.8 5.7 5.2 5.3 5.1 5.1 California ........................................................... 615.2 612.6 558.0 541.8 565.2 572.5 4.8 4.9 4.4 4.3 4.4 4.3 Hawaii ............................................................... 38.9 36.7 35.2 31.1 28.6 28.5 8.5 8.1 7.6 6.5 5.7 5.6 Nevada .............................................................. 28.2 25.8 26.1 26.7 31.9 35.9 3.0 2.7 2.7 2.6 2.9 3.1 Oregon .............................................................. 51.5 50.9 47.9 47.1 50.7 44.0 3.8 3.8 3.5 3.4 3.5 3.0 Washington ....................................................... 88.1 84.5 83.7 85.9 84.1 88.2 3.8 3.8 3.7 3.8 3.6 3.6
Puerto Rico ........................................................... 16.4 16.6 16.6 16.6 16.6 16.8 n.a. n.a. n.a. n.a. n.a. n.a.
Other U.S. areas 3 ................................................. 11.9 9.9 12.9 10.5 10.7 9.9 n.a. n.a. n.a. n.a. n.a. n.a.
Foreign 4 ................................................................ 0.4 0.3 0.4 2.2 1.6 1.3 n.a. n.a. n.a. n.a. n.a. n.a.
n.a. Not available. They also may differ from the NIPA estimates because of different definitions and revision schedules. 1. The data on employment in private industries used to calculate the shares shown in this table are from 2. For consistency with the coverage of the private-industry employment data, U.S.-affiliate employment in
BEA’s Regional Economic Information System. The totals are equal to employment in private industries less Puerto Rico, in “other U.S. areas,” and in “foreign” was excluded from the U.S.-affiliate employment total when employment of private households. The U.S. employment totals used to calculate affiliate shares in this table the percentage shares on this line were computed. differ from those used for tables 1 and 5, which are from tables 6.4D of the “National Income and Product 3. Consists of the U.S. Virgin Islands, Guam, American Samoa, and all other outlying U.S. areas. Accounts (NIPA) Tables.” They differ from the NIPA estimates of employment because they include depository 4. Consists of employees of U.S. affiliates working abroad. institutions, and, by definition, they exclude U.S. residents temporarily employed abroad by U.S. businesses.

194 U.S. Affiliates of Foreign Companies August 2008
by manufacturing affiliates and the selloff of subsidiar-ies by affiliates in utilities. In Rhode Island, employ-ment by affiliates fell 4,700, or 19 percent, due to theselloff of subsidiaries by affiliates.
In manufacturing, affiliate shares of employmentwere highest in the District of Columbia (33.4 per-cent), South Carolina (21.8 percent), and New Hamp-
shire (21.7 percent) (table 7). The high affiliate sharein the District of Columbia reflects the District’s lackof total manufacturing.7 In South Carolina, most
7. Employment data from the BEA’s Regional Economics InformationSystem indicate that there were only 1,800 manufacturing employees in theDistrict of Columbia in 2006; about half of these employees were in theprinting and food manufacturing industries.
Table 7. Manufacturing Employment by Majority-Owned Nonbank U.S. Affiliates by State, 2001–2006
Thousands of employees Percentage of total manufacturing employment in the state or area 1
2001 2002 2003 2004 2005 2006 2001 2002 2003 2004 2005 2006
Total 2 .................................................... 1,934.9 1,811.9 1,667.4 1,552.4 1,565.5 1,579.9 11.6 11.8 11.3 10.7 10.9 11.0New England ........................................................ 125.6 105.7 99.8 89.2 87.8 88.3 13.8 12.8 13.0 11.9 11.9 12.2
Connecticut ....................................................... 35.7 29.4 28.8 26.4 25.4 26.3 15.7 13.8 14.3 13.3 12.9 13.5Maine................................................................. 11.4 9.6 7.3 7.5 6.7 6.6 15.1 13.9 11.3 11.8 10.8 10.8Massachusetts .................................................. 51.2 42.5 40.2 32.9 32.3 33.0 13.1 12.1 12.3 10.5 10.5 10.9New Hampshire ................................................. 18.2 17.6 18.2 17.0 16.6 17.1 18.6 20.6 22.5 21.1 20.6 21.7Rhode Island ..................................................... 5.2 4.1 3.4 3.5 4.0 3.0 7.6 6.5 5.8 6.1 7.2 5.6Vermont ............................................................. 3.9 2.5 1.9 1.9 2.8 2.4 8.5 6.2 5.0 5.0 7.6 6.5
Mideast ................................................................. 261.3 248.6 229.8 204.7 200.9 205.9 12.1 (D) 12.3 11.3 11.3 11.8Delaware ........................................................... 9.4 8.1 9.9 6.8 5.9 5.2 23.7 21.9 27.8 19.6 17.5 15.6District of Columbia ........................................... 0.4 0.7 0.4 0.6 0.5 0.6 11.0 (D) 13.8 24.2 24.5 33.4Maryland ........................................................... 20.1 16.2 15.5 14.1 16.9 18.4 11.8 10.2 10.5 9.8 12.0 13.4New Jersey........................................................ 64.9 67.2 56.5 51.5 47.9 50.4 16.1 18.2 16.1 15.2 14.5 15.4New York ........................................................... 74.7 67.2 59.9 53.0 52.2 53.5 10.5 10.2 9.7 8.8 8.9 9.3Pennsylvania ..................................................... 91.9 89.3 87.5 78.6 77.4 77.8 11.1 11.7 12.3 11.4 11.4 11.5
Great Lakes .......................................................... 455.8 433.7 396.7 364.3 355.2 358.7 12.0 12.3 11.7 11.0 10.8 11.1Illinois ................................................................ 97.4 88.8 79.8 67.1 62.3 67.0 11.9 11.7 11.1 9.6 9.0 9.7Indiana............................................................... 96.0 87.1 82.2 80.8 85.6 86.7 15.5 14.7 14.3 14.1 14.9 15.3Michigan ............................................................ 102.2 93.6 89.3 81.6 79.0 76.3 12.3 12.3 12.3 11.6 11.6 11.6Ohio................................................................... 111.4 109.2 99.0 95.8 90.0 91.7 11.6 12.3 11.7 11.6 11.0 11.5Wisconsin .......................................................... 48.7 55.0 46.4 38.9 38.4 37.1 8.7 10.4 9.1 7.7 7.5 7.2
Plains .................................................................... 135.8 120.4 112.9 108.0 114.3 115.3 10.1 9.5 9.2 8.8 9.2 9.3Iowa ................................................................... 22.1 20.2 21.1 18.6 17.9 17.4 9.1 8.8 9.5 8.3 7.7 7.5Kansas .............................................................. 14.0 15.1 13.7 13.2 19.6 23.2 7.1 8.3 7.8 7.4 10.8 12.6Minnesota.......................................................... 31.2 26.2 22.4 23.8 25.9 24.6 8.2 7.3 6.4 6.9 7.4 7.1Missouri ............................................................. 51.8 42.4 39.8 38.7 36.8 35.8 15.1 13.0 12.7 12.3 11.8 11.6Nebraska ........................................................... 8.2 7.8 8.9 8.0 7.8 8.7 7.4 7.3 8.7 7.8 7.7 8.5North Dakota ..................................................... 4.5 4.0 3.7 2.5 2.3 2.8 18.4 16.5 15.7 10.1 8.7 10.8South Dakota..................................................... 4.0 4.7 3.2 3.3 4.0 2.8 9.6 12.1 8.5 8.4 10.0 6.6
Southeast ............................................................. 543.9 533.7 490.6 469.0 482.8 476.3 13.3 14.0 13.5 13.1 13.5 13.5Alabama ............................................................ 36.7 37.0 34.4 32.6 41.2 42.1 11.1 11.9 11.6 11.1 13.7 13.8Arkansas ........................................................... 22.8 20.3 19.1 17.7 20.0 18.9 10.0 9.4 9.2 8.6 9.8 9.4Florida ............................................................... 46.0 41.5 35.2 36.1 34.7 38.6 10.5 10.1 8.9 9.1 8.6 9.5Georgia.............................................................. 70.4 68.8 65.3 58.6 56.8 52.7 13.8 14.4 14.3 12.9 12.5 11.6Kentucky............................................................ 55.8 53.9 51.1 47.7 45.7 48.4 18.9 19.4 19.1 18.0 17.3 18.4Louisiana ........................................................... 19.5 16.9 15.8 15.6 18.2 14.7 11.2 10.4 10.1 10.2 11.9 9.6Mississippi ......................................................... 9.9 12.7 9.4 12.8 12.6 11.7 4.9 6.7 5.2 7.1 7.0 6.6North Carolina ................................................... 96.6 93.4 82.2 78.1 78.8 77.2 13.6 14.4 13.5 13.3 13.7 13.8South Carolina................................................... 65.9 70.8 63.9 58.1 54.7 55.8 20.8 24.2 22.6 21.6 20.9 21.8Tennessee ......................................................... 70.0 67.6 67.6 67.3 71.7 71.7 15.3 15.7 16.2 16.2 17.4 17.8Virginia .............................................................. 38.2 37.9 35.8 35.8 37.7 35.2 11.0 11.7 11.6 11.9 12.7 12.1West Virginia ..................................................... 12.1 12.9 10.7 8.5 10.8 9.3 16.6 18.6 16.4 13.4 17.2 15.1
Southwest ............................................................ 160.8 136.9 125.0 114.8 119.6 118.5 11.1 10.3 9.9 9.2 9.4 9.0Arizona .............................................................. 15.1 13.0 13.7 13.8 13.2 13.0 7.5 7.0 7.7 7.7 7.2 6.9New Mexico ....................................................... 2.7 1.8 1.3 1.7 1.3 1.2 6.6 4.7 3.6 4.9 3.6 3.2Oklahoma .......................................................... 15.5 14.5 12.2 11.2 14.5 11.8 9.1 9.5 8.5 7.8 10.0 7.9Texas ................................................................. 127.5 107.6 97.7 88.0 90.6 92.5 12.3 11.3 10.8 9.8 10.0 9.9
Rocky Mountain ................................................... 35.9 36.7 29.8 29.5 28.2 30.6 8.8 (D) 8.4 8.1 7.7 8.3Colorado............................................................ 19.0 19.9 15.5 14.7 15.1 14.5 10.4 11.9 10.0 9.6 10.0 9.6Idaho ................................................................. 3.8 3.7 3.2 4.5 3.5 3.7 5.5 5.7 5.1 7.2 5.4 5.6Montana ............................................................ 2.1 2.0 0.6 0.6 1.1 1.2 9.9 9.7 5.5 3.0 5.4 5.6Utah................................................................... 10.0 9.7 9.4 7.9 6.9 9.7 8.2 8.5 8.2 6.8 5.7 7.9Wyoming............................................................ 0.9 1.4 1.1 1.8 1.7 1.6 9.2 (D) 11.9 18.9 17.4 15.7
Far West................................................................ 206.7 187.2 171.4 161.3 165.2 175.6 8.6 8.5 8.2 7.8 8.0 8.4Alaska................................................................ 1.7 2.1 1.9 2.0 1.9 2.4 13.6 18.6 15.9 16.4 15.4 17.7California ........................................................... 161.3 146.2 133.5 123.4 125.4 133.7 9.0 8.9 8.6 8.0 8.3 8.9Hawaii ................................................................ 0.9 1.0 0.6 0.8 0.5 1.1 5.5 6.4 4.3 5.0 3.5 7.4Nevada .............................................................. 4.8 4.7 4.0 4.3 4.5 5.5 10.9 10.9 8.9 9.2 9.3 10.8Oregon .............................................................. 15.6 12.7 11.1 10.9 11.8 11.6 7.2 6.2 5.6 5.4 5.7 5.5Washington........................................................ 22.3 20.5 20.3 19.9 21.0 21.4 7.0 7.1 7.6 7.5 7.7 7.4
Puerto Rico............................................................ 8.1 8.5 8.5 7.8 7.9 7.9 n.a. n.a. n.a. n.a. n.a. n.a.
Other U.S. areas 3.................................................. 1.0 0.5 2.8 H H G n.a. n.a. n.a. n.a. n.a. n.a.
Foreign 4 ................................................................ 0.0 (*) 0.3 F F A n.a. n.a. n.a. n.a. n.a. n.a.
D Suppressed to avoid disclosure of data of individual companies.* More than zero and fewer than 50 employees.n.a. Not available1. The data on employment in manufacturing used to calculate the shares shown in this table are from BEA’s
Regional Economic Information System. The U.S. manufacturing employment totals used to calculate shares inthis table differ from the NIPA data for manufacturing used for table 5 (see footnote 1 to table 5).
2. Total affiliate manufacturing employment and the shares of all-U.S.-business manufacturing employmentaccounted for by affiliates in this table differ from those shown in table 5 (see footnote 3 to table 5). For consis-
tency with the coverage of the employment data for all U.S. manufacturing plants, U.S. affiliate employment inPuerto Rico, in “other U.S. areas,” and in “foreign” was excluded from the U.S.-affiliate total when thepercentage shares on this line were computed.
3. Consists of the U.S. Virgin Islands, Guam, American Samoa, and all other outlying U.S. areas.4. Consists of employees of U.S. affiliates working abroad.NOTE. The following ranges are given in employment cells that are suppressed: A—1 to 499; F—500 to
999; G—1,000 to 2,499; H—2,500 to 4,999; I—5,000 to 9,999; J—10,000 to 24,999; K—25,000 to 49,999;L—50,000 to 99,999; M—100,000 or more.

195 August 2008 SURVEY OF CURRENT BUSINESS
manufacturing employment was by European-owned affiliates, especially German- and French-owned affiliates, with Japanese-owned affiliates also contributing. In New Hampshire, most employment was also by European-owned affiliates: British-owned affiliates accounted for the largest share.
Manufacturing employment by affiliates rose in slightly more than half of the states. The largest increases
were in California and Illinois. In California, manufacturing employment by affiliates rose 8,200, or 7 percent. The increase was driven by the expansion of existing affiliates in pharmaceuticals and the entry of new affiliates in machinery manufacturing. In Illinois, manufacturing employment rose 4,800, or 8 percent, largely as a result of acquisitions by existing affiliates in food processing and machinery manufacturing.
Data on Foreign Direct Investment in the United States BEA collects three broad sets of data on foreign direct both coverage of companies and subject matter, and they investment in the United States: (1) financial and operat- are conducted every 5 years. The data cover U.S. affiliates’ ing data of U.S. affiliates, (2) data on U.S. businesses balance sheets and income statements, employment and newly acquired or established by foreign direct investors compensation of employees, trade in goods, research and (new investment data), and (3) international transactions development expenditures, sources of finance, and selected (balance of payments) and direct investment position data by state. In addition, the value added of affiliates is data. This article presents the financial and operating estimated from data reported in these surveys. data. The new investment data were published in “For- Except in benchmark survey years, these data, unlike eign Direct Investment in the United States: New Invest- the new investment data, cover only nonbank affiliates.2
ment in 2007” in the June 2008 issue of the SURVEY OF The financial and operating data for affiliates are on a fis-CURRENT BUSINESS. The international transactions and cal year basis. They cover the entire operations of the U.S. direct investment position data were published in the affiliate regardless of the percentage of foreign owner-articles “The International Investment Position of the ship. United States at Yearend 2007,” “U.S. International New investment data. The data on outlays by foreign Transactions: First Quarter of 2008,” and “Direct Invest- direct investors to acquire or establish affiliates in the ment Positions for 2007: Country and Industry Detail” in United States are collected on a calendar year basis in the July 2008 SURVEY. BEA’s annual survey of new foreign direct investment.
Each of the three data sets focuses on a distinct aspect In addition, the surveys of new investment collect of foreign direct investment. The financial and operat- selected data on the operations of the newly acquired or ing data provide a picture of the overall activities of the established affiliates. For newly acquired affiliates, these U.S. affiliates; the new investment data provide infor- data are for (or as of the end of) the most recent fiscal mation about U.S. businesses that are newly acquired or year preceding the acquisition, and for newly estabestablished by foreign direct investors, regardless of lished businesses, they are projected for (or as of the whether the invested funds were raised in the United end of) the first year of operation. The data cover the States or abroad; and the international transactions and entire operations of the business irrespective of the per-direct investment position data cover foreign investors’ centage of foreign ownership. transactions with, and positions in, both new and exist- International transactions and direct investment ing U.S. affiliates.1 position data. These data are collected in the quarterly
Financial and operating data of U.S. affiliates. The data surveys of foreign direct investment. The data cover the on the overall operations of U.S. affiliates are collected in U.S. affiliate’s transactions and positions with its foreign BEA’s annual and benchmark surveys of foreign direct parent and with other members of its foreign parent investment. Benchmark surveys are BEA’s most compre- group, so these data focus on the foreign parent’s share, hensive surveys of foreign direct investment in terms of or interest, in the affiliate rather than on the affiliate’s
overall size or level of operations. The major items 1. For a more detailed discussion of the differences between these included in the U.S. international transactions (balance
three sets of data, see Alicia M. Quijano, “A Guide to BEA Statistics on of payments) accounts are direct investment financial Foreign Direct Investment in the United States,” SURVEY 70 (February
1990): 29–37; <www.bea.gov/bea/mp_international.htm>. flows, and direct investment income. For a comparison of the data on affiliate operations with the data on
new investment, see the appendix “Sources of Data” in Mahnaz Fahim-Nader and William J. Zeile, “Foreign Direct Investment in the United 2. Beginning with survey year 2008, the BEA plans to extend the cov-States: New Investment in 1994 and Affiliate Operations in 1993,” SUR- erage of the annual survey to include U.S. affiliates that are banks in VEY 75 (May 1995): 68–70; <www.bea.gov/scb/index.htm>. order to close a gap in its data on multinational companies.
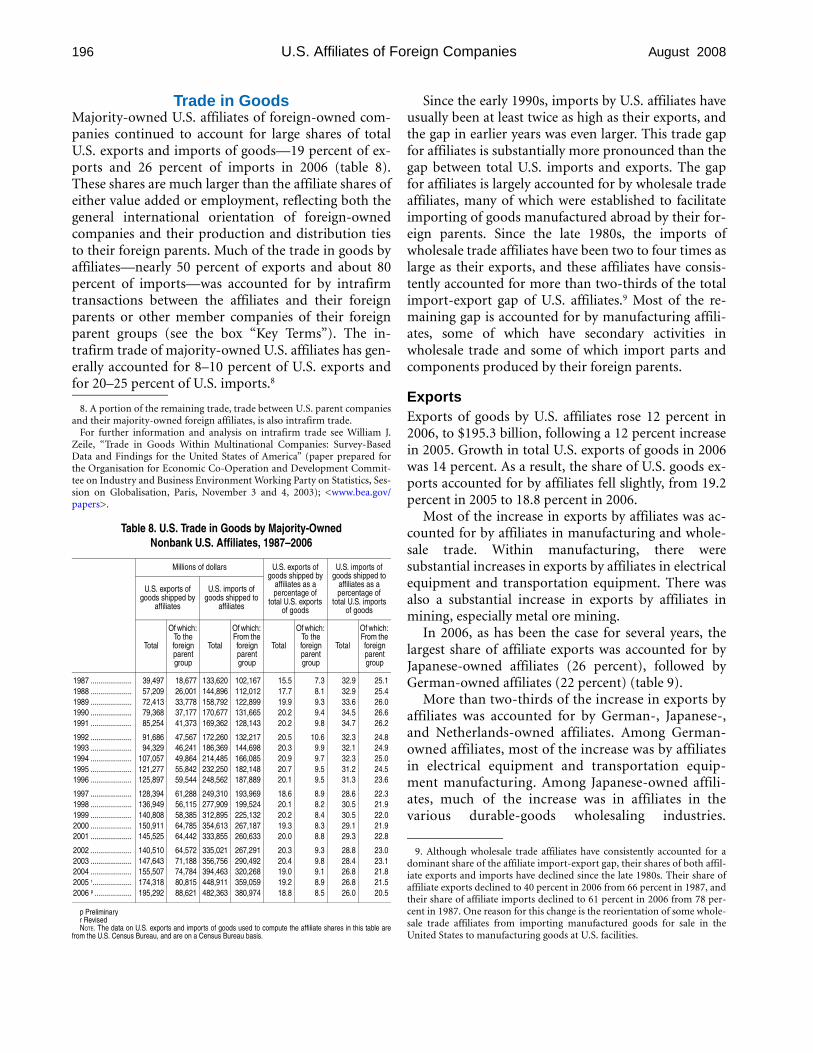
196 U.S. Affiliates of Foreign Companies August 2008
Trade in Goods Majority-owned U.S. affiliates of foreign-owned companies continued to account for large shares of total U.S. exports and imports of goods—19 percent of exports and 26 percent of imports in 2006 (table 8). These shares are much larger than the affiliate shares of either value added or employment, reflecting both the general international orientation of foreign-owned companies and their production and distribution ties to their foreign parents. Much of the trade in goods by affiliates—nearly 50 percent of exports and about 80 percent of imports—was accounted for by intrafirm transactions between the affiliates and their foreign parents or other member companies of their foreign parent groups (see the box “Key Terms”). The intrafirm trade of majority-owned U.S. affiliates has generally accounted for 8–10 percent of U.S. exports and for 20–25 percent of U.S. imports.8
8. A portion of the remaining trade, trade between U.S. parent companies and their majority-owned foreign affiliates, is also intrafirm trade.
For further information and analysis on intrafirm trade see William J. Zeile, “Trade in Goods Within Multinational Companies: Survey-Based Data and Findings for the United States of America” (paper prepared for the Organisation for Economic Co-Operation and Development Committee on Industry and Business Environment Working Party on Statistics, Session on Globalisation, Paris, November 3 and 4, 2003); <www.bea.gov/ papers>.
Table 8. U.S. Trade in Goods by Majority-Owned Nonbank U.S. Affiliates, 1987–2006
Millions of dollars U.S. exports of U.S. imports of goods shipped by goods shipped to
U.S. exports of goods shipped by
affiliates
U.S. imports of goods shipped to
affiliates
affiliates as a percentage of
total U.S. exports of goods
affiliates as a percentage of
total U.S. imports of goods
Total
Of which: To the foreign Total
Of which: From the foreign Total
Of which: To the foreign Total
Of which: From the foreign
parent parent parent parent group group group group
1987 ..................... 39,497 18,677 133,620 102,167 15.5 7.3 32.9 25.1 1988 ..................... 57,209 26,001 144,896 112,012 17.7 8.1 32.9 25.4 1989 ..................... 72,413 33,778 158,792 122,899 19.9 9.3 33.6 26.0 1990 ..................... 79,368 37,177 170,677 131,665 20.2 9.4 34.5 26.6 1991 ..................... 85,254 41,373 169,362 128,143 20.2 9.8 34.7 26.2
1992 ..................... 91,686 47,567 172,260 132,217 20.5 10.6 32.3 24.8 1993 ..................... 94,329 46,241 186,369 144,698 20.3 9.9 32.1 24.9 1994 ..................... 107,057 49,864 214,485 166,085 20.9 9.7 32.3 25.0 1995 ..................... 121,277 55,842 232,250 182,148 20.7 9.5 31.2 24.5 1996 ..................... 125,897 59,544 248,562 187,889 20.1 9.5 31.3 23.6
1997 ..................... 128,394 61,288 249,310 193,969 18.6 8.9 28.6 22.3 1998 ..................... 136,949 56,115 277,909 199,524 20.1 8.2 30.5 21.9 1999 ..................... 140,808 58,385 312,895 225,132 20.2 8.4 30.5 22.0 2000 ..................... 150,911 64,785 354,613 267,187 19.3 8.3 29.1 21.9 2001 ..................... 145,525 64,442 333,855 260,633 20.0 8.8 29.3 22.8
2002 ..................... 140,510 64,572 335,021 267,291 20.3 9.3 28.8 23.0 2003 ..................... 147,643 71,188 356,756 290,492 20.4 9.8 28.4 23.1 2004 ..................... 155,507 74,784 394,463 320,268 19.0 9.1 26.8 21.8 2005 r.................... 174,318 80,815 448,911 359,059 19.2 8.9 26.8 21.5 2006 p ................... 195,292 88,621 482,363 380,974 18.8 8.5 26.0 20.5
p Preliminary r Revised NOTE. The data on U.S. exports and imports of goods used to compute the affiliate shares in this table are
from the U.S. Census Bureau, and are on a Census Bureau basis.
Since the early 1990s, imports by U.S. affiliates have usually been at least twice as high as their exports, and the gap in earlier years was even larger. This trade gap for affiliates is substantially more pronounced than the gap between total U.S. imports and exports. The gap for affiliates is largely accounted for by wholesale trade affiliates, many of which were established to facilitate importing of goods manufactured abroad by their foreign parents. Since the late 1980s, the imports of wholesale trade affiliates have been two to four times as large as their exports, and these affiliates have consistently accounted for more than two-thirds of the total import-export gap of U.S. affiliates.9 Most of the remaining gap is accounted for by manufacturing affiliates, some of which have secondary activities in wholesale trade and some of which import parts and components produced by their foreign parents.
Exports Exports of goods by U.S. affiliates rose 12 percent in 2006, to $195.3 billion, following a 12 percent increase in 2005. Growth in total U.S. exports of goods in 2006 was 14 percent. As a result, the share of U.S. goods exports accounted for by affiliates fell slightly, from 19.2 percent in 2005 to 18.8 percent in 2006.
Most of the increase in exports by affiliates was accounted for by affiliates in manufacturing and wholesale trade. Within manufacturing, there were substantial increases in exports by affiliates in electrical equipment and transportation equipment. There was also a substantial increase in exports by affiliates in mining, especially metal ore mining.
In 2006, as has been the case for several years, the largest share of affiliate exports was accounted for by Japanese-owned affiliates (26 percent), followed by German-owned affiliates (22 percent) (table 9).
More than two-thirds of the increase in exports by affiliates was accounted for by German-, Japanese-, and Netherlands-owned affiliates. Among German-owned affiliates, most of the increase was by affiliates in electrical equipment and transportation equipment manufacturing. Among Japanese-owned affiliates, much of the increase was in affiliates in the various durable-goods wholesaling industries.
9. Although wholesale trade affiliates have consistently accounted for a dominant share of the affiliate import-export gap, their shares of both affiliate exports and imports have declined since the late 1980s. Their share of affiliate exports declined to 40 percent in 2006 from 66 percent in 1987, and their share of affiliate imports declined to 61 percent in 2006 from 78 percent in 1987. One reason for this change is the reorientation of some wholesale trade affiliates from importing manufactured goods for sale in the United States to manufacturing goods at U.S. facilities.

197 August 2008 SURVEY OF CURRENT BUSINESS
Key Terms The following key terms are used to describe U.S. affili- the U.S. affiliate and that therefore ultimately derives the ates of foreign companies and their operations. benefits from ownership or control.
U.S. affiliate. A U.S. business enterprise in which there is Foreign parent group. Consists of (1) the foreign par-foreign direct investment—that is, in which a single foreign ent, (2) any foreign person, proceeding up the foreign person owns or controls, directly or indirectly, 10 percent or parent’s ownership chain, that owns more than 50 per-more of the voting securities (if the U.S. business enterprise cent of the person below it, up to and including the UBO, is incorporated) or an equivalent interest (if the U.S. busi- and (3) any foreign person, proceeding down the owner-ness enterprise is unincorporated). Person is broadly ship chain(s) of each of these members, that is owned defined to include any individual, corporation, branch, more than 50 percent by the person above it. partnership, associated group, association, estate, trust, or Value added. The contribution to U.S. gross domestic other organization, and any government (including any cor- product, which is the market value of the goods and serporation, institution, or other entity or instrumentality of a vices produced by labor and property located in the government). A “foreign person” is any person that resides United States. Value added can be measured as gross out-outside the United States—that is, outside the 50 States, the put (sales or receipts and other operating income plus District of Columbia, the Commonwealth of Puerto Rico, inventory change) minus intermediate inputs (purchased and all U.S. territories and possessions. goods and services). Alternatively, it can be measured as
Majority-owned U.S. affiliate. A U.S. affiliate that is the sum of the costs incurred (except for intermediate owned more than 50 percent by foreign direct investors. inputs) and the profits earned in production. The value-
Foreign parent. The first person outside the United added estimates for U.S. affiliates were prepared by sum-States in a U.S. affiliate’s ownership chain that has a direct ming cost and profit data collected in the annual and investment interest in the affiliate. benchmark surveys of foreign direct investment in the
Ultimate beneficial owner (UBO). That person, pro- United States. The estimates are measures of gross value ceeding up a U.S. affiliate's ownership chain, beginning added rather than measures of net value added because with and including the foreign parent, that is not owned they are calculated without the deduction for the con-more than 50 percent by another person. Unlike the for- sumption of fixed capital used in production. eign parent, the UBO of an affiliate may be located in the The estimates of value added of U.S. affiliates are con-United States. The UBO of each U.S. affiliate is identified ceptually consistent with BEA’s estimates of U.S. value to determine the person that ultimately owns or controls added by industry.
Table 9. U.S. Trade in Goods by Majority-Owned Nonbank U.S. Affiliates by Selected Country of Ultimate Beneficial Owner, 2001–2006
Millions of dollars Percentage of all-countries total Addendum: Percentage change in
affiliate exports or
imports, 2006
2001 2002 2003 2004 2005 2006 2001 2002 2003 2004 2005 2006
US exports shipped by affiliates:
All countries ............................................ 145,525 140,510 147,643 155,507 174,318 195,292 100.0 100.0 100.0 100.0 100.0 100.0 12.0 Canada.................................................................. 8,191 6,401 6,405 6,583 8,171 9,052 5.6 4.6 4.3 4.2 4.7 4.6 10.8 France ................................................................... 9,817 10,043 9,744 9,475 11,355 12,439 6.7 7.1 6.6 6.1 6.5 6.4 9.5 Germany ............................................................... 29,298 30,351 32,326 31,603 37,619 42,869 20.1 21.6 21.9 20.3 21.6 22.0 14.0 Netherlands........................................................... (D) 5,022 5,068 9,041 11,259 14,586 (D) 3.6 3.4 5.8 6.5 7.5 29.6 Switzerland............................................................ 5,947 5,998 4,941 5,430 6,205 6,949 4.1 4.3 3.3 3.5 3.6 3.6 12.0
United Kingdom..................................................... 15,586 14,241 13,608 14,766 17,294 16,395 10.7 10.1 9.2 9.5 9.9 8.4 –5.2 Japan .................................................................... 40,766 38,531 41,010 42,506 43,889 49,789 28.0 27.4 27.8 27.3 25.2 25.5 13.4 Korea, Republic of ................................................. (D) 4,368 5,205 7,256 7,367 8,791 (D) 3.1 3.5 4.7 4.2 4.5 19.3 Other ..................................................................... 25,111 25,556 29,336 28,848 31,165 34,429 17.3 18.2 19.9 18.6 17.9 17.6 10.5
US imports shipped to affiliates:
All countries ............................................ 333,855 335,021 356,756 394,463 448,911 482,363 100.0 100.0 100.0 100.0 100.0 100.0 7.5 Canada.................................................................. 19,070 18,634 23,012 26,102 26,095 19,242 5.7 5.6 6.5 6.6 5.8 4.0 –26.3 France ................................................................... (D) 14,608 14,489 13,953 19,094 18,736 (D) 4.4 4.1 3.5 4.3 3.9 –1.8 Germany ............................................................... 56,477 57,386 62,062 61,701 61,704 68,306 16.9 17.1 17.4 15.6 13.7 14.2 10.7 Netherlands........................................................... 16,227 14,817 14,893 18,692 30,779 33,440 4.9 4.4 4.2 4.7 6.9 6.9 8.6 Switzerland............................................................ 8,010 8,438 9,173 10,205 13,325 16,575 2.4 2.5 2.6 2.6 3.0 3.4 24.4
United Kingdom..................................................... 22,675 21,344 25,568 27,574 31,140 34,344 6.8 6.4 7.2 7.0 6.9 7.1 10.3 Japan .................................................................... 133,612 127,923 133,170 141,337 150,576 159,412 40.0 38.2 37.3 35.8 33.5 33.0 5.9 Korea, Republic of ................................................. (D) 19,966 22,081 28,968 31,220 34,810 (D) 6.0 6.2 7.3 7.0 7.2 11.5 Other ..................................................................... 47,507 51,905 52,307 65,931 84,979 97,498 14.2 15.5 14.7 16.7 18.9 20.2 14.7
D Suppressed to avoid disclosure of data of individual companies. NOTE. Affiliates of the eight countries listed in this table accounted for the largest shares of affiliate trade in 2001–2006.

198 U.S. Affiliates of Foreign Companies August 2008
Among Netherlands-owned affiliates, petroleum wholesalers accounted for much of the increase.
Imports Imports of goods by U.S. affiliates rose 7 percent in 2006, to $482.4 billion, following an increase of 14 percent in 2005. Total U.S. imports grew 11 percent in 2006. As a consequence, the share of U.S. imports accounted for by affiliates fell to 26.0 percent in 2006 from 26.8 percent in 2005, continuing a long-term downward trend. Much of the increase in imports by affiliates in 2006 was accounted for by wholesale trade affiliates, especially those in motor vehicles, electrical goods, and machinery. Imports by manufacturing affiliates, especially transportation equipment manufacturers, also rose substantially.
Japanese-owned affiliates continued to account for the largest share of affiliate imports (33 percent). However, Japanese-owned affiliates’ share declined in 2006, continuing a trend from the late 1990s, when Japanese-owned affiliates accounted for more than 40 percent of affiliate imports. As in previous years, the majority of imports by Japanese-owned affiliates were by wholesale trade affiliates, including affiliates that have significant secondary operations in transportation equipment manufacturing.
The largest increases in affiliate imports in dollar terms were by Japanese- and German-owned affiliates. The increase by Japanese-owned affiliates—from $150.6 billion to $159.4 billion—was largely in motor vehicle and motor vehicle parts and supplies wholesalers. The increase in imports by German-owned affiliates—from $61.7 billion to $68.3 billion—was mostly in electrical equipment and transportation equipment manufacturing. Imports by affiliates from smaller trading countries (those included in “Other” in table 9) increased substantially in 2006 and represented 20 percent of affiliate imports, up from 14 percent in 2001. Among these smaller countries, Venezuelan- and Saudi Arabian-owned affiliates accounted for about half of the increase in imports by affiliates in 2006. Imports by Canadian-owned affiliates fell 26 percent, largely as a result of decreased imports by affiliates in wholesale trade.
Research and Development In 2006, expenditures for research and development (R&D) performed by U.S. affiliates totaled $34.3 billion, up 10 percent from 2005 (table 10). In 2005, the
most recent year for which data for R&D spending by all U.S. businesses are available, U.S affiliates accounted for 14 percent of the total R&D performed by all U.S. businesses, a share notably higher than the affiliate shares of U.S. private industry value added or employment.
Table 10. Research and Development Performed by Majority-Owned Nonbank U.S. Affiliates and All U.S. Businesses, 1997–2006
R&D performed by affiliates
R&D performed by all U.S. businesses 1
R&D by affiliates as a percentage
of R&D by all U.S. businesses Millions of dollars
1997.............................................. 17,216 157,739 10.9 1998.............................................. 22,375 169,180 13.2 1999.............................................. 24,027 182,711 13.2 2000.............................................. 26,180 199,539 13.1 2001.............................................. 26,463 198,505 13.3 2002.............................................. 27,507 193,868 14.2 2003.............................................. 29,803 200,724 14.8 2004.............................................. 30,083 208,301 14.4 2005.............................................. 31,099 226,159 13.8 2006.............................................. 34,257 n.a. n.a.
n.a. Not available 1. Data are from the National Science Foundation’s Web site at <www.nsf.gov/statistics/infbrief/nsf07335>.
Affiliates of the seven largest investing countries in terms of value added accounted for more than 80 percent of the R&D performed by affiliates (table 11). The largest shares of affiliate R&D spending were by British-and German-owned affiliates, each of which accounted for just under 20 percent. R&D spending by British-owned affiliates was predominantly by manufacturing affiliates, notably those in chemicals and computers and electronic products. R&D spending by German-owned affiliates was also concentrated in manufacturing affiliates, especially affiliates in chemicals and transportation equipment.
In 2006 as in previous years, manufacturing affiliates accounted for a dominant share of R&D performed by affiliates (73 percent). Within manufacturing, affiliates in chemicals and transportation equipment accounted for the largest shares of R&D spending.
By country of ownership, the largest increases in R&D expenditures by affiliates were among British-and Swiss-owned affiliates. Among affiliates of both countries the increases were mostly by existing affiliates in pharmaceuticals.
U.S. affiliate R&D intensity—defined as R&D expenditures divided by value added—was highest in three manufacturing industries: chemicals (22 percent), computers and electronic products (15 percent), and transportation equipment (11 percent). By

199 August 2008 SURVEY OF CURRENT BUSINESS
country, R&D intensity was highest among Swiss-and German-owned affiliates (10 percent each), reflecting the prominence of affiliates of these countries
Table 11. Research and Development Performed by Majority-Owned Nonbank U.S. Affiliates, by Country of UBO
and by Industry of Affiliate, 2005 and 2006 R&D performed
by affiliates (millions of dollars)
Share of the total R&D intensity 1
2005 2006 2005 2006 2005 2006
All countries and industries ....... 31,099 34,257 100.0 100.0 5.7 5.6
By country: Canada.................................................. 1,553 1,586 5.0 4.6 3.2 2.8 France ................................................... 3,099 3,335 10.0 9.7 6.2 5.7 Germany................................................ 6,519 6,742 21.0 19.7 10.0 9.9 Netherlands........................................... 1,470 1,562 4.7 4.6 3.3 3.4 Switzerland............................................ 4,289 5,039 13.8 14.7 11.7 10.1 United Kingdom..................................... 5,994 6,801 19.3 19.9 5.3 5.7 Japan..................................................... 3,576 3,995 11.5 11.7 5.1 5.3 Other ..................................................... 4,600 5,197 14.8 15.2 3.8 3.7
By industry: Manufacturing........................................ 21,506 25,035 69.2 73.1 8.7 9.4
Food .................................................. 498 466 1.6 1.4 3.3 3.0 Beverages and tobacco products ...... 43 50 0.1 0.1 0.6 0.6 Petroleum and coal products............. (D) (D) (D) (D) (D) (D) Chemicals.......................................... 9,888 12,750 31.8 37.2 19.9 21.6 Plastics and rubber products............. 342 371 1.1 1.1 3.2 3.5 Nonmetallic mineral products ............ 219 216 0.7 0.6 1.1 1.0 Primary metals .................................. 90 57 0.3 0.2 0.7 0.5 Fabricated metal products ................. 181 205 0.6 0.6 2.6 2.9 Machinery.......................................... 1,552 789 5.0 2.3 7.8 5.8 Computers and electronic products... 2,847 3,072 9.2 9.0 17.7 15.2 Electrical equipment, appliances,
and components............................ (D) 1,329 (D) 3.9 (D) 9.8 Transportation equipment.................. 4,244 4,198 13.6 12.3 12.4 11.2 Other ................................................. 958 1,087 3.1 3.2 4.0 4.4
Wholesale trade .................................... 6,529 5,935 21.0 17.3 6.5 5.6 Information ............................................ 1,009 967 3.2 2.8 3.5 2.9 Professional, scientific, and technical
services ............................................. 1,590 1,879 5.1 5.5 7.9 8.3 Other industries..................................... 464 441 1.5 1.3 0.3 0.2
in R&D-intensive industries such as pharmaceuticals. In 2005, the latest year for which data are available
for all U.S. R&D performing companies, affiliates accounted for more than 20 percent of U.S. R&D spending in such manufacturing industries as basic chemicals and pharmaceuticals (table 12). The high shares are due both to the strong presence of U.S. affiliates in these industries and to the use of the United States by many foreign multinational companies as a center for conducting R&D. In contrast, in professional, technical, and scientific services, the U.S. affiliate share of private R&D spending was just 5 percent, reflecting the relative lack of foreign direct investment in that industry.
Revisions The estimates of U.S. affiliate operations in 2006 are preliminary. The estimates for employment, sales, and expenditures for property, plant, and equipment supersede the advance summary estimates for majority-owned affiliates that were released on April 17, 2008 (BEA news release 08–15). From the advance estimates to the preliminary estimates, the estimates of employment and sales were each revised up 1.1 percent, and the estimate of capital expenditures was revised up 13.5 percent.10
The final estimates of U.S.-affiliate operations in 2005 are also presented. The final estimates for employment,
D Suppressed to avoid disclosure of data of individual companies. 1. R&D intensity is equal to R&D expenditures divided by value added.
Table 12. Research and Development Performed by Majority-Owned Nonbank U.S. Affiliates and all U.S. Businesses, in Selected Industries, 2005
R&D performed by affiliates
(millions of dollars)
R&D performed by all U.S.
businesses 1
(millions of dollars)
R&D by affiliates as a percentage
of R&D by all U.S. businesses
All industries ................................................. 31,099 226,159 13.8 Manufacturing............................................................ 21,506 158,190 13.6
Of which: Food ........................................................................ 498 2,716 18.3 Petroleum and coal products................................... (D) (D) n.a. Chemicals................................................................ 9,888 42,995 23.0
Of which: Basic chemicals .......................................... 513 2,277 22.5 Resins and synthetic rubber, fibers, and
filaments.................................................. 78 2,294 3.4 Pharmaceuticals and medicines ................. 8,710 34,839 25.0
Plastics and rubber products................................... 342 1,760 19.4 Machinery................................................................ 1,552 8,531 18.2 Computers and electronic products......................... 2,847 (D) n.a. Electrical equipment, appliances, and components (D) 2,424 n.a. Transportation equipment........................................ 4,244 (D) n.a. Miscellaneous manufacturing .................................. 47 5,143 0.9
Information................................................................. 1,009 23,836 4.2
Professional, scientific, and technical services 1,590 32,021 5.0 Of which:
Architectural, engineering, and related services 166 4,687 3.5 Computer systems design and related services 153 13,592 1.1
Other industries ........................................................... 6,994 12,112 (2)
sales, and expenditures for property, plant, and equipment supersede the advance summary estimates for majority-owned affiliates from the April release and the preliminary estimates that were released in August 2007.11 From the estimates released in April to these final estimates, the estimate of employment was revised up 0.4 percent, the estimate of sales was revised up 0.6 percent, and the estimate of capital expenditures was revised up 11.9 percent. From the preliminary estimates to the final estimates, the estimate of employment was revised up 2.3 percent, the estimate of sales was revised up 0.6 percent, and the estimate of capital expenditures was revised up 8.5 percent.
10. The revision to the estimates for capital expenditures was large because in their initial reports to BEA, some U.S. affiliates excluded their spending for equipment that they leased or rented to others. Consequently, these expenditures were omitted from the April 2008 advance estimates. BEA worked with respondents to obtain these data, and they are now included in the estimates in this report.
11. See Thomas Anderson, “U.S. Affiliates of Foreign Companies: Operations in 2005,” SURVEY 87 (August 2007): 194–211.
n.a. Not available. D Suppressed to avoid disclosure of data of individual companies. 1. Source: National Science Foundation. 2. Because of differences in industry classification, BEA data for U.S. affiliate R&D and NSF data for R&D by all U.S.
businesses may not be compatible for all individual industries. Because this lack of compatibility may be particularly great for “other industries,” the affiliate share of all R&D by U.S. businesses has not been computed for this industry category. Tables 13.1–14.2 follow.

200 U.S. Affiliates of Foreign Companies August 2008
Table 13.1. Selected Data of Majority-Owned Nonbank U.S. Affiliates by Industry of Affiliate, 2005
Millions of dollars
Thousands of
employees
Millions of dollars
Total assets
Gross property, plant, and equipment
Expenditures for property, plant, and equipment
Sales Net income
Value added
Compensation of employees
U.S. exports of
goods shipped by
affiliates
U.S. imports of
goods shipped to affiliates
Research and
development performed by
affiliates
(1) (2) (3) (4) (5) (6) (7) (8) (9) (10) (11)
All industries ............................................................... 5,952,052 1,103,766 131,378 2,509,575 98,708 549,569 336,125 5,201.6 174,318 448,911 31,099
Manufacturing.......................................................................... 1,116,355 492,117 49,901 999,418 35,908 246,159 143,933 2,000.9 99,353 156,599 21,506
Food ...................................................................................... 91,106 25,933 2,329 66,536 626 15,037 8,568 130.3 6,884 2,648 498 Beverages and tobacco products .......................................... (D) 8,262 628 20,485 2,000 7,425 2,551 34.8 1,004 1,053 43 Textiles, apparel, and leather products.................................. 3,038 2,668 320 4,131 97 1,403 887 18.3 355 396 37 Paper..................................................................................... 21,858 17,903 648 18,980 –567 4,651 3,263 43.9 1,301 3,049 64 Printing and related support activities ................................... 6,675 4,379 458 6,952 92 2,873 2,057 36.4 163 232 2 Petroleum and coal products................................................. (D) (D) 3,245 (D) (D) 22,161 4,298 30.1 (D) (D) (D)
Chemicals ............................................................................. 234,829 89,507 6,371 180,688 13,542 49,753 27,842 269.7 18,062 27,628 9,888 Basic chemicals ................................................................ 39,571 34,765 1,665 44,613 1,439 9,670 4,836 51.4 6,620 6,399 513 Resins and synthetic rubber, fibers, and filaments............ 8,829 5,565 404 11,592 312 1,735 916 10.2 978 1,319 78 Pharmaceuticals and medicines ....................................... 131,992 33,093 3,304 88,640 10,163 29,288 16,188 135.4 6,477 15,274 8,710 Soap, cleaning compounds, and toilet preparations ......... 21,570 3,071 253 9,768 744 2,803 1,450 18.0 532 710 99 Other ................................................................................. 32,867 13,013 745 26,075 885 6,258 4,452 54.7 3,454 3,927 489
Plastics and rubber products................................................. 28,675 19,250 1,400 35,482 773 10,687 7,238 118.0 3,053 5,690 342 Nonmetallic mineral products ................................................ 74,487 53,448 3,327 55,495 2,898 19,188 10,764 167.5 1,619 2,118 219 Primary and fabricated metals .............................................. 63,949 36,230 3,900 71,795 3,191 20,004 11,604 179.6 5,393 7,658 270
Primary metals .................................................................. 43,231 24,416 3,216 49,259 1,930 12,986 7,066 99.8 3,840 5,084 90 Fabricated metal products................................................. 20,717 11,814 684 22,536 1,262 7,017 4,538 79.8 1,552 2,574 181
Machinery.............................................................................. 93,179 19,735 2,065 68,872 2,206 19,845 16,146 199.1 8,176 8,499 1,552 Agriculture, construction, and mining machinery .............. (D) 3,484 308 16,105 1,119 3,537 2,335 30.3 3,270 1,602 243 Industrial machinery.......................................................... 4,487 1,832 110 5,333 –19 1,476 1,262 17.2 795 1,036 114 Other ................................................................................. (D) 14,419 1,647 47,434 1,106 14,832 12,549 151.6 4,110 5,861 1,195
Computers and electronic products ...................................... 57,217 21,386 1,624 54,038 –1,692 16,082 11,144 154.8 (D) (D) 2,847 Computers and peripheral equipment............................... 3,789 1,779 248 5,807 128 1,265 850 11.8 852 2,286 (D) Communications equipment.............................................. 4,514 1,803 130 5,539 –2,073 1,657 1,242 13.2 899 717 570 Semiconductors and other electronic components ........... 16,253 10,190 583 18,027 729 4,646 2,616 33.6 4,629 6,154 547 Navigational, measuring, and other instruments............... 20,630 4,204 337 14,306 –420 6,024 4,850 60.1 (D) (D) 1,453 Other ................................................................................. 12,030 3,411 326 10,359 –56 2,491 1,586 36.2 799 3,107 (D)
Electrical equipment, appliances, and components .............. 27,331 8,730 641 26,023 544 7,874 5,934 87.1 3,189 2,690 (D) Transportation equipment...................................................... 258,194 122,212 21,433 227,208 2,725 34,251 21,638 375.5 32,414 55,796 4,244
Motor vehicles, bodies and trailers, and parts................... 239,989 117,676 21,089 210,047 2,165 29,704 18,173 325.9 29,968 52,923 3,663 Other ................................................................................. 18,205 4,537 345 17,161 560 4,547 3,465 49.5 2,446 2,873 581
Other ..................................................................................... 57,637 (D) 1,512 (D) (D) 14,927 10,001 156.1 4,452 3,495 855
Wholesale trade....................................................................... 526,441 216,155 (D) 795,170 27,751 99,689 47,409 578.5 68,617 279,298 6,529 Motor vehicles and motor vehicle parts and supplies............ 127,529 65,945 13,928 161,008 4,952 15,541 6,796 75.7 7,493 79,061 347 Electrical goods..................................................................... 63,688 15,782 1,405 107,759 1,563 12,533 10,037 101.5 13,127 51,736 2,128 Petroleum and petroleum products ....................................... 153,859 (D) (D) 239,682 13,208 31,707 5,473 48.0 14,819 52,270 (D) Other ..................................................................................... 181,365 (D) 4,306 286,721 8,028 39,908 25,103 353.4 33,178 96,231 (D)
Retail trade............................................................................... 68,229 39,576 4,533 138,583 1,238 30,862 17,949 573.0 188 4,744 (D) Food and beverage stores..................................................... 37,746 26,722 2,581 85,642 604 19,118 11,384 356.8 (*) (D) (*) Other ..................................................................................... 30,483 12,854 1,953 52,941 634 11,743 6,565 216.3 188 (D) (D)
Information............................................................................... 184,270 39,281 6,963 72,525 3,070 28,814 18,615 212.0 1,190 (D) 1,009 Publishing industries ............................................................. 60,945 5,947 (D) 28,338 –289 12,456 9,321 103.6 797 212 645 Motion picture and sound recording industries ..................... 22,200 955 48 7,885 711 1,689 1,205 8.2 140 (D) (*) Telecommunications.............................................................. 68,074 25,930 (D) 23,433 2,926 7,056 2,897 41.6 (D) 10 (D) Other ..................................................................................... 33,052 6,449 769 12,869 –278 7,613 5,193 58.6 (D) 3 (D)
Finance (except depository institutions) and insurance 3,275,591 30,694 7,378 192,652 10,170 29,053 34,947 199.1 0 1 6 Finance, except depository institutions ................................. 2,029,087 19,001 6,254 81,525 5,478 15,628 21,460 83.8 0 1 6 Insurance carriers and related activities................................ 1,246,504 11,693 1,124 111,126 4,692 13,425 13,487 115.3 0 0 (*)
Real estate and rental and leasing ........................................ 99,706 81,251 14,474 24,661 2,526 12,582 2,921 47.0 (D) 518 11 Real estate ............................................................................ 78,486 68,893 7,318 16,477 1,971 8,362 1,491 22.6 0 1 (*) Rental and leasing (except real estate)................................. 21,220 12,358 7,156 8,184 555 4,220 1,430 24.4 (D) 516 11
Professional, scientific, and technical services ................... 93,717 10,287 1,563 54,910 440 20,186 16,362 197.5 (D) (D) 1,590 Architectural, engineering, and related services ................... 12,933 2,682 279 9,307 –33 3,593 3,254 46.5 351 70 166 Computer systems design and related services ................... 12,033 2,031 333 13,417 –200 6,614 5,318 58.1 5 4 153 Management, scientific, and technical consulting ................. 12,604 295 64 2,890 –524 1,469 1,218 12.5 0 4 (*) Other ..................................................................................... 56,148 5,279 887 29,296 1,198 8,511 6,572 80.5 (D) (D) 1,271
Other industries....................................................................... 587,742 194,406 (D) 231,657 17,605 82,224 53,988 1,393.4 4,269 7,282 (D) Agriculture, forestry, fishing, and hunting .............................. 4,300 2,550 240 2,058 68 602 340 6.8 312 91 62 Mining.................................................................................... 74,093 47,792 4,400 28,574 4,427 15,214 5,518 68.7 3,514 1,471 208 Utilities................................................................................... 93,144 66,212 3,179 49,646 –1,186 9,185 2,605 35.3 2 5,225 0 Construction .......................................................................... 23,309 8,638 3,564 35,664 1,043 7,266 5,226 67.1 (D) 62 5 Transportation and warehousing ........................................... 49,598 33,538 3,293 45,857 12 11,823 10,131 206.4 (D) (D) (D) Management of nonbank companies and enterprises .......... 249,431 (D) (D) 1,057 10,507 470 376 3.3 0 0 1 Administration, support, and waste management ................. 36,983 6,978 763 26,719 1,511 17,531 14,665 504.7 (D) 6 (*) Health care and social assistance......................................... 17,910 (D) 957 13,573 1,048 6,070 4,861 121.7 (D) (D) 51 Accommodation and food services ....................................... 33,224 17,896 951 24,040 185 12,027 8,906 328.9 (*) 2 0 Miscellaneous services ......................................................... 5,751 2,703 363 4,468 –10 2,036 1,360 50.4 47 (D) (D)
* Less than $500,000. D Suppressed to avoid disclosure of data of individual companies. Estimates for 2005 are revised.

201 August 2008 SURVEY OF CURRENT BUSINESS
Table 13.2. Selected Data of Majority-Owned Nonbank U.S. Affiliates by Industry of Affiliate, 2006
Millions of dollars
Thousands of
employees
Millions of dollars
Total assets
Gross property, plant, and equipment
Expenditures for property, plant, and equipment
Sales Net income
Value added
Compensation of employees
U.S. exports of
goods shipped by
affiliates
U.S. imports of
goods shipped to affiliates
Research and
development performed by affiliates
(1) (2) (3) (4) (5) (6) (7) (8) (9) (10) (11)
All industries ............................................................... 6,807,654 1,188,641 160,245 2,795,143 134,257 614,685 364,162 5,330.5 195,292 482,363 34,257
Manufacturing ......................................................................... 1,224,595 518,462 58,310 1,100,669 44,217 266,893 155,422 2,057.8 108,554 173,867 25,035
Food ...................................................................................... 85,474 25,643 2,176 64,589 4,854 15,466 8,450 128.7 6,634 3,068 466 Beverages and tobacco products .......................................... 32,122 9,609 949 24,111 2,149 8,555 3,214 38.2 967 484 50 Textiles, apparel, and leather products.................................. 3,239 2,892 308 4,365 93 1,447 939 18.6 400 463 38 Paper..................................................................................... 18,158 16,094 560 17,604 109 4,392 2,968 37.3 1,391 2,808 52 Printing and related support activities ................................... 6,378 4,451 336 6,855 39 2,777 2,003 33.3 111 154 3 Petroleum and coal products................................................. (D) (D) 4,576 136,657 8,206 22,483 4,510 33.2 (D) (D) (D)
Chemicals ............................................................................. 266,995 95,785 8,317 212,418 11,028 58,953 32,178 287.8 19,481 33,617 12,750 Basic chemicals ................................................................ 53,595 38,317 2,358 51,231 3,036 9,207 4,892 53.1 6,694 6,138 603 Resins and synthetic rubber, fibers, and filaments............ 8,250 5,801 350 12,116 –79 1,354 802 8.1 1,195 1,495 66 Pharmaceuticals and medicines ....................................... 154,751 36,448 4,491 113,987 6,500 39,551 20,800 159.8 7,717 22,016 11,513 Soap, cleaning compounds, and toilet preparations ......... 18,889 3,096 309 10,998 872 3,159 1,593 18.7 614 730 108 Other ................................................................................. 31,510 12,123 808 24,086 700 5,682 4,091 48.2 3,261 3,238 460
Plastics and rubber products................................................. 28,924 19,817 1,567 36,200 589 10,586 7,294 110.9 3,031 6,062 371 Nonmetallic mineral products................................................ 82,128 56,646 4,454 62,983 3,242 21,739 11,535 180.4 1,495 3,095 216 Primary and fabricated metals .............................................. 68,842 35,482 3,079 77,981 5,050 19,298 10,464 157.4 5,469 7,216 262
Primary metals .................................................................. 46,731 23,803 2,330 54,350 3,710 12,244 5,653 81.2 3,632 4,957 57 Fabricated metal products................................................. 22,111 11,679 749 23,632 1,340 7,054 4,812 76.2 1,837 2,258 205
Machinery ............................................................................. 79,033 13,994 1,293 53,512 2,123 13,667 10,544 138.8 7,932 8,018 789 Agriculture, construction, and mining machinery .............. (D) 3,344 396 16,838 908 3,194 2,372 30.3 3,393 1,718 326 Industrial machinery.......................................................... 5,743 2,089 185 7,364 255 2,063 1,654 21.3 1,181 1,620 128 Other ................................................................................. (D) 8,561 712 29,310 960 8,410 6,519 87.1 3,358 4,680 336
Computers and electronic products ...................................... (D) 21,471 1,732 63,940 1,062 20,198 14,467 168.7 (D) (D) 3,072 Computers and peripheral equipment............................... 4,064 2,107 319 6,058 –203 (D) (D) I 659 2,450 (D) Communications equipment.............................................. (D) 2,918 149 12,814 –108 4,007 3,695 31.7 1,514 971 602 Semiconductors and other electronic components ........... 16,884 8,613 575 17,682 708 4,219 2,595 33.4 4,460 5,782 407 Navigational, measuring, and other instruments............... 21,887 4,638 425 17,171 568 8,399 5,670 61.3 (D) (D) 1,759 Other ................................................................................. 12,883 3,196 265 10,215 96 (D) (D) K 1,083 3,013 (D)
Electrical equipment, appliances, and components .............. 51,361 14,701 1,327 49,111 1,104 13,563 10,776 146.5 6,339 6,148 1,329 Transportation equipment...................................................... 274,463 135,242 26,300 246,663 2,173 37,461 25,551 420.3 36,033 59,277 4,198
Motor vehicles, bodies and trailers, and parts................... 244,856 128,952 25,594 222,153 1,371 29,261 18,660 325.1 33,551 55,621 3,539 Other ................................................................................. 29,607 6,291 706 24,510 802 8,200 6,890 95.2 2,482 3,657 659
Other ..................................................................................... 62,585 (D) 1,336 43,681 2,396 16,306 10,529 157.7 4,790 4,676 (D)
Wholesale trade....................................................................... 562,140 237,907 34,155 863,364 28,790 106,868 50,126 618.7 78,029 295,190 5,935 Motor vehicles and motor vehicle parts and supplies ........... 141,373 79,992 16,657 170,523 4,544 16,637 6,933 77.7 8,668 85,679 381 Electrical goods..................................................................... 77,191 19,779 2,405 117,379 786 13,018 10,473 108.4 14,513 55,338 2,220 Petroleum and petroleum products ....................................... 152,823 (D) 10,686 262,477 14,755 32,962 5,341 44.7 15,915 53,942 (D) Other ..................................................................................... 190,753 (D) 4,406 312,986 8,704 44,252 27,380 387.9 38,934 100,231 (D)
Retail trade............................................................................... 69,449 42,253 4,633 146,128 1,301 31,822 18,280 564.0 578 5,711 16 Food and beverage stores..................................................... 38,048 29,041 2,728 88,187 1,208 19,489 11,372 345.5 0 (D) 0 Other ..................................................................................... 31,401 13,213 1,906 57,941 93 12,333 6,909 218.5 578 (D) 16
Information .............................................................................. 207,114 44,794 4,363 81,894 3,888 33,360 20,998 223.5 972 235 967 Publishing industries ............................................................. 67,757 6,177 624 31,239 1,884 14,657 10,445 106.6 455 185 616 Motion picture and sound recording industries ..................... 19,370 957 97 8,058 165 1,572 1,239 8.6 (D) (D) (*) Telecommunications.............................................................. 82,003 30,860 2,887 26,966 1,359 8,300 3,196 47.2 4 5 (D) Other ..................................................................................... 37,983 6,800 755 15,631 480 8,830 6,119 61.2 (D) (D) (D)
Finance (except depository institutions) and insurance 3,957,790 36,417 10,450 257,764 18,155 40,914 38,922 215.1 (D) (D) 8 Finance, except depository institutions ................................. 2,479,912 23,168 (D) 123,150 8,268 23,893 24,000 93.1 (D) (D) 8 Insurance carriers and related activities................................ 1,477,878 13,249 (D) 134,614 9,887 17,021 14,922 122.0 0 0 (*)
Real estate and rental and leasing ........................................ 115,945 89,562 18,091 34,883 6,459 15,955 3,254 46.0 (D) 541 (D) Real estate ............................................................................ 94,012 76,655 9,522 24,364 5,697 11,652 1,744 25.4 0 0 (*) Rental and leasing (except real estate)................................. 21,933 12,907 8,569 10,519 763 4,304 1,510 20.5 (D) 541 (D)
Professional, scientific, and technical services................... 101,387 11,371 1,623 61,360 722 22,531 18,159 202.4 (D) (D) 1,879 Architectural, engineering, and related services ................... 13,606 2,834 310 11,345 358 4,545 3,792 48.6 322 (D) 204 Computer systems design and related services ................... 17,631 2,390 420 16,435 –303 7,645 6,319 63.2 7 3 220 Management, scientific, and technical consulting ................. 13,470 309 58 2,683 –543 1,376 1,160 10.7 0 4 (*) Other ..................................................................................... 56,681 5,838 835 30,897 1,210 8,966 6,889 80.0 (D) (D) 1,455
Other industries ...................................................................... 569,234 207,873 28,620 249,082 30,724 96,342 59,001 1,402.9 6,382 6,547 (D) Agriculture, forestry, fishing, and hunting .............................. 3,950 2,317 222 1,817 94 554 304 5.9 362 66 41 Mining.................................................................................... 87,742 61,599 (D) 37,294 5,717 21,298 7,372 74.8 5,516 1,755 246 Utilities................................................................................... 83,354 52,987 4,356 48,580 1,511 9,293 2,848 27.1 2 (D) (*) Construction.......................................................................... 25,101 10,147 4,616 33,830 477 6,255 4,711 64.3 130 23 7 Transportation and warehousing ........................................... 61,160 41,341 5,247 55,949 –825 14,938 12,307 218.8 238 255 (D) Management of nonbank companies and enterprises .......... 207,197 (D) (D) 1,079 20,597 4,037 422 3.6 3 0 1 Administration, support, and waste management ................. 36,400 6,984 695 27,691 1,571 (D) (D) M (D) 6 (*) Health care and social assistance......................................... 17,400 (D) 558 9,857 588 (D) (D) L (D) (D) 21 Accommodation and food services ....................................... 36,998 19,400 1,472 26,998 775 13,999 10,193 384.5 (*) 1 0 Miscellaneous services ......................................................... 9,934 4,067 458 5,988 218 2,837 1,738 57.9 40 98 (D)
* Less than $500,000. D Suppressed to avoid disclosure of data of individual companies. Estimates for 2006 are preliminary.

202 U.S. Affiliates of Foreign Companies August 2008
Table 14.1. Selected Data of Majority-Owned Nonbank U.S. Affiliates by Country of Ultimate Beneficial Owner, 2005
Millions of dollars
Thousands of
employees
Millions of dollars
Total assets
Gross property, plant, and equipment
Expenditures for property, plant, and equipment
Sales Net income
Value added
Compensation of employees
U.S. exports of
goods shipped by
affiliates
U.S. imports of
goods shipped to affiliates
Research and
development performed by affiliates
(1) (2) (3) (4) (5) (6) (7) (8) (9) (10) (11)
All countries ................................................................ 5,952,052 1,103,766 131,378 2,509,575 98,708 549,569 336,125 5,201.6 174,318 448,911 31,099
Canada ..................................................................................... 443,048 105,947 9,651 180,911 8,000 48,103 28,609 466.5 8,171 26,095 1,553
Europe ...................................................................................... 4,450,235 685,212 75,468 1,502,064 66,090 355,682 225,784 3,530.0 96,272 183,796 23,389 Austria ................................................................................... 2,610 1,403 211 3,603 121 907 569 9.8 320 981 7 Belgium ................................................................................. 51,615 13,208 991 29,638 1,123 7,110 4,355 128.8 1,098 1,031 136 Denmark................................................................................ 22,989 4,052 620 10,833 173 2,114 1,430 19.4 795 3,225 319 Finland .................................................................................. 14,669 7,463 (D) 20,341 96 3,758 2,771 31.9 2,315 6,340 (D) France ................................................................................... 666,583 63,832 4,825 178,703 15,632 49,867 32,700 476.8 11,355 19,094 3,099
Germany ............................................................................... 621,965 219,824 35,180 341,880 6,429 65,379 44,238 645.8 37,619 61,704 6,519 Ireland ................................................................................... 19,004 7,522 543 13,931 296 4,122 2,796 42.6 188 518 247 Italy........................................................................................ 48,237 14,190 885 28,160 1,473 7,487 4,572 101.7 2,265 4,028 262 Luxembourg .......................................................................... 8,411 4,048 158 4,831 436 897 497 25.0 282 (D) 6 Netherlands........................................................................... 632,466 71,219 5,756 260,769 9,473 44,546 26,046 437.7 11,259 30,779 1,470 Norway .................................................................................. 15,204 6,994 308 11,244 79 1,026 713 8.3 431 1,559 68 Spain ..................................................................................... 42,277 4,328 670 7,877 220 2,138 1,345 31.9 582 413 (D) Sweden ................................................................................. 36,190 14,627 1,377 48,662 1,853 12,681 9,179 199.3 4,121 7,352 272 Switzerland............................................................................ 1,198,584 43,473 4,477 150,945 4,588 36,680 32,297 403.3 6,205 13,325 4,289 United Kingdom..................................................................... 1,060,912 205,180 18,306 376,997 23,749 113,929 61,097 951.7 17,294 31,140 5,994 Other ..................................................................................... 8,520 3,847 (D) 13,650 350 3,043 1,178 16.1 143 (D) (D)
Latin America and Other Western Hemisphere .................... 299,152 58,997 5,283 167,542 5,306 41,112 24,212 324.4 12,231 (D) (D) South and Central America ................................................... 38,084 19,776 1,896 80,445 1,774 13,663 4,760 79.8 2,339 (D) (D)
Brazil ................................................................................. 7,405 2,310 561 11,849 206 851 508 7.0 773 6,865 0 Mexico ............................................................................... 17,508 8,408 763 21,579 406 4,835 2,809 57.4 879 3,583 18 Panama ............................................................................. 1,381 (D) 76 1,104 90 (D) (D) H (D) 35 (D) Venezuela.......................................................................... (D) (D) (D) (D) (D) (D) (D) H (D) (D) (*) Other ................................................................................. (D) 1,014 (D) (D) (D) 450 315 6.2 184 1,755 3
Other Western Hemisphere .................................................. 261,068 39,221 3,387 87,097 3,532 27,449 19,452 244.6 9,892 4,978 1,121 Bahamas ........................................................................... 946 204 23 213 126 98 93 1.7 (D) (D) (*) Bermuda............................................................................ 181,775 28,581 2,511 67,462 2,149 21,313 15,606 194.5 8,994 3,503 909 Netherlands Antilles .......................................................... 5,543 (D) 441 5,242 540 2,948 1,766 22.2 (D) 104 (D) United Kingdom Islands, Caribbean.................................. 72,702 (D) 408 14,037 764 3,035 1,974 26.1 104 (D) (D) Other ................................................................................. 102 33 4 143 –47 55 13 0.1 5 14 (D)
Africa ........................................................................................ 4,055 3,883 218 6,515 –227 953 716 8.6 502 458 35 South Africa........................................................................... 3,548 3,421 188 6,139 –268 894 679 8.0 501 456 35 Other ..................................................................................... 507 462 30 375 41 59 37 0.6 (*) 2 0
Middle East .............................................................................. 39,042 22,787 3,068 58,118 2,319 10,169 2,608 56.3 578 (D) (D) Israel ..................................................................................... 11,238 2,397 224 8,211 99 1,403 819 14.6 284 1,013 135 Kuwait.................................................................................... 2,664 2,214 197 2,256 139 (D) (D) G 1 (*) 0 Lebanon ................................................................................ 995 911 80 828 25 220 135 2.6 8 (*) (*) Saudi Arabia.......................................................................... 13,493 11,071 1,062 (D) (D) 6,821 526 4.6 (D) (D) (D) United Arab Emirates ............................................................ 6,953 4,929 1,243 915 –29 299 132 7.5 (D) 74 0 Other ..................................................................................... 3,699 1,264 262 (D) (D) (D) (D) J 98 293 42
Asia and Pacific ....................................................................... 685,180 213,075 31,104 570,208 15,851 85,694 50,335 760.4 54,075 190,729 4,067 Australia ................................................................................ 92,710 26,951 4,262 23,173 3,113 6,995 3,240 51.6 859 1,355 90 China..................................................................................... 1,136 343 44 2,040 –91 102 144 1.7 (D) 239 (D) Hong Kong ............................................................................ 7,768 4,369 450 6,558 472 1,785 989 19.9 366 1,447 62 India ...................................................................................... 1,307 340 35 2,781 46 885 730 12.4 15 27 0 Japan..................................................................................... 545,773 161,613 24,233 465,563 11,918 70,064 41,808 614.5 43,889 150,576 3,576 Korea, Republic of ................................................................. 18,492 9,065 1,547 45,725 –67 2,238 1,268 18.1 7,367 31,220 (D) Malaysia ................................................................................ 1,504 967 70 884 28 317 238 4.3 (D) 16 (D) New Zealand ......................................................................... 674 77 9 1,605 26 126 73 1.4 (D) 1,204 0 Singapore .............................................................................. 6,997 2,794 164 7,597 145 1,318 863 17.5 (D) 786 25 Taiwan ................................................................................... 7,366 5,579 239 13,005 230 1,602 857 14.1 888 3,353 122 Other ..................................................................................... 1,453 976 50 1,277 29 262 126 4.7 29 505 (*)
United States ........................................................................... 31,339 13,865 6,586 24,218 1,369 7,855 3,861 55.3 2,489 4,120 692
Addenda: European Union (25) 1 .......................................................... 3,231,590 632,680 70,462 1,330,001 61,354 315,933 191,991 3,108.1 89,503 168,279 18,991 OPEC 2 ................................................................................. (D) 25,490 (D) 87,872 3,348 14,468 1,400 19.0 496 (D) (D)
* Less than $500,000. D Suppressed to avoid disclosure of data of individual companies. 1. The European Union (25) comprises Austria, Belgium, Cyprus, Czech Republic, Denmark, Estonia,
Finland, France, Germany, Greece, Hungary, Ireland, Italy, Latvia, Lithuania, Luxembourg, Malta, the Netherlands, Poland, Portugal, Slovakia, Slovenia, Spain, Sweden, and the United Kingdom.
2. OPEC is the Organization of Petroleum Exporting Countries. In 2005, its members were Algeria, Indo
nesia, Iran, Iraq, Kuwait, Libya, Nigeria, Qatar, Saudi Arabia, the United Arab Emirates, and Venezuela. NOTES. Size ranges are given in employment cells that are suppressed. The size ranges are: A—1 to 499;
F—500 to 999; G—1,000 to 2,499; H—2,500 to 4,999; I—5,000 to 9,999; J—10,000 to 24,999; K—25,000 to 49,999; L—50,000 to 99,999; M—100,000 or more.
Estimates for 2005 are revised.

203 August 2008 SURVEY OF CURRENT BUSINESS
Table 14.2. Selected Data of Majority-Owned Nonbank U.S. Affiliates by Country of Ultimate Beneficial Owner, 2006
Millions of dollars
Thousands of
employees
Millions of dollars
Total assets
Gross property, plant, and equipment
Expenditures for property, plant, and equipment
Sales Net income
Value added
Compensation of employees
U.S. exports of
goods shipped by
affiliates
U.S. imports of
goods shipped to affiliates
Research and
development performed by affiliates
(1) (2) (3) (4) (5) (6) (7) (8) (9) (10) (11)
All countries ................................................................ 6,807,654 1,188,641 160,245 2,795,143 134,257 614,685 364,162 5,330.5 195,292 482,363 34,257
Canada ..................................................................................... 610,167 113,259 (D) 196,051 13,844 56,738 31,733 457.4 9,052 19,242 1,586
Europe ...................................................................................... 5,053,338 722,187 87,417 1,686,212 87,276 392,437 242,944 3,590.6 107,843 201,406 25,803 Austria ................................................................................... 3,105 1,669 238 4,017 120 993 628 10.5 281 992 8 Belgium ................................................................................. 58,418 12,599 1,005 36,248 1,481 7,169 4,479 132.0 1,071 1,117 285 Denmark ............................................................................... 24,200 4,721 978 12,556 201 3,215 2,527 23.4 935 3,275 392 Finland .................................................................................. 15,263 7,957 (D) 21,804 1,211 4,155 2,885 33.5 2,460 6,350 (D) France ................................................................................... 776,525 67,318 5,693 206,940 18,772 58,937 37,045 496.6 12,439 18,736 3,335 Germany ............................................................................... 667,703 243,327 37,804 371,499 8,529 67,918 44,604 664.4 42,869 68,306 6,742 Ireland ................................................................................... 26,654 9,461 708 19,363 701 5,996 3,766 59.0 189 459 209 Italy........................................................................................ 53,105 18,558 1,701 32,519 1,858 9,321 5,488 130.4 2,406 4,965 350 Luxembourg .......................................................................... 13,687 4,490 271 6,969 495 1,757 760 30.1 516 1,798 8 Netherlands........................................................................... 724,446 82,109 7,269 314,751 14,568 45,784 28,577 445.2 14,586 33,440 1,562 Norway .................................................................................. 13,380 8,164 1,867 11,755 –622 228 590 7.8 518 2,174 15 Spain ..................................................................................... 56,541 5,636 1,238 10,432 463 2,285 1,623 36.4 839 478 (D) Sweden ................................................................................. 31,486 11,419 1,118 43,329 1,220 11,206 8,343 179.4 5,110 7,582 303 Switzerland............................................................................ 1,404,231 48,432 5,366 176,844 7,715 50,113 36,046 416.1 6,949 16,575 5,039 United Kingdom..................................................................... 1,174,039 191,449 20,455 403,060 30,443 120,265 64,255 908.8 16,395 34,344 6,801 Other ..................................................................................... 10,554 4,879 (D) 14,125 122 3,094 1,329 17.0 279 815 32
Latin America and Other Western Hemisphere .................... 319,028 67,050 8,022 189,396 8,972 50,030 27,349 358.3 13,265 (D) (D)
South and Central America ................................................... 41,325 21,737 (D) 92,511 2,878 15,709 5,832 113.1 2,853 (D) (D) Brazil ................................................................................. 8,307 2,783 (D) 12,351 219 814 591 8.2 647 6,439 (*) Mexico............................................................................... 18,657 9,173 1,156 24,881 390 5,914 3,016 58.8 970 4,575 18 Panama............................................................................. 1,473 (D) 91 1,160 147 (D) (D) I (D) 30 (D) Venezuela ......................................................................... (D) (D) (D) (D) (D) (D) (D) H (D) (D) 0 Other ................................................................................. (D) 1,265 289 (D) (D) 1,310 1,049 36.5 215 2,016 3
Other Western Hemisphere .................................................. 277,702 45,312 (D) 96,885 6,094 34,321 21,517 245.2 10,412 6,581 1,273 Bahamas........................................................................... 984 218 16 180 53 84 97 1.7 1 2 (*) Bermuda ........................................................................... 195,986 32,499 3,150 73,219 3,968 25,438 16,804 193.8 (D) 4,542 959 Netherlands Antilles .......................................................... 7,368 3,801 (D) 7,272 1,056 4,297 2,234 20.8 (D) (D) (D) United Kingdom Islands, Caribbean.................................. 73,248 8,760 1,344 16,062 1,059 4,484 2,368 28.8 163 (D) (D) Other ................................................................................. 116 34 7 152 –41 19 14 0.1 6 14 (D)
Africa ........................................................................................ 4,494 4,093 269 7,488 153 1,086 719 8.5 501 681 35 South Africa .......................................................................... 3,812 3,525 158 6,933 –11 971 676 7.9 501 679 35 Other ..................................................................................... 682 567 112 555 164 114 43 0.7 (*) 2 0
Middle East .............................................................................. 62,058 29,125 4,998 66,124 2,893 12,729 3,617 72.7 744 (D) (D) Israel ..................................................................................... 22,798 3,098 336 11,938 –881 2,050 1,137 17.9 360 1,351 193 Kuwait.................................................................................... 3,839 (D) 231 1,879 254 (D) (D) H 1 (*) 0 Lebanon ................................................................................ 1,288 1,060 146 787 15 277 176 3.3 9 2 (*) Saudi Arabia.......................................................................... 15,643 11,752 1,552 (D) (D) 7,064 571 4.9 (D) (D) (D) United Arab Emirates ............................................................ 13,080 8,455 2,352 3,702 936 1,150 469 14.3 (D) 69 0 Other ..................................................................................... 5,409 (D) 381 (D) (D) (D) (D) K 118 (D) 29
Asia and Pacific....................................................................... 726,656 240,744 38,986 625,274 19,708 93,625 53,755 788.1 61,292 203,783 4,589 Australia ................................................................................ 94,484 38,316 5,370 28,259 5,310 7,992 3,828 59.1 994 1,755 127 China..................................................................................... 892 329 11 1,408 –21 105 101 1.2 55 127 9 Hong Kong ............................................................................ 7,612 4,635 509 9,662 210 1,969 1,136 19.9 133 1,676 75 India ...................................................................................... 2,032 496 178 3,782 –21 1,171 1,015 16.2 69 210 0 Japan .................................................................................... 580,259 176,511 30,191 504,876 13,261 75,800 43,798 631.0 49,789 159,412 3,995 Korea, Republic of................................................................. 22,052 10,171 2,006 50,961 471 2,785 1,407 18.7 8,791 34,810 (D) Malaysia ................................................................................ 1,553 989 67 1,007 58 370 262 4.8 (D) 18 (D) New Zealand ......................................................................... 722 91 11 1,883 24 170 89 1.6 (D) 1,304 0 Singapore.............................................................................. 7,976 3,096 191 8,861 10 1,632 1,142 18.6 314 780 42 Taiwan ................................................................................... 7,614 5,157 399 13,339 385 1,397 857 13.4 886 3,097 111 Other ..................................................................................... 1,459 954 52 1,237 21 233 120 3.7 16 594 (D)
United States ........................................................................... 31,914 12,184 (D) 24,597 1,411 8,041 4,045 54.9 2,595 4,477 683
Addenda: European Union (25) 1 .......................................................... 3,629,524 662,728 79,343 1,487,612 79,954 339,774 205,420 3,155.2 100,188 182,027 20,717 OPEC 2 ................................................................................. (D) (D) (D) 97,442 6,104 16,094 1,801 26.7 1,194 (D) (D)
* Less than $500,000. D Suppressed to avoid disclosure of data of individual companies. 1. The European Union (25) comprises Austria, Belgium, Cyprus, Czech Republic, Denmark, Estonia,
Finland, France, Germany, Greece, Hungary, Ireland, Italy, Latvia, Lithuania, Luxembourg, Malta, the Netherlands, Poland, Portugal, Slovakia, Slovenia, Spain, Sweden, and the United Kingdom.
2. OPEC is the Organization of Petroleum Exporting Countries. In 2006, its members were Algeria, Indo
nesia, Iran, Iraq, Kuwait, Libya, Nigeria, Qatar, Saudi Arabia, the United Arab Emirates, and Venezuela. NOTES. Size ranges are given in employment cells that are suppressed. The size ranges are: A—1 to 499;
F—500 to 999; G—1,000 to 2,499; H—2,500 to 4,999; I—5,000 to 9,999; J—10,000 to 24,999; K—25,000 to 49,999; L—50,000 to 99,999; M—100,000 or more.
Estimates for 2006 are preliminary.
Related Documents


