Supplemental Materials for Postsynthesis of High Silica Beta by Cannibalistic Dealumination of OSDA-Free Beta and Its Catalytic Applications Peng Luo, Hao Xu*, Teng Xue, Jingang Jiang, Haihong Wu, Mingyuan He, Peng Wu* Shanghai Key Laboratory of Green Chemistry and Chemical Processes, School of Chemistry and Molecular Engineering, East China Normal University, North Zhongshan Road 3663, Shanghai 200062, China Tel: +86-21-6223-2292 Fax: +86-21-6223-2292 E-mail address: [email protected] (H. Xu); [email protected] (P. Wu) Electronic Supplementary Material (ESI) for Inorganic Chemistry Frontiers. This journal is © the Partner Organisations 2020

Welcome message from author
This document is posted to help you gain knowledge. Please leave a comment to let me know what you think about it! Share it to your friends and learn new things together.
Transcript

Supplemental Materials
for
Postsynthesis of High Silica Beta by Cannibalistic Dealumination of OSDA-Free
Beta and Its Catalytic Applications
Peng Luo, Hao Xu*, Teng Xue, Jingang Jiang, Haihong Wu, Mingyuan He, Peng
Wu*
Shanghai Key Laboratory of Green Chemistry and Chemical Processes, School of
Chemistry and Molecular Engineering, East China Normal University, North
Zhongshan Road 3663, Shanghai 200062, China
Tel: +86-21-6223-2292
Fax: +86-21-6223-2292
E-mail address: [email protected] (H. Xu); [email protected] (P. Wu)
Electronic Supplementary Material (ESI) for Inorganic Chemistry Frontiers.This journal is © the Partner Organisations 2020

Experimental Section
Synthesis of pristine OSDA-free Al-rich Beta zeolite. The pristine Al-rich Beta was
synthesized via a seeding method without using any OSDA according to the literature [1]. Typically,
119.2 g Al2(SO4)3‧18H2O and 28.4 g NaOH and 423.3 g water glass (SiO2, 27.10 wt%; Na2O, 8.39 wt%)
were firstly dissolved in 449.6 g H2O in sequence under vigorous stirring. Subsequently, 11.4 g industrial
Beta (Si/Al=11.4) as seeds (10 wt.%) was added to give a molar composition of 1.0 SiO2 : 0.1 Al2O3 :
0.22 Na2O : 20 H2O. The mixture was homogenized under stirring for 2 h, and then transferred into a 1
L Teflon-lined stainless steel autoclave and heated at 393 K for 5 days. The product obtained was filtered,
washed with deionized water several times, dried overnight at 373 K, and then calcined at 823 K for 6 h,
and the prepared product is denoted as Na Beta. It was converted into ammonium form via ion-exchange
with 1 M ammonium chloride solution at 353 K for 2 h, then dried at 373 K. This treatment was repeated
for three times and followed by calcination at 823 K for 6 h to give the proton type Beta, denoted as PR
Beta.
Relative crystallinity and yield calculation method. The relative crystallinity was
calculated using the equation (RC=CS/CR) based on the XRD patterns and the Na Beta as reference,
where RC was the relative crystallinity, CR was the sum of the peak intensity of 2θ=7.6° and 22.6° of
reference, CS was the sum of the peak intensity of 2θ=7.6° and 22.6° of CD Beta samples. The solid
product yield was calculated using the equation (Y=MS/MR) based on the mass, where Y was the yield,
MR was the sum mass of Beta and Al2(SO4)3 in the initial aqueous solution, MS was the mass of solid
product (including Beta and natroalunite phase) recovered from the solution after the Al2(SO4)3-induced
dealumination process.
Hydrothermal stability test
For hydrothermal stability test, various Beta zeolites were put into a quartz tube with an inner diameter
of 8 mm with a continuous 20 mL min-1 N2 flow until the temperature reached 1053 K. Then water was
fed into the reactor at a rate of 1 mL h-1 at 1053 K for 2 h under the same nitrogen flow. The treated
samples were characterized by XRD and FT-IR analyses.
Chemical reactions involved in the cannibalistic dealumination (CD) process
The Gibbs free energy of Beta zeolites ((H2O•Al2O3)n1(Na2O•Al2O3)n2(SiO2)n3) are calculated
according to the equation: ΔG0zeolite = n1 ΔG0 zeolite-H2O + n1 ΔG0 zeolite-Al2O3 + n2 ΔG0 zeolite-
Na2O•Al2O3 + n3 ΔG0 zeolite-SiO2 [2-3]. ΔG0zeolite-H2O = -237.2 kJ mol–1, ΔG0 zeolite-Al2O3 = -
1690.9 kJ mol–1, ΔG0 zeolite-Na2O•Al2O3 = -2273.1 kJ mol–1, ΔG0 zeolite-SiO2 = -855.9 kJ mol–1.
The Gibbs free energy of Al2(SO4)3 is calculated on the physical parameters calculation software (ap
1700), ΔG0Al2(SO4)3 = -3098.5 kJ mol–1. The Gibbs free energy of other materials are as following:
ΔG0H2O(423 K, 0.38MPa) = –217.3 kJ mol–1, ΔG0Na2SO4 = -1270.2 kJ mol–1, ΔG0NaAl3(SO4)2(OH)6 = -
4622.4 kJ mol–1, ΔG0NaOH = -379.5 kJ mol–1, ΔG0NaAlO2= -1069.2 kJ mol–1 [4-5].

Table S1 Element and mass balance.
Sample No. Phase Total (g) Si (g) Al (g) Na (g) S (g) H (g) O (g)
Feeding 1 Na Beta 1000a 354b 79b 68b ˂ 1 - 499f
Materials 2 Al2(SO4)3 357a ˂ 1 57 ˂ 1 100 - 200f
(dry base) 3 Sum 1357 354 136 68 100 - 699
4 Beta zeolite 860a 354b 45c 2d - 1f 458f
CD Beta-7.6 5 Natroalunite 448a - 91e 26e 72 7f 252f
6 Sum (solid) 1308 354b 136b 28b 72 8 710
7 Na2SO4 124 ˂1 ˂1 40 28 - 56f
DeAl Bata 8 Beta zeolite 876a 354 45b 18b ˂1 1f 458f
-7.6 9 NaOH 275a - - 158 - 7f 110f
10 Sum (Solid) 1151 354b 45 176 - 8 568
a The weight of solid was the sum amount of Si, Al, Na, S, H and O. b The amounts were determined by ICP analysis. c The weight of Al element (No. 4) was obtained according to the framework Si/Al ratio for Beta
zeolite (Si/Al = 7.6) and the Si amount. d The weight of Na element in CD Beta (No. 4) was calculated according to the molecular formula
of Beta after CD treatment. e The weight of Al and Na elements in Natroalunite (No. 5) were obtained as No. 6 - No. 4. f The weight of H and O elements were calculated according to the molecular formula of zeolite,
natroalunite, NaOH and Na2SO4.
Nos. 1 and 2 are the initial feeding materials, consisting of Na Beta and Al2(SO4)3, and we take 1000 g
Na Beta as the initial feeding quantity for convenience. CD Beta consists of two phases of Beta and
natroalunite (Nos. 4 and 5), containing Si, Al, Na, S, H, O elements. In the CD process with Al2(SO4)3,
43% Al of Na Beta was extracted from zeolite skeleton, and the framework Si/Al ratio increased from 4.3
to 7.6. Most aluminum species existed in the natroalunite phase. Meanwhile, sodium sulfate was
generated (No. 7), 97% Na ions were extracted from the zeolite, and the Si/Na ratio increased from 4.3
to 145, that is, the zeolite phase in CD Beta was almost proton type Beta zeolite. Among them, 37.3% Na
ions were involved in the dealumination reaction (equation 2), and 59.7% sodium was involved in the
by-reaction (equation 3). When the concentration of Al2(SO4)3 was increased to 1.12mol L-1, more
percentage of Na ions were reacted in the dealumination reaction (55.2%), and more Al species was
removed from the Na Beta, resulting in the DeAl Beta with framework Si/Al ratio of 12. After washing
with low concentration of NaOH, the natroalunite phase was completely removed from CD Beta, leaving
a pure Beta phase with a higher Si/Al ratio of 7.6. Overall, we calculated the element and mass balance
of the whole process based on the experimental data, and Al2(SO4)3 was almost 100% involved in
the reaction.
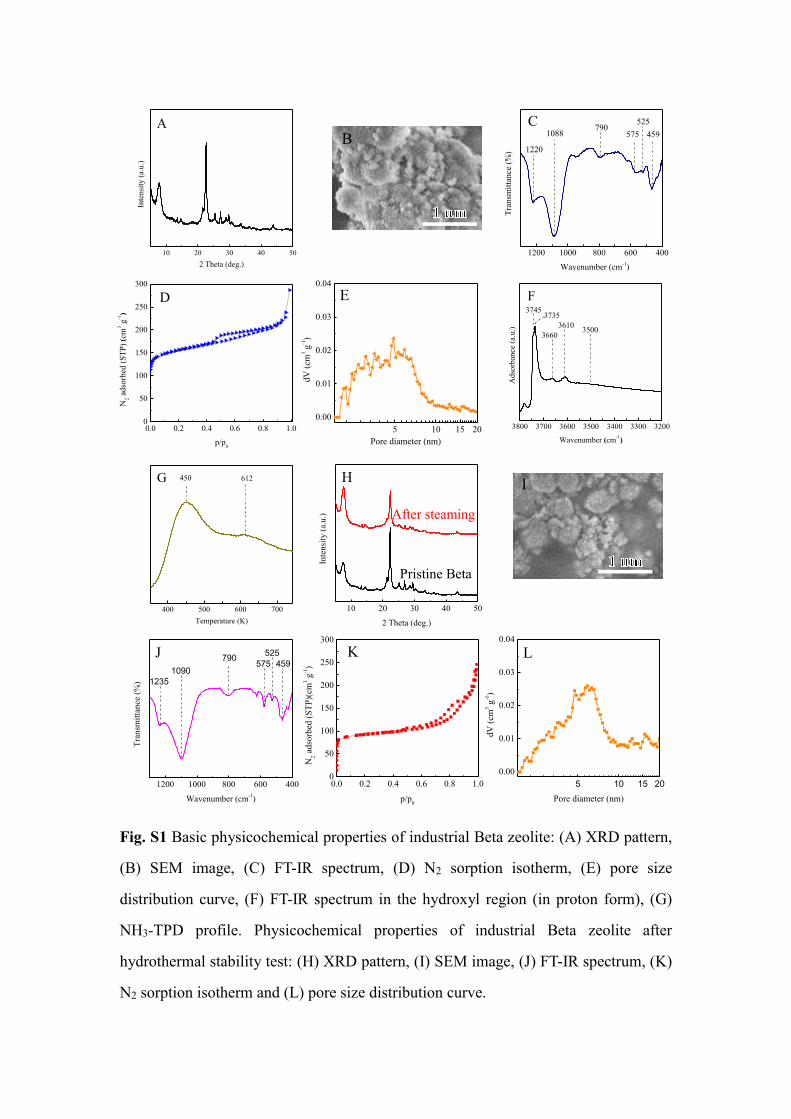
Fig. S1 Basic physicochemical properties of industrial Beta zeolite: (A) XRD pattern,
(B) SEM image, (C) FT-IR spectrum, (D) N2 sorption isotherm, (E) pore size
distribution curve, (F) FT-IR spectrum in the hydroxyl region (in proton form), (G)
NH3-TPD profile. Physicochemical properties of industrial Beta zeolite after
hydrothermal stability test: (H) XRD pattern, (I) SEM image, (J) FT-IR spectrum, (K)
N2 sorption isotherm and (L) pore size distribution curve.
10 20 30 40 50
Inte
nsi
ty (
a.u.)
2 Theta (deg.)
A
0.0 0.2 0.4 0.6 0.8 1.00
50
100
150
200
250
300
N2 a
dso
rbed
(S
TP
) (c
m3 g
-1)
p/p0
D
3800 3700 3600 3500 3400 3300 3200
3660
3610
Ad
sorb
ance
(a.
u.)
F
3735
3500
Wavenumber (cm-1)
3745
B
1200 1000 800 600 400
1220
790C
459
525
575
Tra
nsm
itta
nce
(%
)
Wavenumber (cm-1
)
1088
I
10 20 30 40 50
Inte
nsi
ty (
a.u
.)
2 Theta (deg.)
H
1200 1000 800 600 400
459
525
575790
1090
Tra
nsm
itta
nce
(%
)
Wavenumber (cm-1)
1235
J
400 500 600 700
612
Temperature (K)
450G
0.0 0.2 0.4 0.6 0.8 1.00
50
100
150
200
250
300
N2 a
dso
rbed
(S
TP
)(cm
3 g
-1)
p/p0
K
Pristine Beta
After steaming
5 10 15 20
0.00
0.01
0.02
0.03
0.04
dV
(cm
3 g
-1)
Pore diameter (nm)
E
5 10 15 20
0.00
0.01
0.02
0.03
0.04
dV
(cm
3 g
-1)
Pore diameter (nm)
L
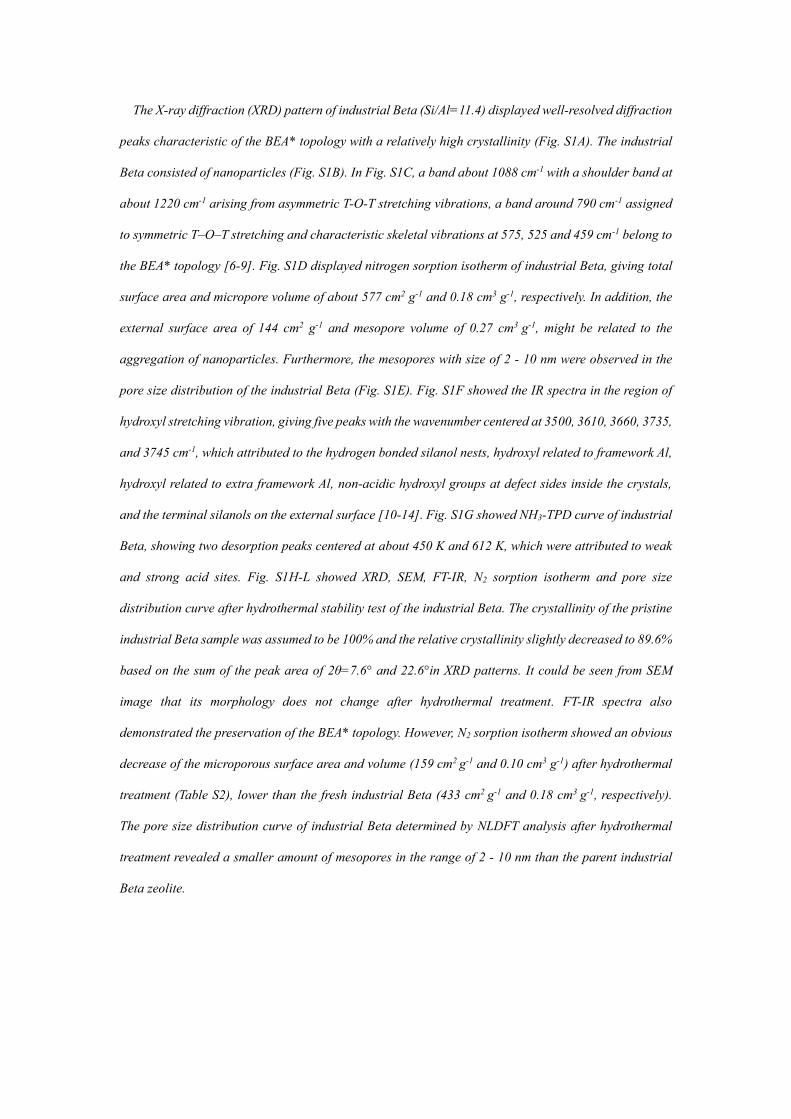
The X-ray diffraction (XRD) pattern of industrial Beta (Si/Al=11.4) displayed well-resolved diffraction
peaks characteristic of the BEA* topology with a relatively high crystallinity (Fig. S1A). The industrial
Beta consisted of nanoparticles (Fig. S1B). In Fig. S1C, a band about 1088 cm-1 with a shoulder band at
about 1220 cm-1 arising from asymmetric T-O-T stretching vibrations, a band around 790 cm-1 assigned
to symmetric T–O–T stretching and characteristic skeletal vibrations at 575, 525 and 459 cm-1 belong to
the BEA* topology [6-9]. Fig. S1D displayed nitrogen sorption isotherm of industrial Beta, giving total
surface area and micropore volume of about 577 cm2 g-1 and 0.18 cm3 g-1, respectively. In addition, the
external surface area of 144 cm2 g-1 and mesopore volume of 0.27 cm3 g-1, might be related to the
aggregation of nanoparticles. Furthermore, the mesopores with size of 2 - 10 nm were observed in the
pore size distribution of the industrial Beta (Fig. S1E). Fig. S1F showed the IR spectra in the region of
hydroxyl stretching vibration, giving five peaks with the wavenumber centered at 3500, 3610, 3660, 3735,
and 3745 cm-1, which attributed to the hydrogen bonded silanol nests, hydroxyl related to framework Al,
hydroxyl related to extra framework Al, non-acidic hydroxyl groups at defect sides inside the crystals,
and the terminal silanols on the external surface [10-14]. Fig. S1G showed NH3-TPD curve of industrial
Beta, showing two desorption peaks centered at about 450 K and 612 K, which were attributed to weak
and strong acid sites. Fig. S1H-L showed XRD, SEM, FT-IR, N2 sorption isotherm and pore size
distribution curve after hydrothermal stability test of the industrial Beta. The crystallinity of the pristine
industrial Beta sample was assumed to be 100% and the relative crystallinity slightly decreased to 89.6%
based on the sum of the peak area of 2θ=7.6° and 22.6°in XRD patterns. It could be seen from SEM
image that its morphology does not change after hydrothermal treatment. FT-IR spectra also
demonstrated the preservation of the BEA* topology. However, N2 sorption isotherm showed an obvious
decrease of the microporous surface area and volume (159 cm2 g-1 and 0.10 cm3 g-1) after hydrothermal
treatment (Table S2), lower than the fresh industrial Beta (433 cm2 g-1 and 0.18 cm3 g-1, respectively).
The pore size distribution curve of industrial Beta determined by NLDFT analysis after hydrothermal
treatment revealed a smaller amount of mesopores in the range of 2 - 10 nm than the parent industrial
Beta zeolite.

Fig. S2 XRD patterns of the Na Beta (a) and resultant CD Beta prepared with different
mass of ethanol: 0 g (b), 0.25 g (c), 0.5 g (d), 0.75 g (e), and 1 g (f). The asterisks (*)
indicate the diffractions attributed to natroalunite. Other treatment conditions, 1 g Na
Beta : 0.695 g Al2(SO4)3.18 H2O : x g ethanol : 1.46 g H2O; temp., 423 K; time, 6 h.
The influence of ethanol on Al-rich Na-type Beta dealumination process was explored. The XRD
patterns explicitly verify that parent Na Beta and the corresponding treated samples possess the BEA*
topology. Besides the diffraction peaks due to Beta zeolite, those attributable to the natroalunite phase
are also observed in the patterns of CD Beta. Unlike the CD process of NaY (Si/Al=2.4) in our previous
published work where EtOH/H2O medium decreased the dealumination rate and reduced the damage of
the FAU framework [15], the peak intensity of both Beta and natroalunite phase were comparable despite
the vibration of ethanol amount, indicating that the addition of ethanol in the process of Al2(SO4)3
dealumination hardly effected the crystallinity, probably due to the higher Si/Al ratio of Na Beta
(Si/Al=4.3) than NaY.
10 20 30 40 50
Inte
nsi
ty (
a.u.)
2 Theta (deg.)
**
*
*
Natroalunite
f
e
d
b
a
c
*

Fig. S3 pH value change in aqueous solution (A), solid product yield and relative
crystallinity (B) of the Na Beta and resultant CD Beta with different mass of ethanol.
Other treatment condition, 1 g Na Beta : 0.695 g Al2(SO4)3.18 H2O : x g ethanol : 1.46
g H2O; temp., 423 K; time, 6 h.
Fig. S3A investigated the pH value change of Al2(SO4)3 solution before and after the dealumination
process with different ethanol amounts. The generation of natroalunite (NaAl3(SO4)2(OH)6) consumes
the OH- ions in the solution and reduced the pH value. The pH values decreased from about 3.1 to about
1.9 in all the Al2(SO4)3 solutions with different ethanol amounts. The solid product yield and relative
crystallinity of all CD Beta samples were also similar and about 90% and 78%, respectively (Fig. S3B).
On the whole, the ethanol was not necessary for the dealumination of Na Beta.
0.0 0.2 0.4 0.6 0.8 1.00
1
2
3
4
pH
Mass of ethanol (g)
Before reaction
After reactionA
0.0 0.2 0.4 0.6 0.8 1.00
20
40
60
80
100
So
lid
pro
du
ct y
ield
(%
)
Mass of ethanol (g)
B
0
20
40
60
80
100
Rel
ativ
e cr
yst
alli
nit
y (
%)

Fig. S4 SEM images of the Na Beta (a, b) and resultant CD Beta prepared with different
mass of ethanol, 0 g (c, d) and 0.75 g (e, f). Other treatment condition, 1 g Na Beta :
0.695 g Al2(SO4)3.18 H2O : x g ethanol : 1.46 g H2O; temp., 423 K; time, 6 h.
SEM images (a, b) of Na Beta show intergrown crystals with a truncated octahedral morphology and
well-defined surfaces. After dealumination by Al2(SO4)3 with different ethanol amounts (c-f), the
morphology showed no obvious change, and natroalunite phase with rough ball-shaped crystals could
be clearly seen.

Fig. S5 XRD patterns of (A) CD Beta and (B) DeAl Beta prepared with a different
Al2(SO4)3 concentration of 0 M (a), 0.16 M (b), 0.32 M (c), 0.48 M (d), 0.64 M (e), 0.8
M (f), 1.12 M (g), and 1.44 M (h). The asterisks (*) indicate the diffractions attributed
to natroalunite. Other treatment condition: 1 g Na Beta : x g Al2(SO4)3.18 H2O : 1.46 g
H2O; temp., 423 K; time, 6 h.
As shown in Fig. S5A, with the increase of Al2(SO4)3 concentration, the diffractions of natroalunite
became more intense, while the intensity of the reflection peaks attributed to Beta phase after selectively
removing the natroalunite phase was gradually weakened, indicating that more natroalunite generated
by extracting FAL.
10 20 30 40 50
B
Inte
nsi
ty (
a.u
.)
2 Theta (deg.)
h
a
b
c
d
e
f
g
10 20 30 40 50
**
**
AIn
tensi
ty (
a.u.)
2 Theta (deg.)
a
b
c
d
e
f
g
h*

Fig. S6 FT-IR spectra (A) of Na Beta (a), CD Beta-7.6 (b), DeAl Beta-12 (c), CD Beta-
7.6 (d), and DeAl Beta -12 (e).
After CD treatment, although the bulk Si/Al ratio decreased from 4.3 in Na Beta to 2.1 in CD Beta-7.6
and 1.9 in CD Beta-12, respectively, the band of asymmetric T–O–T stretching vibrations blue-shifted
after CD process, indicating part of the FAL species in Na Beta were removed. The wavenumbers of these
vibrations of DeAl Beta-7.6 (Fig. S6c) and DeAl Beta-12 (Fig. S6e) were comparable with those of
corresponding CD Beta, meaning that the washing step did not affect the framework Si/Al ratio. The
skeletal vibrations at 575, 525 and 459 cm-1 of CD Beta-7.6 (Fig. S6b) and CD Beta-12 (Fig. S6d) became
weak because of the coexisting natroalunite compared with Na Beta (Fig. S6a), but these vibration bands
of DeAl Beta-7.6 (Fig. S6c) and DeAl Beta-12 (Fig. S6e) were found to become more pronounced after
removing natroalunite, stronger than that of Na Beta (Fig. S6a), characteristic of highly crystalline Beta
zeolite.
1200 1000 800 600 400
1090
1072
790
1213
459525
575
e
d
c
b
Tra
nsm
itta
nce
(%
)
Wavenumber (cm-1
)
1048
a
A

Fig. S7 XRD patterns (A) of Na Beta (a) and Al2(SO4)3 (b), AlCl3 (c), Al(NO3)3 (d)
treated Na Beta samples with the same Al3+ content, or H2SO4 (e) treated Na Beta
samples with the same SO42- concentration with Al2(SO4)3. XRD patterns (B) of Na
Beta (a) and Al2(SO4)3 (b), AlCl3 (c), Al(NO3)3 (d), H2SO4 (e) treated Na Beta samples
with the same pH condition. The asterisks (*) indicate the diffractions attributed to
natroalunite. Other treatment condition: 1 g Na Beta : x g Al salts or H2SO4 : 1.46 g
H2O; temp., 423 K; time, 6 h.
When Na Beta was treated by Al2(SO4)3 at pH of 3.1, natroalunite was formed, and the framework
Si/Al ratio increased from 4.3 for Na Beta to 7.6 for CD Beta. When the treatment was conducted using
AlCl3, Al(NO3)3 with the same Al3+ or H2SO4 with same SO42- of Al2(SO4)3 (Fig. S7A), no crystalline
natroalunite phase was formed except for the case treated by H2SO4 solution. The strong sulfuric acid
extracted a small amount of framework Al and Na atoms and reacted with SO42- to form limited amount
of natroalunite phase, and the framework Si/Al ratio of the resultant Beta zeolites remained in a low
value of 4.9, indicating negligible dealumination. Moreover, there was no natroalunite phase when using
AlCl3, Al(NO3)3 and H2SO4 under the same pH of 3.1 (Fig. S7B), mainly because natroalunite could not
be formed without the simultaneous presence of SO42- and Al3+ in the aqueous solution. Thus, the
formation of natroalunite was critical to realize cannibalistic dealumination using Al sources.
10 20 30 40 50
**
*
*
*
Inte
nsi
ty (
a.u
.)
2 Theta (deg.)
a
b
c
d
eB
10 20 30 40 50
*****
**
*
*
*
AIn
ten
sity
(a.
u.)
2 Theta (deg.)
a
b
c
d
e
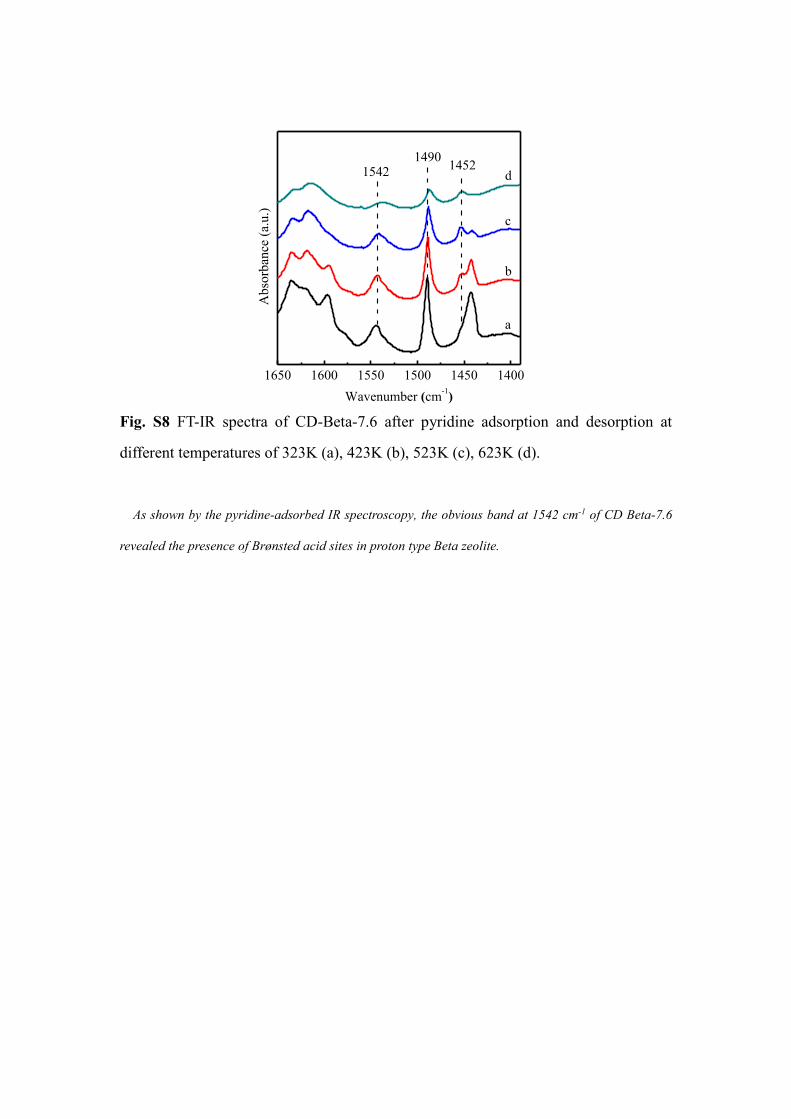
Fig. S8 FT-IR spectra of CD-Beta-7.6 after pyridine adsorption and desorption at
different temperatures of 323K (a), 423K (b), 523K (c), 623K (d).
As shown by the pyridine-adsorbed IR spectroscopy, the obvious band at 1542 cm-1 of CD Beta-7.6
revealed the presence of Brønsted acid sites in proton type Beta zeolite.
1650 1600 1550 1500 1450 1400
a
b
c
d1452
1490
Abso
rban
ce (
a.u.)
Wavenumber (cm-1)
1542

Fig. S9 27Al MAS NMR spectrum of the DeAl Beta-7.6 after calcination at 823 K for
6 h.
The DeAl Beta-7.6 after calcination exhibited a resonance at ~57 ppm in the 27Al MAS NMR spectrum,
which is typically assigned to tetrahedrally coordinated aluminum in zeolite framework, and there was
no resonance ascribed to octahedral coordinated extra-framework aluminum species between 0 and 3
ppm [17], indicating stable structure of DeAl Beta-12 after CD process.
150 100 50 0 -50 -100 -150
Chemical shift (ppm)

Fig. S10 Whole XPS spectrum (A), Si 2p XPS spectrum (B) and Al 2p XPS spectrum
(C) of industrial Beta.
XPS spectrum can reveal the external surface composition of zeolite [18-20]. The calculated Si/Al
ratio by XPS spectrum on the surface of industrial Beta was 5.1.
1200 1000 800 600 400 200 0
O Auger
Al
2P
Al
2S
Si
2P
Si
2S
O 1S
Inte
nsi
ty (
a.u.)
Binding energy (eV)
A
104 100 96 92
100.8
Inte
nsi
ty (
a.u
.)
Binding energy (eV)
B
85 80 75 70 65
72.2
C
In
ten
sity
(a.
u.)
Binding energy (eV)

Fig. S11 TEM images of DeAl Beta -12.
Obvious bright spots were observed in the DeAl Beta-12 zeolite after the dealumination process,
indicating that large amount of FAL was extracted by Al2(SO4)3 (Fig. S10a). As shown in Fig. S10b, the
characteristic crystal lattice fringes and intracrystal mesoporous (holes, yellow circle) could be observed
for DeAl Beta-12 zeolite within the same crystal, verifying that the crystalline structure of Beta zeolite
crystals was well maintained and mesopores were created by dealumination.
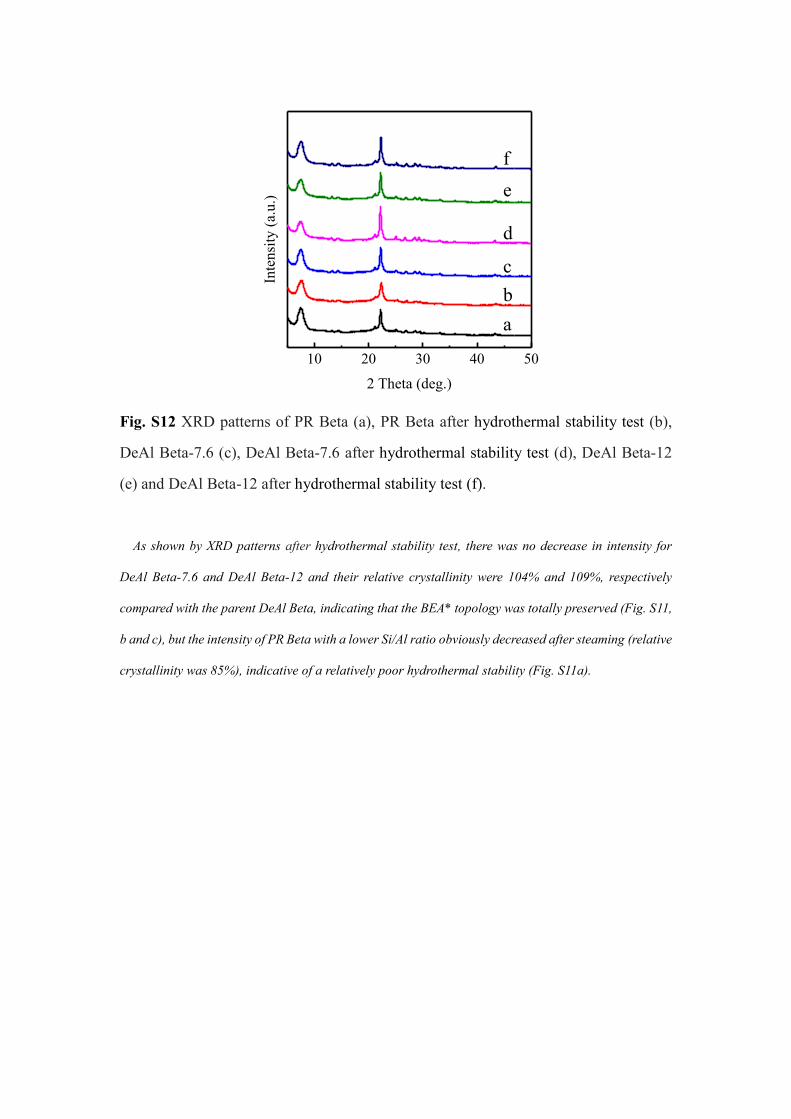
Fig. S12 XRD patterns of PR Beta (a), PR Beta after hydrothermal stability test (b),
DeAl Beta-7.6 (c), DeAl Beta-7.6 after hydrothermal stability test (d), DeAl Beta-12
(e) and DeAl Beta-12 after hydrothermal stability test (f).
As shown by XRD patterns after hydrothermal stability test, there was no decrease in intensity for
DeAl Beta-7.6 and DeAl Beta-12 and their relative crystallinity were 104% and 109%, respectively
compared with the parent DeAl Beta, indicating that the BEA* topology was totally preserved (Fig. S11,
b and c), but the intensity of PR Beta with a lower Si/Al ratio obviously decreased after steaming (relative
crystallinity was 85%), indicative of a relatively poor hydrothermal stability (Fig. S11a).
10 20 30 40 50
a
b
c
d
e
f
Inte
nsi
ty (
a.u.)
2 Theta (deg.)

Fig. S13 FT-IR spectra of PR Beta (a), DeAl Beta-7.6 (b), and DeAl Beta-12 (c) after
hydrothermal stability test.
It can be seen from the vibrations of fingerprint region of FT-IR spectra that the structural units of
BEA* topology were well maintained in hydrothermal test. Meanwhile, the asymmetric T-O-T stretching
vibration has moved to higher wavenumbers, especially for PR Beta (from 1048 to 1090 cm-1), indicating
that further dealumination of Beta zeolites occurred during the hydrothermal treatment.
1200 1000 800 600 400
c
b
460525
575790
1090
Tra
nsm
itta
nce
(%
)
Wavenumber (cm-1)
1235
a

Fig. S14 XRD patterns (A) of DeAl Beta-12 (a) and further dealumination of DeAl
Beta-12 zeolites with different concentrations of HNO3 solution at ambient
temperature (293 K): 1 M HNO3 (b), 3 M HNO3 (c), 6 M HNO3 (d); or under 413 K
reflux condition: 1 M HNO3 (e), 3 M HNO3 (f), 6 M HNO3 (g). Si/Al ratios (B) of the
further dealumination zeolites as a function of acid concentration in ambient
temperature (black line) or under 413 K reflux condition (red line). Other further
dealumination conditions: l/s (mass)= 20; treating time, 2 h.
DeAl Beta-12 was further dealuminated by acid leaching with an aqueous HNO3 solution for 2 hours
at ambient temperature (293 K) or under 413 K reflux condition, and the HNO3 concentrations used were
1 M, 3 M, and 6 M, respectively. It was reported that the structure of Al-rich Beta zeolite (Si/Al=5)
completely collapsed upon strong mineral acid treatment, which resulted in the formation of high lattice
defect concentrations and diminished the stability of the crystal structure [21]. In contrast, the Beta
structure almost remained intact after the CD process followed by the acid treatments (Fig. S14A),
suggesting the pre-dealumination by Al2(SO4)3 could stabilize Beta structure. Further acid leaching
drastically increased the Si/Al ratio from 12 to 39 by further removal of Al atoms from zeolite framework
(Fig. S14B). Thus, the Al-rich Beta can be efficiently dealuminated by Al2(SO4)3 followed by the acid
leaching, giving tunable Si/Al ratios.
10 20 30 40 50
A
e
d
b
f
g
c
Inte
nsi
ty (
a.u.)
2 Theta (deg.)
a
0 1 2 3 4 5 6
10
20
30
40
Si/
Al
Acid concentration (mol L-1)
B

Fig. S15 TG curves of used PR Beta (a), DeAl Beta-7.6 (b), and DeAl Beta-12 (c),
and industrial Beta (d) after the TIPB cracking reaction for 3 h.
TG curves of samples showed two weight losses. The one before 473 K can be attributed to the
physically adsorbed water, while weight losses in the range of 673 - 873 K can be assigned to the coke
[23,24]. The results showed that the coke amount of PR Beta (Fig. S15a) reached up to 10.3 wt%, which
indicated that the relatively small micropores in Beta zeolites significantly affected the mass transport in
catalytic reaction, resulting in severely coke formation and deactivation of catalyst. A lower amount of
carbon deposition (9.2 wt%) was observed for DeAl Beta-7.6 (Fig. S15b) after CD process. With further
dealumination, DeAl Beta-12(Fig. S15c) showed a much lower carbon deposition, only 4.3 wt%, mainly
due to its hierarchical pore system (Fig. 7Ae) and less acid sites than PR Beta. However, the industrial
Beta (Fig. S15d) had the highest carbon deposition (13.4 wt%), probably due to nanosized crystals and
Al-rich surface, resulting in the highest initial activity and fastest coke deposition rate.
400 600 800 100050
60
70
80
90
100
d
cb
Wei
gh
t (%
)
Temp. (K)
a
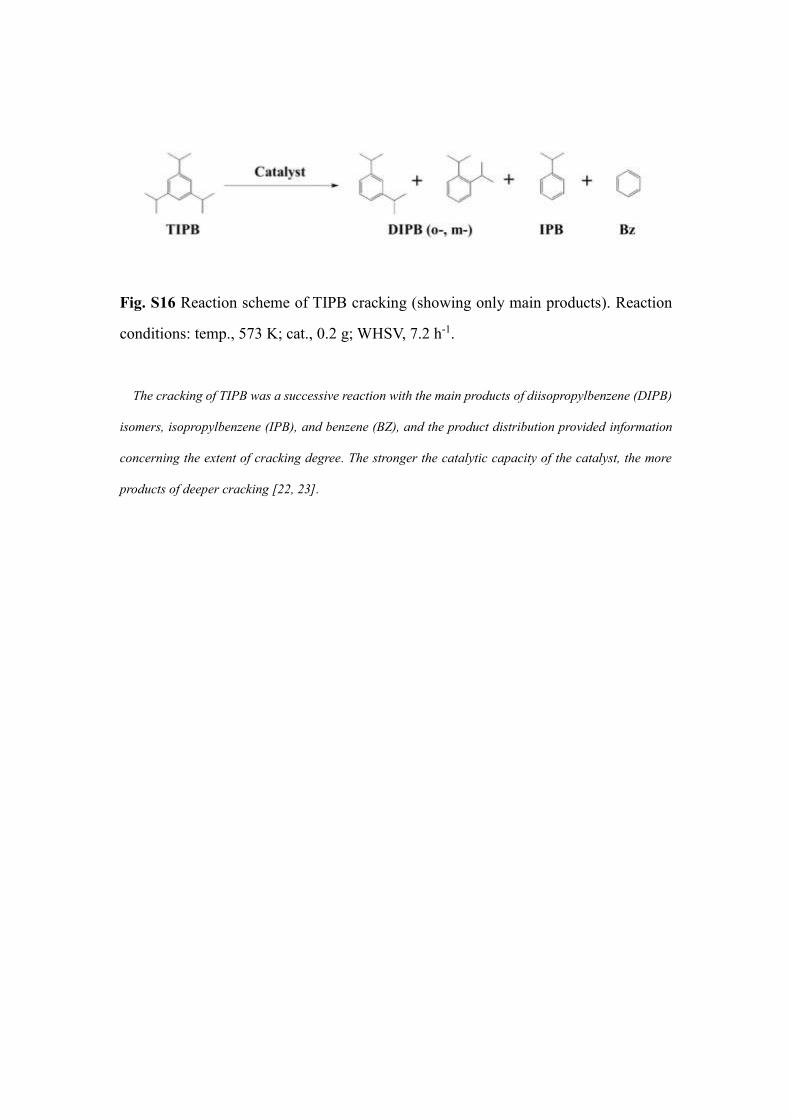
Fig. S16 Reaction scheme of TIPB cracking (showing only main products). Reaction
conditions: temp., 573 K; cat., 0.2 g; WHSV, 7.2 h-1.
The cracking of TIPB was a successive reaction with the main products of diisopropylbenzene (DIPB)
isomers, isopropylbenzene (IPB), and benzene (BZ), and the product distribution provided information
concerning the extent of cracking degree. The stronger the catalytic capacity of the catalyst, the more
products of deeper cracking [22, 23].

Fig. S17 XRD patterns of used PR Beta (a), DeAl Beta-7.6 (b), DeAl Beta-12 (c), and
industrial Beta (d) after the TIPB cracking reaction for 3 hours.
The catalysts after the TIPB cracking reaction were analyzed by XRD. Despite the presence of coke
deposition after the reaction, the structure of the four catalysts showed high crystallinity.
10 20 30 40 50
d
c
b
Inte
nsi
ty (
a.u
.)
2 Theta (deg.)
a

Fig. S18 Reaction scheme of acylation of anisole with acetic anhydride. Reaction
conditions: temp., 353 K; cat., 0.1 g; anisole, 5.23 g; acetic anhydride, 5 mmol.
In the Friedel-Crafts acylation of anisole with acetic anhydride reaction, the p-methoxyacetophenone
(p-MAP) was the main product with the selectivity over 98% [25, 26].

References
1 R. Otomo and T. Yokoi, Effect of the Al Content in the Precursor on the Crystallization of OSDA-Free
Beta Zeolite, Microporous Mesoporous Mater., 2016, 224, 155-162.
2 A. La Iglesia and A. J. Aznar, A Method of Estimating the Gibbs Energies of Formation of Zeolites,
Zeolites, 1986, 6, 26-29.
3 S. J. L. G. C. Gang, A New Method of Calculating Gibbs Free Energy of Formation of zeolites, J. Chem.
Ind. Eng., 2006, 57, 2806-2811.
4 S. Gaboreau and P. Vieillard, Prediction of Gibbs Free Energies of Formation of Minerals of the Alunite
Supergroup, Geochim. Cosmochim. Ac., 2004, 68, 3307-3316.
5 W. M. Haynes and D. R. Lide, CRC Handbook of Chemistry and Physics, 2010, p5, 4-24.
6 G. Huang, P. Ji, H. Xu, J. Jiang, L. Chen and P. Wu, Fast Synthesis of Hierarchical Beta Zeolites with
Uniform Nanocrystals from Layered Silicate Precursor, Microporous Mesoporous Mater., 2017, 248,
30-39.
7 B. J. Schoeman, E. Babouchkina, S. Mintova, V. P. Valtchev and J. Sterte, The Synthesis of Discrete
Colloidal Crystals of Zeolite Beta and Their Application in the Preparation of Thin Microporous Films,
J. Porous Mater., 2001, 8, 13–22.
8 Y. Liu, W. Zhang and T. J. Pinnavaia, Steam-Stable MSU-S Aluminosilicate Mesostructures Assembled
from Zeolite ZSM-5 and Zeolite Beta Seeds, Angew. Chem. Int. Ed., 2001, 40, 1225-1258.
9 A. D. Hadigavabar, K. Tabatabaeian, M. A. Zanjanchi and M. Mamaghani, Molybdenum Anchored
onto Zeolite Beta: An Efficient Catalyst for the One-Pot Synthesis of Octahydroquinazolinone
Derivatives under Solvent-Free Conditions, Reac. Kinet. Mech. Cat., 2018, 124, 857–871.
10 E. Astorino, J. B. Peri, R. J. Willey and G. Busca, Spectroscopic Characterization of Silicalite-1 and
Titanium Silicalite-1, J. Catal., 1995, 157, 482–500.
11 A. Zecchina, S. Bordiga, G. Spoto, L. Marchese, G. Petrini, G. Leofanti and M. Padoan, Silicalite
Characterization. 2. IR Spectroscopy of the Interaction of Carbon Monoxide with Internal and External
Hydroxyl Groups, J. Phys. Chem., 1992, 96, 4991–4997.
12 L. M. Kustov, V. B. Kazansky, S. Beran, L. Kubelkova, P. Jiru, Adsorption of Carbon Monoxide on
ZSM-5 Zeolites. Infrared Spectroscopic Study and Quantum-Chemical Calculations, J. Phys. Chem.,
1987, 91, 5247–5251.
13 A. Simon-Masseron, J. Marques, J. Lopes, F. R. Ribeiro, I. Gener, M. Guisnet, Influence of the Si/Al
Ratio and Crystal Size on the Acidity and Activity of HBEA Zeolite, Appl. Catal. A-Gen., 2007, 316,
75-82.
14 I. Kiricsi, C. Flego, G. Pazzuconi, W. O. J. Parker, R. Millini, C. Perego, G. Bellussi, Progress toward
Understanding Zeolite Beta Acidity: An IR and 27Al NMR Spectroscopic Study, J. Phys. Chem., 1994,
98, 4627-4634.
15 Z. Shi, P. Ji, Z. Zhu, J. Jiang, W. Fu, P. Wu, Y. Wang and M. He, Stabilizing Low-Silica Zeolites
through Aluminum Sulfate Assisted Cannibalistic Dealumination, ChemCatChem, 2016, 8, 1891-1895.
16 S. Li, A. Zheng, Y. Su, H. Zhang, L. Chen, J. Yang, C. Ye and F. Deng, Brønsted/Lewis Acid Synergy
in Dealuminated HY Zeolite: A Combined Solid-State NMR and Theoretical Calculation Study, J. Am.
Chem. Soc., 2007, 129, 11161-11171.

17 R. Bertram, U. Lohse and W. Gessner, Zur Charakterisierung des Extragitter‐Aluminiums in Y‐
Zeolithen Mittels der Ferronmethode, Z. Anorg. Allg. Chem., 1988, 567, 145-152.
18 H. Shimada, N. Matsubayashi, M. Imamura, T. Sato and A. Nishijima, Determination of External
Surface Composition of Zeolite Particles by Synchrotron Radiation XPS, Catal. Lett., 1996, 39, 125-
128.
19 O. Gijzeman, A. Mens, J. H. Lenthe, W. J. Mortier and B. M. Weckhuysen, The Effect of Chemical
Composition and Structure on XPS Binding Energies in Zeolites, J. Phys. Chem. B, 2003, 107, 678-
684.
20 L. Xu, D. Huang, C. Li, X. Ji, S. Jin, Z. Feng, F. Xia, X. Li, F. Fan, C. Li, P. Wu, Construction of
Unique Six-Coordinated Titanium Species with an Organic Ligand in Titanosilicate and Their
Unprecedented High Efficiency for Alkenes Epoxidation, Chem. Comm., 2015, 51, 9010-9013.
21 Y. Wang, R. Otomo, T. Tatsumi and T. Yokoi, Dealumination of Organic Structure-Directing Agent
(OSDA) Free Beta Zeolite for Enhancing Its Catalytic Performance in n-Hexane Cracking,
Microporous Mesoporous Mater., 2016, 220, 275-281.
22 X. Ji, H. Xu, D. Wang, L. Xu, P. Ji, H. Wu and P. Wu, Mesoporous MCM-22 Zeolites Prepared through
Organic Amine-Assisted Reversible Structural Change and Protective Desilication for Catalysis of
Bulky Molecules, ACS Catal., 2013, 3, 1892-1901.
23 H. Liu, T. Li, B. Tian and Y. Xu, Study of Coke Deposition on Mo/HZSM-5 Catalyst in Methane
Dehydro-Aromatization under Non-oxidative Conditions, Chin. J. Catal., 2001, 22, 373-376.
24 C. Li and P. C. Stair, Ultraviolet Raman Spectroscopy Characterization of Coke Formation in Zeolites,
Catal. Today, 1997, 33, 353-360.
25 L. Xu, X. Ji, S. Li, Z. Zhou, X. Du, J. Sun, F. Deng, S. Che and P. Wu, Self-Assembly of
Cetyltrimethylammonium Bromide and Lamellar Zeolite Precursor for the Preparation of Hierarchical
MWW Zeolite, Chem. Mater., 2016, 28, 4512-4521.
26 M. Guidotti, C. Canaff, J. M. Coustard, P. Magnoux and M. Guisnet, Acetylation of Aromatic
Compounds over H-BEA Zeolite: The Influence of the Substituents on the Reactivity and on the
Catalyst Stability, J. Catal., 2005, 230, 375−383.
Related Documents
![*XJJHQKHLP - unipd.ittesi.cab.unipd.it/52797/1/CHIARA_ZANANDREA_2016.pdf · 2016-07-28 · î ,vwlwx]lrql 3duwqhu o,vwlwxwr ghl &lhfkl gl 0lodqr o 8qlrqh ,wdoldqd ghl &lhfkl h ghjol](https://static.cupdf.com/doc/110x72/5c67714409d3f2c85f8be783/xjjhqkhlp-unipd-2016-07-28-i-vwlwxlrql-3duwqhu-ovwlwxwr-ghl-lhfkl.jpg)


![)URQWLHUV 7KLVMRXUQDOLV ...HNC Aniline + K3[Fe(CN)6] Polymerization + carbonization (900 C) 1.95 0.50 1.001 0.796 [6] THNCM glucose + dicyandiamide Hydrothermal + carbonization (800](https://static.cupdf.com/doc/110x72/5ed86505b7394006ce601ca3/urqwlhuv-7klvmrxuqdolv-hnc-aniline-k3fecn6-polymerization-carbonization.jpg)