91 Chapter 4 Urbanization and Urban Population by Antonio Golini 4.1. Urbanization at a Glance 4.1.1. A Short Overview of the African Urbanization By the early decades of this century, the overwhelming majority of people in almost all countries will, for the first time in the history of humankind, be living in an urban environment. Driven by demographic “explosion”, accelerated by globalization of the world economy and other economic and social changes, “rapid urban growth over the past decades, especially in developing countries, has literally transformed the face of our planet” (Habitat, 1996, p. v). In the last decades and in the coming ones urban settlements were and will be the primary places for the struggle for development and social and economic progress. In many cases, the mass exodus to cities has already led to sharpened urban poverty, scarcity of housing and basic services, unemployment and underemployment, ethnic tensions and violence, substance abuse, crime and social disintegration. Moreover, an emergency and one of the most binding challenges is constituted by air, water, and land pollution in giant mega- cities (Habitat, 1996). Most of the nations with the fastest growing populations are now in Africa, although this is a relatively recent phenomenon. But looking more properly at the urban population, in the period 1950-2000, in Africa the growth rate was the fastest in the world (4.4 percent a year), even though the urban percentage in 1950 was the lowest (15 percent). Nevertheless the present situation is that Africa, together with Asia, still has, among continents, the lowest percentage of urban population (38 percent) (Table 4.1). In the meantime, if one looks at a map of Africa, which shows the largest urban centers, one can find, in the Western and Northern part of the continent, some of the major mega-cities of the world. Lagos (Nigeria), Cairo (Egypt), Kinshasa (Dem. Rep. of the Congo), are characterized by a very fast growth. In the period 1970-2000, Lagos passed from 2.025 to 13.427 million inhabitants (on average 380 thousand additional persons every year along a period of the thirty years). Cairo from 5.333 to 10.552 (174 thousand additional persons a year); Kinshasa from 1.370 to 5.064 (123 thousand additional persons a year) 1 . But enormous changes can be observed more, in general, in African cities. Looking back to the period from early 1960’s to the mid 1990’s, i.e. from the years in which most African countries obtained independence to the end of the ‘last decade (in the 1980’s there was a severe economic crises and many countries had declines in per capita income), in general, African cities have changed in at least four major ways. These include their size, their spatial organization, the quality and distribution of public services and infrastructure and their employment base. Most African cities grew several folds in the last decades both due to rural-urban migration and natural increase. In many countries a large part or most medium-sized cities have been growing more quickly than the largest cities, also as a consequence of planning decisions. There was the deterioration of services and infrastructure, 1 Basic data are from Population Division, 2000

Welcome message from author
This document is posted to help you gain knowledge. Please leave a comment to let me know what you think about it! Share it to your friends and learn new things together.
Transcript
91
Chapter 4
Urbanization and Urban Population
by Antonio Golini 4.1. Urbanization at a Glance 4.1.1. A Short Overview of the African Urbanization
By the early decades of this century, the overwhelming majority of people in almost all countries will, for the first time in the history of humankind, be living in an urban environment. Driven by demographic “explosion”, accelerated by globalization of the world economy and other economic and social changes, “rapid urban growth over the past decades, especially in developing countries, has literally transformed the face of our planet” (Habitat, 1996, p. v). In the last decades and in the coming ones urban settlements were and will be the primary places for the struggle for development and social and economic progress. In many cases, the mass exodus to cities has already led to sharpened urban poverty, scarcity of housing and basic services, unemployment and underemployment, ethnic tensions and violence, substance abuse, crime and social disintegration. Moreover, an emergency and one of the most binding challenges is constituted by air, water, and land pollution in giant mega-cities (Habitat, 1996).
Most of the nations with the fastest growing populations are now in Africa, although
this is a relatively recent phenomenon. But looking more properly at the urban population, in the period 1950-2000, in Africa the growth rate was the fastest in the world (4.4 percent a year), even though the urban percentage in 1950 was the lowest (15 percent). Nevertheless the present situation is that Africa, together with Asia, still has, among continents, the lowest percentage of urban population (38 percent) (Table 4.1).
In the meantime, if one looks at a map of Africa, which shows the largest urban
centers, one can find, in the Western and Northern part of the continent, some of the major mega-cities of the world. Lagos (Nigeria), Cairo (Egypt), Kinshasa (Dem. Rep. of the Congo), are characterized by a very fast growth. In the period 1970-2000, Lagos passed from 2.025 to 13.427 million inhabitants (on average 380 thousand additional persons every year along a period of the thirty years). Cairo from 5.333 to 10.552 (174 thousand additional persons a year); Kinshasa from 1.370 to 5.064 (123 thousand additional persons a year)1. But enormous changes can be observed more, in general, in African cities.
Looking back to the period from early 1960’s to the mid 1990’s, i.e. from the years in
which most African countries obtained independence to the end of the ‘last decade (in the 1980’s there was a severe economic crises and many countries had declines in per capita income), in general, African cities have changed in at least four major ways. These include their size, their spatial organization, the quality and distribution of public services and infrastructure and their employment base. Most African cities grew several folds in the last decades both due to rural-urban migration and natural increase. In many countries a large part or most medium-sized cities have been growing more quickly than the largest cities, also as a consequence of planning decisions. There was the deterioration of services and infrastructure,
1 Basic data are from Population Division, 2000

92
inevitable result of economic stagnation and the rapid growth rate of the population. There was a decline in well-paid, secure employment and a strong growth of work in the informal economy or unregulated sector for developing activities to respond to the needs and financial capacity of the poor. Moreover, it must be considered that in African urban centers, urban agriculture has the greatest importance as a supplementary source of livelihood, or of food and fuel (Habitat, 1996).
Table 4.1 – Distribution of the Population by Urban and Rural Place of Residence, 1950-2030
Population (millions) Growth rate (percentage)
Doubling time(years) Population and
major areas 1950 1975 2000 2030
1950-2000
2000-2030
1950-2000 2000-2030
A. Population size and growth
Total population World 2521 4075 6055 8112 1.8 1.0 40 71 More developed regions 813 1048 1188 1210 0.8 0.1 91 1,158 Less developed regions 1709 3026 4867 6902 2.1 1.2 33 60 Africa 221 406 784 1,406 2.5 1.9 27 36 Ethiopia 18 32 63 128 2.5 2.4 28 29 Urban population World 750 1544 2845 4889 2.7 1.8 26 38 More developed regions 446 734 903 1010 1.4 0.4 49 186 Less developed regions 304 810 1942 3880 3.7 2.3 19 30 Africa 32 102 297 766 4.4 3.2 16 22 Ethiopia 0.84 3.1 11 45 5.1 4.7 13 15 Rural population World 1772 2531 3210 3226 1.2 0.01 58 5,313 More developed regions 367 315 285 200 -0.5 -1.2 - - Less developed regions 1405 2217 2925 3023 1.5 0.1 47 632 Africa 188 304 487 640 1.9 0.9 36 76
Ethiopia 18 29 52 83 2.1 1.6 33 45
B. Urban Indicator
Major areas Percentage urban Urbanization
rate (per 100)
Doubling time (in years)
World 29.7 37.9 47.0 60.3 0.9 0.8 76 83 More developed regions 54.9 70.0 76.0 83.5 0.7 0.3 - - Less developed regions 17.8 26.8 39.9 56.2 1.6 1.1 43 61 Africa 14.5 25.1 37.9 54.5 1.9 1.2 37 57 Ethiopia 4.6 9.5 17.6 35.3 2.7 2.3 26 30
Source: Own calculations on data from Population Division (2000) 4.1.2. The Ethiopian Situation
Ethiopia is largely under-urbanized, even, considering Africa standards. According to the very recent estimates and projections of the Population Division of the United Nations, around 1975 only 9.5 percent of the population lived in urban areas of at least 2,000 people. For the whole Africa, the percentage was 25.1. In the year 2000, the two proportions were respectively 17.6 and 37.9 (Table 4.1). In Ethiopia, one can find hundreds of communities with 2,000 to 5,000 people. But in the majority of cases, these are just an extension of rural villages without urban administrative functions. Even, if in the last decades and very likely in the next ones, the urbanization rate will be faster in Ethiopia than in Africa. In 2030, the proportion of urban population in the country would be largely lower than in the Continent

93
(35.3 versus 54.5 percent). Still in 2030, the rural population (83 millions) could almost double the urban one (45 millions). The population of Addis Ababa grew from 0.730 million in 1970 to 2.639 in 2000. An average of 64 thousand additional persons a year, i. e. in absolute terms, much less than other African urban agglomerations we quoted above, but at a comparable rate (4.4 percent versus 6.2 for Lagos, 2.3 for Cairo, and 4.5 for Kinshasa).
Ethiopia’s relative lack of urbanization can be primarily attributed to the self-
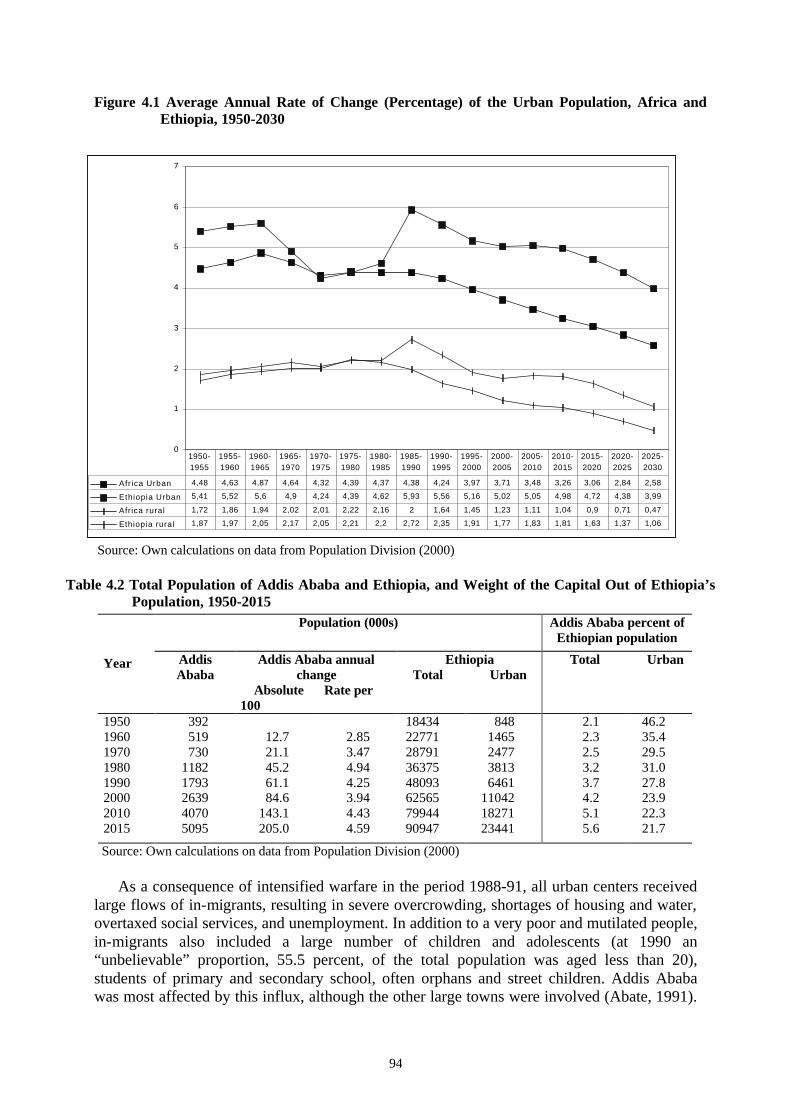
sufficiency of agriculture, which helped reinforce the rural peasant life. The slow speed of urbanization continued until the middle of 1930s, while it was more rapid during and after the Italian occupation of 1936-41 (Abate, 1991). Urbanization accelerated between 1950 and 1965, when the average growth rate was between 5.4 and 5.6 per cent a year, a rate, which implies a doubling of population in only 13 years. Again, urban population growth in the last fifteen years of the last century was very fast with rates over 5 per cent and a peak in the quinquennium 1985-1990, when the annual rate of change reached 5.93 percent (which implies a doubling time of only 12 years) (Figure 4.1). The most rapid growth of the urban population is associated with the highest values of the difference between urban and rural rates and massive rural-to-urban migration up to 1975. Whereas, the 1975 land reform program provided incentives and opportunities for peasants and other potential migrants to stay in rural areas. Restrictions on travel, lack of employment, housing shortages, and social unrest in some towns during the 1975-1980 period also contributed to a decline in rural-to-urban migration (Abate, 1991).
The annual rate of change of the rural population was very high. Globally, considering the period 1950-2000, it reached 2.2 percent, which allowed the rural population to grow from 17.586 million to 51.523 in only fifty years. Until 1985, the growth rate was more or less the same as the whole of Africa. But in the last 15 years of the last century, the rate largely declined in Africa, while it fell much slower in Ethiopia. The difference in the speed of growth is mainly related to differences in fertility. From 1975-1980 to 1995-2000, the Population Division (1999) of the United Nations estimates that the average number of children per woman fell for the total population of Africa from 6.52 to 5.06 and for Ethiopia from 6.81 to only 6.30. Without any doubt, in Ethiopia, we can observe an “excess” fertility, which leads to an “excess” population growth, in spite of a very burdensome high infant mortality rate and low expectation of life.
Urban growth was especially evident in the northern half of Ethiopia, where most of the major towns are located. The period 1967-1975 saw the rapid growth of relatively new urban centers. In only eight years, the increase in the population of six towns was more than tripled. Whereas, the increas of Akaki, Arba Minch, Awasa, Bahir Dar, Jijiga, Shashemene and eight other towns was more than doubled. Some of the cities, with the most rapid growth were capitals of newly designated administrative regions and important agricultural centers. Some other towns have very convenient locations, or are newly planned cities or are the sites of several industries and education institutes. Some others became communications and services centers (Abate, 1991). The result is a very established network of towns and a sufficiently equilibrated territorial distribution of the population. As a result of the intense and rapid growth of many cities, the weight of Addis Ababa as home of the country’s urban population largely declined starting from 1950. At the middle of the last century, the capital was home to a little bit less than half of the urban population, while at the end, it was home to about 24 percent of the urban population (Table 4.2).
94
Figure 4.1 Average Annual Rate of Change (Percentage) of the Urban Population, Africa and Ethiopia, 1950-2030
Source: Own calculations on data from Population Division (2000)
Table 4.2 Total Population of Addis Ababa and Ethiopia, and Weight of the Capital Out of Ethiopia’s Population, 1950-2015
Population (000s) Addis Ababa percent of Ethiopian population
Year Addis Ababa
Addis Ababa annual change
Absolute Rate per 100
Ethiopia Total Urban
Total Urban
1950 392 18434 848 2.1 46.2 1960 519 12.7 2.85 22771 1465 2.3 35.4 1970 730 21.1 3.47 28791 2477 2.5 29.5 1980 1182 45.2 4.94 36375 3813 3.2 31.0 1990 1793 61.1 4.25 48093 6461 3.7 27.8 2000 2639 84.6 3.94 62565 11042 4.2 23.9 2010 4070 143.1 4.43 79944 18271 5.1 22.3 2015 5095 205.0 4.59 90947 23441 5.6 21.7
Source: Own calculations on data from Population Division (2000)
As a consequence of intensified warfare in the period 1988-91, all urban centers received large flows of in-migrants, resulting in severe overcrowding, shortages of housing and water, overtaxed social services, and unemployment. In addition to a very poor and mutilated people, in-migrants also included a large number of children and adolescents (at 1990 an “unbelievable” proportion, 55.5 percent, of the total population was aged less than 20), students of primary and secondary school, often orphans and street children. Addis Ababa was most affected by this influx, although the other large towns were involved (Abate, 1991).
0
1
2
3
4
5
6
7
Africa Urban 4,48 4,63 4,87 4,64 4,32 4,39 4,37 4,38 4,24 3,97 3,71 3,48 3,26 3,06 2,84 2,58
Ethiopia Urban 5,41 5,52 5,6 4,9 4,24 4,39 4,62 5,93 5,56 5,16 5,02 5,05 4,98 4,72 4,38 3,99
Africa rural 1,72 1,86 1,94 2,02 2,01 2,22 2,16 2 1,64 1,45 1,23 1,11 1,04 0,9 0,71 0,47
Ethiopia rural 1,87 1,97 2,05 2,17 2,05 2,21 2,2 2,72 2,35 1,91 1,77 1,83 1,81 1,63 1,37 1,06
1950-1955
1955-1960
1960-1965
1965-1970
1970-1975
1975-1980
1980-1985
1985-1990
1990-1995
1995-2000
2000-2005
2005-2010
2010-2015
2015-2020
2020-2025
2025-2030
95
In general terms, the internal population distribution has been affected by several well-known factors. The most important and useful to recall at this juncture ar: -
a) The pattern of relief and the structure of occupation. The highlands, characterized by
adequate rainfal, are the home of settled agriculture and contain nearly all of the major settlements. Land under 2,000 m sea level is infected by malarial mosquito and is not actually suitable for farmers. It can be estimated (Europa Publications Limited, 1998) that only 10 percent of the population live below 1,000 m, 20 percent at 1,000–1,800 m, and 70 percent above 1,800 m. And around 88-89 percent of the labor force is occupied in agriculture, hunting, and forestry2;
b) Recurrent droughts since the mid-1980s forced many people to move away from their
traditional place of residence; c) The former government’s policy of resettlement and villagization of people3. This is by
considering that by the end of 1988, more than 12 million people had been relocated in villages in twelve of the fourteen administrative regions;
d) The civil war, that intensified between 1989 and 1991 and the 1993 independence of
Eritrea (as a consequence of which Ethiopia had become the world’s most populous landlocked state).
These internal population distribution and movements should be also considered and evaluated in the larger framework of population movements experienced in the Horn of Africa, afflicted in the last decades by famine, separatist violence and ethnic conflicts. Just to give a couple of references and figures. one can recall that, according to data of UNHCR (United Nations High Commissioner for Refugees), at November 1997, Ethiopia was still hosting some 354,000 refugees, mainly from Somalia, Sudan, Djibouti, and Kenya. These were the same countries to which more than 900,000 Ethiopians fled during the 1980s (Europa Publications Limited, 1998). 4.2. Urban Structure in Ethiopia 4.2.1. The Cities and Towns Network
As it was already stated, Ethiopia’s relative lack of urbanization can primarily be attributed to the self-sufficiency of agriculture, which contributed to reinforcing of the rural peasant life, to the morphology of its territory and to profound roots, which link the various ethnic groups to their proper land. But more in general, historical factors conditioned the country’s urbanization (Markakis, 1974). “With the exception of Harrar, a city of Arab foundation, there are no large towns in Abyssinia4. Harrar is some 30 miles South East of Dire Dawa, whence there is a railway (188 miles long) to Jibuti on the Gulf of Aden. The absence of large towns in Abyssinia proper is due to the continual warfare almost for centuries 2 According to official estimates, the ILO Yearbook of Labour Statistics reports that mid-1995 out of a total labor force of 24.4 m, 21.6 m are employed in agriculture (88.6 percent), of which 12.7 m males (out of 14.2 m, 89.3 percent) and 8.9 m females (out of 10.2 m, 87.6 percent). 3 Consisting in bringing together several villages as single units for security and political reasons. A program which later was abandoned. 4 The Encyclopaedia Britannica reports “Abyssinia (officially Ethiopia) …”. The name Abyssinia, often used in the past instead of Ethiopia, would derive from habbashat an Arab word which identifies a Yemenit ethnic group who emigrated to Africa about 2000 b.C.

96
between the provinces [kingdoms] into which the country is divided and to the frequent change of the royal residence.
The earliest capital appears to have been Axum, in Tigray where there are extensive
ruins. In the Middle Ages, Gondar in Amhara became the capital of the country and was so regarded up to the middle of the 19th century. Since 1892, the capital has been Addis Ababa in the kingdom of Shoa. The other towns of Abyssinia, worthy of mention, may be grouped according to their geographical position. None of them has a permanent population exceeding 6000, but several large markets are held periodically” (The Encyclopaedia Britannica, 1926, Vol. I, p. 86). “The main function of [these cities] and other ancient Ethiopian towns were related to religion and pilgrimage, commerce and handicraft, traditional seats of the kings and cultural-arts activities. Apart from a few magnificent traditional and cultural attainments, these centers could not grow and bring about substantial changes in the socio-economic development. And were not capable of acting as centers of influence for the life of the population of the rural hinterlands throughout the years of their existence. The mobile nature of the kings and the feudal nobility who were in constant move from place to place, devastating the local resources, was one of the main detrimental factors to the growth of the old or new centers.” (Bariagaber, 1996, p. 71).
The modest country’s urbanization is a recent phenomenon. According to the
estimates of the Population Division (2000), in 1950 the proportion of urban population was only 4.6 percent of total population and in all cases, very low everywhere in Eastern Africa (5.3 percent)5. The population of Addis Ababa was almost half of the total urban population (Table 4.2).
The speed of urbanization was very rapid and accelerated between 1950 and 1965. the
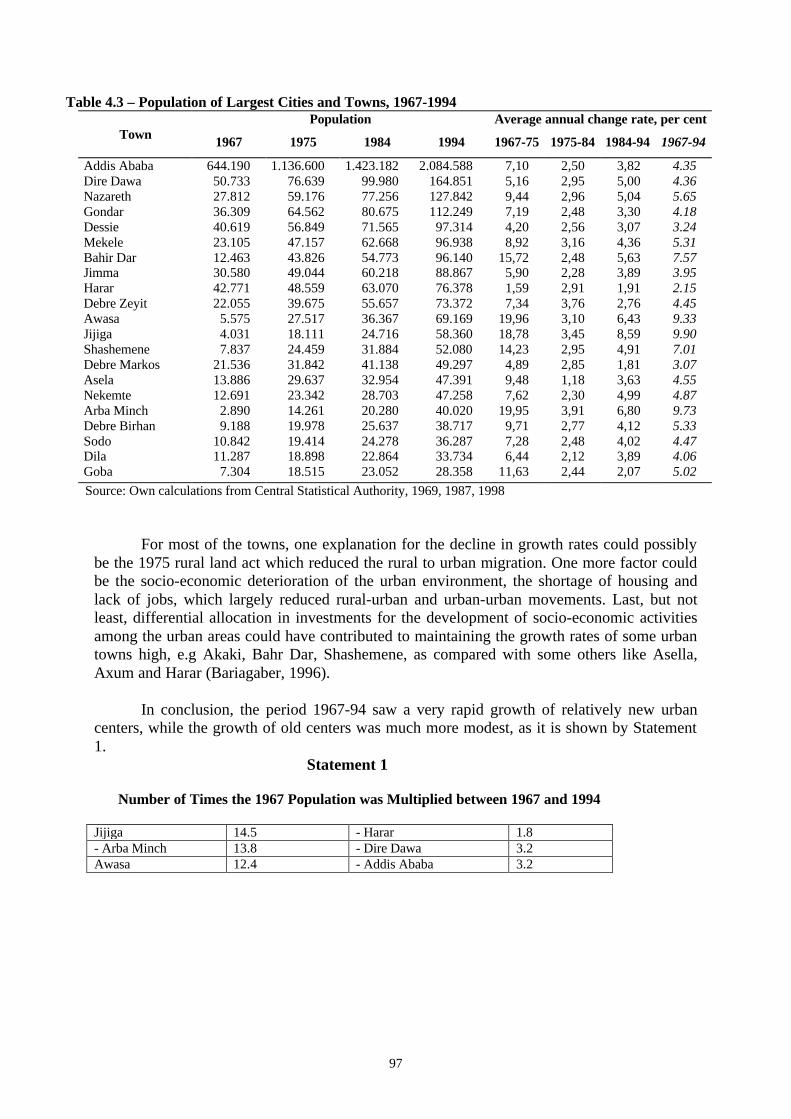
average growth rate was between 5.4 and 5.6 per cent a year (Figure 4.1), a rate which implies a doubling of the population in only 13 years. “It is during the period before the revolution, in the 1960s, that a system of urban centers developed around the capital city. These urban centers created branchs throughout the country to reach the old regional capitals of the north and the political-military checkpoints of the south, connecting with centers of more recent founding at the nodes of the national transport network” (Greppi, 1996, p. 41). During the period 1967-75, the growth of some cities was extremely rapid. The population of 14 towns more than doubled in this eight years period and in 6 of them more than tripled (Table 4.3). As a consequence, the percentage of urban population residing in Addis Ababa in the period 1950-1975 fell from 46.2 to 30.4 percent. Rural to urban migration had been largely responsible for the rapid expansion during the 1967-75 period, whereas natural population growth may have been mostly responsible for urban expansion during the 1975-84 period. This ois also because of the 1975 land reform program, which provided incentives and opportunities for peasant and other potential migrants to remain in rural areas (Abate, 1991).
Indeed, between 1975 and 1984 the speed of growth of cities and towns was reduced
and became rapid again between 1984 and 1994, but at rates largely smaller than those of the first period. A new kind of urban system has developed, even around the largest city, where a dense network of smaller cities develop and proved to be more dynamic than the large city itself.
5 In the rest of Africa it was already 18.6 percent.
97
Table 4.3 – Population of Largest Cities and Towns, 1967-1994 Population Average annual change rate, per cent
Town 1967 1975 1984 1994 1967-75 1975-84 1984-94 1967-94
Addis Ababa 644.190 1.136.600 1.423.182 2.084.588 7,10 2,50 3,82 4.35 Dire Dawa 50.733 76.639 99.980 164.851 5,16 2,95 5,00 4.36 Nazareth 27.812 59.176 77.256 127.842 9,44 2,96 5,04 5.65 Gondar 36.309 64.562 80.675 112.249 7,19 2,48 3,30 4.18 Dessie 40.619 56.849 71.565 97.314 4,20 2,56 3,07 3.24 Mekele 23.105 47.157 62.668 96.938 8,92 3,16 4,36 5.31 Bahir Dar 12.463 43.826 54.773 96.140 15,72 2,48 5,63 7.57 Jimma 30.580 49.044 60.218 88.867 5,90 2,28 3,89 3.95 Harar 42.771 48.559 63.070 76.378 1,59 2,91 1,91 2.15 Debre Zeyit 22.055 39.675 55.657 73.372 7,34 3,76 2,76 4.45 Awasa 5.575 27.517 36.367 69.169 19,96 3,10 6,43 9.33 Jijiga 4.031 18.111 24.716 58.360 18,78 3,45 8,59 9.90 Shashemene 7.837 24.459 31.884 52.080 14,23 2,95 4,91 7.01 Debre Markos 21.536 31.842 41.138 49.297 4,89 2,85 1,81 3.07 Asela 13.886 29.637 32.954 47.391 9,48 1,18 3,63 4.55 Nekemte 12.691 23.342 28.703 47.258 7,62 2,30 4,99 4.87 Arba Minch 2.890 14.261 20.280 40.020 19,95 3,91 6,80 9.73 Debre Birhan 9.188 19.978 25.637 38.717 9,71 2,77 4,12 5.33 Sodo 10.842 19.414 24.278 36.287 7,28 2,48 4,02 4.47 Dila 11.287 18.898 22.864 33.734 6,44 2,12 3,89 4.06 Goba 7.304 18.515 23.052 28.358 11,63 2,44 2,07 5.02
Source: Own calculations from Central Statistical Authority, 1969, 1987, 1998
For most of the towns, one explanation for the decline in growth rates could possibly
be the 1975 rural land act which reduced the rural to urban migration. One more factor could be the socio-economic deterioration of the urban environment, the shortage of housing and lack of jobs, which largely reduced rural-urban and urban-urban movements. Last, but not least, differential allocation in investments for the development of socio-economic activities among the urban areas could have contributed to maintaining the growth rates of some urban towns high, e.g Akaki, Bahr Dar, Shashemene, as compared with some others like Asella, Axum and Harar (Bariagaber, 1996).
In conclusion, the period 1967-94 saw a very rapid growth of relatively new urban
centers, while the growth of old centers was much more modest, as it is shown by Statement 1.
Statement 1 Number of Times the 1967 Population was Multiplied between 1967 and 1994
Jijiga 14.5 - Harar 1.8 - Arba Minch 13.8 - Dire Dawa 3.2 Awasa 12.4 - Addis Ababa 3.2
98
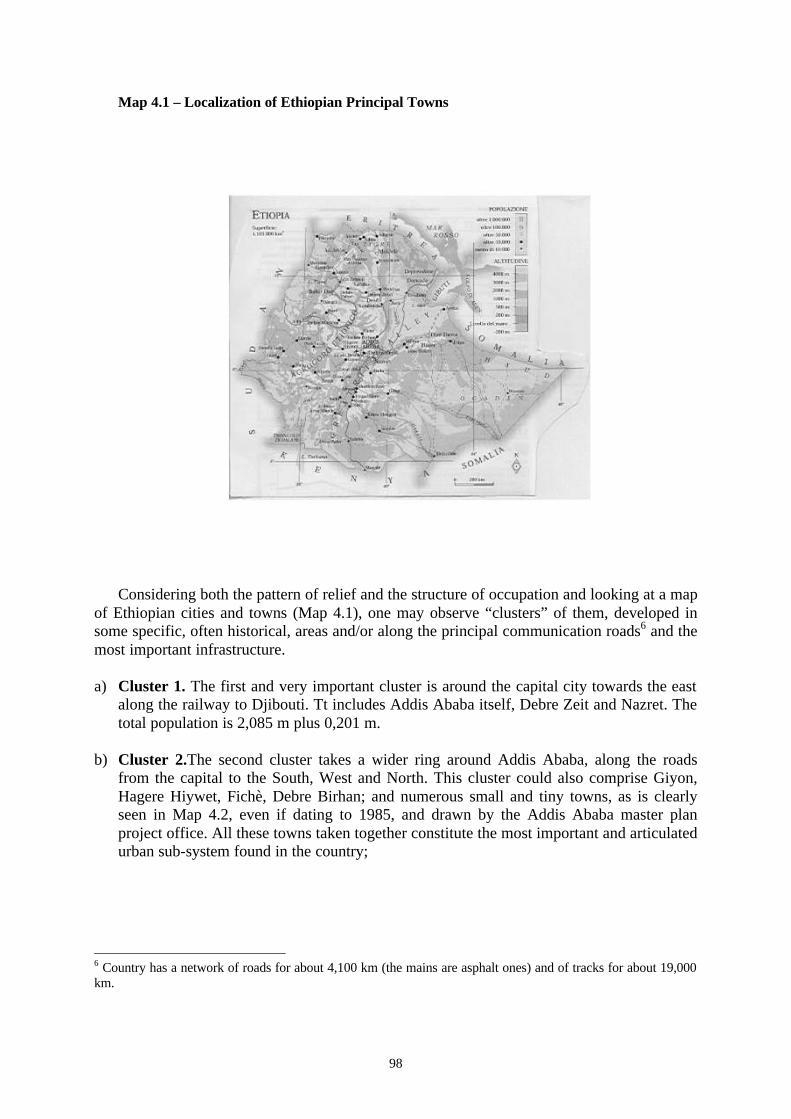
Map 4.1 – Localization of Ethiopian Principal Towns
Considering both the pattern of relief and the structure of occupation and looking at a map
of Ethiopian cities and towns (Map 4.1), one may observe “clusters” of them, developed in some specific, often historical, areas and/or along the principal communication roads6 and the most important infrastructure.
a) Cluster 1. The first and very important cluster is around the capital city towards the east
along the railway to Djibouti. Tt includes Addis Ababa itself, Debre Zeit and Nazret. The total population is 2,085 m plus 0,201 m.
b) Cluster 2.The second cluster takes a wider ring around Addis Ababa, along the roads
from the capital to the South, West and North. This cluster could also comprise Giyon, Hagere Hiywet, Fichè, Debre Birhan; and numerous small and tiny towns, as is clearly seen in Map 4.2, even if dating to 1985, and drawn by the Addis Ababa master plan project office. All these towns taken together constitute the most important and articulated urban sub-system found in the country;
6 Country has a network of roads for about 4,100 km (the mains are asphalt ones) and of tracks for about 19,000 km.

99
Map 4.2 – Urban System of Shewa and Arsi
b) Cluster 3.The third major cluster, linear in this case, is found in the road going south to Kenya, along the Great Rift Valley. This comprises a series of cities following one another within a few kilometers. These include Shashemene, Awasa, Yirga Alem, Wendo, Dila; and also Yabelo, further south along the road to Kenya; c) Cluster 4.The fourth clused is formed in the north, along the road going to Eritrea, by the
cities of Desé, Kembolcha, Weldiya and Debre Zebit; d) Cluster 5.The fifth cluster, once again linear, can be identified in the north of the country,
along the border and includes Aksum, Adwa and Adigrat. This could also include Mekele, Tigray’s capital town;
e) Cluster 6.The sixth cluster, circular, has developed around lake Tana, including Gonder,
Azezo, Adis Zemen and Bahir Dar; f) Cluster 7.The seven cluster comprises in the south-west, the cities of Jimma, Agaro and
Bonga; g) Cluister 8.The eighth cluster, consisting of two historic cities, Dire Dawa, from where the
original train track to Djibouti started (before it was extended to Addis Ababa) and Harar.
100
These clusters form the backbone of the Ethiopian urban network, a weak backbone, of course, which stretches out to cover hundreds and hundreds of small and tiny towns. It should be noted that in the extensive Ethiopian landscape, vast “urban deserts” exist. What are lacking are true and proper urban systems made up of small and smallest cities.
Within this framework and in one of improved political and military control of the
territory, we must consider the controversial policy of resettling the victims of the drought and famine outside their home areas. And no less controversial “villagization”, policies that have greatly contributed to the geographical distribution of the population and urbanisation processes. Additionally, the civil war, which intensified between 1989 and its resolution in 1991, caused the displacement of large numbers of people.
The resettlement policy was initially designed to relocate 1.5 million people from areas in
the north, which are most affected by the drought, to areas in the west and south that experienced adequate rainfall. In 1988, the president Mengistu estimated that eventually 7 million of Ethiopia’s approximately 48 million people would be resettled. The government claimed that it was carrying out for humanitarian reasons and to greatly facilitate its efforts to provide social services. The resettlement scheme, ill prepared and less than voluntary, was terminated also as a result of international criticism.
The idea of clustering villages, the villagization program, was introduced in the Land
Reform Proclamation of 1975. The official objective of the move was to provide social services more efficiently and to stimulate voluntary self-help among villagers. The long term objective of the program was the movement of 33 million rural residents into villagized settlement by 1994. By late 1989, about 13 million peasant had been villagized. On a purely technical ground, resettlement and villagization seemed to make sense on one hand for improving the access of rural people to social services and their ability to defend themselves and on the other hand for converting villagized communities into producers’ cooperative (Ethiopia, 1991).
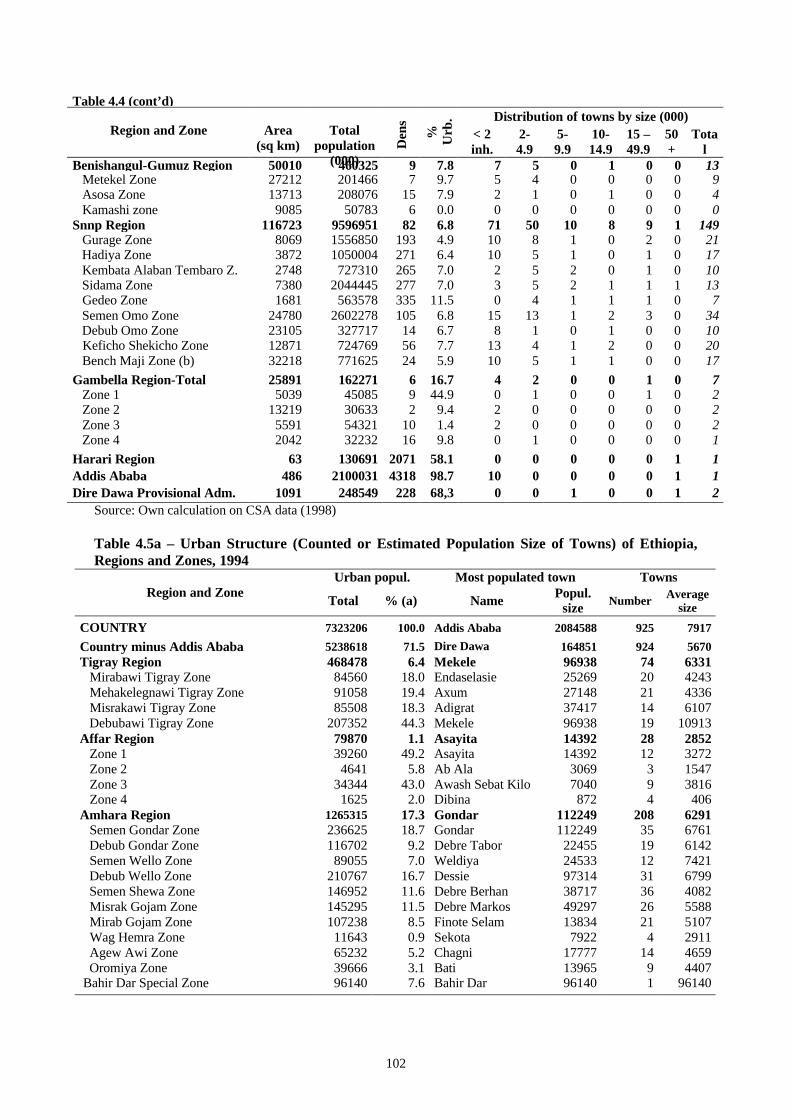
Similarly, interesting results emerge from looking at the country’s urban network under
the profile of administrative divisions. That is nine ethnically-based administrative regions and two chartered cities. A synthetic outline of the situation of urbanization and urban centers at the 1994 census is given in Tables 4.4. and 4.5. A synopsis should include the following main points:-
a) The urban system consists of 925 towns and 7.3 million people, which is 13.7 percent out
of the total population; b) The capital city has a population of 2.085 m people (or 2.165 m at 1995 according to the
Population Division of the UN), which is 3.9 per cent out of the total population; c) Only other 12 towns have 50,000 or more people (up to a maximum of 165,000
inhabitants), that make up of 1.114 m people (92,797 inh. on average), which is 2.1 percent of total population;
d) The system includes an enormous number of hundreds of small and very small centers. Of
which 396 of them have less than 2000 inh. Two very small towns (the smallest ones) have only 34 inhabitants each. These include Kichicho (Amhara Region, Oromiya Zone,

101
Artuma Fursina Wereda) and Giuraferda (SNNP Region, Bench Maji Zone, Sheko Wereda);
c) The average size of the 925 towns is 7917 inh. But if we exclude Addis Ababa, the average size of the remaining 924 towns is only 5670 inh.
Table 4.4 Area, Population, Density, Proportion of Urban Population and Distribution of Towns by Size, Regions and Zones, 1994
Distribution of towns by size (000) Region and Zone Area
(sq km)
Total population
(000) Den
sity
%
Urb
an
< 2 inh.
2- 4.9
5- 9.9
10-14.9
15 – 49.9
50 +
Total
COUNTRY 1143062 51766239 45 13.7 396 294 123 45 54 13 925 Tigray Region 51826 3134470 60 14.9 38 16 10 1 8 1 74 Mirabawi Tigray Zone 25593 733267 29 11.5 11 5 2 1 1 0 20 Mehakelegnaw Tigray Zone 10873 943585 87 9.6 14 3 2 0 2 0 21 Misrakawi Tigray Zone 5587 584771 105 14.6 6 4 2 0 2 0 14 Debubawi Tigray Zone 9773 872847 89 23.7 7 4 4 0 3 1 19 Affar Region 96848 1051641 11 7.5 16 6 5 1 0 0 28 Zone 1 35122 313227 9 12.4 7 3 1 1 0 0 12 Zone 2 29543 202097 7 2.3 2 1 0 0 0 0 3 Zone 3 16609 143066 9 23.8 3 2 4 0 0 0 9 Zone 4 10617 121457 11 1.3 4 0 0 0 0 0 4 Zone 5 4958 271794 55 0.0 0 0 0 0 0 0 0 Amhara Region 154798 13270898 86 8.5 81 66 38 10 10 3 208 Semen Gondar Zone 45237 2087687 46 11.3 12 13 8 1 0 1 35 Debub Gondar Zone 14302 1768544 124 6.6 5 7 3 2 2 0 19 Semen Wello Zone 13043 1259947 97 7.1 1 5 4 0 2 0 12 Debub Wello Zone 17827 2122580 119 9.9 13 13 3 0 1 1 31 Semen Shewa Zone 16728 1560479 93 9.4 20 7 7 1 1 0 36 Misrak Gojam Zone 14654 1699888 116 8.5 14 4 5 1 2 0 26 Mirab Gojam Zone 13248 1779200 134 6.0 6 7 5 3 0 0 21 Wag Hemra Zone 8296 275603 33 4.2 2 1 1 0 0 0 4 Agew Awi Zone 6885 716970 104 9.1 5 5 2 0 2 0 14 Oromiya Zone 4578 462555 101 8.5 3 4 0 2 0 0 9 Bahir Dar Special Zone 95456 100 0 0 0 0 0 1 1 Oromiya Region 318257 18465449 58 10.6 154 132 44 21 20 4 375 Mirab Wellega Zone 24728 1546623 63 8.5 16 16 0 2 2 0 36 Misrak Wellega Zone 23300 1253105 54 11.0 15 12 5 1 1 0 34 Illubabor Zone 17772 846613 48 9.4 17 6 2 1 1 0 27 Jimma Zone 18855 1960033 104 9.7 9 15 3 0 1 1 29 Mirab Shewa Zone 21556 2329250 108 9.7 19 16 5 4 3 0 47 Semen Shewa Zone 11650 1157808 99 7.4 16 8 2 1 1 0 28 Misrak Shewa Zone 13836 1665815 120 26.5 8 9 4 3 4 3 31 Arssi Zone 24302 2216648 91 9.7 23 15 10 2 1 0 51 Mirab Harerge Zone 21842 1605901 74 6.0 11 14 5 0 0 0 30 Misrak Harerge Zone 16730 1268021 76 7.3 8 8 3 2 1 0 22 Bale Zone 59585 1217631 20 10.7 9 8 3 2 2 0 24 Borena Zone 64103 1398001 22 9.1 3 5 2 3 3 0 16 Somali Region 327068 3144963 10 13.9 25 17 15 3 6 1 67 Shinile Zone 32969 328989 10 14.4 16 2 3 0 0 0 21 Jijiga 18799 754087 40 18.3 0 1 3 1 2 1 8 Fiq Zone 12823 204017 16 9.8 1 2 2 0 0 0 5 Degehabur Zone 41672 282774 7 18.1 2 3 2 0 1 0 8 Warder Zone 50613 302570 6 7.2 2 1 1 1 0 0 5 Korahe Zone 28346 225109 8 14.7 0 3 0 0 1 0 4 Gode Zone 31070 273893 9 22.8 0 2 2 0 1 0 5 Afder Zone 70543 328961 5 6.9 3 2 2 0 0 0 7 Liben Zone 40232 444563 11 8.9 1 1 0 1 1 0 4
102
Table 4.4 (cont’d) Distribution of towns by size (000)
Region and Zone Area (sq km)
Total population
(000)
Den
s
%
Urb
.
< 2 inh.
2- 4.9
5- 9.9
10-14.9
15 – 49.9
50 +
Total
Benishangul-Gumuz Region 50010 460325 9 7.8 7 5 0 1 0 0 13 Metekel Zone 27212 201466 7 9.7 5 4 0 0 0 0 9 Asosa Zone 13713 208076 15 7.9 2 1 0 1 0 0 4 Kamashi zone 9085 50783 6 0.0 0 0 0 0 0 0 0 Snnp Region 116723 9596951 82 6.8 71 50 10 8 9 1 149 Gurage Zone 8069 1556850 193 4.9 10 8 1 0 2 0 21 Hadiya Zone 3872 1050004 271 6.4 10 5 1 0 1 0 17 Kembata Alaban Tembaro Z. 2748 727310 265 7.0 2 5 2 0 1 0 10 Sidama Zone 7380 2044445 277 7.0 3 5 2 1 1 1 13 Gedeo Zone 1681 563578 335 11.5 0 4 1 1 1 0 7 Semen Omo Zone 24780 2602278 105 6.8 15 13 1 2 3 0 34 Debub Omo Zone 23105 327717 14 6.7 8 1 0 1 0 0 10 Keficho Shekicho Zone 12871 724769 56 7.7 13 4 1 2 0 0 20 Bench Maji Zone (b) 32218 771625 24 5.9 10 5 1 1 0 0 17 Gambella Region-Total 25891 162271 6 16.7 4 2 0 0 1 0 7 Zone 1 5039 45085 9 44.9 0 1 0 0 1 0 2 Zone 2 13219 30633 2 9.4 2 0 0 0 0 0 2 Zone 3 5591 54321 10 1.4 2 0 0 0 0 0 2 Zone 4 2042 32232 16 9.8 0 1 0 0 0 0 1 Harari Region 63 130691 2071 58.1 0 0 0 0 0 1 1 Addis Ababa 486 2100031 4318 98.7 10 0 0 0 0 1 1 Dire Dawa Provisional Adm. 1091 248549 228 68,3 0 0 1 0 0 1 2
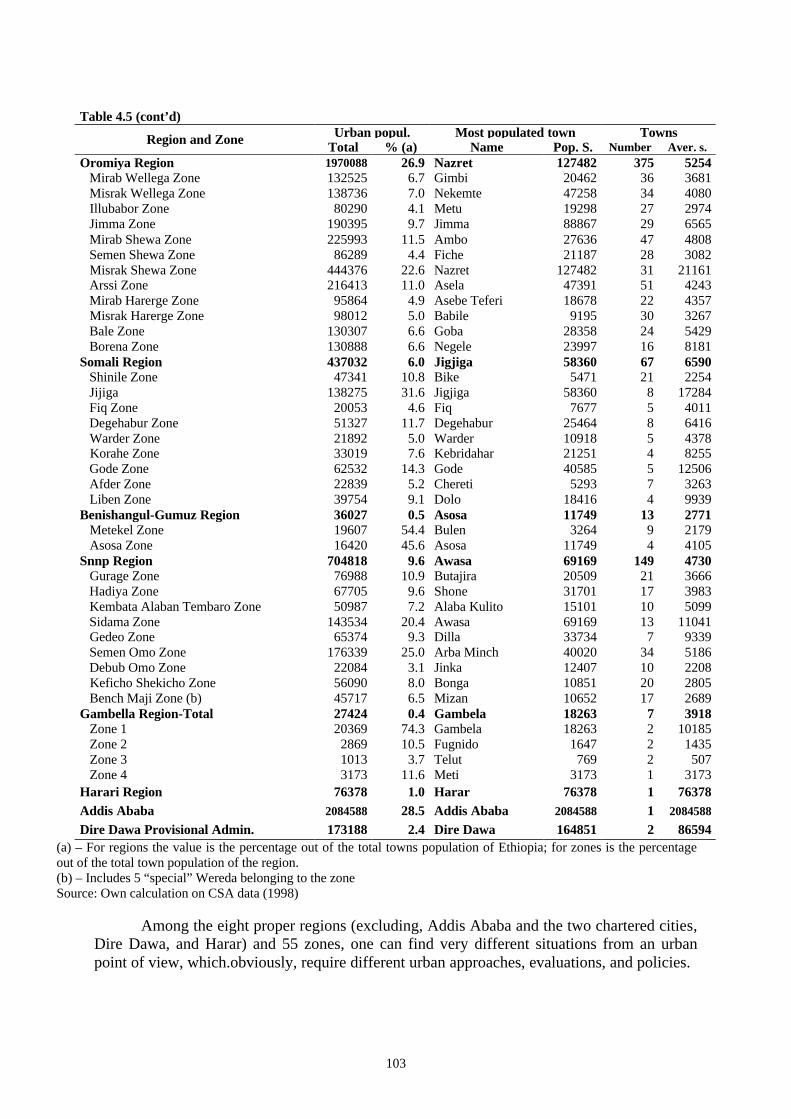
Source: Own calculation on CSA data (1998) Table 4.5a – Urban Structure (Counted or Estimated Population Size of Towns) of Ethiopia, Regions and Zones, 1994
Urban popul. Most populated town Towns Region and Zone
Total % (a) Name Popul. size Number Average
size
COUNTRY 7323206 100.0 Addis Ababa 2084588 925 7917
Country minus Addis Ababa 5238618 71.5 Dire Dawa 164851 924 5670 Tigray Region 468478 6.4 Mekele 96938 74 6331 Mirabawi Tigray Zone 84560 18.0 Endaselasie 25269 20 4243 Mehakelegnawi Tigray Zone 91058 19.4 Axum 27148 21 4336 Misrakawi Tigray Zone 85508 18.3 Adigrat 37417 14 6107 Debubawi Tigray Zone 207352 44.3 Mekele 96938 19 10913 Affar Region 79870 1.1 Asayita 14392 28 2852 Zone 1 39260 49.2 Asayita 14392 12 3272 Zone 2 4641 5.8 Ab Ala 3069 3 1547 Zone 3 34344 43.0 Awash Sebat Kilo 7040 9 3816 Zone 4 1625 2.0 Dibina 872 4 406 Amhara Region 1265315 17.3 Gondar 112249 208 6291 Semen Gondar Zone 236625 18.7 Gondar 112249 35 6761 Debub Gondar Zone 116702 9.2 Debre Tabor 22455 19 6142 Semen Wello Zone 89055 7.0 Weldiya 24533 12 7421 Debub Wello Zone 210767 16.7 Dessie 97314 31 6799 Semen Shewa Zone 146952 11.6 Debre Berhan 38717 36 4082 Misrak Gojam Zone 145295 11.5 Debre Markos 49297 26 5588 Mirab Gojam Zone 107238 8.5 Finote Selam 13834 21 5107 Wag Hemra Zone 11643 0.9 Sekota 7922 4 2911 Agew Awi Zone 65232 5.2 Chagni 17777 14 4659 Oromiya Zone 39666 3.1 Bati 13965 9 4407 Bahir Dar Special Zone 96140 7.6 Bahir Dar 96140 1 96140
103
Table 4.5 (cont’d)
Urban popul. Most populated town Towns Region and Zone Total % (a) Name Pop. S. Number Aver. s. Oromiya Region 1970088 26.9 Nazret 127482 375 5254 Mirab Wellega Zone 132525 6.7 Gimbi 20462 36 3681 Misrak Wellega Zone 138736 7.0 Nekemte 47258 34 4080 Illubabor Zone 80290 4.1 Metu 19298 27 2974 Jimma Zone 190395 9.7 Jimma 88867 29 6565 Mirab Shewa Zone 225993 11.5 Ambo 27636 47 4808 Semen Shewa Zone 86289 4.4 Fiche 21187 28 3082 Misrak Shewa Zone 444376 22.6 Nazret 127482 31 21161 Arssi Zone 216413 11.0 Asela 47391 51 4243 Mirab Harerge Zone 95864 4.9 Asebe Teferi 18678 22 4357 Misrak Harerge Zone 98012 5.0 Babile 9195 30 3267 Bale Zone 130307 6.6 Goba 28358 24 5429 Borena Zone 130888 6.6 Negele 23997 16 8181 Somali Region 437032 6.0 Jigjiga 58360 67 6590 Shinile Zone 47341 10.8 Bike 5471 21 2254 Jijiga 138275 31.6 Jigjiga 58360 8 17284 Fiq Zone 20053 4.6 Fiq 7677 5 4011 Degehabur Zone 51327 11.7 Degehabur 25464 8 6416 Warder Zone 21892 5.0 Warder 10918 5 4378 Korahe Zone 33019 7.6 Kebridahar 21251 4 8255 Gode Zone 62532 14.3 Gode 40585 5 12506 Afder Zone 22839 5.2 Chereti 5293 7 3263 Liben Zone 39754 9.1 Dolo 18416 4 9939 Benishangul-Gumuz Region 36027 0.5 Asosa 11749 13 2771 Metekel Zone 19607 54.4 Bulen 3264 9 2179 Asosa Zone 16420 45.6 Asosa 11749 4 4105 Snnp Region 704818 9.6 Awasa 69169 149 4730 Gurage Zone 76988 10.9 Butajira 20509 21 3666 Hadiya Zone 67705 9.6 Shone 31701 17 3983 Kembata Alaban Tembaro Zone 50987 7.2 Alaba Kulito 15101 10 5099 Sidama Zone 143534 20.4 Awasa 69169 13 11041 Gedeo Zone 65374 9.3 Dilla 33734 7 9339 Semen Omo Zone 176339 25.0 Arba Minch 40020 34 5186 Debub Omo Zone 22084 3.1 Jinka 12407 10 2208 Keficho Shekicho Zone 56090 8.0 Bonga 10851 20 2805 Bench Maji Zone (b) 45717 6.5 Mizan 10652 17 2689 Gambella Region-Total 27424 0.4 Gambela 18263 7 3918 Zone 1 20369 74.3 Gambela 18263 2 10185 Zone 2 2869 10.5 Fugnido 1647 2 1435 Zone 3 1013 3.7 Telut 769 2 507 Zone 4 3173 11.6 Meti 3173 1 3173 Harari Region 76378 1.0 Harar 76378 1 76378 Addis Ababa 2084588 28.5 Addis Ababa 2084588 1 2084588
Dire Dawa Provisional Admin. 173188 2.4 Dire Dawa 164851 2 86594 (a) – For regions the value is the percentage out of the total towns population of Ethiopia; for zones is the percentage out of the total town population of the region. (b) – Includes 5 “special” Wereda belonging to the zone Source: Own calculation on CSA data (1998)
Among the eight proper regions (excluding, Addis Ababa and the two chartered cities,
Dire Dawa, and Harar) and 55 zones, one can find very different situations from an urban point of view, which.obviously, require different urban approaches, evaluations, and policies.
104
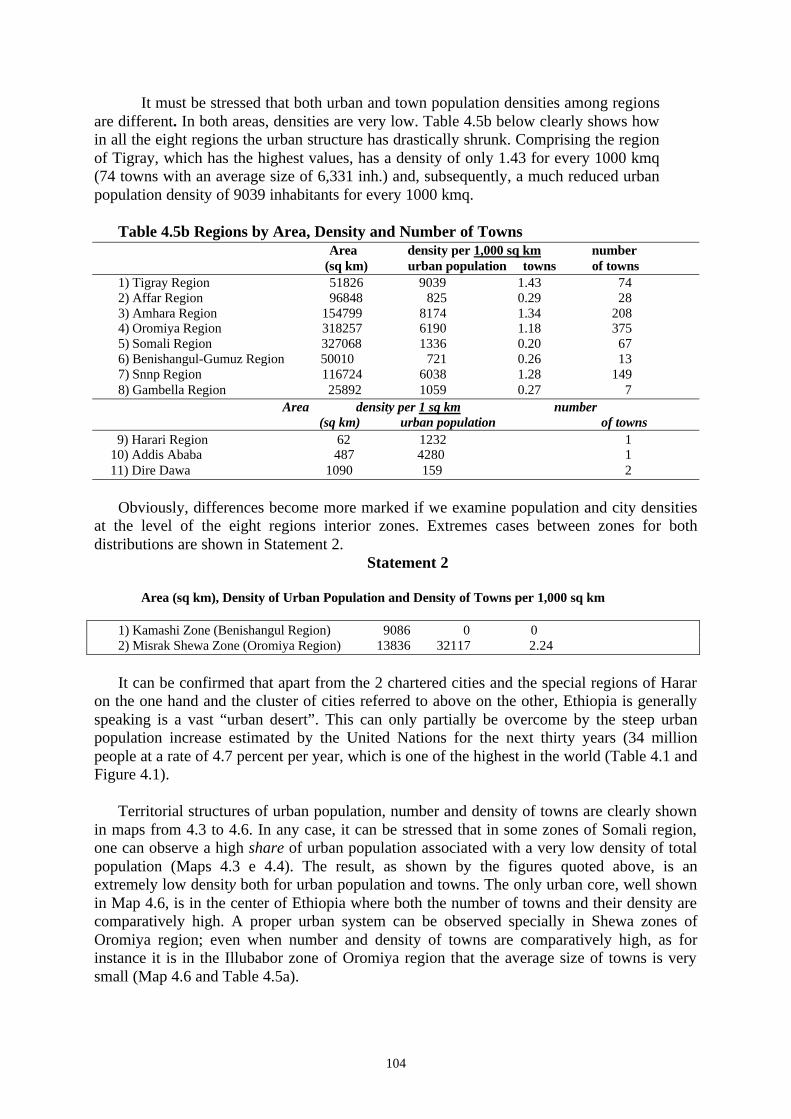
It must be stressed that both urban and town population densities among regions are different. In both areas, densities are very low. Table 4.5b below clearly shows how in all the eight regions the urban structure has drastically shrunk. Comprising the region of Tigray, which has the highest values, has a density of only 1.43 for every 1000 kmq (74 towns with an average size of 6,331 inh.) and, subsequently, a much reduced urban population density of 9039 inhabitants for every 1000 kmq.
Table 4.5b Regions by Area, Density and Number of Towns
Area density per 1,000 sq km number (sq km) urban population towns of towns 1) Tigray Region 51826 9039 1.43 74 2) Affar Region 96848 825 0.29 28 3) Amhara Region 154799 8174 1.34 208 4) Oromiya Region 318257 6190 1.18 375 5) Somali Region 327068 1336 0.20 67 6) Benishangul-Gumuz Region 50010 721 0.26 13 7) Snnp Region 116724 6038 1.28 149 8) Gambella Region 25892 1059 0.27 7
Area density per 1 sq km number (sq km) urban population of towns
9) Harari Region 62 1232 1 10) Addis Ababa 487 4280 1 11) Dire Dawa 1090 159 2
Obviously, differences become more marked if we examine population and city densities
at the level of the eight regions interior zones. Extremes cases between zones for both distributions are shown in Statement 2.
Statement 2
Area (sq km), Density of Urban Population and Density of Towns per 1,000 sq km
1) Kamashi Zone (Benishangul Region) 9086 0 0 2) Misrak Shewa Zone (Oromiya Region) 13836 32117 2.24
It can be confirmed that apart from the 2 chartered cities and the special regions of Harar
on the one hand and the cluster of cities referred to above on the other, Ethiopia is generally speaking is a vast “urban desert”. This can only partially be overcome by the steep urban population increase estimated by the United Nations for the next thirty years (34 million people at a rate of 4.7 percent per year, which is one of the highest in the world (Table 4.1 and Figure 4.1).
Territorial structures of urban population, number and density of towns are clearly shown
in maps from 4.3 to 4.6. In any case, it can be stressed that in some zones of Somali region, one can observe a high share of urban population associated with a very low density of total population (Maps 4.3 e 4.4). The result, as shown by the figures quoted above, is an extremely low density both for urban population and towns. The only urban core, well shown in Map 4.6, is in the center of Ethiopia where both the number of towns and their density are comparatively high. A proper urban system can be observed specially in Shewa zones of Oromiya region; even when number and density of towns are comparatively high, as for instance it is in the Illubabor zone of Oromiya region that the average size of towns is very small (Map 4.6 and Table 4.5a).
105
Such a wide “urban desert” would be a main concern for ministries and other specialized agencies, which deal with urban development and with development, in general,. Without an adequate, physiological and properly managed urban development, it is uneasy to have a rapid economic and social development, which is necessary for the additional 65 million inhabitants (an increase which could double the current 63 million population) expected during the next thirty year period,. This projection should be valid in the absence, strongly desirable, of further warfare and droughts and in the hypothesis to put under control AIDS epidemics.
During the 1970s and 1980s, the increase in the level of spontaneous or informal housing
reflected the total inability of national or city authorities to provide adequate service, land and infrastructure to their growing populations. In that period, an ‘urban crisis’, not only in Ethiopia but also everywhere in Africa (Habitat, 1996), arose. Its major components are a decline in already low levels of formal employment, the rapid increase of hidden economy, informal employment (especially in sectors of the urban economy), a deterioration in both the quality and distribution of basic services and a decline in the quality of the urban environment (both man made and natural). Indeed, as it is well known, the situation was particularly severe in Ethiopia due to the political and military situation of the last decades, recurrent droughts (especially the catastrophic one of 1984-85) and the related and long economic crisis. During the period 1981-98, the average annual rate of change of GDP per capita in real terms was –0.4 percent (Eritrea +1.8, Kenya +0.5) (United Nations Development Program, 2000). Rural-urban interactions in terms of “physiological” migration, exchanges and distribution of commodities and services, growth of communication infrastructures remained, therefore, at a minimum level.
4.2.2. Characteristic Features of Cities 7
In this section, the demographic, socioeconomic and housing characteristics of the main 18 cities of Ethiopia will be examined. The complete sets of indicators based on data drawn from the 1994 Census appear in the appendix in Tables A.4.6a.1 to A.4.6e.3.
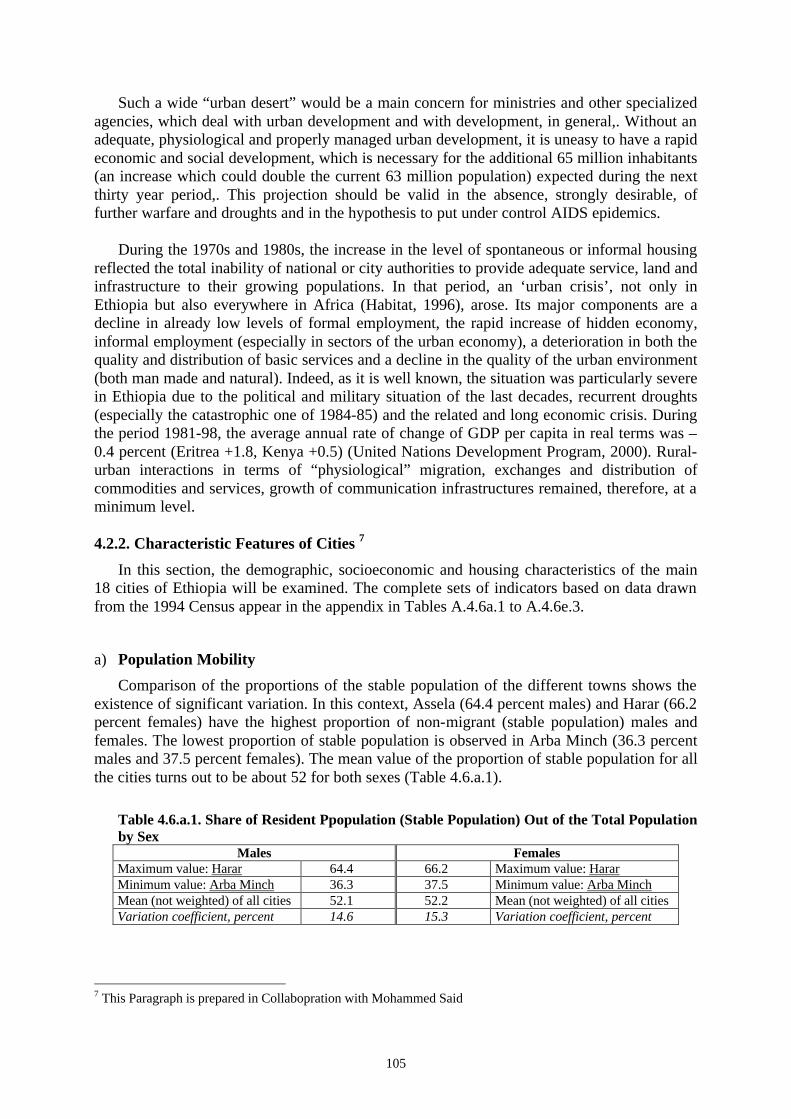
a) Population Mobility
Comparison of the proportions of the stable population of the different towns shows the existence of significant variation. In this context, Assela (64.4 percent males) and Harar (66.2 percent females) have the highest proportion of non-migrant (stable population) males and females. The lowest proportion of stable population is observed in Arba Minch (36.3 percent males and 37.5 percent females). The mean value of the proportion of stable population for all the cities turns out to be about 52 for both sexes (Table 4.6.a.1).
Table 4.6.a.1. Share of Resident Ppopulation (Stable Population) Out of the Total Population by Sex
Males Females Maximum value: Harar 64.4 66.2 Maximum value: Harar Minimum value: Arba Minch 36.3 37.5 Minimum value: Arba Minch Mean (not weighted) of all cities 52.1 52.2 Mean (not weighted) of all cities Variation coefficient, percent 14.6 15.3 Variation coefficient, percent
7 This Paragraph is prepared in Collabopration with Mohammed Said

106
Pertaining to migrants, it is observed that during the last 5 years preceding the census of 1994, the most strong pull forces operated in Mekele and Arba Minch. Harar and Addis Ababa appear to be less attractive to migrants during the same period. As shown by the coefficient of variation, there is a significant variation among the different cities in attracting migrants (Table 4.6.a.2). Table 4.6.a.2. Share of the New In-migrant (Residents from No More than 5 Years) Out of the Total Population by Sex
Males Females Maximum value: Mekele 39.2 33.8 Maximum value: Mekele Minimum value: Harar 13.2 11.1 Minimum value: Harar Mean (not weighted) of all cities 20.7 18.7 Mean (not weighted) of all cities Variation coefficient, percent 29.0 29.4 Variation coefficient, percent
Investigation of the area of previous residence of in-migrants to each city shows that in Mekele more than three fourth (78 percent) of the in-migrants were residents of other urban centers, while in Harar nearly two-third of the in-migrants were previously rural residents. Thus, urban to urban migration appears to be the major source of migrants to Mekele, while rural to urban migration is the major source in Harar. In attracting migrants from urban centers, cities appear to be relatively less variable than attracting migrants from rural areas (Table 4.6.a.3). Table 4.6.a.3. Share of the New In-migrant by Area of Origin (Urban vs. Rural)
Urban Rural Maximum value: Mekele 78.0 65.0 Maximum value: Harar Minimum value: Harar 35.0 22.0 Minimum value: Mekele Mean (not weighted) of all cities 54.2 45.8 Mean (not weighted) of all cities Variation coefficient, percent 18.5 21.9 Variation coefficient, percent
b) Crude Birth and Total Fertility Rates Very large differentials both in the Crude Birth and Total Fertility rates can be observed among the 18 major cities of Ethiopia. An average crude birth rate of 19.5 for the total population and an average parity equal to 5.49 children per stable woman and 4.94 per in-migrant woman aged 45-49 years was observed. Mekele and Assela are having the highest CBR and TFR.
Table 4.6.b.1. Crude Birth Rate (Per 1000 Population) Total population Maximum value: Mekele 27.6 Minimum value: Debre Markos 12.5 Mean (not weighted) of all cities 19.5 Variation coefficient, percent 22.7
107
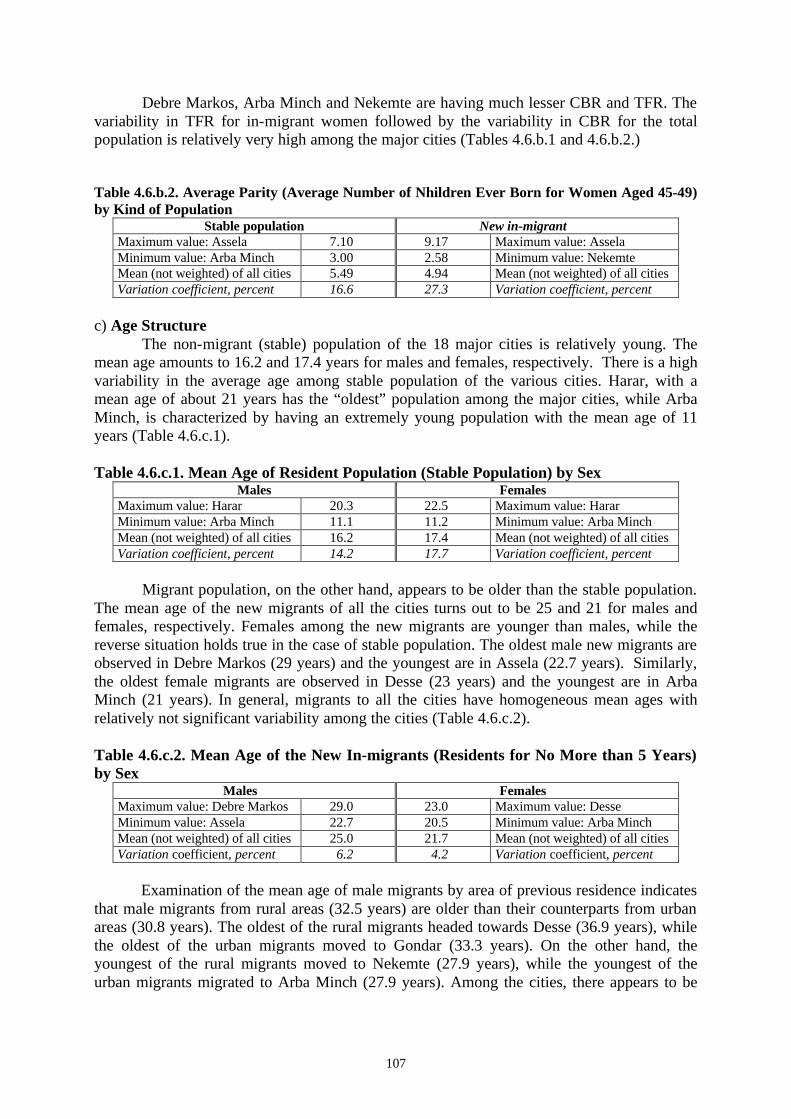
Debre Markos, Arba Minch and Nekemte are having much lesser CBR and TFR. The variability in TFR for in-migrant women followed by the variability in CBR for the total population is relatively very high among the major cities (Tables 4.6.b.1 and 4.6.b.2.)
Table 4.6.b.2. Average Parity (Average Number of Nhildren Ever Born for Women Aged 45-49) by Kind of Population
Stable population New in-migrant Maximum value: Assela 7.10 9.17 Maximum value: Assela Minimum value: Arba Minch 3.00 2.58 Minimum value: Nekemte Mean (not weighted) of all cities 5.49 4.94 Mean (not weighted) of all cities Variation coefficient, percent 16.6 27.3 Variation coefficient, percent
c) Age Structure
The non-migrant (stable) population of the 18 major cities is relatively young. The mean age amounts to 16.2 and 17.4 years for males and females, respectively. There is a high variability in the average age among stable population of the various cities. Harar, with a mean age of about 21 years has the “oldest” population among the major cities, while Arba Minch, is characterized by having an extremely young population with the mean age of 11 years (Table 4.6.c.1).
Table 4.6.c.1. Mean Age of Resident Population (Stable Population) by Sex
Males Females Maximum value: Harar 20.3 22.5 Maximum value: Harar Minimum value: Arba Minch 11.1 11.2 Minimum value: Arba Minch Mean (not weighted) of all cities 16.2 17.4 Mean (not weighted) of all cities Variation coefficient, percent 14.2 17.7 Variation coefficient, percent
Migrant population, on the other hand, appears to be older than the stable population.
The mean age of the new migrants of all the cities turns out to be 25 and 21 for males and females, respectively. Females among the new migrants are younger than males, while the reverse situation holds true in the case of stable population. The oldest male new migrants are observed in Debre Markos (29 years) and the youngest are in Assela (22.7 years). Similarly, the oldest female migrants are observed in Desse (23 years) and the youngest are in Arba Minch (21 years). In general, migrants to all the cities have homogeneous mean ages with relatively not significant variability among the cities (Table 4.6.c.2). Table 4.6.c.2. Mean Age of the New In-migrants (Residents for No More than 5 Years) by Sex
Males Females Maximum value: Debre Markos 29.0 23.0 Maximum value: Desse Minimum value: Assela 22.7 20.5 Minimum value: Arba Minch Mean (not weighted) of all cities 25.0 21.7 Mean (not weighted) of all cities Variation coefficient, percent 6.2 4.2 Variation coefficient, percent
Examination of the mean age of male migrants by area of previous residence indicates that male migrants from rural areas (32.5 years) are older than their counterparts from urban areas (30.8 years). The oldest of the rural migrants headed towards Desse (36.9 years), while the oldest of the urban migrants moved to Gondar (33.3 years). On the other hand, the youngest of the rural migrants moved to Nekemte (27.9 years), while the youngest of the urban migrants migrated to Arba Minch (27.9 years). Among the cities, there appears to be

108
relatively high variability in the mean age of male migrants by area of previous residence when compared with the mean age of the over all case and less variability than that of the stable population (Table 4.6.c.). Table 4.6.c.3. Mean Age of Male In-migrants by Area of Origin (Urban vs. Rural)
Urban males Rural males Maximum value: Gondar 33.3 36.9 Maximum value: Desse Minimum value: Arba Minch 27.9 27.9 Minimum value: Nekemte Mean (not weighted) of all cities 30.8 32.5 Mean (not weighted) of all cities Variation coefficient, percent 6.3 7.6 Variation coefficient, percent
c) Marital Status
Comparison of the proportion of widowed and divorced females aged 50 years among both the stable and migrant population of the different cities reveals that migrants have higher mean proportion (8.4 percent) than stable population (3.4 percent). The statistics of variability confirms the prevalence of high variability among the different cities in the distribution of divorced and widowed women of the stable population. Early age at marriage, beginning from the age of 10 years, is the main factor for the observed high frequency of divorce among migrants. A divorced woman is not accepted by the society, hence, she has to get married as soon as possible, some how, or has to migrate to the near by cities and towns. As observed earlier (Table 2.3.6 of Chapter 2), among migrants, divorced females significantly out number divorced males. In general, therefore, the propensity to move is higher among widows and divorced women than widows and divorced men.
The highest and the lowest proportions of widows and divorcees among the stable
population are observed in Debre Markos (8.3 percent) and Arssi (0.4 percent), respectively. On the other hand, the highest and the lowest proportions of divorced and widowed migrants are observed in Mekele (11.1 percent), followed by Bahr Dar (11 percent), and Nekemte (5.1 percent), respectively. It should be noted at this juncture that Mekele, Bahr Dar and Debre Markos are located in areas characterised by early age at marriage (Table 4.6.d.1). Table 4.6.d.1. Widowed and Divorced Females Aged 50 Years Per 100 Females of the Same Age
Stable population In-migrant Maximum value: Debre Markos 8.3 11,1 Maximum value: Mekele Minimum value: Arssi 0.4 5.1 Minimum value: Nekemte Mean (not weighted) of all cities 3.4 8.4 Mean (not weighted) of all cities Variation coefficient, percent 62.2 17.7 Variation coefficient, percent
b) Religious Composition
A great variability characterizes the proportion of Muslims among the stable population of the various cities. Kombolcha, with 67 percent followed by Dire Dawa, with 52 percent; constitute the highest proportion of Muslims among the stable population, while Debre Markos, with 1.5 percent followed by Debre Zeit, with 2.8 percent constitute the lowest proportion. The coefficient of variation turns out to be 93.3 percent and the mean proportion amounts to 20.2 percent (Table 4.6.e.1.), thus indicating relatively signisicant variation among cities in terms of the distribution of Muslims.

109
Table 4.6.e.1. Percentage of Muslims Out of Resident (Stable Population) and In-migrant Population
Stable population New in-migrant Maximum value: Kombolcha 66.7 48.7 Maximum value: Kombolcha Minimum value: Debre Markos 1.5 1.4 Minimum value: Debre Markos Mean (not weighted) of all cities 20.2 17.8 Mean (not weighted) of all cities Variation coefficient, percent 93.3 82.0 Variation coefficient, percent
There is an equally high variability among the cities in the composition of Muslim
among the new immigrants. Kombolcha, with 48.7 percent followed by Dire Dawa, with 42 percent Muslim migrants, have the greatest attraction for the Muslims than Debre Markos, with 1.4 percent Muslim migrants followed by Debre Berhan, with 2.6 percent Muslim migrants. In general, it must be stressed that cities with highest or smallest proportion of Muslims among their stable population have greatest or least attraction for migrants, respectively, thus, clearly indicating the action of pull factors with regards to Muslims (Table 4.6.e.1).
The great majority of Muslims to Debre Markos (83.6 percent) came from urban areas, while the majority of Muslim migrants to Addis Ababa moved from rural areas. However, the mean value of migrants coming from rural areas (52.1 percent) is higher than urban areas (47.9 percent) (Table 4.6.e.2.). Table 4.6.e.2. Share of Muslim In-migrants by Area of Origin (Urban vs. Rural)
Urban Rural Maximum value: Debre Markos 83.6 71.1 Maximum value: Addis Ababa Minimum value: Addis Ababa 28.9 16.4 Minimum value: Debre Markos Mean (not weighted) of all cities 47.9 52.1 Mean (not weighted) of all cities Variation coefficient, percent 28,7 26.4 Variation coefficient, percent
c) Educational Composition Although, urban areas are relatively characterized with higher proportion of literacy, when compared with the rural areas, there still prevail quite a significant number of illiterate persons in the cities. An average of 26 percent among the stable population and 24.8 percent among the migrant population is still illiterate. Among the cities, Mekele (40 percent) and Bahr Dar (38.7 percent) have the highest proportion of illiterates in the stable and migrant population, relatively. Addis Ababa, as expected, has the least proportion of illiterates, both among the stable (14.7 percent) and migrant population (8.4 percent), indicating higher literacy among migrants than stable population and thus confirming that literate persons are more liable to move than illiterate persons. Finally, cities in their composition of literate persons, appear to be more variable in terms of migrants (CV 37.6) than stable population. (CV 22.3) (Table 4.6.f.1.) Table 4.6.f.1. Percentage of Illiterate among Population Aged 5 and Over Out of Resident Population (Stable Population) and Out of New In-migrant
Stable population New in-migrant Maximum value: Mekele 40.1 38.7 Maximum value:Bahr Dar Minimum value: Addis Ababa 14.7 8.4 Minimum value: Addis Ababa Mean (not weighted) of all cities 26.0 24.8 Mean (not weighted) of all cities Variation coefficient, percent 22.3 37.6 Variation coefficient, percent
Pertaining to educational attainment, Addis Ababa, as expected, is the city with more
educated stable people both at low and at a higher level of education, while Harar is the town with well-educated migrant population. Kombolcha and Shashamane are two towns with the
110
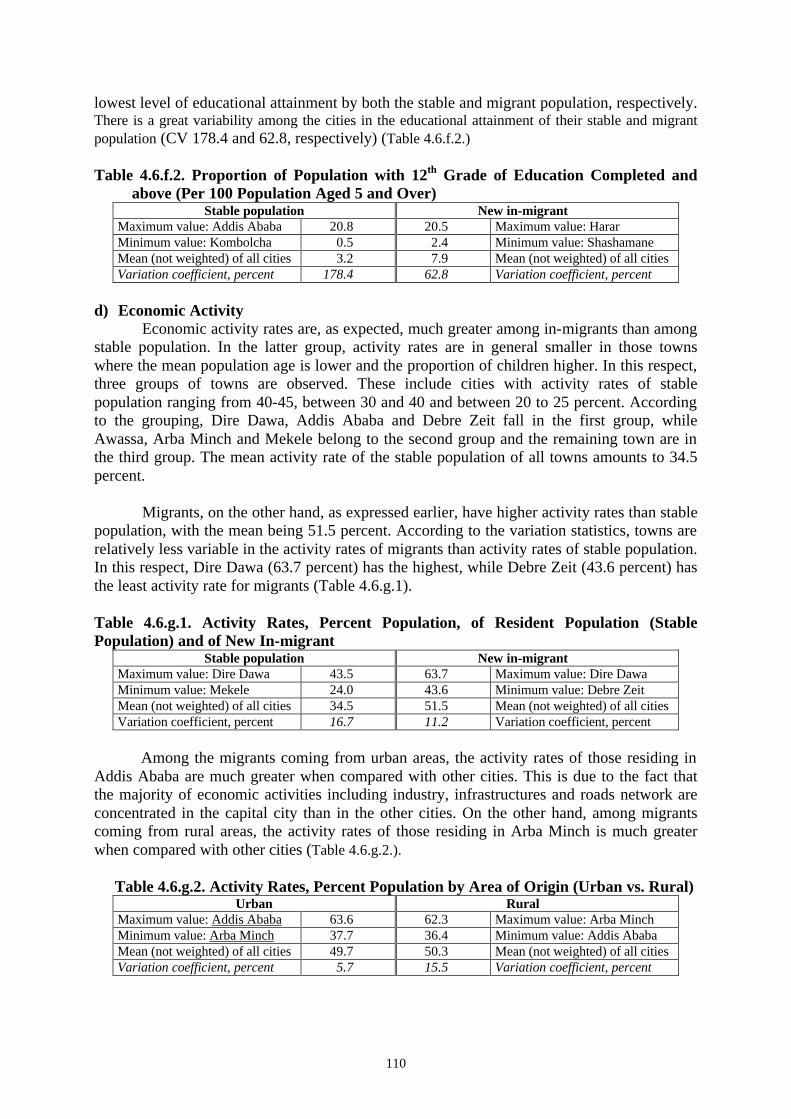
lowest level of educational attainment by both the stable and migrant population, respectively. There is a great variability among the cities in the educational attainment of their stable and migrant population (CV 178.4 and 62.8, respectively) (Table 4.6.f.2.) Table 4.6.f.2. Proportion of Population with 12th Grade of Education Completed and
above (Per 100 Population Aged 5 and Over) Stable population New in-migrant
Maximum value: Addis Ababa 20.8 20.5 Maximum value: Harar Minimum value: Kombolcha 0.5 2.4 Minimum value: Shashamane Mean (not weighted) of all cities 3.2 7.9 Mean (not weighted) of all cities Variation coefficient, percent 178.4 62.8 Variation coefficient, percent
d) Economic Activity
Economic activity rates are, as expected, much greater among in-migrants than among stable population. In the latter group, activity rates are in general smaller in those towns where the mean population age is lower and the proportion of children higher. In this respect, three groups of towns are observed. These include cities with activity rates of stable population ranging from 40-45, between 30 and 40 and between 20 to 25 percent. According to the grouping, Dire Dawa, Addis Ababa and Debre Zeit fall in the first group, while Awassa, Arba Minch and Mekele belong to the second group and the remaining town are in the third group. The mean activity rate of the stable population of all towns amounts to 34.5 percent.
Migrants, on the other hand, as expressed earlier, have higher activity rates than stable
population, with the mean being 51.5 percent. According to the variation statistics, towns are relatively less variable in the activity rates of migrants than activity rates of stable population. In this respect, Dire Dawa (63.7 percent) has the highest, while Debre Zeit (43.6 percent) has the least activity rate for migrants (Table 4.6.g.1). Table 4.6.g.1. Activity Rates, Percent Population, of Resident Population (Stable Population) and of New In-migrant
Stable population New in-migrant Maximum value: Dire Dawa 43.5 63.7 Maximum value: Dire Dawa Minimum value: Mekele 24.0 43.6 Minimum value: Debre Zeit Mean (not weighted) of all cities 34.5 51.5 Mean (not weighted) of all cities Variation coefficient, percent 16.7 11.2 Variation coefficient, percent
Among the migrants coming from urban areas, the activity rates of those residing in Addis Ababa are much greater when compared with other cities. This is due to the fact that the majority of economic activities including industry, infrastructures and roads network are concentrated in the capital city than in the other cities. On the other hand, among migrants coming from rural areas, the activity rates of those residing in Arba Minch is much greater when compared with other cities (Table 4.6.g.2.). Table 4.6.g.2. Activity Rates, Percent Population by Area of Origin (Urban vs. Rural)
Urban Rural Maximum value: Addis Ababa 63.6 62.3 Maximum value: Arba Minch Minimum value: Arba Minch 37.7 36.4 Minimum value: Addis Ababa Mean (not weighted) of all cities 49.7 50.3 Mean (not weighted) of all cities Variation coefficient, percent 5.7 15.5 Variation coefficient, percent

111
Activity rates of people employed in governmental jobs are greater in the capital city of each region, with the maximum observed in Awassa (41.8 percent). On the other hand, activity rates of unpaid family workers are very low in the biggest cities, with the maximum observed in Debre Markos (10.1 percent). Towns, such as Shashamane and Awassa, have the lowest government and unpaid family workers, respectively. The cities show high variability in their composition of unpaid family workers than government workers (Table 4.6.g.3.).
Table 4.6.g.3. Activity Rates, Percent Population by Kind of Eemployment
Government employee Unpaid family worker Maximum value: Awassa 41.8 10.1 Maximum value: Debre Markos Minimum value: Shashamane 13.5 1.3 Minimum value: Awassa Mean (not weighted) of all cities 29.3 4.2 Mean (not weighted) of all cities Variation coefficient, percent 26.8 54.9 Variation coefficient, percent
e) Characteristics of Housing Unit
Examination of the number of households occupying per housing unit reveals that the crowding standards are not so high among the total population. The average number of households per dwelling is 1.08 and the variability is very low among the 18 cities. Over crowded dwellings are more frequent among in-migrants households than total population. It is observed that variability of crowdiong is much greater for the migrants than for the total population (Table 4.6.h.1.).
Table 4.6.h.1. Average Number of Households Per Housing Unit
Total population New in-migrant Maximum value: Dire Dawa 1.1 1.5 Maximum value: Debre Berhan Minimum value: Arba Minch 1.0 1.0 Minimum value: Shashamane Mean (not weighted) of all cities 1.1 1.2 Mean (not weighted) of all cities Variation coefficient, percent 4.7 15.2 Variation coefficient, percent
The number of persons per household is high both among the total population (6.2) and the migrants (5.8). The minimum value, 5.2, which is observed in Harar for the total population is slightly higher than the minimum value observed in Kombolcha for the migrant population. Number of persons per housing unit is relatively more variable for the migrant population than the total population (Table 4.6.h.2.). Table 4.6.h.2.Average Number of Persons Per Household
Total population New in-migrant Maximum value: Shashamane 6.9 6.5 Maximum value: Debre Markos Minimum value: Harar 5.2 5.0 Minimum value: Kombolcha Mean (not weighted) of all cities 6.2 5.8 Mean (not weighted) of all cities Variation coefficient, percent 6.9 7.4 Variation coefficient, percent
4.3 The Population of Addis Ababa
4.3.1 An Overview
Over the years, demographic increment, economic development and historic and political events have profoundly and quite naturally changed the characteristics of Addis Ababa since it was founded in 1887 by Emperor Menelik and Queen Taytu. In the course of its development, the city showed a modest and irregular town-planning, now replaced by modern urbanisation, which began during the Italian occupation and a cosmopolitan, articulate and diversified structure, varying from the luxurious hotels to
112
the bidonvilles suburbs. It hosts the largest market in Africa, covering a whole urban area, which includes food, textile, leather, mechanical, glass and cement factories. The city is, quite naturally, the main railway, road and airway junction.
In this chapter, we will refer to some of the demographic and social
characteristics, as they were pointed out by the 1994 census of the Addis Ababa population8. Following the recent administrative reform, it is important to notice that the city has now become a region in itself. The structure of the new geographic subdivision, resulting from this reform, has profoundly altered the territorial asset of the capital, which now covers 486 square kilometres. First of all, it is important to stress the demographic dimension of the administrative and territorial subdivisions of the city, which is organised and divided as follows:
4.3.2 Administrative Sub-divisions
a) Zones: - The city has six zones with the average dimension of 352 thousand inhabitants each. Zone 6,which located in the southern area of the city is the smallest and has 94,786 inhabitants, whilst the largest one is Zone 4, in the north eastern part of the city, with 461,313 inhabitants.
b) Weredas: - There are 28 Weredas in the city, with the average population of 75 thousand inhabitants each. The peculiarity of this subdivision resides in the fact that 5 Weredas (Wereda 17, 19, 26, 27 and 28) include both an urban and a rural area. The smallest Wereda, Wereda. 22, has 36,722 inhabitants (in zone 2, in the west), while the largest Wereda, Wereda 17, has 130,249 including 5,610 inhabitants in the rural part of the Wereda (it is located in zone 3, in the central-eastern part of the city).
c) Kebeles: - Kebeles are the smallest administrative subdivision of the city. These amount to 305 in number, with an average population of 6,900 inhabitants each. This final division was created with the purpose of adapting the administrative structure to a complex and not easily defined geographical area, and, also, to facilitate the monitoring of the population of the region. To these kebele you can also add 23 rural farmers associations.
Considering the urban kebeles of the city only, the smallest is Kebele 18, with 1,496 inhabitants and it is located in Wereda 24, in zone 2, situated in the south-western part of the city. It occupies an enormous area and includes 316 households (with the average dimension of 4.7 components) and 312 housing units (i.e. 1.01 households for every housing unit). The most populous kebele is kebele 55 and has 37,061 inhabitants. It is located in Wereda 19, Zone 3. It is on the borders of the oldest part of the city. It includes 7,912 house (with the average dimension of 4.7) and 7,632 housing units (i.e. 1.04 households for every housing unit).
8 In the 1994 census the Central Statistical Authority published a rich and detailed volume which gives an accurate and detailed statistical account of the region of Addis Ababa describing the zones, the Weredas and, in some cases, the kebeles. This publication includes important demographic studies, with the estimation of indicators in matters of migration, fertility, mortality, and population projections (CSA, 1995).

113
This data clearly shows great variability related to the demographic dimension of the administrative units. The ratio between the smallest and the largest is 1:4.9 for the zones, 1:3.0 for the Weredas and finally 1:24.8 for the kebeles. Variability represents a further element of complexity in the knowledge and management of the city, which we will refer to later on.
At a first glance, the city is very varied, with areas, which differ from socio-
economic, demographic and household points of view. In order to make an accurate and detailed analysis of some of the demographic and social characteristics of the population using the data available from the 1994 census, we will focus our attention on the Weredas. This is due to the fact that the zones are too few and too big and the kebele are too many and too small.
4.3.3 Population Size and Increase
In the previous paragraphs, we have shown the estimated population of the Addis Ababa from 1950 to date (as estimated by the Population Division of the United Nations and some of the data worked out by the CSA). According to national sources, in 1994, the city had a population of 2,112,737 inhabitants, of which 1,023,457 are males and 1,089,285 are females. The majority, 98.7 percent, reside in the urban areas of the city.
The 1999 Labor Force Survey showed 2,186,649 individuals lived in
conventional households, which, if compared to the 2,081,346 residents in the same kind of household in 1994, reveals a variation of 105 thousand units, corresponding to an annual average increment rate of 1.0 percent. If we observe the development of the whole population since 1984, the increment between 1984 and 1994 is of 740 thousand individuals (an average increment rate of 4.0 percent)9 (Table 4.7).
However, the situation is certainly destined to alter considerably over the next few years if the population increment of Addis Ababa grows as estimated by the following sources.
• Data from the Population Division of the United Nations from 2000 to 2015 shows an increment of 2,456 million (related to the 2,639 initially estimated), practically a doubling of the whole population, with an annual average increment of 164 thousand people, equal to a rate of 4.5 percent (see Table 4.2);
• The Central Statistical Authority estimates a population of 2,495 million for the year 2000 and 3,792 for the year 2015. The increment would therefore be of 1,297 million by head count (nearly half of those considered in the other projection), with
9 Synthesising and considering these indications as true, the increase rate for the 15 years considered would be of +3.1 percent. Nevertheless such a flexion in the increment rate during the period considered is certainly due to the kind of source considered to esteem the population size in the three years considered. As a matter of fact it is renown that the Labor Force Survey is based on a sample of limited dimensions and it is important to note that the rural part of Addis Ababa cannot be considered at an independent reporting level (Central Statistical Authority, Statistical Report on the 1999 Labour Force Survey, Addis Ababa, November 1999, p. 7). This latter circumstance is also reflected on the portion of rural population, esteemed at 1.3 percent in the 1994 census and valued around 1.1 percent in the Labor Force Survey.
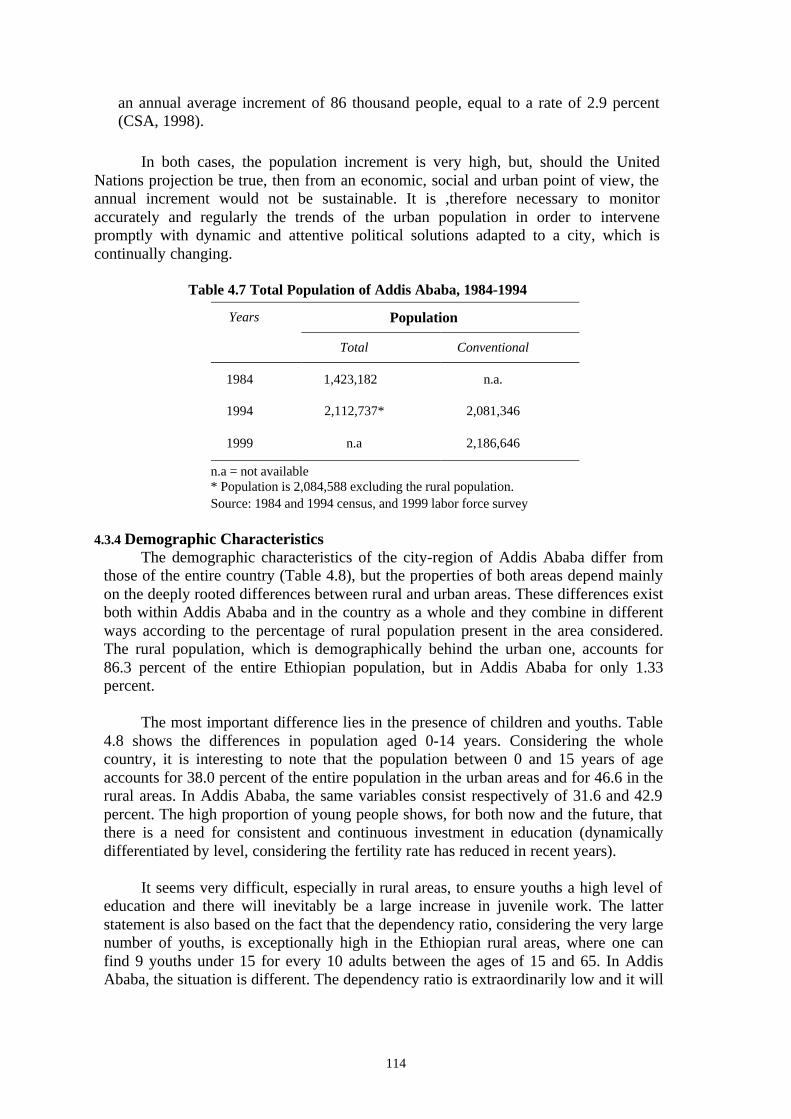
114
an annual average increment of 86 thousand people, equal to a rate of 2.9 percent (CSA, 1998).
In both cases, the population increment is very high, but, should the United
Nations projection be true, then from an economic, social and urban point of view, the annual increment would not be sustainable. It is ,therefore necessary to monitor accurately and regularly the trends of the urban population in order to intervene promptly with dynamic and attentive political solutions adapted to a city, which is continually changing.
Table 4.7 Total Population of Addis Ababa, 1984-1994
Years Population
Total Conventional
1984 1,423,182 n.a.
1994 2,112,737* 2,081,346
1999 n.a 2,186,646
n.a = not available * Population is 2,084,588 excluding the rural population. Source: 1984 and 1994 census, and 1999 labor force survey
4.3.4 Demographic Characteristics
The demographic characteristics of the city-region of Addis Ababa differ from those of the entire country (Table 4.8), but the properties of both areas depend mainly on the deeply rooted differences between rural and urban areas. These differences exist both within Addis Ababa and in the country as a whole and they combine in different ways according to the percentage of rural population present in the area considered. The rural population, which is demographically behind the urban one, accounts for 86.3 percent of the entire Ethiopian population, but in Addis Ababa for only 1.33 percent.
The most important difference lies in the presence of children and youths. Table 4.8 shows the differences in population aged 0-14 years. Considering the whole country, it is interesting to note that the population between 0 and 15 years of age accounts for 38.0 percent of the entire population in the urban areas and for 46.6 in the rural areas. In Addis Ababa, the same variables consist respectively of 31.6 and 42.9 percent. The high proportion of young people shows, for both now and the future, that there is a need for consistent and continuous investment in education (dynamically differentiated by level, considering the fertility rate has reduced in recent years).
It seems very difficult, especially in rural areas, to ensure youths a high level of
education and there will inevitably be a large increase in juvenile work. The latter statement is also based on the fact that the dependency ratio, considering the very large number of youths, is exceptionally high in the Ethiopian rural areas, where one can find 9 youths under 15 for every 10 adults between the ages of 15 and 65. In Addis Ababa, the situation is different. The dependency ratio is extraordinarily low and it will

115
remain so for the next decades, ensuring the city, a large proportion of adult labor force. Table 4.8 Some Demographic Indicators for the Country and Addis Ababa, Urban and Rural, 1994
Indicator Area
100M/F %P 0-4 %P 65+ Old +young dependency ratio
Country total 101.3 14.8 3.2 94.6 Addis Ababa total 94.0 8.1 2.7 52.3 Country urban 93.3 10.8 3.0 69.4 Addis Ababa urban 93.8 8.0 2.6 51.9 Country rural 102.6 15.4 3.2 99.3 Addis Ababa rural 106.6 14.9 4.5 90.0
Source: own calculations on CSA data
a) Rural and Urban Population We have already mentioned that 5 of the 28 Weredas contain a rural area (not a
very large one if we consider the demographic consistency, but territorially very important). They are Weredas 17 and 28, which surround the eastern part of the city and Weredas 19, 26, 27, which are located in the south. 28,149 citizens live in the rural part of the city and they represent 1.3 percent of the total population of the city. The urban population therefore represents 98.7 percent of the total population. Within these 5 Weredas, the rural population is mostly present in Wereda 26, where it accounts for 14.8 percent of the whole population and less in Wereda 19, where it represents 2.4 percent (Table 4.9).
a) Distribution of the Population by Sex
Considering the distribution of the population by gender in the city of Addis Ababa, the element which is most striking is the slight prevalence of women. With a masculinity-ratio (sex ratio) of 94.0, which by head count means there are 67 thousand women more than men. A similar value of the ratio to the other Ethiopian cities is 93.3. Analysing the data available for each Wereda, only three of these, Weredas 6, 11 and 25, show a majority, even if modest, of men (the ratio varies between 102 and 104.5).
Table 4.9 Some Demographic Indicators of Population by Wereda, 1994
Population
Wereda A .V %
100 M/F P0-4
% P65+
%
Old+Young dependency
Ratio %
01 52,927 2.5 91.3 6.4 3.0 47.5 02 41,430 2.0 94.5 6.3 2.4 43.9 03 82,513 3.9 94.7 7.1 3.1 49.2 04 74,028 3.5 94.1 7.0 2.8 49.7 05 85,187 4.0 100.0 6.7 3.0 51.1 06 72,837 3.5 102.4 7.2 2.7 52.4 07 86,162 4.1 94.0 7.0 2.8 51.5 08 87,895 4.2 96.0 8.2 2.7 55.2 09 52,994 2.5 85.8 6.4 3.6 47.7
116
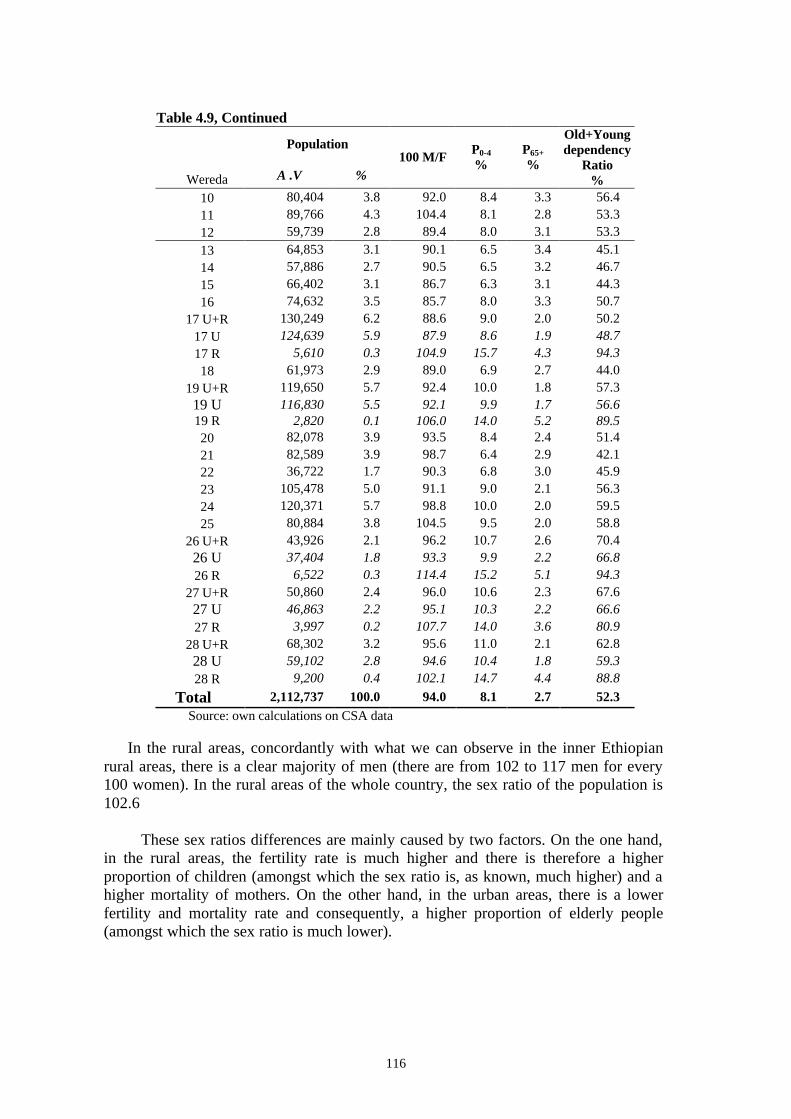
Table 4.9, Continued
Population
Wereda A .V % 100 M/F P0-4
% P65+
%
Old+Young dependency
Ratio %
10 80,404 3.8 92.0 8.4 3.3 56.4 11 89,766 4.3 104.4 8.1 2.8 53.3 12 59,739 2.8 89.4 8.0 3.1 53.3
13 64,853 3.1 90.1 6.5 3.4 45.1 14 57,886 2.7 90.5 6.5 3.2 46.7 15 66,402 3.1 86.7 6.3 3.1 44.3 16 74,632 3.5 85.7 8.0 3.3 50.7
17 U+R 130,249 6.2 88.6 9.0 2.0 50.2 17 U 124,639 5.9 87.9 8.6 1.9 48.7 17 R 5,610 0.3 104.9 15.7 4.3 94.3 18 61,973 2.9 89.0 6.9 2.7 44.0
19 U+R 119,650 5.7 92.4 10.0 1.8 57.3 19 U 116,830 5.5 92.1 9.9 1.7 56.6 19 R 2,820 0.1 106.0 14.0 5.2 89.5 20 82,078 3.9 93.5 8.4 2.4 51.4 21 82,589 3.9 98.7 6.4 2.9 42.1 22 36,722 1.7 90.3 6.8 3.0 45.9 23 105,478 5.0 91.1 9.0 2.1 56.3 24 120,371 5.7 98.8 10.0 2.0 59.5 25 80,884 3.8 104.5 9.5 2.0 58.8
26 U+R 43,926 2.1 96.2 10.7 2.6 70.4 26 U 37,404 1.8 93.3 9.9 2.2 66.8 26 R 6,522 0.3 114.4 15.2 5.1 94.3
27 U+R 50,860 2.4 96.0 10.6 2.3 67.6 27 U 46,863 2.2 95.1 10.3 2.2 66.6 27 R 3,997 0.2 107.7 14.0 3.6 80.9
28 U+R 68,302 3.2 95.6 11.0 2.1 62.8 28 U 59,102 2.8 94.6 10.4 1.8 59.3 28 R 9,200 0.4 102.1 14.7 4.4 88.8
Total 2,112,737 100.0 94.0 8.1 2.7 52.3 Source: own calculations on CSA data
In the rural areas, concordantly with what we can observe in the inner Ethiopian rural areas, there is a clear majority of men (there are from 102 to 117 men for every 100 women). In the rural areas of the whole country, the sex ratio of the population is 102.6
These sex ratios differences are mainly caused by two factors. On the one hand,
in the rural areas, the fertility rate is much higher and there is therefore a higher proportion of children (amongst which the sex ratio is, as known, much higher) and a higher mortality of mothers. On the other hand, in the urban areas, there is a lower fertility and mortality rate and consequently, a higher proportion of elderly people (amongst which the sex ratio is much lower).
117
The estimates of fertility and mortality for Addis Ababa (CSA, 1998) based on the 1994 data are given below.
• A total fertility rate (adjusted measures) of 2.1 children per woman for the urban population (the lowest of all the Ethiopian urban areas) and 7.4 for the rural population (the highest of all rural Ethiopian)
• A life expectation of 56.6 years for males and 60.7 for females in the urban areas and 51.4 and 52.1 in the rural areas, rerspectively.
Among the 6 zones of the city, the one with the lowest sex ratio, 91.0 percent, is Zone 4, where the fertility rate is the lowest, 1.5 children per woman, against the average of 1.8 (not adjusted measures) for all Addis Ababa. The zone with the highest fertility is Zone 6, with 2.9 children per woman and a sex ratio of 96.1 (CSA, 1995)10.
b) Population Distribution and Age Groups MIgration and the very different geographical values of fertility and mortality
are the major determinants of the age structure of Addis Ababa, which is characterised by a high variability. Considering the only totally urban Wereda, the highest percentage of the population in the 0-4 age group resides in Wereda 24, with a value of 10.0 percent against 8.1 percent of the whole local population. The minimum value, related to the same age group, is that of Weredas 2 and 15, with 6.3 percent. Naturally, considering the higher fertility rates of the rural areas, the mixed Weredas show much higher values of child population, ranging from 14.0 percent (Weredas 19 and 27) to 15.7 percent (Wereda 17).
This proportion would be much higher if, considering the whole Addis Ababa,
the children of the rural areas between the ages of 1 and 5 weren’t subject to a mortality rate which exceeds by 51 percent that of the urban areas (162 against 107 every thousand children (CSA, 1998)). Exceptionally strong are the differences between zones within the city. Zone 6 has a child mortality of 97 percent higher than that of Zone 2 (173 against 88 every thousand children) and, consequently, a life expectancy which is 11 years shorter (50.5 years against 61.3) (CSA, 1995).
These values testify the critical health situation of some urban areas, which are
close to the threshold of epidemics, not only for hygienic reasons, (referring to the constant provision of drinkable water), overcrowding and malnutrition, but also for the severe want of medical equipment. The territorial differences within the city are the direct evidence of the limits in the sanitary provision, which are stressed further by the inefficiency and non accessibility of these services for the majority of the population due to financial and location reasons (Patassini, 1993). A new hierarchic health system, which ranges from the general zone hospitals to the first aid station in the various kebeles, would surely bring a reduction of the infant and child mortality rates and reduce the inequalities before death, which are present in the urban reality of Addis Ababa.
Such remarkable differences in the 0-4 age group in the urban area of the city revealed, shortly after 1994 problems related to the organisation of the education
10 The TFR based on reported region is 1.8 children per woman both in the Country report and in the Addis Ababa report. In the Country report an adjusted measures is also quoted, which is 2.1 children per woman.
118
system, which must be dynamic and varied enough, in order to face the heterogeneous demand in the various Weredas. It is also needed to react promptly and in different ways to the reduction of the birth rate registered in recent yearsand and to the increase expected between the year 2000 and 2010, of the school population between 7 and 12 years of age. The school age population in this age group will grow from 254 to 338 thousand children. It is also nedded to react promptly to the reduction of the age group 13-14, which will decrease from 123 to 96 thousand and of the age group 15-18, which will decrease from 286 to 179 thousand (CSA, 1998).
These predictions are obviously quite uncertain due to the possible and
unpredictable changes in fertility and mortality. Apart from these predictions, there remains the fact that in the 1994 census there were 613 thousand youths between 10 and 19 years of age and in 10 years time they will be replaced by the 390 thousand children between 0 and 9 years registered by the survey. Bearing in mind the high mortality rate, we can assume that every group of 10 youths between 10-19 years in 1994, after 10 years, i.e. in the year 2004, will be replaced by 5 or 6 youths in the education system. The demographic reduction could therefore represent an opportunity to contain the overcrowding of classes and double or triple shifts.
As a result of the past and present birth and mortality rates, the Ethiopian ageing
process has only just begun. According to estimates of the CSA, in 1995 the portion of the population over 65, of the whole urban population, is 3.2 percent, whereas in the Addis Ababa region it is 2.7 percent. The highest percentage of elderly people can be found in Wereda 9, with a value of 3.6 percent, the lowest in Wereda 19, with a value of 1.8. Within the five urban and rural Weredas, the rural population is older, with a percentage of population over 65 included, beig between the values of 3.6 and 5.2 percent.
Considering the economic potentiality, with a relatively small proportion of
children and elderly people related to the high proportion of adults, Addis Ababa is in a particularly positive phase of demographic development. The dependency ratio11 is 52.3 percent owing 48.3 points to the young component and 3.2 to the elderly one. This value is much lower than that of the whole country (amongst the urban areas, the highest value is that of the Somali region, 86.7 percent, owing 82.2 points to young people and 4.5 to the elderly one) and very low as an absolute value. Such a situation generates a high production and income capacity, as long as there are high production and occupational levels, which will value this high portion of population in working age. This favourable situation, induced by the reduced number of young and elderly people in relation to the population of working age, should last, according to the population predictions, for a long time, at least thirty years.
Considering the data of Table 4.9, we can establish that within the city, the
highest old and young dependency ratio is that of Wereda 26, with 70.4 percent. This dependency ratio is only partially influenced by the value of the rural area, which is, as for all rural areas, much higher than any urban area. The lowest dendency is in Wereda 21, with a value of 42.1. Moreover, Maps 4.7 clearly shows how: the young population is proportionally more frequent in the southern parts of Addis Ababa. The old population is more concentrated in the core of the city, its oldest part. The shief relationship 11 Young people (0-14) plus old people (65+) devided by the population aged 15-64.
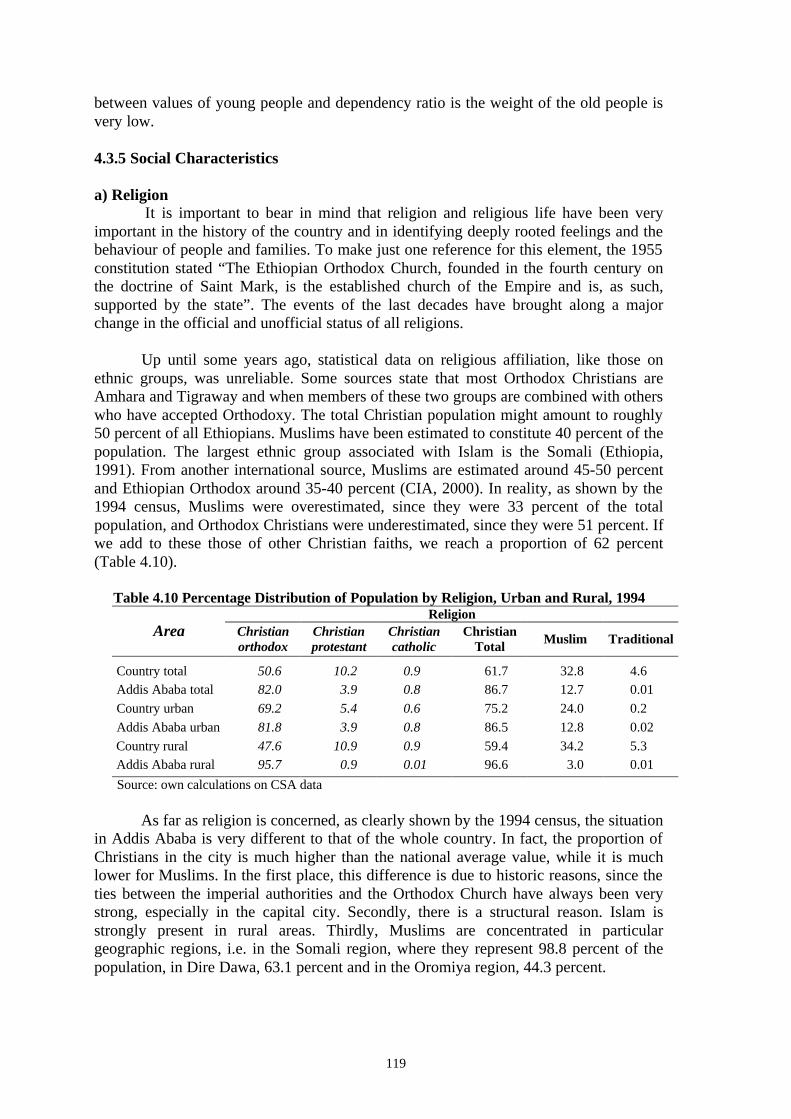
119
between values of young people and dependency ratio is the weight of the old people is very low.
4.3.5 Social Characteristics a) Religion
It is important to bear in mind that religion and religious life have been very important in the history of the country and in identifying deeply rooted feelings and the behaviour of people and families. To make just one reference for this element, the 1955 constitution stated “The Ethiopian Orthodox Church, founded in the fourth century on the doctrine of Saint Mark, is the established church of the Empire and is, as such, supported by the state”. The events of the last decades have brought along a major change in the official and unofficial status of all religions.
Up until some years ago, statistical data on religious affiliation, like those on
ethnic groups, was unreliable. Some sources state that most Orthodox Christians are Amhara and Tigraway and when members of these two groups are combined with others who have accepted Orthodoxy. The total Christian population might amount to roughly 50 percent of all Ethiopians. Muslims have been estimated to constitute 40 percent of the population. The largest ethnic group associated with Islam is the Somali (Ethiopia, 1991). From another international source, Muslims are estimated around 45-50 percent and Ethiopian Orthodox around 35-40 percent (CIA, 2000). In reality, as shown by the 1994 census, Muslims were overestimated, since they were 33 percent of the total population, and Orthodox Christians were underestimated, since they were 51 percent. If we add to these those of other Christian faiths, we reach a proportion of 62 percent (Table 4.10).
Table 4.10 Percentage Distribution of Population by Religion, Urban and Rural, 1994
Religion Area Christian
orthodox Christian protestant
Christian catholic
Christian Total Muslim Traditional
Country total 50.6 10.2 0.9 61.7 32.8 4.6 Addis Ababa total 82.0 3.9 0.8 86.7 12.7 0.01
Country urban 69.2 5.4 0.6 75.2 24.0 0.2
Addis Ababa urban 81.8 3.9 0.8 86.5 12.8 0.02
Country rural 47.6 10.9 0.9 59.4 34.2 5.3 Addis Ababa rural 95.7 0.9 0.01 96.6 3.0 0.01
Source: own calculations on CSA data As far as religion is concerned, as clearly shown by the 1994 census, the situation
in Addis Ababa is very different to that of the whole country. In fact, the proportion of Christians in the city is much higher than the national average value, while it is much lower for Muslims. In the first place, this difference is due to historic reasons, since the ties between the imperial authorities and the Orthodox Church have always been very strong, especially in the capital city. Secondly, there is a structural reason. Islam is strongly present in rural areas. Thirdly, Muslims are concentrated in particular geographic regions, i.e. in the Somali region, where they represent 98.8 percent of the population, in Dire Dawa, 63.1 percent and in the Oromiya region, 44.3 percent.
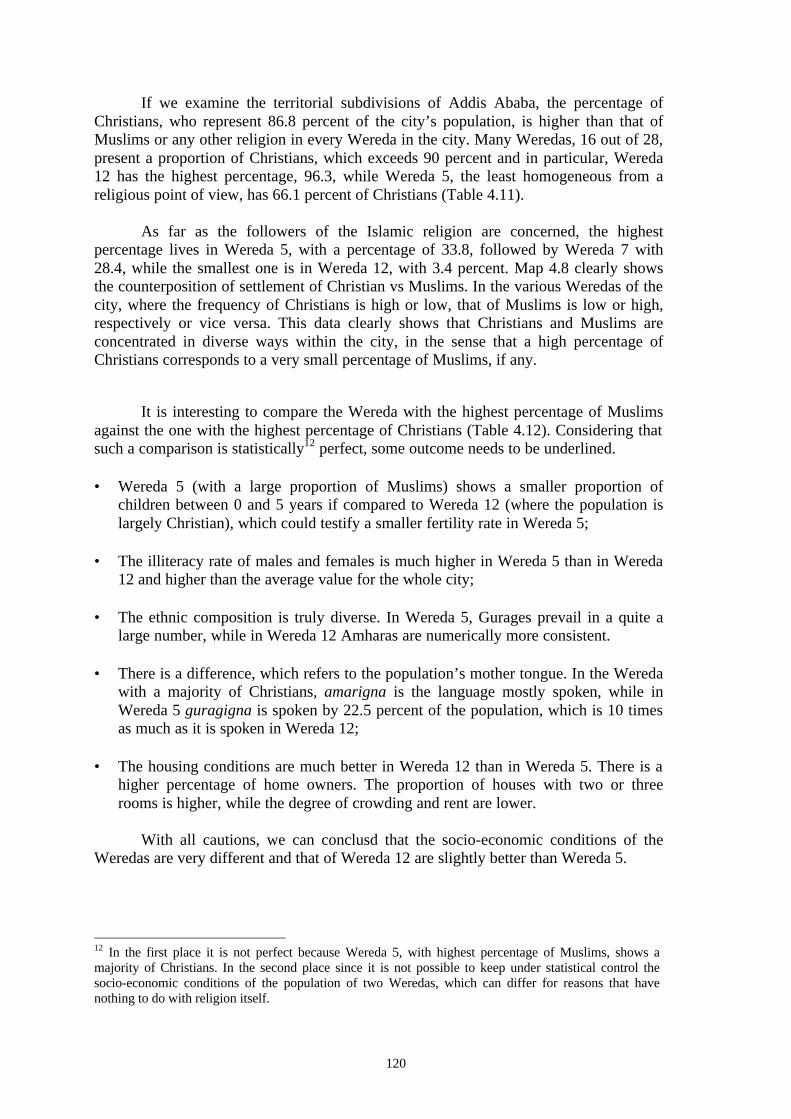
120
If we examine the territorial subdivisions of Addis Ababa, the percentage of Christians, who represent 86.8 percent of the city’s population, is higher than that of Muslims or any other religion in every Wereda in the city. Many Weredas, 16 out of 28, present a proportion of Christians, which exceeds 90 percent and in particular, Wereda 12 has the highest percentage, 96.3, while Wereda 5, the least homogeneous from a religious point of view, has 66.1 percent of Christians (Table 4.11).
As far as the followers of the Islamic religion are concerned, the highest
percentage lives in Wereda 5, with a percentage of 33.8, followed by Wereda 7 with 28.4, while the smallest one is in Wereda 12, with 3.4 percent. Map 4.8 clearly shows the counterposition of settlement of Christian vs Muslims. In the various Weredas of the city, where the frequency of Christians is high or low, that of Muslims is low or high, respectively or vice versa. This data clearly shows that Christians and Muslims are concentrated in diverse ways within the city, in the sense that a high percentage of Christians corresponds to a very small percentage of Muslims, if any.
It is interesting to compare the Wereda with the highest percentage of Muslims against the one with the highest percentage of Christians (Table 4.12). Considering that such a comparison is statistically12 perfect, some outcome needs to be underlined.
• Wereda 5 (with a large proportion of Muslims) shows a smaller proportion of
children between 0 and 5 years if compared to Wereda 12 (where the population is largely Christian), which could testify a smaller fertility rate in Wereda 5;
• The illiteracy rate of males and females is much higher in Wereda 5 than in Wereda
12 and higher than the average value for the whole city; • The ethnic composition is truly diverse. In Wereda 5, Gurages prevail in a quite a
large number, while in Wereda 12 Amharas are numerically more consistent. • There is a difference, which refers to the population’s mother tongue. In the Wereda
with a majority of Christians, amarigna is the language mostly spoken, while in Wereda 5 guragigna is spoken by 22.5 percent of the population, which is 10 times as much as it is spoken in Wereda 12;
• The housing conditions are much better in Wereda 12 than in Wereda 5. There is a
higher percentage of home owners. The proportion of houses with two or three rooms is higher, while the degree of crowding and rent are lower.
With all cautions, we can conclusd that the socio-economic conditions of the
Weredas are very different and that of Wereda 12 are slightly better than Wereda 5.
12 In the first place it is not perfect because Wereda 5, with highest percentage of Muslims, shows a majority of Christians. In the second place since it is not possible to keep under statistical control the socio-economic conditions of the population of two Weredas, which can differ for reasons that have nothing to do with religion itself.
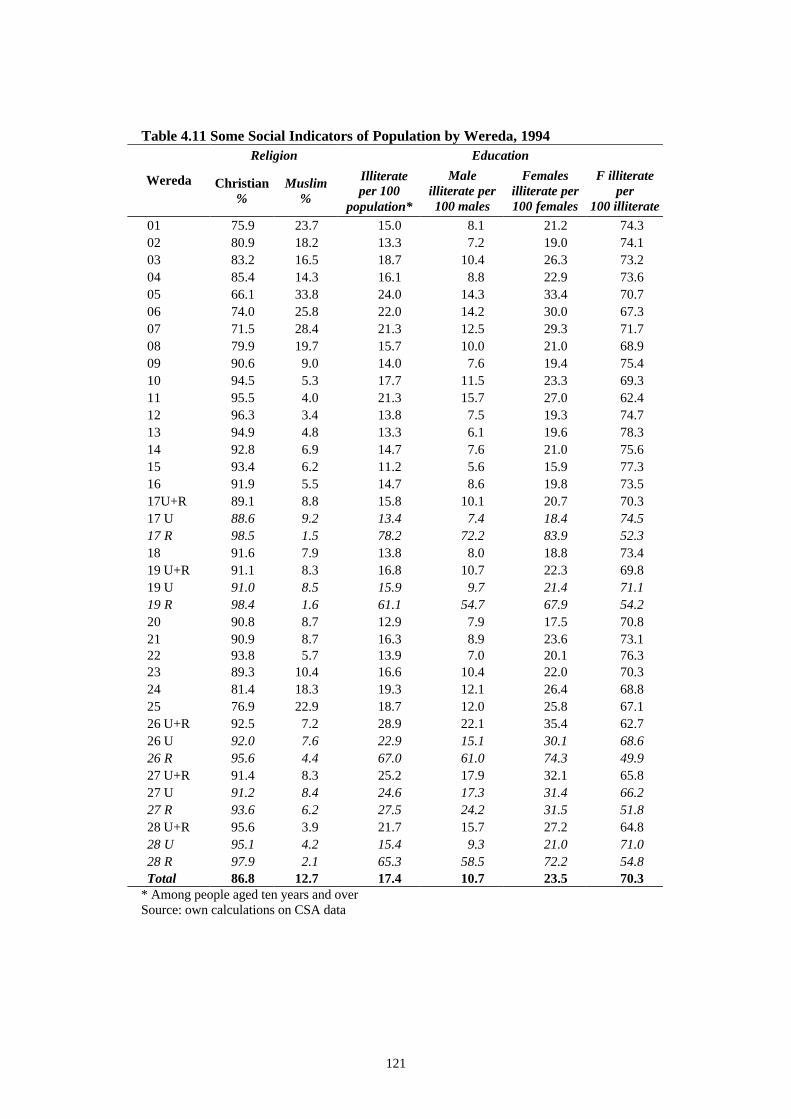
121
Table 4.11 Some Social Indicators of Population by Wereda, 1994
Religion Education
Wereda Christian %
Muslim %
Illiterate per 100
population*
Male illiterate per 100 males
Females illiterate per 100 females
F illiterate per
100 illiterate
01 75.9 23.7 15.0 8.1 21.2 74.3 02 80.9 18.2 13.3 7.2 19.0 74.1 03 83.2 16.5 18.7 10.4 26.3 73.2 04 85.4 14.3 16.1 8.8 22.9 73.6 05 66.1 33.8 24.0 14.3 33.4 70.7 06 74.0 25.8 22.0 14.2 30.0 67.3 07 71.5 28.4 21.3 12.5 29.3 71.7 08 79.9 19.7 15.7 10.0 21.0 68.9 09 90.6 9.0 14.0 7.6 19.4 75.4 10 94.5 5.3 17.7 11.5 23.3 69.3 11 95.5 4.0 21.3 15.7 27.0 62.4 12 96.3 3.4 13.8 7.5 19.3 74.7 13 94.9 4.8 13.3 6.1 19.6 78.3 14 92.8 6.9 14.7 7.6 21.0 75.6 15 93.4 6.2 11.2 5.6 15.9 77.3 16 91.9 5.5 14.7 8.6 19.8 73.5 17U+R 89.1 8.8 15.8 10.1 20.7 70.3 17 U 88.6 9.2 13.4 7.4 18.4 74.5 17 R 98.5 1.5 78.2 72.2 83.9 52.3 18 91.6 7.9 13.8 8.0 18.8 73.4 19 U+R 91.1 8.3 16.8 10.7 22.3 69.8 19 U 91.0 8.5 15.9 9.7 21.4 71.1 19 R 98.4 1.6 61.1 54.7 67.9 54.2 20 90.8 8.7 12.9 7.9 17.5 70.8 21 90.9 8.7 16.3 8.9 23.6 73.1 22 93.8 5.7 13.9 7.0 20.1 76.3 23 89.3 10.4 16.6 10.4 22.0 70.3 24 81.4 18.3 19.3 12.1 26.4 68.8 25 76.9 22.9 18.7 12.0 25.8 67.1 26 U+R 92.5 7.2 28.9 22.1 35.4 62.7 26 U 92.0 7.6 22.9 15.1 30.1 68.6 26 R 95.6 4.4 67.0 61.0 74.3 49.9 27 U+R 91.4 8.3 25.2 17.9 32.1 65.8 27 U 91.2 8.4 24.6 17.3 31.4 66.2 27 R 93.6 6.2 27.5 24.2 31.5 51.8 28 U+R 95.6 3.9 21.7 15.7 27.2 64.8 28 U 95.1 4.2 15.4 9.3 21.0 71.0 28 R 97.9 2.1 65.3 58.5 72.2 54.8 Total 86.8 12.7 17.4 10.7 23.5 70.3
* Among people aged ten years and over Source: own calculations on CSA data
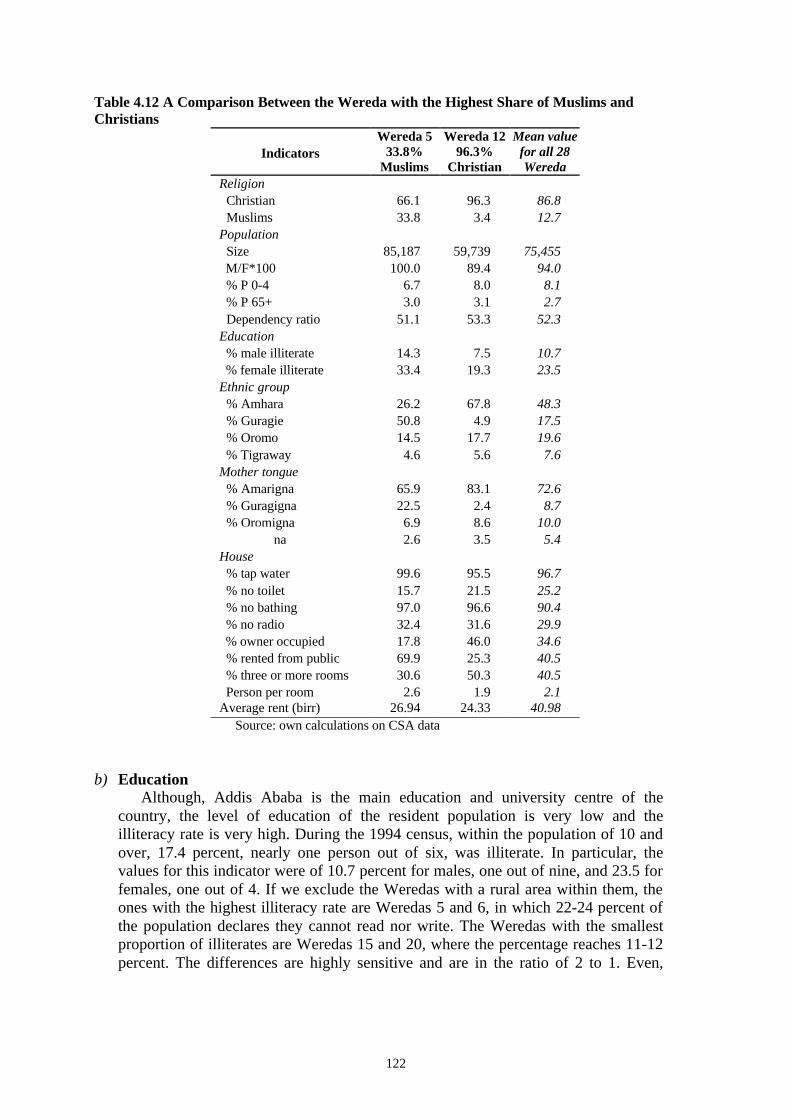
122
Table 4.12 A Comparison Between the Wereda with the Highest Share of Muslims and Christians
Indicators
Wereda 5 33.8%
Muslims
Wereda 12 96.3%
Christian
Mean value for all 28 Wereda
Religion Christian 66.1 96.3 86.8 Muslims 33.8 3.4 12.7 Population Size 85,187 59,739 75,455 M/F*100 100.0 89.4 94.0 % P 0-4 6.7 8.0 8.1 % P 65+ 3.0 3.1 2.7 Dependency ratio 51.1 53.3 52.3 Education % male illiterate 14.3 7.5 10.7 % female illiterate 33.4 19.3 23.5 Ethnic group % Amhara 26.2 67.8 48.3 % Guragie 50.8 4.9 17.5 % Oromo 14.5 17.7 19.6 % Tigraway 4.6 5.6 7.6 Mother tongue % Amarigna 65.9 83.1 72.6 % Guragigna 22.5 2.4 8.7 % Oromigna 6.9 8.6 10.0 % Tigrigna 2.6 3.5 5.4 House % tap water 99.6 95.5 96.7 % no toilet 15.7 21.5 25.2 % no bathing 97.0 96.6 90.4 % no radio 32.4 31.6 29.9 % owner occupied 17.8 46.0 34.6 % rented from public 69.9 25.3 40.5 % three or more rooms 30.6 50.3 40.5 Person per room 2.6 1.9 2.1 Average rent (birr) 26.94 24.33 40.98
Source: own calculations on CSA data b) Education
Although, Addis Ababa is the main education and university centre of the country, the level of education of the resident population is very low and the illiteracy rate is very high. During the 1994 census, within the population of 10 and over, 17.4 percent, nearly one person out of six, was illiterate. In particular, the values for this indicator were of 10.7 percent for males, one out of nine, and 23.5 for females, one out of 4. If we exclude the Weredas with a rural area within them, the ones with the highest illiteracy rate are Weredas 5 and 6, in which 22-24 percent of the population declares they cannot read nor write. The Weredas with the smallest proportion of illiterates are Weredas 15 and 20, where the percentage reaches 11-12 percent. The differences are highly sensitive and are in the ratio of 2 to 1. Even,
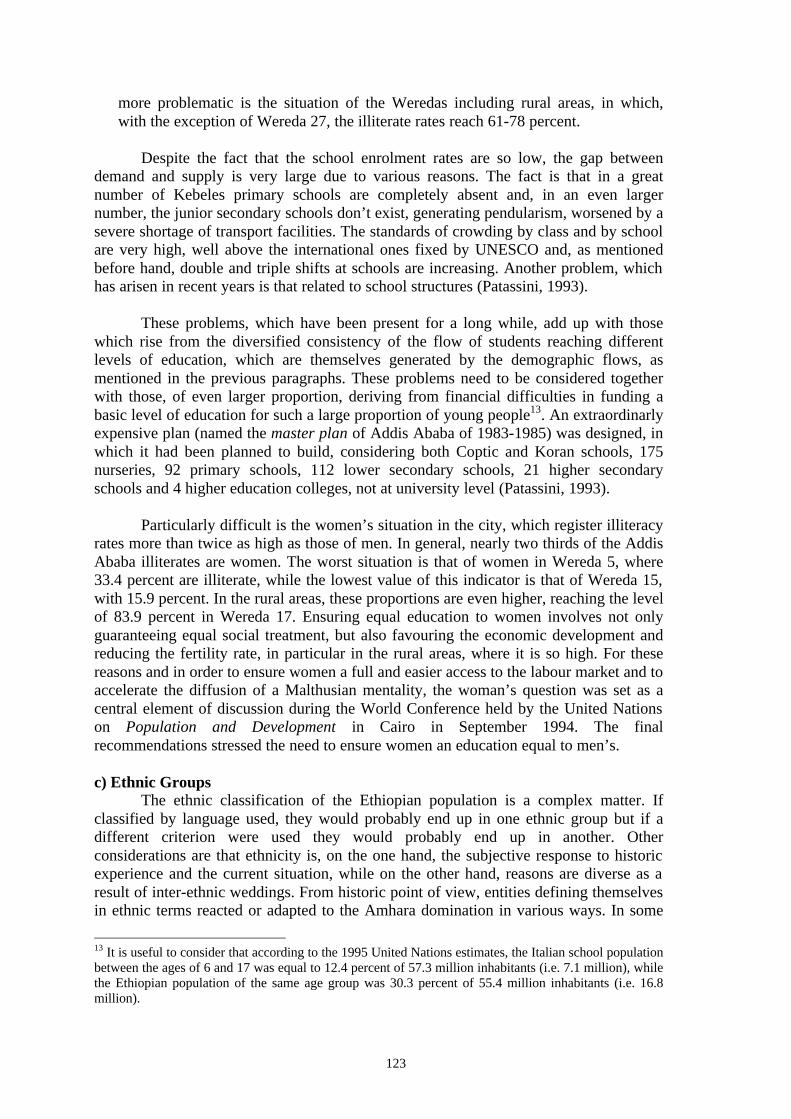
123
more problematic is the situation of the Weredas including rural areas, in which, with the exception of Wereda 27, the illiterate rates reach 61-78 percent.
Despite the fact that the school enrolment rates are so low, the gap between
demand and supply is very large due to various reasons. The fact is that in a great number of Kebeles primary schools are completely absent and, in an even larger number, the junior secondary schools don’t exist, generating pendularism, worsened by a severe shortage of transport facilities. The standards of crowding by class and by school are very high, well above the international ones fixed by UNESCO and, as mentioned before hand, double and triple shifts at schools are increasing. Another problem, which has arisen in recent years is that related to school structures (Patassini, 1993).
These problems, which have been present for a long while, add up with those
which rise from the diversified consistency of the flow of students reaching different levels of education, which are themselves generated by the demographic flows, as mentioned in the previous paragraphs. These problems need to be considered together with those, of even larger proportion, deriving from financial difficulties in funding a basic level of education for such a large proportion of young people13. An extraordinarly expensive plan (named the master plan of Addis Ababa of 1983-1985) was designed, in which it had been planned to build, considering both Coptic and Koran schools, 175 nurseries, 92 primary schools, 112 lower secondary schools, 21 higher secondary schools and 4 higher education colleges, not at university level (Patassini, 1993).
Particularly difficult is the women’s situation in the city, which register illiteracy
rates more than twice as high as those of men. In general, nearly two thirds of the Addis Ababa illiterates are women. The worst situation is that of women in Wereda 5, where 33.4 percent are illiterate, while the lowest value of this indicator is that of Wereda 15, with 15.9 percent. In the rural areas, these proportions are even higher, reaching the level of 83.9 percent in Wereda 17. Ensuring equal education to women involves not only guaranteeing equal social treatment, but also favouring the economic development and reducing the fertility rate, in particular in the rural areas, where it is so high. For these reasons and in order to ensure women a full and easier access to the labour market and to accelerate the diffusion of a Malthusian mentality, the woman’s question was set as a central element of discussion during the World Conference held by the United Nations on Population and Development in Cairo in September 1994. The final recommendations stressed the need to ensure women an education equal to men’s. c) Ethnic Groups The ethnic classification of the Ethiopian population is a complex matter. If classified by language used, they would probably end up in one ethnic group but if a different criterion were used they would probably end up in another. Other considerations are that ethnicity is, on the one hand, the subjective response to historic experience and the current situation, while on the other hand, reasons are diverse as a result of inter-ethnic weddings. From historic point of view, entities defining themselves in ethnic terms reacted or adapted to the Amhara domination in various ways. In some
13 It is useful to consider that according to the 1995 United Nations estimates, the Italian school population between the ages of 6 and 17 was equal to 12.4 percent of 57.3 million inhabitants (i.e. 7.1 million), while the Ethiopian population of the same age group was 30.3 percent of 55.4 million inhabitants (i.e. 16.8 million).
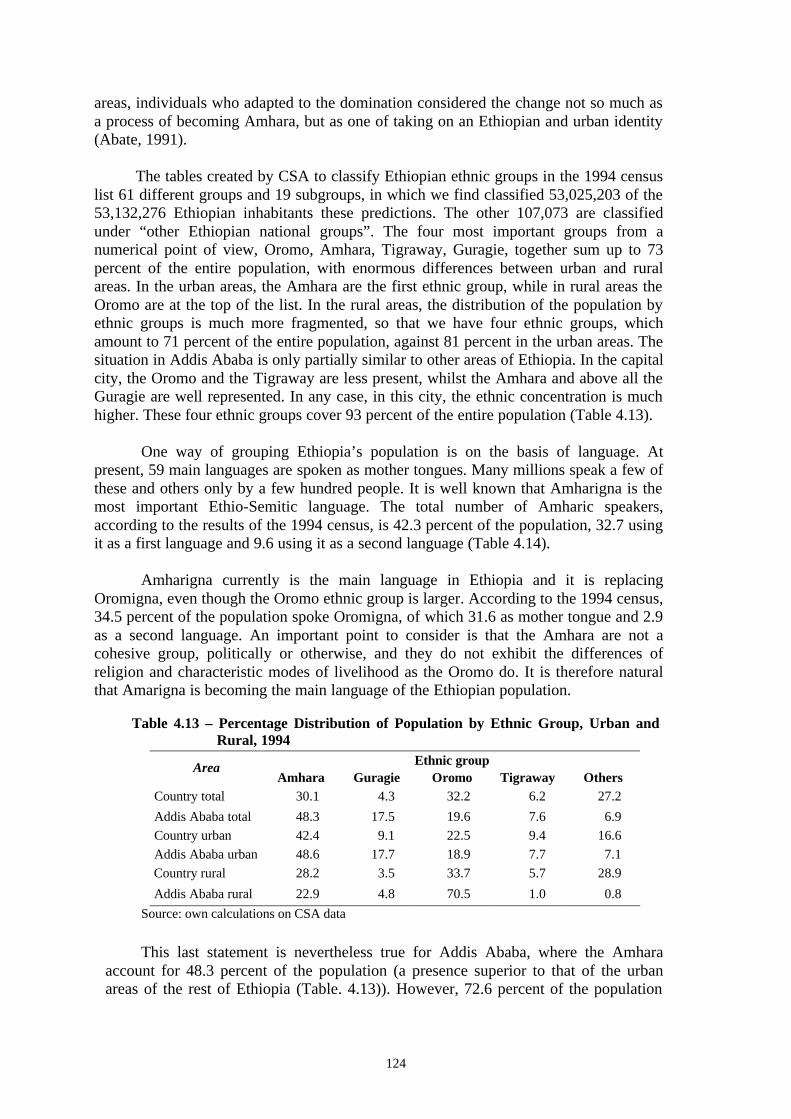
124
areas, individuals who adapted to the domination considered the change not so much as a process of becoming Amhara, but as one of taking on an Ethiopian and urban identity (Abate, 1991).
The tables created by CSA to classify Ethiopian ethnic groups in the 1994 census list 61 different groups and 19 subgroups, in which we find classified 53,025,203 of the 53,132,276 Ethiopian inhabitants these predictions. The other 107,073 are classified under “other Ethiopian national groups”. The four most important groups from a numerical point of view, Oromo, Amhara, Tigraway, Guragie, together sum up to 73 percent of the entire population, with enormous differences between urban and rural areas. In the urban areas, the Amhara are the first ethnic group, while in rural areas the Oromo are at the top of the list. In the rural areas, the distribution of the population by ethnic groups is much more fragmented, so that we have four ethnic groups, which amount to 71 percent of the entire population, against 81 percent in the urban areas. The situation in Addis Ababa is only partially similar to other areas of Ethiopia. In the capital city, the Oromo and the Tigraway are less present, whilst the Amhara and above all the Guragie are well represented. In any case, in this city, the ethnic concentration is much higher. These four ethnic groups cover 93 percent of the entire population (Table 4.13).
One way of grouping Ethiopia’s population is on the basis of language. At
present, 59 main languages are spoken as mother tongues. Many millions speak a few of these and others only by a few hundred people. It is well known that Amharigna is the most important Ethio-Semitic language. The total number of Amharic speakers, according to the results of the 1994 census, is 42.3 percent of the population, 32.7 using it as a first language and 9.6 using it as a second language (Table 4.14).
Amharigna currently is the main language in Ethiopia and it is replacing
Oromigna, even though the Oromo ethnic group is larger. According to the 1994 census, 34.5 percent of the population spoke Oromigna, of which 31.6 as mother tongue and 2.9 as a second language. An important point to consider is that the Amhara are not a cohesive group, politically or otherwise, and they do not exhibit the differences of religion and characteristic modes of livelihood as the Oromo do. It is therefore natural that Amarigna is becoming the main language of the Ethiopian population.
Table 4.13 – Percentage Distribution of Population by Ethnic Group, Urban and
Rural, 1994 Ethnic group Area
Amhara Guragie Oromo Tigraway Others Country total 30.1 4.3 32.2 6.2 27.2
Addis Ababa total 48.3 17.5 19.6 7.6 6.9
Country urban 42.4 9.1 22.5 9.4 16.6
Addis Ababa urban 48.6 17.7 18.9 7.7 7.1
Country rural 28.2 3.5 33.7 5.7 28.9
Addis Ababa rural 22.9 4.8 70.5 1.0 0.8
Source: own calculations on CSA data
This last statement is nevertheless true for Addis Ababa, where the Amhara
account for 48.3 percent of the population (a presence superior to that of the urban areas of the rest of Ethiopia (Table. 4.13)). However, 72.6 percent of the population

125
uses Amharigna as their mother tongue (Table 4.14) and 24.5 percent as a second language, a total of 97.1 percent. In the capital city, by choice or as a necessity, Amharigna is becoming the language spoken by everybody and therefore an element of social and economic cohesion.
Table 4.14 – Percentage Distribution of Population by Ethnic Group and Mother
Tongue, 1994 Ethnic group
Area Amhara Guragie Oromo Tigraway Others
Country total 30.1 4.3 32.2 6.2 27.2
Addis Ababa total 48.3 17.5 19.6 7.6 6.9
Mother tongue Amharigna Guragigna Oromigna Tigrigna Others
Country total 32.7 3.5 31.6 6.1 26.1
Addis Ababa total 72.6 8.7 10.0 5.4 3.2
Source: own calculations on CSA data In the city, there are a large number of Oromo, 19.6 percent, but those who use
Oromigna as their mother tongue are only 10.0 percent, and of Guragie groups, 17.5 percent (but only 8.7 percent use Guragigna as their mother tongue). There are also a considerable number of Tigraway, approximately 7.6 percent of the population (Table 4.14).Within the city, the situation varies from Wereda to Wereda, highlighting clear territorial characteristics related to ethnic group and language spoken. In one Wereda, we can notice,on the one hand, a considerable mixture of ethnic groups and on the other a larger concentration of single groups (Table 4.15 and map 4.9).
• Against an average value of 48.3 percent of Amhara, in Wereda 5, which also has
the highest presence of Muslims, they account for only 26.2 percent of the population and in Wereda 6 for 25.3. In Wereda 12 (the one with the highest presence of Christians) and Wereda 13, however, they account for 67.8 percent;
• Amarigna as a mother tongue is spoken on average by 72.6 percent of the
population, but in Wereda 10 the values rises to 86.9 and in Wereda 25 it drops to 62.4. Figure 4.2 easly demonstrates how in all Weredas Amharigna is spoken as a mother tongue by a fraction of the population, which is often much higher than those who declare to belong to the Amhara ethnic group. This is probably a consequence of the influence of schools and of the cultural and working environment of the capital city. We can also assume that the Amharigna language is carrying out the important task of creating a homogeneous culture.
• The Oromos, aginst an average value of 19.6 percent, the constitute11.8, 44.9 and
45.3 in Weredas 2, 26, and in 27, respectively. In the rural areas, they are even more consistent, reaching a presence of 70.5 percent;
• Oromigna is spoken as a mother tongue by approximately 10.0 percent of the city’s population, corresponding to half the ethnic group. Within the Weredas, there is a perfect correspondence between ethnic groups and Oromigna. A minimum value in Wereda 2 with 6.2 percent and a maximum value in Weredas 26 and 27, with 27.2 and 23.7. In the rural areas, Oromigna is the mother tongue to 65.7 percent of the population.
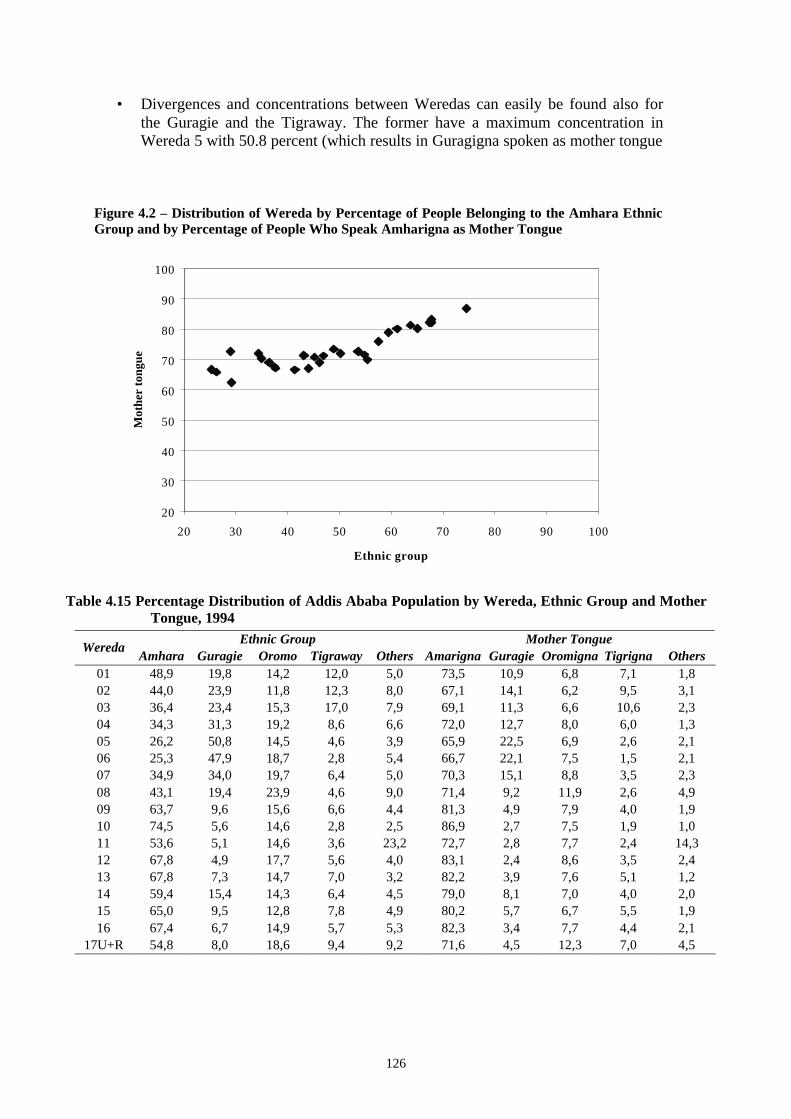
126
• Divergences and concentrations between Weredas can easily be found also for the Guragie and the Tigraway. The former have a maximum concentration in Wereda 5 with 50.8 percent (which results in Guragigna spoken as mother tongue
Figure 4.2 – Distribution of Wereda by Percentage of People Belonging to the Amhara Ethnic Group and by Percentage of People Who Speak Amharigna as Mother Tongue
Table 4.15 Percentage Distribution of Addis Ababa Population by Wereda, Ethnic Group and Mother
Tongue, 1994 Ethnic Group Mother Tongue
Wereda Amhara Guragie Oromo Tigraway Others Amarigna Guragie Oromigna Tigrigna Others
01 48,9 19,8 14,2 12,0 5,0 73,5 10,9 6,8 7,1 1,8 02 44,0 23,9 11,8 12,3 8,0 67,1 14,1 6,2 9,5 3,1 03 36,4 23,4 15,3 17,0 7,9 69,1 11,3 6,6 10,6 2,3 04 34,3 31,3 19,2 8,6 6,6 72,0 12,7 8,0 6,0 1,3 05 26,2 50,8 14,5 4,6 3,9 65,9 22,5 6,9 2,6 2,1 06 25,3 47,9 18,7 2,8 5,4 66,7 22,1 7,5 1,5 2,1 07 34,9 34,0 19,7 6,4 5,0 70,3 15,1 8,8 3,5 2,3 08 43,1 19,4 23,9 4,6 9,0 71,4 9,2 11,9 2,6 4,9 09 63,7 9,6 15,6 6,6 4,4 81,3 4,9 7,9 4,0 1,9 10 74,5 5,6 14,6 2,8 2,5 86,9 2,7 7,5 1,9 1,0 11 53,6 5,1 14,6 3,6 23,2 72,7 2,8 7,7 2,4 14,3 12 67,8 4,9 17,7 5,6 4,0 83,1 2,4 8,6 3,5 2,4 13 67,8 7,3 14,7 7,0 3,2 82,2 3,9 7,6 5,1 1,2 14 59,4 15,4 14,3 6,4 4,5 79,0 8,1 7,0 4,0 2,0 15 65,0 9,5 12,8 7,8 4,9 80,2 5,7 6,7 5,5 1,9 16 67,4 6,7 14,9 5,7 5,3 82,3 3,4 7,7 4,4 2,1
17U+R 54,8 8,0 18,6 9,4 9,2 71,6 4,5 12,3 7,0 4,5
20
30
40
50
60
70
80
90
100
20 30 40 50 60 70 80 90 100
Ethnic group
Mot
her
tong
ue

127
Table 4.15, Continued
Ethnic Group Mother Tongue Wereda
Amhara Guragie Oromo Tigraway Others Amarigna Guragie Oromigna Tigrigna Others U 56,8 8,3 15,5 9,8 9,6 74,4 4,6 8,9 7,3 4,7
17 R 10,2 1,7 87,6 0,3 0,2 10,7 0,9 88,0 0,1 0,2 18 57,5 9,9 14,4 11,3 6,9 76,0 6,2 7,4 7,8 2,6
19 U+R 46,2 9,8 27,0 10,0 7,0 69,0 5,7 14,2 8,6 2,6 19 U 46,5 10,0 26,2 10,2 7,1 69,4 5,8 13,4 8,8 2,6 19 R 37,0 1,5 60,5 0,6 0,4 50,2 1,2 48,0 0,5 0,1 20 45,2 11,4 18,9 15,2 9,3 70,8 6,4 8,4 11,9 2,5 21 46,9 12,1 15,3 15,7 10,1 71,2 7,5 6,8 12,2 2,4 22 61,1 9,0 16,7 8,6 4,6 80,1 5,2 7,2 6,2 1,2 23 50,2 11,6 21,3 8,4 8,4 72,0 5,6 10,0 7,5 4,9 24 37,5 28,4 24,2 4,4 5,4 67,6 14,2 12,2 3,0 3,0 25 29,2 37,7 19,3 3,1 10,7 62,4 19,9 8,9 2,0 6,8
26 U+R 41,4 8,7 44,9 2,2 2,7 66,6 4,2 27,2 1,3 0,8 26 U 44,7 9,4 40,2 2,6 3,1 72,8 4,6 20,3 1,5 0,9 26 R 22,3 5,0 71,9 0,3 0,4 30,6 2,2 66,8 0,3 0,1
27 U+R 37,7 10,5 45,3 4,5 2,0 67,2 5,5 23,9 2,9 0,6 27 U 38,6 9,7 45,2 4,5 2,0 69,3 4,5 22,8 2,9 0,5 27 R 27,3 19,9 47,2 3,8 1,8 42,7 16,9 36,7 2,9 0,8
28 U+R 55,4 5,4 27,9 6,4 4,9 69,9 3,0 20,2 4,3 2,6 28 U 60,1 6,1 21,0 7,3 5,5 76,3 3,4 12,5 4,9 2,9 28 R 24,8 1,1 72,4 0,9 0,9 28,9 0,6 69,3 0,5 0,7
Total 48,3 17,5 19,6 7,6 7,0 72,6 8,7 10,0 5,4 3,2 Source: own calculations on CSA data
by 22.5 percent of the population). The latter are mostly present in Wereda 21 with 15.7 percent (here Tigrigna is spoken as mother tongue by 12.2 percent);
• The four main ethnic groups cover on an average 93.0 percent of the entire population of the city, ranging from 98.0 in Wereda 27 to 76.8 in Wereda 11, where there is a strong concentration of Weilata (21.4 percent) and, in particular, of Gamo and Dorzie tribes.
4.3. 6 Housing Characteristics and Conditions
The housing characteristics and conditions in Addis Ababa are much better than those of the rest of the country (Table 4.16). In particular, in the capital city one finds: -
• The proportion of houses without tap water is extraordinarily lower than that of the rest of Ethiopia, even, when compared to the urban areas only. In fact, in Addis Ababa, excluding the small rural areas, nearly all households have tap water;
• In the urban area, approximately 1 house out of 4 does not have a toilet and this proportion rises to 1 out of 2 in the urban areas of the rest of the country. In the rural areas, the situation in both cases is dramatic, since households without toilets are nearly 100 percent;
• In all cases, households with a radio are much more frequent;
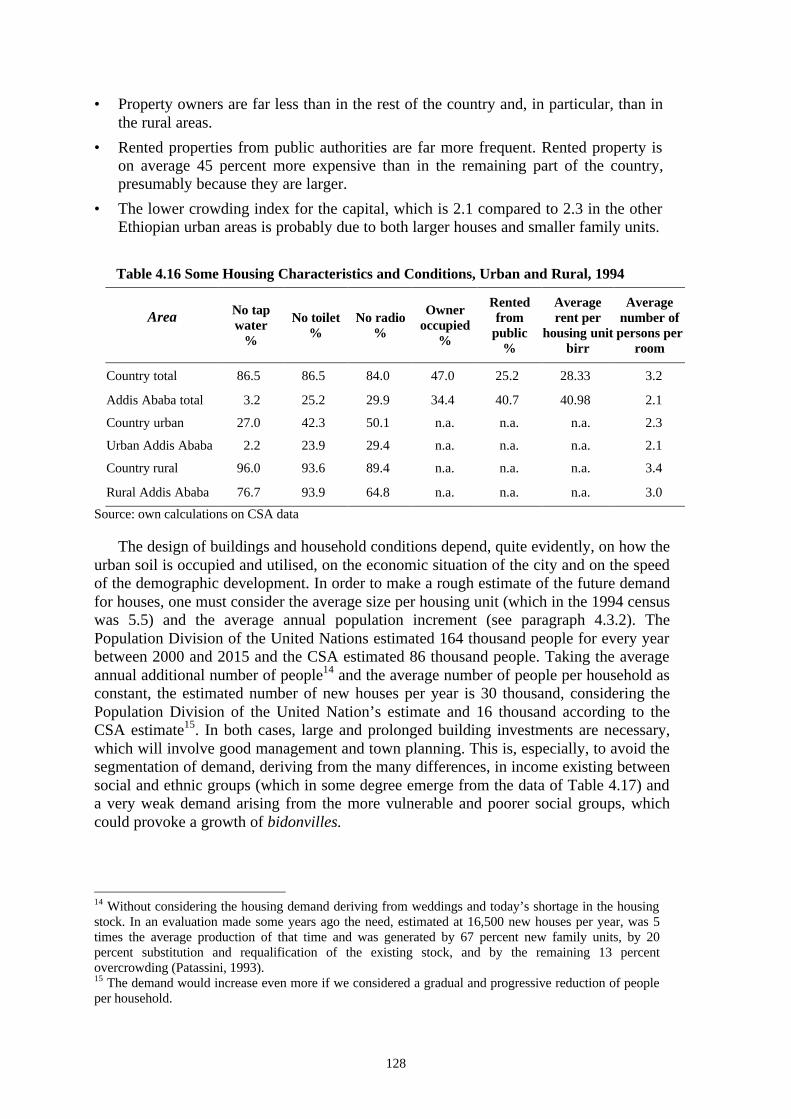
128
• Property owners are far less than in the rest of the country and, in particular, than in the rural areas.
• Rented properties from public authorities are far more frequent. Rented property is on average 45 percent more expensive than in the remaining part of the country, presumably because they are larger.
• The lower crowding index for the capital, which is 2.1 compared to 2.3 in the other Ethiopian urban areas is probably due to both larger houses and smaller family units.
Table 4.16 Some Housing Characteristics and Conditions, Urban and Rural, 1994
Area
No tap water
%
No toilet %
No radio %
Owner occupied
%
Rented from
public %
Average rent per
housing unit birr
Average number of
persons per room
Country total 86.5 86.5 84.0 47.0 25.2 28.33 3.2
Addis Ababa total 3.2 25.2 29.9 34.4 40.7 40.98 2.1
Country urban 27.0 42.3 50.1 n.a. n.a. n.a. 2.3
Urban Addis Ababa 2.2 23.9 29.4 n.a. n.a. n.a. 2.1
Country rural 96.0 93.6 89.4 n.a. n.a. n.a. 3.4
Rural Addis Ababa 76.7 93.9 64.8 n.a. n.a. n.a. 3.0
Source: own calculations on CSA data
The design of buildings and household conditions depend, quite evidently, on how the urban soil is occupied and utilised, on the economic situation of the city and on the speed of the demographic development. In order to make a rough estimate of the future demand for houses, one must consider the average size per housing unit (which in the 1994 census was 5.5) and the average annual population increment (see paragraph 4.3.2). The Population Division of the United Nations estimated 164 thousand people for every year between 2000 and 2015 and the CSA estimated 86 thousand people. Taking the average annual additional number of people14 and the average number of people per household as constant, the estimated number of new houses per year is 30 thousand, considering the Population Division of the United Nation’s estimate and 16 thousand according to the CSA estimate15. In both cases, large and prolonged building investments are necessary, which will involve good management and town planning. This is, especially, to avoid the segmentation of demand, deriving from the many differences, in income existing between social and ethnic groups (which in some degree emerge from the data of Table 4.17) and a very weak demand arising from the more vulnerable and poorer social groups, which could provoke a growth of bidonvilles.
14 Without considering the housing demand deriving from weddings and today’s shortage in the housing stock. In an evaluation made some years ago the need, estimated at 16,500 new houses per year, was 5 times the average production of that time and was generated by 67 percent new family units, by 20 percent substitution and requalification of the existing stock, and by the remaining 13 percent overcrowding (Patassini, 1993). 15 The demand would increase even more if we considered a gradual and progressive reduction of people per household.

129
Observing the situation of the Weredas, based on the 1994 census, consistent differences emerge amongst all indicators (Table 4.17). Considering only three of these aspects, which illustrate some aspects of family life, the social and economic one, one finds the following situations.
a) The crowding index. This index, with the minimum value of 1.7 people per room is
for Wereda 17, where 31.1 percent of the households have bathing facilities. The maximum value is 2.6 people per room, which is nearly an extra person and a high level of crowding is observed in Weredas 5 and 7. In these Weredas, only 3.0 and 4.1 percent of the households have bathing facilities.
b) The rent. The rent for the Weredas, excluding rural areas, varies between an average of 23.27 birr in Wereda 7 and an average of 59.33 birr in Wereda 23. However, in Wereda 7, 66 percent of the houses are publicly owned, 20 percent do not have a toilet and 96 percent have no bathing facility. In Wereda 23, 23 percent of the rented houses are privately owned, 37 do not have a toilet and 88 have no bathing facility. Thus, there does not seem to be any direct relationship between the rent and the housing equipment.
For the Weredas, including rural areas, the average rent is much more variable. The minimum is 13.14 birr in Wereda 26 (where 56 percent of the households have a toilet), which is one of the poorest in the city. The maximum is 104.60 and 141.89 birr in Weredas 28 and 17 (where 19 percent of the households do not have a toilet). Wereda 28 has the highest concentration of governmental offices and Embassies, while in Wereda 17, there are new buildings, including the nicest villas of the city, inhabited by the well-off population of the city.
c) Radio. The frequency of the possession of a radio indicates that the maximum value is 78 percent for Weredas 2 and 17 and the minimum values are 57 and 59 percent for Weredas 26 and 27.
Table 4.17 Housing Characteristics and Conditions of Addis Ababa by Wereda, 1994
Wereda No tap water
%
No toilet %
No radio %
Owner Occupied
%
Rented from
Public %
Average rent per
housing unit birr
Average number of
persons per room
01 0.1 13.9 28.1 17.6 64.6 30.25 2.4 02 0.0 11.5 21.9 13.9 65.1 55.21 2.2 03 0.1 18.7 30.2 17.8 65.8 25.40 2.4 04 0.1 16.1 25.3 21.7 62.7 24.25 2.2 05 0.2 15.7 32.4 17.8 69.9 26.94 2.6 06 0.0 19.5 31.1 22.6 58.8 23.41 2.4 07 0.1 20.1 31.5 18.9 65.9 23.27 2.6 08 5.2 24.3 26.0 43.1 35.6 36.03 2.0 09 0.1 18.5 28.6 24.9 54.1 38.46 2.2 10 1.4 28.2 33.2 41.4 33.7 33.33 2.1 11 2.3 36.3 37.3 32.1 37.5 26.22 2.2 12 4.5 21.5 31.6 46.0 25.3 24.33 1.9 13 0.1 21.1 27.8 23.3 55.5 31.62 1.9
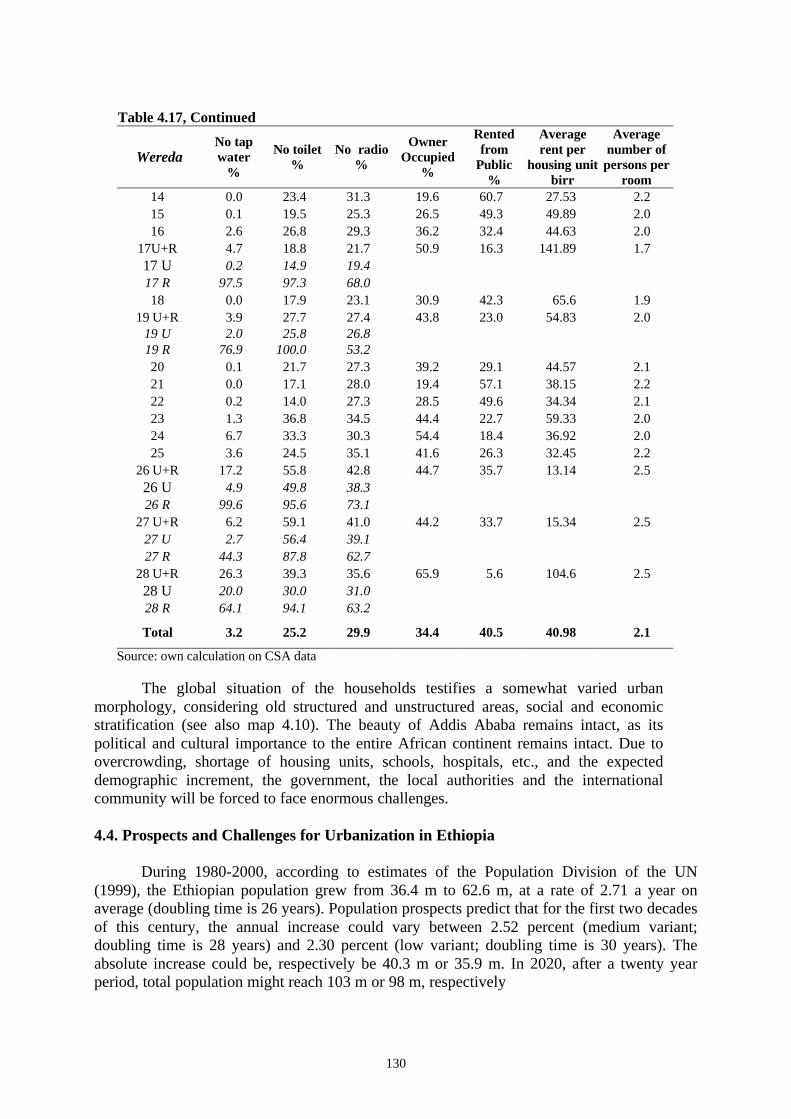
130
Table 4.17, Continued
Wereda No tap water
%
No toilet %
No radio %
Owner Occupied
%
Rented from
Public %
Average rent per
housing unit birr
Average number of
persons per room
14 0.0 23.4 31.3 19.6 60.7 27.53 2.2 15 0.1 19.5 25.3 26.5 49.3 49.89 2.0 16 2.6 26.8 29.3 36.2 32.4 44.63 2.0
17U+R 4.7 18.8 21.7 50.9 16.3 141.89 1.7 17 U 0.2 14.9 19.4 17 R 97.5 97.3 68.0 18 0.0 17.9 23.1 30.9 42.3 65.6 1.9
19 U+R 3.9 27.7 27.4 43.8 23.0 54.83 2.0 19 U 2.0 25.8 26.8 19 R 76.9 100.0 53.2 20 0.1 21.7 27.3 39.2 29.1 44.57 2.1 21 0.0 17.1 28.0 19.4 57.1 38.15 2.2 22 0.2 14.0 27.3 28.5 49.6 34.34 2.1 23 1.3 36.8 34.5 44.4 22.7 59.33 2.0 24 6.7 33.3 30.3 54.4 18.4 36.92 2.0 25 3.6 24.5 35.1 41.6 26.3 32.45 2.2
26 U+R 17.2 55.8 42.8 44.7 35.7 13.14 2.5 26 U 4.9 49.8 38.3 26 R 99.6 95.6 73.1
27 U+R 6.2 59.1 41.0 44.2 33.7 15.34 2.5 27 U 2.7 56.4 39.1 27 R 44.3 87.8 62.7
28 U+R 26.3 39.3 35.6 65.9 5.6 104.6 2.5 28 U 20.0 30.0 31.0 28 R 64.1 94.1 63.2
Total 3.2 25.2 29.9 34.4 40.5 40.98 2.1
Source: own calculation on CSA data The global situation of the households testifies a somewhat varied urban morphology, considering old structured and unstructured areas, social and economic stratification (see also map 4.10). The beauty of Addis Ababa remains intact, as its political and cultural importance to the entire African continent remains intact. Due to overcrowding, shortage of housing units, schools, hospitals, etc., and the expected demographic increment, the government, the local authorities and the international community will be forced to face enormous challenges. 4.4. Prospects and Challenges for Urbanization in Ethiopia
During 1980-2000, according to estimates of the Population Division of the UN (1999), the Ethiopian population grew from 36.4 m to 62.6 m, at a rate of 2.71 a year on average (doubling time is 26 years). Population prospects predict that for the first two decades of this century, the annual increase could vary between 2.52 percent (medium variant; doubling time is 28 years) and 2.30 percent (low variant; doubling time is 30 years). The absolute increase could be, respectively be 40.3 m or 35.9 m. In 2020, after a twenty year period, total population might reach 103 m or 98 m, respectively

131
If these 36 to 40 m additional people remain with a low level of education or even, if
increased in comparison with current very low levels16 and confined to the traditional agriculture, it is very unlikely that available land can assure even the present so low living standards, unless a sustained rise in farm productivity is reached. To escape from the limitations of peasant agriculture (even considering the 1993 estimates arable land is only 12 percent of all Ethiopian land), there should be incentives to push poor farmers to make technical advances that are needed to reinforce the economy (Europa Publications Limited, 1998).
Moreover, since the agricultural sector is so central to the economy, both in terms of
employment and its share of GDP, improvements in the sector will inevitably lead to advances in the economy as a whole. Indeed, the Government has set an ambitious target, namely to double GDP per capita over the next 15 years. At the same time, the Government may support rural development through road construction, the provision of education, health facilities and in the funding and dissemination of agricultural research. Strengthening macro-economic stability and development must, of course, remain a first rank priority for the Government. But this may be complicated by the economic and political federalism. Research suggests that a federal state tends to be more costly than a unitary one and that this additional cost is exacerbated in poor countries.
As, desideratively, peasants prosper, one can expect a more or less huge fall, both in relative and in absolute terms, in the agricultural labor force. As a consequence, there will be expulsion of the labor force from the primary sector and of people from rural areas, a parallel strong increase in migration pressure both due to internal rural to urban and international migration. The labor force supply in all sectors but agriculture should very rapidly increase not only for demographic reasons and the modernization of agriculture, but also due to the rise of the education level, especially for women, and of the GDP per capita. But it is doubtful that the labor force demand in others sectors could grow at the same pace as supply. During the demographic transition and economic transformations, as already happened in almost all countries, these four factors should lead, other things being equal, to a very massive and huge increase of population’s propensity to move.
According to the most recent world urbanization prospects (Population Division,
2000), in the period 2000-2020, the Ethiopian urban population is expected to increase at an annual rate of 4.94 and in the period 2000-2015 Addis Ababa could grow at a rate 4.39 percent a year17. The whole picture of the estimated and expected trend of the past twenty years and the next is given in Table 4.18.
According to these current forecasts, one can distinguish some main challenges.
a) The rural population is expected to increase from 32.6 to 73.2 m in only forty years (1980 to 2020). Indeed, the annual change rate of the rural population in the next twenty year period might be about one third of the previous one, but the absolute increase could be about three million more, reaching almost 22 million. The problem is to accommodate
16 According to the Human Development Report 2000, the adult illiteracy rate among people aged 15 and over in 1998 was 63.7 percent (57.9 for males and 69.5 for females). 17 For the urban agglomerations the UN prospects arrive just to 2015.
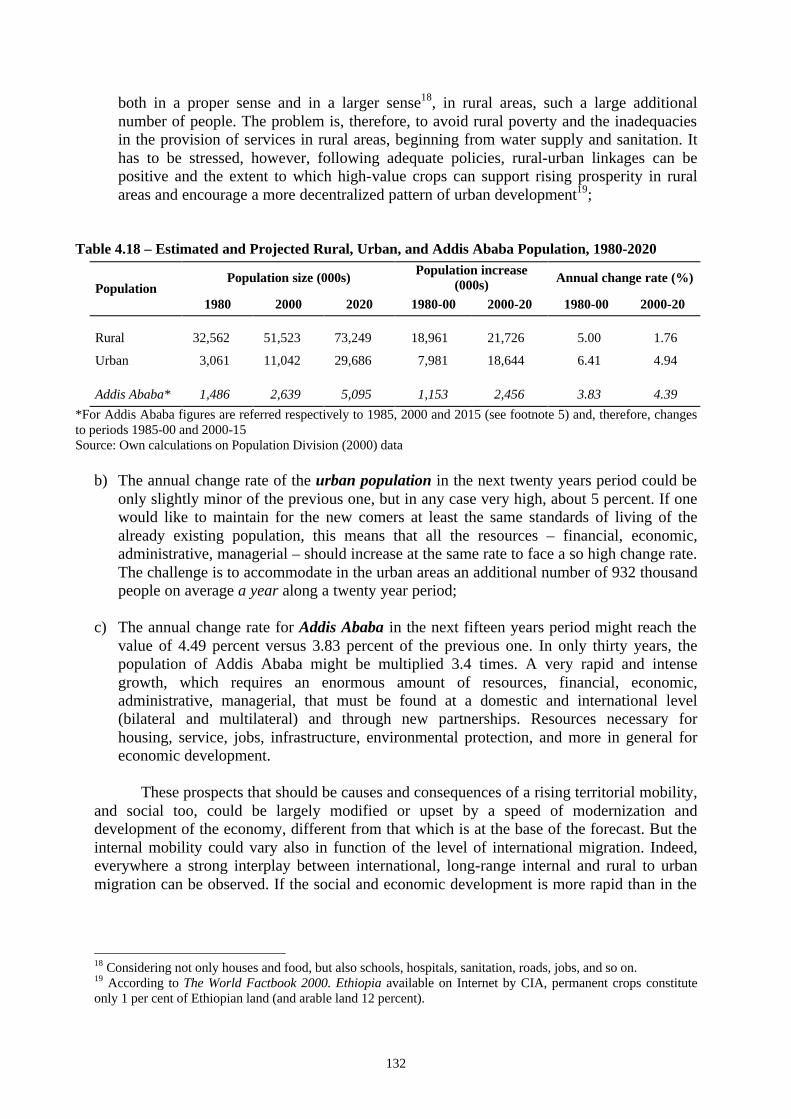
132
both in a proper sense and in a larger sense18, in rural areas, such a large additional number of people. The problem is, therefore, to avoid rural poverty and the inadequacies in the provision of services in rural areas, beginning from water supply and sanitation. It has to be stressed, however, following adequate policies, rural-urban linkages can be positive and the extent to which high-value crops can support rising prosperity in rural areas and encourage a more decentralized pattern of urban development19;
Table 4.18 – Estimated and Projected Rural, Urban, and Addis Ababa Population, 1980-2020
Population size (000s) Population increase (000s) Annual change rate (%)
Population 1980 2000 2020 1980-00 2000-20 1980-00 2000-20
Rural 32,562 51,523 73,249 18,961 21,726 5.00 1.76
Urban 3,061 11,042 29,686 7,981 18,644 6.41 4.94
Addis Ababa* 1,486 2,639 5,095 1,153 2,456 3.83 4.39
*For Addis Ababa figures are referred respectively to 1985, 2000 and 2015 (see footnote 5) and, therefore, changes to periods 1985-00 and 2000-15 Source: Own calculations on Population Division (2000) data
b) The annual change rate of the urban population in the next twenty years period could be only slightly minor of the previous one, but in any case very high, about 5 percent. If one would like to maintain for the new comers at least the same standards of living of the already existing population, this means that all the resources – financial, economic, administrative, managerial – should increase at the same rate to face a so high change rate. The challenge is to accommodate in the urban areas an additional number of 932 thousand people on average a year along a twenty year period;
c) The annual change rate for Addis Ababa in the next fifteen years period might reach the
value of 4.49 percent versus 3.83 percent of the previous one. In only thirty years, the population of Addis Ababa might be multiplied 3.4 times. A very rapid and intense growth, which requires an enormous amount of resources, financial, economic, administrative, managerial, that must be found at a domestic and international level (bilateral and multilateral) and through new partnerships. Resources necessary for housing, service, jobs, infrastructure, environmental protection, and more in general for economic development.
These prospects that should be causes and consequences of a rising territorial mobility,
and social too, could be largely modified or upset by a speed of modernization and development of the economy, different from that which is at the base of the forecast. But the internal mobility could vary also in function of the level of international migration. Indeed, everywhere a strong interplay between international, long-range internal and rural to urban migration can be observed. If the social and economic development is more rapid than in the
18 Considering not only houses and food, but also schools, hospitals, sanitation, roads, jobs, and so on. 19 According to The World Factbook 2000. Ethiopia available on Internet by CIA, permanent crops constitute only 1 per cent of Ethiopian land (and arable land 12 percent).

133
past, it seems plausible to imagine more massive population international movements such as that prospected by Population Division20.
In all cases, and taking into account all possible factors that are at the base of
population movements and urbanization, for the period 2000-2020, one can imagine for the Ethiopian population, a mobility and an urbanization process much greater than in 1980-2000. The Ethiopian further urbanization can actually contribute to the nation’s wealth, even by enriching the domestic market and its international trade. Moreover, cities can provide better services because they benefit from the economies of scale. In reaching large number of people, metropolitan centers and medium size cities have the possibility to reduce energy costs, offer more efficient transportation systems, provide better educational and health services at lower unit costs and construct more habitable space (Habitat, 1996). But if actually the unit costs for all urban infrastructure and services can be reduced by economies of scale, the total cost of them is increasing with the total amount of the increase of urban population. If urban population in Ethiopia should really grow, as predicted, at a rate of 5 percent a year along a twenty years period (and over) it is hard to imagine that the necessary resources can grow at the same rate, they can be found only domestically and slums and consequent poverty, inequality, and discrimination can be avoided.
Recent wars have forced the Government to spend resources on the military and to
scale back development plans. Moreover, in recent years, foreign investments have declined significantly. Estimate of the total GDP for 1999 (purchasing power parity) is $33.3 billion. The GDP per capita is $56021. According to the Human Development Report 2000, for Human development index, Ethiopia is ranked 171 out of 174 countries. Looking only to domestic resources, there appear to be few possibilities for a real and significant economic and human development. For Ethiopia, as well as all least developed countries, what seems to be necessary is a strong and multiway international cooperation based on foreign investments in the country, foreign aid specially devoted to health and education, liberalization of trade and major importation of Ethiopian products at reasonable prices.
20 In the period 2000-2020 the medium variant projection of the UN forecasts an average annual increase of 2,049 thousands people and a net emigration per year of 30 thousands (Population Division, 1999). 21 For 1998 the GDP per capita is estimated $574. As comparison: Eritrea $833, Kenya $980.
Related Documents


