Urbanization and farm size in Asia and Africa: Implications for food security and agricultural research $ William A. Masters a,n , with Agnes Andersson Djurfeldt b , Cornelis De Haan c , Peter Hazell d , Thomas Jayne e , Magnus Jirström b , Thomas Reardon e a Department of Food and Nutrition Policy, Tufts University, Friedman School of Nutrition Science and Policy,150 Harrison Ave., Boston, MA 02111, USA b Department of Human Geography, Lund University, Sweden c Independent Consultant, The Netherlands d Centre for Development, Environment and Policy, School of Oriental and African Studies, University of London, UK e Department of Agricultural, Food and Resource Economics, Michigan State University, USA article info Article history: Received 27 May 2013 Accepted 2 July 2013 Keywords: Demographic transition Structural change Agricultural transformation Rural development abstract Urbanization and economic development have made global agriculture increasingly differentiated. Many hinterland farms remain largely self-sufficient, while farms closer to markets become increasingly specialized and linked to agribusinesses. Both semi-subsistence and commercialized farms remain family operations, with the few successful investor-owned farms found mainly for livestock and crops processed on site such as sugar, tea and oil palm. Meanwhile, demographic transition drives rapid change in farm sizes, with less land available per family until non-farm opportunities expand enough to absorb all new workers. Asia as a whole has now passed this turning point so its average farm sizes can rise, while in Africa average farm sizes will continue to fall for many years, posing special challenges in both hinterland and commercialized areas. & 2013 Elsevier B.V. All rights reserved. 1. Introduction and motivation This study is a synthesis of evidence assembled for the Con- sultative Group on International Agricultural Research (CGIAR), in a foresight workshop on “Trends in Urbanization and Farm Size in Sub-Saharan Africa and South Asia: Implications for Agricultural Research”, held 25–26 January 2013 at Tufts University in Boston, USA. The synthesis was written by the first author, through a consultative process commissioned by the Independent Science and Partnership Council (ISPC) of the CGIAR, using five background papers presented and discussed at the foresight workshop. This article thus reflects the contributions of all workshop participants, which included 25 experts on various aspects of agricultural development from both the social and biophysical sciences. By design, the foresight workshop aimed to elicit a wide range of views, which we seek to reconcile here. This synthesis paper is neither a summary of workshop proceedings, nor independent work. Instead, the synthesis is based entirely on data and concepts presented at the workshop and discussed afterwards, reconciling the participants' diverse views into a single narrative. The resulting synthesis is based entirely on workshop documents and discussion, but does not replace the five background papers each of which is available separately on the ISPC website. 1 Paper authors and work- shop participants were deliberately selected to bring in diverse and often conflicting perspectives. This document does not repeat those divergent arguments, but provides an original synthesis from the first author's point of view. 2. Urbanization and rural population growth Average farm sizes, in the sense of total land area per farmer, are ultimately dictated by a region's farm population. Total land area available for agriculture changes relatively little from year to year, and in developing countries most rural people are farming, so trend changes in average farm size are ultimately driven by changes in total population net of migration to towns and cities. Contents lists available at ScienceDirect journal homepage: www.elsevier.com/locate/gfs Global Food Security 2211-9124/$- see front matter & 2013 Elsevier B.V. All rights reserved. http://dx.doi.org/10.1016/j.gfs.2013.07.002 ☆ The paper was written by the lead author, based on background papers by the other authors listed above, and contributions from foresight workshop participants Awudu Abdulai, Deborah Balk, Derek Byerlee, Cheryl Doss, Ken Giller, Margaret McMillan, Clare Narrod, Gerald Nelson, Kei Otsuka, Carl Pray, Agnes Quisumbing, Bharat Ramaswami, Anita Regmi, Steve Staal, and Steve Wiggins. Many thanks are also due to Kenneth Cassman, Doug Gollin and Tim Kelley for guidance and suggestions from the ISPC, and to Dana Goldman and Nadira Saleh for assistance during the foresight workshop. A draft version of this synthesis was presented at the 7th meeting of the Independent Science and Partnership Council (ISPC) of the CGIAR on 25–27 March 2013 in Cali, Colombia. n Corresponding author. Tel.: þ1 6176363751; fax: þ1 6176363781. E-mail address: [email protected] (W.A. Masters). URL: http://sites.tufts.edu/willmasters (W.A. Masters). 1 All background papers and project details are available at www.sciencecoun cil.cgiar.org/sections/strategy-trends. Please cite this article as: Masters, W.A., et al., Urbanization and farm size in Asia and Africa: Implications for food security and agricultural research. Global Food Security (2013), http://dx.doi.org/10.1016/j.gfs.2013.07.002i Global Food Security ] (]]]]) ]]]–]]]

Welcome message from author
This document is posted to help you gain knowledge. Please leave a comment to let me know what you think about it! Share it to your friends and learn new things together.
Transcript

Urbanization and farm size in Asia and Africa: Implications for foodsecurity and agricultural research$
William A. Masters a,n, with Agnes Andersson Djurfeldt b, Cornelis De Haan c, Peter Hazell d,Thomas Jayne e, Magnus Jirströmb, Thomas Reardon e
a Department of Food and Nutrition Policy, Tufts University, Friedman School of Nutrition Science and Policy, 150 Harrison Ave., Boston, MA 02111, USAb Department of Human Geography, Lund University, Swedenc Independent Consultant, The Netherlandsd Centre for Development, Environment and Policy, School of Oriental and African Studies, University of London, UKe Department of Agricultural, Food and Resource Economics, Michigan State University, USA
a r t i c l e i n f o
Article history:Received 27 May 2013Accepted 2 July 2013
Keywords:Demographic transitionStructural changeAgricultural transformationRural development
a b s t r a c t
Urbanization and economic development have made global agriculture increasingly differentiated. Manyhinterland farms remain largely self-sufficient, while farms closer to markets become increasinglyspecialized and linked to agribusinesses. Both semi-subsistence and commercialized farms remain familyoperations, with the few successful investor-owned farms found mainly for livestock and crops processedon site such as sugar, tea and oil palm. Meanwhile, demographic transition drives rapid change in farmsizes, with less land available per family until non-farm opportunities expand enough to absorb all newworkers. Asia as a whole has now passed this turning point so its average farm sizes can rise, while inAfrica average farm sizes will continue to fall for many years, posing special challenges in both hinterlandand commercialized areas.
& 2013 Elsevier B.V. All rights reserved.
1. Introduction and motivation
This study is a synthesis of evidence assembled for the Con-sultative Group on International Agricultural Research (CGIAR), ina foresight workshop on “Trends in Urbanization and Farm Size inSub-Saharan Africa and South Asia: Implications for AgriculturalResearch”, held 25–26 January 2013 at Tufts University in Boston,USA. The synthesis was written by the first author, through aconsultative process commissioned by the Independent Scienceand Partnership Council (ISPC) of the CGIAR, using five backgroundpapers presented and discussed at the foresight workshop. Thisarticle thus reflects the contributions of all workshop participants,which included 25 experts on various aspects of agriculturaldevelopment from both the social and biophysical sciences.
By design, the foresight workshop aimed to elicit a wide range ofviews, which we seek to reconcile here. This synthesis paper isneither a summary of workshop proceedings, nor independentwork. Instead, the synthesis is based entirely on data and conceptspresented at the workshop and discussed afterwards, reconcilingthe participants' diverse views into a single narrative. The resultingsynthesis is based entirely on workshop documents and discussion,but does not replace the five background papers each of which isavailable separately on the ISPC website.1 Paper authors and work-shop participants were deliberately selected to bring in diverse andoften conflicting perspectives. This document does not repeat thosedivergent arguments, but provides an original synthesis from thefirst author's point of view.
2. Urbanization and rural population growth
Average farm sizes, in the sense of total land area per farmer,are ultimately dictated by a region's farm population. Total landarea available for agriculture changes relatively little from year toyear, and in developing countries most rural people are farming,so trend changes in average farm size are ultimately driven bychanges in total population net of migration to towns and cities.
Contents lists available at ScienceDirect
journal homepage: www.elsevier.com/locate/gfs
Global Food Security
2211-9124/$ - see front matter & 2013 Elsevier B.V. All rights reserved.http://dx.doi.org/10.1016/j.gfs.2013.07.002
☆The paper was written by the lead author, based on background papers by theother authors listed above, and contributions from foresight workshop participantsAwudu Abdulai, Deborah Balk, Derek Byerlee, Cheryl Doss, Ken Giller, MargaretMcMillan, Clare Narrod, Gerald Nelson, Kei Otsuka, Carl Pray, Agnes Quisumbing,Bharat Ramaswami, Anita Regmi, Steve Staal, and Steve Wiggins. Many thanks arealso due to Kenneth Cassman, Doug Gollin and Tim Kelley for guidance andsuggestions from the ISPC, and to Dana Goldman and Nadira Saleh for assistanceduring the foresight workshop. A draft version of this synthesis was presented atthe 7th meeting of the Independent Science and Partnership Council (ISPC) of theCGIAR on 25–27 March 2013 in Cali, Colombia.
n Corresponding author. Tel.: þ1 6176363751; fax: þ1 6176363781.E-mail address: [email protected] (W.A. Masters).URL: http://sites.tufts.edu/willmasters (W.A. Masters).
1 All background papers and project details are available at www.sciencecouncil.cgiar.org/sections/strategy-trends.
Please cite this article as: Masters, W.A., et al., Urbanization and farm size in Asia and Africa: Implications for food security andagricultural research. Global Food Security (2013), http://dx.doi.org/10.1016/j.gfs.2013.07.002i
Global Food Security ] (]]]]) ]]]–]]]

Aggregate trends in the rural and urban population for Africa andAsia over the foresight study period are shown in Table 1.
Our focus is on the results shown above in bold, indicatingcontinued high rates of growth in the rural population of Africa,with a decline in the rural population of Asia. These same data areused to illustrate year-to-year changes rural as opposed to urbanpopulations in Fig. 1 of Jayne's background paper.
The UN urbanization estimates shown in Table 1 and Fig. 1 havebeen subject to great scrutiny by demographers such as work-shop participant Balk (2013), often using geographic techniques asdescribed in the background paper by Djurfeldt and Jirström (2013).Both Hazell and Jayne recognize that the way these estimates wereconstructed severely limits how they should be interpreted. Inparticular, the UN data are derived from national censuses in whichthe definition of “urban” or “rural” residence varies widely, so thedensities cannot readily be compared across countries. There may alsobe systematic differences across continents in statistical procedures. Asnoted by Deborah Balk and by Andersson Djurfeldt and Jirström,taking account of increasingly accurate remote-sensing and geocodedsurvey data to count seasonal migrants, slum dwellers and theresidents of smaller secondary towns and cities, it appears likely thatAfrica is actually more rural and less urbanized, relative to Asia, thanthese data suggest. In addition, Deborah Balk's workshop commentsexplained how these estimates rely on linear projections betweencensus years, rather than structural demographic models. Takingaccount of gender and age-specific fertility, mortality and migrationrates, it is likely that Africa's rural populations have actually grownmore rapidly over time, relative to Asia's, than these data suggest.
Other data sources are not sufficiently comprehensive toreplace the UN data shown in Table 1 and Fig. 1, but they do
indicate that these estimates are likely to be a conservative lowerbound on the actual Asia–Africa differences in rural populationgrowth and hence average farm sizes. Clearly, during the first threeor four decades of CGIAR activity, both Africa and Asia experienceda gradual decline in the total land available per rural worker. Thereis great diversity within each continent, but long-term trends weredriving the average farmer in both Africa and Asia to apply morelabor on existing land, increasing the payoff from the developmentand adoption of labor-using, land-saving techniques such as newseeds and agronomic techniques. African farmers experiencedmuch steeper declines in land per worker than Asian farmers,making year-to-year production growth per worker harder forthem. Africa's distinctive demographic transition also involvedmuch larger increase in child dependency ratios. Gender differ-ences in responsibilities for both food supply and child care madethese trends impose a particular burden on women, worsening thecost of unequal access to resources and market opportunities.
Looking ahead, the shaded area in Fig. 1 shows that ruralpopulation has reached its peak in Asia, but will continue to risefor several more decades in Africa. Some of this change is due todemographic structure, notably the rapid aging of Asia's ruralpopulations relative to Africa's, and some of it is due to netmigration. Local conditions across and within countries influencethe exact timing of this turning point in rural population density,but the average Asian farm size already has or will soon begin torise, as some rural households cultivate land released by neighborswhose workers have stopped farming. This rise in total land andother rural resources available per farmer, combined with theincreased number and proximity of urban consumers, farm inputsuppliers and product marketing firms, ensures that the averagefarm size in Asian agriculture already or will soon involveincreased output per farm and the kind of commercial dynamismdescribed in detail by Reardon (2013) in his background paper,even as the average African farm size faces several more decadesof worsening land scarcity as described by Thom Jayne.
Farm size trends at any given location may vary around thecontinent-wide trend, and that trend itself may not be preciselyknown, but the general direction of demographic change remainsamong the most predictable forces driving farmers' choice oftechnique and hence the agricultural research priorities of CGIARcenters and other public or private-sector organizations pursuingagricultural innovation. Across Asia, an increasing share of farmhouseholds have already or will soon experience an end to farm-size decline and begin to acquire larger areas, making it newlyattractive for them to adopt land-using, labor-saving techniqueswith additional equipment and more capital per worker. Incontrast, most of Africa will continue to experience falling averagefarm sizes for several more decades.
The predictability of these trends arises from demographicmomentum and the persistence of age-specific mortality, fertility
Table 1Trends in rural and urban populations, 1970–2050, Africa and Asia.Source: Hazell, 2013, from UN data.
Population (millions) Average annual rate of change (%)
1970 2011 2030 2050 1970–2011 2011–2030 2030–2050
Total populationAfrica 368 1046 1562 2192 2.55 2.11 1.69Asia 2135 4207 4868 5142 1.65 0.77 0.27
Urban populationAfrica 87 414 744 1265 3.82 3.09 2.65Asia 506 1895 2703 3310 3.22 1.87 1.01
Rural populationAfrica 282 632 818 927 1.97 1.35 0.63Asia 1629 2312 2165 1833 0.85 �0.35 �0.83
Fig. 1. Changes in rural, urban and total populations, 1950–2050.Source: Adapted from Jayne, 2013 using data from United Nations (2012), World Urbanization Prospects: The 2011 Revision, online at http://esa.un.org/unup.
W.A. Masters et al. / Global Food Security ] (]]]]) ]]]–]]]2
Please cite this article as: Masters, W.A., et al., Urbanization and farm size in Asia and Africa: Implications for food security andagricultural research. Global Food Security (2013), http://dx.doi.org/10.1016/j.gfs.2013.07.002i
and migration rates, combined with economic constraints on thegrowth rate of urban employment. As shown in the background paperby Djurfeldt and Jirström (2013), Annex Tables A1 and A2, povertyrates are almost universally higher in rural than in urban areas.The gap in average incomes and living standards is typically largerin poorer countries, and drives a steady flow of net migration fromrural areas into towns and cities. For any given worker, migration isrisky and often seasonal, so net migration rates are smaller than grossflows which include seasonal and circular movements betweenvarious rural and urban locations. Migration itself is costly and urbanopportunities are often highly gendered and age-specific, requiringparticular levels of human, social and financial capital. For all thesereasons, the rural-urban income gap tends to narrow over time but itis not eliminated until countries reach very high levels of income.
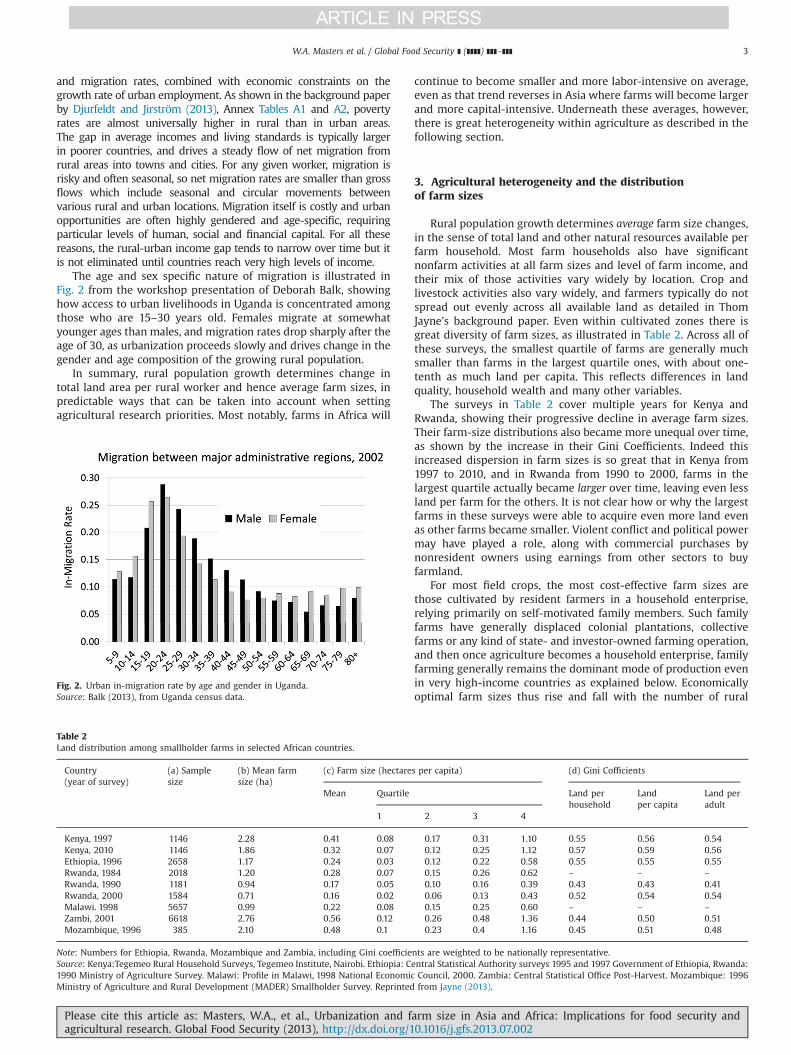
The age and sex specific nature of migration is illustrated inFig. 2 from the workshop presentation of Deborah Balk, showinghow access to urban livelihoods in Uganda is concentrated amongthose who are 15–30 years old. Females migrate at somewhatyounger ages than males, and migration rates drop sharply after theage of 30, as urbanization proceeds slowly and drives change in thegender and age composition of the growing rural population.
In summary, rural population growth determines change intotal land area per rural worker and hence average farm sizes, inpredictable ways that can be taken into account when settingagricultural research priorities. Most notably, farms in Africa will
continue to become smaller and more labor-intensive on average,even as that trend reverses in Asia where farms will become largerand more capital-intensive. Underneath these averages, however,there is great heterogeneity within agriculture as described in thefollowing section.
3. Agricultural heterogeneity and the distributionof farm sizes
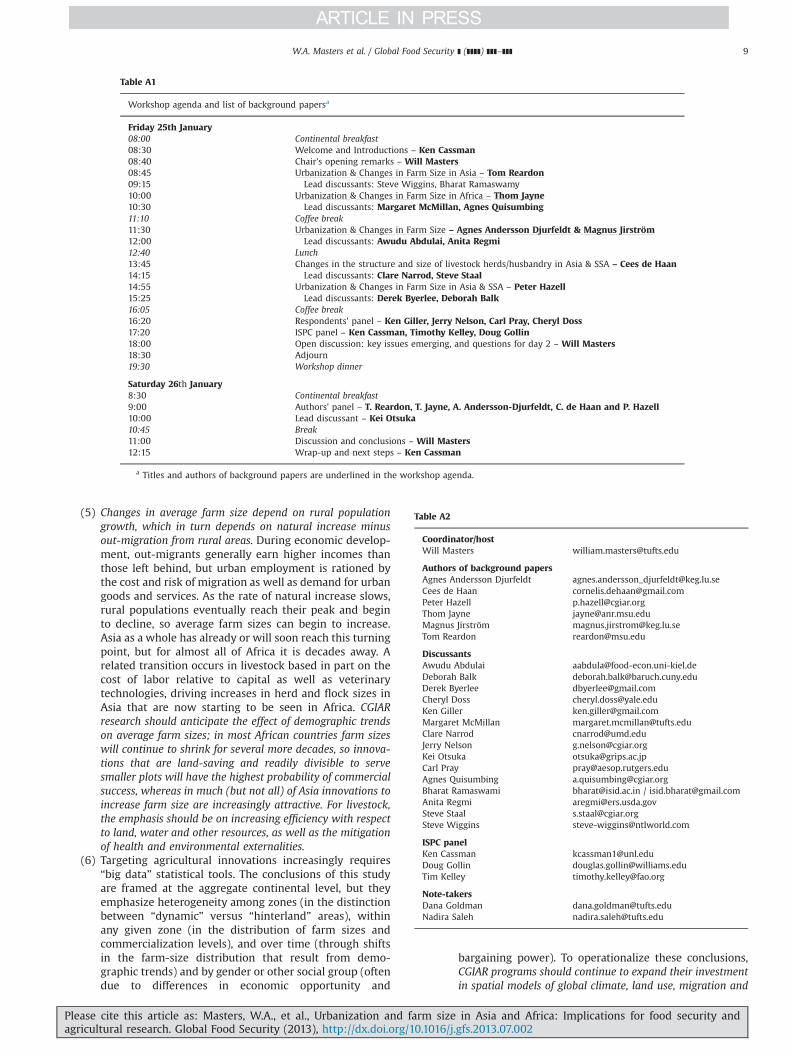
Rural population growth determines average farm size changes,in the sense of total land and other natural resources available perfarm household. Most farm households also have significantnonfarm activities at all farm sizes and level of farm income, andtheir mix of those activities vary widely by location. Crop andlivestock activities also vary widely, and farmers typically do notspread out evenly across all available land as detailed in ThomJayne's background paper. Even within cultivated zones there isgreat diversity of farm sizes, as illustrated in Table 2. Across all ofthese surveys, the smallest quartile of farms are generally muchsmaller than farms in the largest quartile ones, with about one-tenth as much land per capita. This reflects differences in landquality, household wealth and many other variables.
The surveys in Table 2 cover multiple years for Kenya andRwanda, showing their progressive decline in average farm sizes.Their farm-size distributions also became more unequal over time,as shown by the increase in their Gini Coefficients. Indeed thisincreased dispersion in farm sizes is so great that in Kenya from1997 to 2010, and in Rwanda from 1990 to 2000, farms in thelargest quartile actually became larger over time, leaving even lessland per farm for the others. It is not clear how or why the largestfarms in these surveys were able to acquire even more land evenas other farms became smaller. Violent conflict and political powermay have played a role, along with commercial purchases bynonresident owners using earnings from other sectors to buyfarmland.
For most field crops, the most cost-effective farm sizes arethose cultivated by resident farmers in a household enterprise,relying primarily on self-motivated family members. Such familyfarms have generally displaced colonial plantations, collectivefarms or any kind of state- and investor-owned farming operation,and then once agriculture becomes a household enterprise, familyfarming generally remains the dominant mode of production evenin very high-income countries as explained below. Economicallyoptimal farm sizes thus rise and fall with the number of rural
Fig. 2. Urban in-migration rate by age and gender in Uganda.Source: Balk (2013), from Uganda census data.
Table 2Land distribution among smallholder farms in selected African countries.
Country(year of survey)
(a) Samplesize
(b) Mean farmsize (ha)
(c) Farm size (hectares per capita) (d) Gini Cofficients
Mean Quartile Land perhousehold
Landper capita
Land peradult
1 2 3 4
Kenya, 1997 1146 2.28 0.41 0.08 0.17 0.31 1.10 0.55 0.56 0.54Kenya, 2010 1146 1.86 0.32 0.07 0.12 0.25 1.12 0.57 0.59 0.56Ethiopia, 1996 2658 1.17 0.24 0.03 0.12 0.22 0.58 0.55 0.55 0.55Rwanda, 1984 2018 1.20 0.28 0.07 0.15 0.26 0.62 – – –
Rwanda, 1990 1181 0.94 0.17 0.05 0.10 0.16 0.39 0.43 0.43 0.41Rwanda, 2000 1584 0.71 0.16 0.02 0.06 0.13 0.43 0.52 0.54 0.54Malawi. 1998 5657 0.99 0.22 0.08 0.15 0.25 0.60 – – –
Zambi, 2001 6618 2.76 0.56 0.12 0.26 0.48 1.36 0.44 0.50 0.51Mozambique, 1996 385 2.10 0.48 0.1 0.23 0.4 1.16 0.45 0.51 0.48
Note: Numbers for Ethiopia, Rwanda, Mozambique and Zambia, including Gini coefficients are weighted to be nationally representative.Source: Kenya:Tegemeo Rural Household Surveys, Tegemeo Institute, Nairobi. Ethiopia: Central Statistical Authority surveys 1995 and 1997 Government of Ethiopia, Rwanda:1990 Ministry of Agriculture Survey. Malawi: Profile in Malawi, 1998 National Economic Council, 2000. Zambia: Central Statistical Office Post-Harvest. Mozambique: 1996Ministry of Agriculture and Rural Development (MADER) Smallholder Survey. Reprinted from Jayne (2013).
W.A. Masters et al. / Global Food Security ] (]]]]) ]]]–]]] 3
Please cite this article as: Masters, W.A., et al., Urbanization and farm size in Asia and Africa: Implications for food security andagricultural research. Global Food Security (2013), http://dx.doi.org/10.1016/j.gfs.2013.07.002i

households relative to land area, implying that optimal farm sizesacross Africa will continue to fall for several more decades untilagricultural population density reaches its peak. Only whenagricultural population density begins to decline will optimal farmsize will turn upward as it has in other regions with earlierdemographic transitions.
The dominance of family farming, and hence the link betweenrural population density and optimal farm size, is driven by thedifficulty of supervision and offsite management for many fieldcrop operations such as planting, fertilizing, irrigation or drainageand pest or weed control. Whether such tasks are done correctly isoften unobservable, because they require location-specificresponse to changes in natural conditions that intervene toinfluence the harvest. Self-motivated family members thereforedo these tasks more effectively at lower cost. Family enterprisescontinue to dominate crop production as incomes rise, even in theUS, Australia or Japan, with farm sizes varying in proportion toland productivity and other factors.
Farms with many nonfamily workers typically arise mainly insettings with state-restricted labor and land rights, such asserfdom and slavery, or colonialism, socialism and state capitalism.Such systems have often built up large farms, often using sub-sidized capital as well as restricted land and labor. Almost all ofthese have been broken up in recent decades, and been replacedby more efficient family enterprises as soon as labor is freed tomove onto their own purchased, rented or sharecropped land. Themajor exceptions are crops that must be processed on the farm orin close coordination with the harvest, notably tea, sugar and oilpalm, or crops that are produced under highly uniform, controlledconditions such as flowers and high-value vegetables, or manylivestock operations. In these cases, scale economies in machineryand buildings and marketing or processing activities are sufficientto outweigh any costs of labor supervision, resulting in efficienciesat larger farm sizes.
For most field crops, the difficulty of supervising nonfamilyworkers ensures that the most efficient, least-cost farm size is thatwhich suits a family enterprise, and hence moves in line with ruralpopulation densities. For livestock, as detailed in Cees de Haan'sbackground paper, the situation is very different: herd and flocksizes are influenced not by rural land/labor ratios as much as bywage rates relative to the capital costs of animal ownership, soherd sizes have risen sharply in Asia and are already rising inAfrica despite the decline in farm sizes for Africa's field crops. Thedifference between most field crops and most livestock arises inpart because supervision of hired labor is relatively easier foranimal care, particularly those raised under controlled conditionssuch as pigs and poultry; dairy remains the major livestock sectorwhere size of operation is typically tied to the scale of a familyenterprise.
Future technologies could change the economics of farm size.At the technology frontier in the U.S., Australia, Brazil and else-where, software and hardware is being introduced in an effort toreplace farmers' real-time judgments and make it possible forinvestor-owned farms using hired managers to compete withfamily operations. Key elements of field crop automation includeGPS units on auto-steer tractors, using soil sensor data to controlvariable-rate input applicators. Laser-leveling and other invest-ments can make the environment more uniform, but farmers stillneed to make adjustments on the fly in response to real-timeweather. The profitability of precision agriculture is thereforedependent not only on the cost of capital relative to labor, butalso on the quality of the algorithm that adjusts input use inresponse to changing conditions. Even if these automated fieldoperations are commercialized successfully in some settings,therefore, the willingness and ability of self-motivated farmersto adapt themselves and learn quickly how to farm elsewhere
ensures that much of agriculture will remain dominated by familyenterprises – including particularly in Africa.
Ken Giller's workshop discussion provided an agronomic per-spective on the challenges brought by falling farm sizes in theAfrican setting, particularly for the most resource-poor farmhouseholds. He used a stylized distribution shown by the solidline in Fig. 3 to explain how the smallest farms, whether measuredin terms of land, livestock or other resources, often cluster near thelower bound of survival. The modal farm will be somewhat abovethat minimum size, while a small number of larger farms enjoymuch bigger resource endowments. With the important exceptionof crops that offer scale economies from on-farm processing, eventhe large farms remain family enterprises. As shown by thecomparison of columns (b) and (c) in Table 2 above, they average4–6 family members per farm, irrespective of cropped area acrosscountries. As these farms' land area shrinks, research must focuson increasingly labor-intensive, yield-increasing methods foragroecological management of their crops and livestock.
The changes over time in quartile averages and Gini Coeffi-cients shown in Table 2 can be illustrated in Fig. 3 by a changefrom the solid to the dashed distribution. The dashed curve iswider at both tails, as the many small farms have shrunk even asthe few large farms grow. An extreme version of this story hasoccurred in Zambia and elsewhere in recent decades, with primeland along transport routes being ceded to a few very large farmssimilar to those developed during the colonial era in Zimbabwe,South Africa and other countries with latifundia-type agriculture.These farms use capital-intensive irrigation and machinery, muchof which is operated by hired managers and farm workers, even asmost Zambian farm households cultivate smaller and smaller areasin the agricultural hinterland.
In situations where the largest farms acquire their land forreasons other than economically efficient production, they typi-cally incur higher total costs per unit of output than the modalfarms due to greater capital requirements and the difficulty ofsupervising hired labor. It may be difficult to distinguish suchinefficiencies from economically efficient changes in farm size,since heterogeneity among farm households typically gives rise tovariation in access to resources and market opportunities, espe-cially in dynamic zones with increased commercialization. Hetero-geneity among firms in their growth rates is typical of economicactivity. What is distinctive about agriculture is only that the totalarea of land available is fixed, and each farm is typically a familyenterprise using agriculture as a residual employer alongsidenonfarm opportunities. As a result, when large farms grow forwhatever reason, those displaced who cannot find work in othersectors remain in agriculture, further reducing the sizes of thesmallest farms. Any increase in the number of very large farms isoften accompanied by an increase in the number of very smallfarms, and it is entirely possible for a country's average farm sizeto rise while the modal or median farm size shrinks, or vice-versa.
When farm-size distribution changes as illustrated in Fig. 3, theexpansion of large farms uses land that would otherwise beavailable for small farms and the most resource-poor households
Number of farms
Resource endowment per farm
Fig. 3. Stylized distributions of farm size.Source: Adapted from Giller (2013).
W.A. Masters et al. / Global Food Security ] (]]]]) ]]]–]]]4
Please cite this article as: Masters, W.A., et al., Urbanization and farm size in Asia and Africa: Implications for food security andagricultural research. Global Food Security (2013), http://dx.doi.org/10.1016/j.gfs.2013.07.002i

with the least access to nonfarm employment may find their farmsbecoming inefficiently small. Productivity of the smallest farmsmay be particularly low when farm sizes have declined too fast foragricultural techniques to adapt (perhaps due to recent demo-graphic change), or small farms have become increasingly femin-ized (perhaps due to differential migration), with high childdependency (as in much of Africa) or a rapidly aging workforce(as in much of Asia), or the households face violence or sociallyexclusion (often for reasons of caste or ethnicity); all of thesesocioeconomic changes can compound the agroecological chal-lenges of soil degradation, water depletion, climate change andother biological constraints that are likely to be especially severein the disadvantaged regions that are least likely to attract privateinvestment for farm-size expansion.
In summary, demographic and other changes have altered bothaverage farm sizes and their distribution. To inform agriculturalresearch by the CGIAR and other organizations, our principalforecast is that Africa's most resource-poor farmers will becomeeven more impoverished, unless they are equipped with new seedvarieties and agronomic techniques adapted to their newly con-strained circumstances, as well as policies and institutions thatpromote economic inclusion and market access. At the other endof the farm size distribution, the largest farms in Africa maybecome even larger, but their growth comes at the expense ofsmaller farms with the potential for inefficiency as well as inequityat both ends of the farm-size distribution. Only where migrantscan settle previously uncultivated lands or some kind of machin-ery provides sufficient scale economies to justify labor supervisioncan African farm sizes grow in an economically efficient manner,whereas for much of Asia average farm sizes have already begun toexpand in keeping with that region's falling rural populationdensity.
4. Agricultural commercialization and input use in “dynamic”and “hinterland” zones
The trends in farm size described in the previous section aredriven by long-term demographic changes in land-to-labor ratios,with important implications for the kinds of innovation thatfarmers are seeking. Urbanization and economic development alsobrings a very different set of changes to the farm, through demandfor farm outputs and opportunities for increased commercializa-tion and input use. As dynamism spreads to previously hinterlandareas, even a shrinking farm can become increasingly commercia-lized. This often involves specialized capital investment, for examplewhen developing a zero-grazing dairy, a fruit orchard or a vegetablegarden, but can also occur for staple food production. The workshopcomments of Pray (2013) described how input supply firms combineinnovations from public sources such as the CGIAR with their owninnovations to produce locally adapted techniques.
Tom Reardon's background paper describes in detail how thisworks in the dynamic agricultural zones of Asia, where fallingtransaction costs and increased capital availability per workerhave led to a remarkable “quiet revolution” in food supply chainswithin rural areas and from there to urban consumers. Heestimates that half to two-thirds of Asia's food production isalready fully commercialized, in the sense of being produced forintermediaries serving urban consumers. This has major implica-tions for agricultural technologies, as it facilitates a sharp increasein the use of purchased inputs and specialized capital oftenprovided by small, local agribusinesses. Many activities previouslydone by family members on the farm are increasingly purchasedfrom others, including contract providers of custom services suchas land preparation or harvesting and threshing. The transforma-tion also changes market institutions. For example, Reardon
documents the rise of competing cold stores that buy potatoesfor urban markets in India, Bangladesh and China. These havebroken historical monopolies, improved farmers' terms of trade,and created a competitive market for inputs and farm credit aswell. Meanwhile, in the “hinterland” areas with high transactioncosts, access to land, credit, inputs and product markets mayremain interlinked and subject to a wide variety of market failures.
Dynamic zones of increased commercialization arise aroundAfrican towns and cities, along their main transport and commu-nications routes. But the magnitude of transformation is muchsmaller, as most African farm households are still operated assemi-subsistence operations, often as net buyers of crops that theyalso grow themselves. Table 3 below from Jayne (2013) illustratesthe degree of commercialization observed for maize in East andSouthern Africa.
Table 3 suggests that in these four countries, the most com-mercialized maize sellers are the largest farms. This need not bethe case for all crops, to the extent that agricultural researchsuccessfully develops intensification techniques suited to Africanfarmers' growing conditions and shrinking farm sizes. To theextent that these innovations serve urban consumers for high-value and differentiated products, their adoption domain may belimited to dynamic zones with low cost of transport to towns and
Table 3Net maize sales by farm size in Kenya, Malawi, Mozambique and Zambia.Source: Adapted from Jayne (2013).
Country % ofSample
Net maizesales/adultequivalent(kg)
Farmsize(ha)
Value ofhouseholdassets (USdollars)
Total householdincome/adultequivalent (USdollars)
Kenya (2010)Largesellers
26.9 668 3.7 4032 984
Smallsellers
11.5 57 1.9 2491 488
Occasionalbuyers
37.3 �5 1.8 2912 494
Consistentbuyers
24.3 �64 1.4 1801 471
Malawi (2007)Largesellers
2.2 542 2.0 1915 258
Smallsellers
4.7 50 1.8 298 75
Occasionalbuyers
48.2 �4 1.4 248 60
Consistentbuyers
44.9 �93 1.1 195 50
Mozambique (2005)Largesellers
10.4 na 3.3 194 312
Smallsellers
16.7 na 2.7 120 151
Occasionalbuyers
41.1 na 1.8 92 119
Consistentbuyers
32.8 na 1.8 121 103
Zambia (2008)Largesellers
19.5 556 3.0 1756 488
Smallsellers
7.5 59 2.1 642 241
Occasionalbuyers
42.4 �4 1.6 454 182
Consistentbuyers
30.7 �88 1.4 642 252
W.A. Masters et al. / Global Food Security ] (]]]]) ]]]–]]] 5
Please cite this article as: Masters, W.A., et al., Urbanization and farm size in Asia and Africa: Implications for food security andagricultural research. Global Food Security (2013), http://dx.doi.org/10.1016/j.gfs.2013.07.002i

cities. But Table 3 reveals that a very large market is offered by theon-farm consumption of rural households themselves, when theylack enough land to meet their needs. Developing and disseminat-ing the seed varieties and agronomic techniques needed to achievea declining real cost of food for everyone, including net foodbuyers in isolated rural areas, is a key pathway to impact for CGIARresearch.
5. Dietary change and food system transformation
The commercial dynamism described in the previous sectiongenerally follows transportation routes, reducing transaction costsand opening up low performance but high potential zones forincreased specialization and trade. Along with changes in the mixof inputs comes a dietary transition in the mix of outputs fromlower- to higher-value foods associated with income growth,including the highly visible transformation of food systems fromtraditional products to branded goods in supermarkets.
Dietary change across types of food is illustrated in Fig. 4, fromthe workshop presentation of Anita Regmi. This chart shows howincome growth drives consumer expenditure towards higher-value foods and other products. At low levels of income such asthe Democratic Republic of the Congo, about 20% of any increase inspending on food goes towards increased consumption of cerealgrains. An additional 20% goes towards meat and fish. About 10% isspent on dairy, oils and fats, and about 20% is spent on produceincluding tubers. The remaining 30–35% is split between foodaway from home and beverages or tobacco.
The data shown in Fig. 4 reveal how food prices are particularlyimportant for reducing extreme poverty, as price declines drivenby agricultural productivity growth release funds for other things.The total of cereals, meats, fish, dairy, oils and fats, and produceincluding tubers takes up 60% of incremental spending at theincome level of Bangladesh, but only 40% at the level of Argentina,and 30% at the level of the United States.
For priority-setting in the CGIAR and other agriculturalresearch organizations, a particularly important question is howquickly demand for animal-sourced foods is likely to grow. Thismatters both for the absolute level of demand for cereal grains andoilseeds, and for the degree to which cropland is devoted tocommodity crops for animal feed as opposed to other crops for
human consumption. Cees de Haan's background paper addressesthis question in detail, using evidence such as Fig. 5 from Ethiopia.
Fig. 5 reveals three distinct patterns. First, confirming theprevious result from Anita Regmi, higher incomes are associatedwith higher meat consumption. Second, for any given level ofmeasured income, meat consumption is higher in urban areas.Third, controlling for income and location, the only visible shiftover time appears for the higher income rural households, whoconsume more meat in 2000 and 2004 than they did in 1996.These results suggest a fairly stable, predictable pattern ahead, asurbanization and increased incomes both drive higher meatconsumption and the need for sharp increases in animal feedswithin Africa as well as in Asia.
A final dimension of food system transformation is the “super-market revolution”, characterized by increasing consumer demandfor the uniformity, packaging and convenience offered by formalretail outlets as opposed to traditional markets. Reardon had docu-mented the extraordinary speed and depth of this transformationacross Asia and Latin America. Fig. 6 from Jayne shows the muchsmaller penetration achieved in African cities, where even thewealthiest quintile of consumers continue to buy most of theirstaple foods from informal retailers and open markets as opposedto any kind of supermarket.
6. From foresight to recommendations: conclusions foragricultural research priorities
The goal of this foresight study is to anticipate trends andvariability in farming conditions that will affect the adoption andimpact of agricultural innovations, so as to draw recommendationsfor the CGIAR and its public or private-sector partners in interna-tional agricultural research. The CGIAR's strategic objectives ofreduced poverty, increased food security, improved nutrition andsustained resource management can be met only by anticipatingthese changes, and then acting in ways that exploit the CGIAR'sdistinctive features in partnership with the many other organiza-tions that pursue similar objectives in various settings. The studyaimed to help the CGIAR make best use of its unique strengths inglobal public goods provision, using international exchange ofmaterials and knowledge to meet farmers' rapidly changing,location-specific needs. Although the research itself is almostentirely in the public domain, the resulting innovations are thendisseminated through both public and private sector channels toachieve population-level reductions in poverty and improvementsin food security, nutrition and sustainability.
To help agricultural innovators achieve their objectives, theforesight study considered both trends and variation in terms ofbroad categorizations offered by Tom Reardon and Peter Hazell.
Fig. 4. Distribution of an additional $1 of food expenditure in 144 countries, rankedby per-capita income.Source: Regmi (2013), from Muhammad et al. (2011).
Fig. 5. Meat consumption and income in Ethiopia by urban/rural residence, 1996–2004.Source: De Haan (2013), from Betru and Kawashima (2009).
W.A. Masters et al. / Global Food Security ] (]]]]) ]]]–]]]6
Please cite this article as: Masters, W.A., et al., Urbanization and farm size in Asia and Africa: Implications for food security andagricultural research. Global Food Security (2013), http://dx.doi.org/10.1016/j.gfs.2013.07.002i

Reardon's distinction between “dynamic” and “hinterland” areasfocuses primarily on commercialization, which is typically drivenby transaction costs and access to urban product demands as wellas input provision. Hazell's categorization combines that with farmsize and propensity to shift labor out of agriculture entirely. Herewe use a slightly modified version of Hazell's terminology,modified in accordance with discussion among the workshopparticipants. The categories we propose follow from the previousdiscussion in this synthesis report:
� “Subsistence” farming households are low-income, semi-autarkic or net food buyers. They are characterized by a lowuse of purchased inputs and low sale of farm outputs. They areoften women, may be geographically isolated, nearly landless,frequently ill, socially excluded or have particularly insecureproperty rights, and are pursuing food and cash crop produc-tion largely because they have very limited other options tomeet household needs.
� “Commercial” farmers are now or could soon be closely linkedto product value chains and input suppliers, and sufficientlyspecialized to separate their farm production decisions fromhousehold consumption preferences. They have or will sooninvest in significant fixed capital for their farm, and may alsohave access to credit markets through which to borrow addi-tional funds as well as land rental or purchase opportunitieswith which to expand their farm operation. Although they are“farming as a business”, it is not their only business. Across allkinds of countries, most commercial farmers also have signifi-cant nonfarm income.
� “Transitional” farm families aim to leave farming. They mayhave high or low levels of farm income, but their principalobjective is to develop the skills and assets needed to exit fromagriculture. Farm earnings are often needed to help them buildhuman capital, start nonfarm enterprises or migratesuccessfully.
Table 4 shows how farms of each type might transition overtime, from left to right across each row. These desirable objectives
to be supported by agricultural research strategies would, forexample, help a subsistence farmer become either a commercialfarmer or move to nonfarm activity. A commercial farmer might behelped to intensify their operation on their existing land, or toacquire additional plots and become a larger farm, and in a fewcases they might sell a profitable operation and exit from thesector. Finally, a transitional farmer might be helped to becomecommercial, or they might use agricultural earnings to exit fromfarming. The relative size of these three groups will vary bycountry context, and it is often very difficult to predict whichhousehold will end up in each category, but in all cases higheragricultural productivity would help the household achieve itsdesired transitions.
To pursue the transitions identified in Table 4, CGIAR prioritiesmight target a wide range of economic zones, agroecologicalregions, or crop and livestock systems. Fig. 7 illustrates how apriority-setting exercise might begin to choose among them. Thepurpose of this diagram is primarily to help identify researchpriorities in category A that could benefit all three kinds offarmers. Such targets would have by far the greatest uptake andsocial impact, driving both poverty reduction and economicgrowth. Investments that focus on poverty reduction might alsoaim for priorities in category B, C, G or F that reach subsistence andtransitional farmers with safety nets and social protection as wellas new technology, whereas investments that focus on economic
Fig. 6. Consumer expenditure shares on staple food products by retailer type.Source: Jayne (2013).
Table 4Transition matrix from small farm groups.Source: Adapted from Hazell (2013).
Initial type of farm (Period t) Desired transition (Period tþ1)
Commercial Large farm Nonfarm
Subsistence X XCommercial X X XTransitional X
Note: X¼desired transition.
W.A. Masters et al. / Global Food Security ] (]]]]) ]]]–]]] 7
Please cite this article as: Masters, W.A., et al., Urbanization and farm size in Asia and Africa: Implications for food security andagricultural research. Global Food Security (2013), http://dx.doi.org/10.1016/j.gfs.2013.07.002i

growth might aim for categories D and E. Some investments couldfocus on category B, to help rural residents find off-farm work onnearby farms, but the magnitude of hired labor in global agricul-ture is not large enough for this to be a major route out of povertyon a population scale.
The dissemination of agricultural research is likely to proceedfirst and fastest through the dynamic zones with low transactioncosts, particularly through private-sector input supply firms. Asdetailed in the workshop comments by Carl Pray, they mayconduct some of their own private R&D, which often uses materialand techniques introduced by the CGIAR and its public sectorpartners. Technologies whose fixed cost of initial introduction isfinanced by serving farmers in dynamic zones can often then beadapted and supplied to more remote locations as well. The CGIARshould also aim to develop and facilitate dissemination of innova-tions aimed directly at subsistence, resource-poor farmers inhinterland areas, both to promote their transition to commercia-lization and also to reduce their poverty and facilitate theireventual exit from agriculture. In these settings, a small absoluteincrease in output or reduction in land, labor and other inputscorresponds to a large proportional increase in productivity.
International agricultural research and policy change is apowerful instrument for sustainable poverty reduction among alltypes of farmers, particularly when it spreads productive innova-tions that are scale-neutral and divisible to reach small farms.Many other interventions are also needed for economic develop-ment, but the agricultural research toolkit is particularly powerfulprecisely because the fruits of international agricultural researchcomplement those interventions, and make them more worth-while. For example, institutions and infrastructure to supportmarket development are more productive when farmers can adoptproductivity-enhancing innovations – and likewise, social protec-tion and safety nets are more affordable when agriculturalproductivity is higher, and environmental sustainability is easierto achieve when innovations to reduce resource use and limitnegative externalities are available. Furthermore, although thename and structure of the CGIAR highlights its cross-countryfocus on international exchange of knowledge and materials, theultimate goal is always highly location-specific and tailored to aparticular group of farmers. As emphasized in this report, hetero-geneity within countries calls for differentiated strategies, withresearch activities guided by the systematic use of large-scalegeocoded datasets. The CGIAR's international mandate gives it aparticular comparative advantage in this kind of “big data”research, including simulation modeling and impact assessment.
In summary, the spread of agricultural dynamism enables manyfarmers to use international agricultural research all the moreeffectively, even as those left behind in hinterlands need it all themore urgently, while new measurement tools allow agriculturalresearchers to target their work all the more precisely.
Our specific conclusions and recommendations for the CGIARare as follows:
(1) Urbanization and economic development have made globalagriculture increasingly differentiated, creating new oppor-tunities for millions of farmers in commercially dynamiczones, even as millions more remain isolated in lessaccessible hinterlands. Heterogeneity is closely tied togender barriers and social exclusion as well as geographicisolation. Research priorities for the CGIAR must be increas-ingly tailored to this diversity, helping to spread agriculturaldynamism while lifting the productivity of lagging farmers.
(2) Agriculturally dynamic zones often extend quite far from townsand cities, along transport routes that carry a “quiet revolu-tion” in the commercialization of crops and livestock. In theseareas, farms are served by specialized agribusinesses thatexploit scale economies in provision of farm inputs andmarketing of farm outputs, even as crop production remainsdominated by household enterprises with both farm andnonfarm activities. Research priorities in dynamic zonesshould recognize the intermediary role of agribusinesses, andprovide the new technologies and institutional innovationsneeded for competition among the diverse firms that servefarm households.
(3) Isolated hinterland zones offer agricultural households limitedopportunities for either farm or nonfarm activity, due to lowproductivity and high transaction costs. The boundariesbetween dynamic and hinterland zones can shift rapidlyas opportunities expand, but those who live in lagging areasoften face worsening poverty due to population growth andresource depletion including climate change. With limitedresources other than labor, hinterland farmers often have nochoice but to farm even as they remain net food buyers,using income from scarce nonfarm employment to supple-ment what little they can grow. Thus, CGIAR researchpriorities in hinterland zones should recognize those farmers'resource constraints, and provide the new technologies andinstitutional innovations needed to raise the productivity andstability of their agricultural systems, reducing poverty andsupporting a gradual transition towards dynamic agricultureand off-farm employment.
(4) Farm sizes vary widely within each area, reflecting hetero-geneity among households as well as differences in landquality. For most crops, cost-effective farm sizes are thatof a household enterprise that balances the cost ofsupervising employed workers against any sources ofscale economies such as mechanization. Householdsbring a variety of assets to their family farm, leading toa distribution of cropped area and livestock herd sizesthat shifts over time in each location. The poorest house-holds not only have the smallest farms and herd sizes, butoften also suffer from gender bias and many other kindsof discrimination. Meanwhile, the wealthiest or mostpolitically powerful landowners may accumulate so muchland that its productivity falls, due to the high cost ofsupervising labor over large areas. Investor-owned farmswith hired managers typically succeed only in crops thatare processed on the farm such as tea, sugar and oil palm,or in operations where labor skills are more readilyobserved by the employer such as greenhouses or live-stock, since remote monitoring of field operationsremains costly despite the spread of GPS devices andvariable-rate technology. For most CGIAR mandate crops,research tailored to the needs of household-sized operationsfor self-motivated family farmers has the highest probabilityof commercial success.
Source: Hazell (2013)
E
G
F
C
D
BA
Commercial Transitional
Subsistence
Fig. 7. Potential benefits of agricultural research accruing to different types offarms.Source: Hazell (2013).
W.A. Masters et al. / Global Food Security ] (]]]]) ]]]–]]]8
Please cite this article as: Masters, W.A., et al., Urbanization and farm size in Asia and Africa: Implications for food security andagricultural research. Global Food Security (2013), http://dx.doi.org/10.1016/j.gfs.2013.07.002i
(5) Changes in average farm size depend on rural populationgrowth, which in turn depends on natural increase minusout-migration from rural areas. During economic develop-ment, out-migrants generally earn higher incomes thanthose left behind, but urban employment is rationed bythe cost and risk of migration as well as demand for urbangoods and services. As the rate of natural increase slows,rural populations eventually reach their peak and beginto decline, so average farm sizes can begin to increase.Asia as a whole has already or will soon reach this turningpoint, but for almost all of Africa it is decades away. Arelated transition occurs in livestock based in part on thecost of labor relative to capital as well as veterinarytechnologies, driving increases in herd and flock sizes inAsia that are now starting to be seen in Africa. CGIARresearch should anticipate the effect of demographic trendson average farm sizes; in most African countries farm sizeswill continue to shrink for several more decades, so innova-tions that are land-saving and readily divisible to servesmaller plots will have the highest probability of commercialsuccess, whereas in much (but not all) of Asia innovations toincrease farm size are increasingly attractive. For livestock,the emphasis should be on increasing efficiency with respectto land, water and other resources, as well as the mitigationof health and environmental externalities.
(6) Targeting agricultural innovations increasingly requires“big data” statistical tools. The conclusions of this studyare framed at the aggregate continental level, but theyemphasize heterogeneity among zones (in the distinctionbetween “dynamic” versus “hinterland” areas), withinany given zone (in the distribution of farm sizes andcommercialization levels), and over time (through shiftsin the farm-size distribution that result from demo-graphic trends) and by gender or other social group (oftendue to differences in economic opportunity and
bargaining power). To operationalize these conclusions,CGIAR programs should continue to expand their investmentin spatial models of global climate, land use, migration and
Table A1
Workshop agenda and list of background papersa
Friday 25th January08:00 Continental breakfast08:30 Welcome and Introductions – Ken Cassman08:40 Chair's opening remarks – Will Masters08:45 Urbanization & Changes in Farm Size in Asia – Tom Reardon09:15 Lead discussants: Steve Wiggins, Bharat Ramaswamy10:00 Urbanization & Changes in Farm Size in Africa – Thom Jayne10:30 Lead discussants: Margaret McMillan, Agnes Quisumbing11:10 Coffee break11:30 Urbanization & Changes in Farm Size – Agnes Andersson Djurfeldt & Magnus Jirström12:00 Lead discussants: Awudu Abdulai, Anita Regmi12:40 Lunch13:45 Changes in the structure and size of livestock herds/husbandry in Asia & SSA – Cees de Haan14:15 Lead discussants: Clare Narrod, Steve Staal14:55 Urbanization & Changes in Farm Size in Asia & SSA – Peter Hazell15:25 Lead discussants: Derek Byerlee, Deborah Balk16:05 Coffee break16:20 Respondents' panel – Ken Giller, Jerry Nelson, Carl Pray, Cheryl Doss17:20 ISPC panel – Ken Cassman, Timothy Kelley, Doug Gollin18:00 Open discussion: key issues emerging, and questions for day 2 – Will Masters18:30 Adjourn19:30 Workshop dinner
Saturday 26th January8:30 Continental breakfast9:00 Authors' panel – T. Reardon, T. Jayne, A. Andersson-Djurfeldt, C. de Haan and P. Hazell10:00 Lead discussant – Kei Otsuka10:45 Break11:00 Discussion and conclusions – Will Masters12:15 Wrap-up and next steps – Ken Cassman
a Titles and authors of background papers are underlined in the workshop agenda.
Table A2
Coordinator/hostWill Masters [email protected]
Authors of background papersAgnes Andersson Djurfeldt [email protected] de Haan [email protected] Hazell [email protected] Jayne [email protected] Jirström [email protected] Reardon [email protected]
DiscussantsAwudu Abdulai [email protected] Balk [email protected] Byerlee [email protected] Doss [email protected] Giller [email protected] McMillan [email protected] Narrod [email protected] Nelson [email protected] Otsuka [email protected] Pray [email protected] Quisumbing [email protected] Ramaswami [email protected] / [email protected] Regmi [email protected] Staal [email protected] Wiggins [email protected]
ISPC panelKen Cassman [email protected] Gollin [email protected] Kelley [email protected]
Note-takersDana Goldman [email protected] Saleh [email protected]
W.A. Masters et al. / Global Food Security ] (]]]]) ]]]–]]] 9
Please cite this article as: Masters, W.A., et al., Urbanization and farm size in Asia and Africa: Implications for food security andagricultural research. Global Food Security (2013), http://dx.doi.org/10.1016/j.gfs.2013.07.002i
economic development, to predict changes in what types ofcrop or livestock innovations are needed at each location tosustainably increase productivity and reduce poverty.
Annex 1. Agenda for ISPC foresight study workshop onurbanization and farm size in developing countries:implications for agricultural research. Tufts University, Boston,25–26 January 2013.
See Table A1.
Annex 2. Contact information for all workshop participants.
See Table A2.
References
Workshop background papers
Djurfeldt, Agnes Andersson, Jirström, Magnus, 2013. Urbanization and changes infarm size in Sub-Saharan Africa and Asia from a geographical perspective:a review of the literature. In: Background Paper for the ISPC Foresight Study onFarm Size and Urbanization. Available from: ⟨http://www.sciencecouncil.cgiar.org/sections/strategy-trends⟩ (accessed 06.02.13).
de Haan, Cornelis (Cees), 2013. Urbanization and Farm Size Changes in Africa andAsia: Implications for livestock research. In: Background Paper for the ISPCForesight Study on Farm Size and Urbanization. Available from: ⟨http://www.sciencecouncil.cgiar.org/sections/strategy-trends⟩ (accessed 12.02.13).
Jayne, Thomas, 2013. Urbanization and farm size changes in Sub-Saharan Africa:implications for agricultural research. In: Background Paper for the ISPCForesight Study on Farm Size and Urbanization. Available from: http://www.sciencecouncil.cgiar.org/sections/strategy-trends (accessed 27.02.13).
Hazell, Peter, 2013. Urbanization and farm size changes in Africa and Asia: crossregional comparison and implications for agricultural research. In: Background
Paper for the ISPC Foresight Study on Farm Size and Urbanization. Availablefrom: ⟨http://www.sciencecouncil.cgiar.org/sections/strategy-trends⟩ (accessed15.02.13).
Reardon, Thomas, 2013. The economics of urbanization, farm technology, and farmsize distribution in Asia. In: Background Paper for the ISPC Foresight Study onFarm Size and Urbanization. Available from: ⟨http://www.sciencecouncil.cgiar.org/sections/strategy-trends⟩ (accessed 20.03.13).
Discussants' comments cited
Balk, Deborah, 2013. Discussant's comments at the ISPC Foresight Study Workshopon Trends in Urbanization and Farm Size in Sub-Saharan Africa and South Asia:Implications for Agricultural Research, 25–26 January 2013. Tufts University inBoston, USA. [email protected].
Giller, Ken, 2013. Discussant's comments at the ISPC Foresight Study Workshop onTrends in Urbanization and Farm Size in Sub-Saharan Africa and South Asia:Implications for Agricultural Research, 25–26 January 2013. Tufts University inBoston, USA. [email protected].
Pray, Carl, 2013. Discussant's comments at the ISPC Foresight Study Workshop onTrends in Urbanization and Farm Size in Sub-Saharan Africa and South Asia:Implications for Agricultural Research, 25–26 January 2013. Tufts University inBoston, USA. [email protected].
Regmi, Anita, 2013. Discussant's comments at the ISPC Foresight Study Workshopon Trends in Urbanization and Farm Size in Sub-Saharan Africa and South Asia:Implications for Agricultural Research, 25–26 January 2013. Tufts University inBoston, USA. [email protected].
Other sources of data cited
Betru, Shawel, Kawashima, Hiroyuki, 2009. Pattern and determinants of meatconsumption in urban and rural Ethiopia. Livestock Research for Rural Devel-opment 21 (art. 143), p. 12. (www.lrrd.org/lrrd21/9/betr21143.htm).
Muhammad, Andrew, Seale Jr., James L. Meade, Birgit, Regmi, Anita, 2011. Interna-tional Evidence on Food Consumption Patterns: An Update Using 2005International Comparison Program Data. USDA ERS Technical Bulletin no.1929, March 2011, 59 pp.
United Nations, 2012. World Urbanization Prospects: The 2011 Revision, online athttp://esa.un.org/unup.
W.A. Masters et al. / Global Food Security ] (]]]]) ]]]–]]]10
Please cite this article as: Masters, W.A., et al., Urbanization and farm size in Asia and Africa: Implications for food security andagricultural research. Global Food Security (2013), http://dx.doi.org/10.1016/j.gfs.2013.07.002i
Related Documents