Working paper Urbanisation in Tanzania Population Growth, Internal Migration and Urbanisation in Tanzania 1967-2012: A Census-Based Regional Analysis Tanzania’s Urban Population, 1967-2012 A Density-Based Measure of ‘Urban’ for Tanzania? A Feasibility Study Using Dodoma Region April 2014

Welcome message from author
This document is posted to help you gain knowledge. Please leave a comment to let me know what you think about it! Share it to your friends and learn new things together.
Transcript

Working paper
Urbanisation in Tanzania
Population Growth, Internal Migration and Urbanisation in Tanzania 1967-2012: A Census-Based Regional Analysis
Tanzania’s Urban Population, 1967-2012
A Density-Based Measure of ‘Urban’ for Tanzania? A Feasibility Study Using Dodoma Region
April 2014

I
IGC project: Urbanization in Tanzania Phase 1: Data assembly and preliminary analysis
Executive summary The aim of this project is to obtain a better understanding of the interaction between population growth,
internal migration and urbanization in Tanzania, and their relationship to the changing structure of the
economy from soon after independence to the present day.
The aims of this first phase were: to obtain from the 2012 census the best possible data on the number,
size and location of urban settlements in Tanzania, to link to analysis already carried out on previous
censuses; and to investigate the feasibility of developing a new density-based definition of ‘urban area’
to apply to 2012 and earlier census data.
The Phase 1 results are set out in the three working papers which make up this report:
x WP1: Population growth, internal migration and urbanization in Tanzania, 1967-2012:
A census-based regional analysis;
x WP2: Tanzania’s urban populations, 1967-2012; and
x WP3: A density-based measure of ‘urban’ for Tanzania? A feasibility study using
Dodoma region.
Key findings
The overall trend in population growth and urbanization for mainland Tanzania is shown in Table 2 of
WP1 and in the figure below.

II
There was a spurt in both population growth and urbanization in the two decades following
independence. Thereafter population growth still averaged nearly 3% p.a. while the urban population
increased by about 5% p.a. In consequence, urbanization increased from 5.7% in 1967 to 29.1% in
2012. Thus, of the 31.6 million increase in the total population, 12.0 million were absorbed into urban
areas. The increase in the rural population was 19.6 million, nearly a threefold increase over 1967,
adding greatly to the pressure of population on land and other resources in rural areas.
Dar es Salaam stands out as the primate city, accommodating some 4.4 million people – 10% of the
national population. What is striking about other regions is how variable the urbanization experience
has been elsewhere (see Table 3, p.8). To aid interpretation of the figures, we introduce measures of
rural out-migration, urban in-migration, regional in-migration, and the proportion of the increase in a
region’s urban population attributable to in-migration - see Tables 4 (p.11), 5 (p.12), 6 (p.13) and 7
(p.15). Again, the striking feature is the wide variation in regional experience, with regions such as Dar
es Salaam, Rukwa and Arusha gaining strongly while others, such as Lindi, Mtwara and Iringa have
lost out. It may be useful, with future analytical work in mind, that the forces driving rural out-
migration appear to differ from those driving urban in-migration; as also may be the fact that
urbanization propensities vary quite markedly between one period and the next.
WP2 aims to track the populations of Tanzania’s larger towns using census data from 1967, 1978,
1988, 2002 and 2012. However, at the time of writing 2012 data for towns not having the status of a
Municipal or Town Council had not been released so the analysis focuses on regional capitals. The
figures confirm a surge in urbanization during 1967-1978. After 1978, this surge eased, although
regional capitals continued to grow on average well above the rate of population growth. What is
striking, however, is the wide variation in the growth rates of these towns from 1978 onwards. In 1978-
88, while Songea and Shinyanga grew strongly, Tanga, Bagamoyo, Lindi, Iringa and Bukoba lagged
behind general population growth. In 1988-2002, only Arusha grew strongly (if the high population
figure for 2002 is accepted), while Moshi, Tanga, Bagamoyo, Mtwara, Iringa, Singida and Tabora
lagged, and Lindi actually lost population. Then in the latest period, 2002-2012, Bagamoyo and Lindi
grew strongly while Arusha, Moshi, Tanga, Mtwara, Tabora and Musoma lagged.
Potential problems with the census data used to derive the results reported in WP1 and WP2 include
uncertainty as to whether a consistent definition of ‘urban’ has been applied in the censuses, and the
effect of boundary changes on urban population counts. To assess the quantitative significance of the

III
latter effect, we tried to locate the government gazettes which are supposed to record boundary changes
and searched for historic maps from which boundary changes might be deduced. However, up to the
time of writing neither line of enquiry has been fruitful.
As regards the definition of ‘urban’, WP3 uses data for Dodoma region to explore the feasibility of
adopting a density-based definition of ‘urban’ in Tanzania. We conclude that despite the advantage of
consistency, a density-based measure would have limitations unless used in conjunction with other
criteria and central guidance. We also suggest a sub-division of the ‘urban’ category into ‘urban -
informal’ and ‘urban - formal’ in future censuses.
Next steps
In Phase 2 of this project, the intention is to gain a better understanding of the drivers of the trends
found in Phase 1. In particular, to use our Phase 1 propensities to investigate how regions with high
propensities differ from those with low propensities, period by period, leading to a narrative account of
the spatial development of the Tanzanian economy over this period, interpreting what has happened.
Where the evidence seems sufficiently convincing, we will draw conclusions and suggest policy
implications. Where uncertainties remain, we will suggest directions for future research.

Working paper
Population Growth, Internal Migration and Urbanisation in Tanzania
1967-2012: A Census Based Regional Analysis
Hugh Wenban-Smith
April 2014
1
INTERNATIONAL GROWTH CENTRE (IGC)
Project on urbanization in Tanzania Phase 1: Data assembly and preliminary analysis
Working Paper 1
POPULATION GROWTH, INTERNAL MIGRATION AND URBANISATION IN TANZANIA, 1967-2012: A CENSUS BASED
REGIONAL ANALYSIS
H B Wenban-Smith Independent Research Economist
([email protected]) Final Version: 1 April 2014
2
POPULATION GROWTH, INTERNAL MIGRATION AND URBANISATION IN TANZANIA, 1967-2012: A CENSUS BASED REGIONAL ANALYSIS
H B Wenban-Smith Independent Research Economist
([email protected]) Final Version: 1 April 2014
Introduction In the 1960s and 1970s, soon after Tanzania’s Independence, rural-urban migration was the subject of
considerable academic attention. Much of this focused on the dual economy model of Harris & Todaro
(Harris & Todaro (1970) – see also a recent survey by Lall et al (2006)). In Tanzania, important studies
were undertaken by Collier (1979) and Sabot (1979). Sabot worked within a Harris-Todaro framework
(“The excess supply of urban labour increases until there is equality between the expected income of
migrants, the product of the urban wage and the probability of obtaining a job, and the rural wage” p.2)
but provides a long historical perspective (1900-1971) and adds investment in human capital (i.e.
primary or secondary education) as a determinant of migration. Collier goes further, finding the Harris-
Todaro model over-simplistic, and its implications unwarranted once more realistic features of the
labour market are introduced1. He also moves from static partial equilibrium to dynamic general
equilibrium – an important innovation in this context2. After 1980, work of this kind rather tailed off as
academic attention moved on to new problems and, in Tanzania’s case, some disenchantment set in
regarding its development policies. However, there have recently been some new studies: For
Tanzania, Beegle et al (2011) have tracked migration in the Kagera region and there is a World Bank
(2009b) report on the urban transition in Tanzania; For the wider SSA area we have Barrios et al
(2009), who consider the influence of climate change on rural-urban migration, Bruckner (2012), who
investigates the relationship between agriculture and urbanization, Gollin et al (2013), who distinguish
between urbanization with and without industrialization, and Christiaensen et al (2013), who draw
attention to the growing significance of natural population growth in urban areas, giving rise to ‘urban
push’.
1 These features are: Heterogeneity in both the stock of unemployed and the flow of migrants; The reservation price of job seekers treated as a function of the length of job search; Existing wage employees assumed to have priority over new job seekers; The urban non-wage sector disaggregated into casual wage labour, self-employment and unemployment; Migrants and the unemployed stratified by age, sex and educational characteristics. 2 Today, general equilibrium is less highly regarded. Arguably, the key here is dynamic modelling, the continuing flow of migrants clearly demonstrating that no equilibrium has been (or maybe ever will be) achieved.

3
The ultimate aim of the work reported in this paper is to contribute to this revival by documenting
rural-urban migration in the particular case of Tanzania, relating it on the one hand to the impact of
population growth on rural productivity (rather neglected in the work cited above) and, on the other
hand, to the rate of urbanization. Urbanisation should be a powerful force for structural change and
income growth (World Bank, 2009b) but, in countries like Tanzania, it is failing to realize this potential
(Fay & Opal (2000); Cohen (2004); Bryceson & Potts (2006)). With the passage of time, theoretical
advances in urban economics and economic geography (and in statistical techniques and computing
power) offer the prospect of a better understanding of these processes – and hence of the scope for
improving performance.
As a first step, the Tanzanian censuses for 1967, 1978, 1988, 2002 and 2012 are in this paper analysed
to estimate at regional level how the rural and urban populations have evolved over a period of 45
years. The analysis allows us to present:
x An overall picture of the trend towards urbanisation in Tanzania;
x Estimated flows of migrants from rural areas to urban areas in their own or other regions, or to
rural areas in other regions (e.g. in connection with artisanal mining);
x Derived from these estimates, summary measures of these flows, here termed:
o The regional propensity for rural out-migration P(rom);
o The regional propensity for urban in-migration P(uim); and
o The regional propensity for regional in-migration P(rim).
Before presenting these estimates, the data sources are discussed, including the question of the
definition of ‘urban’ in the Tanzanian context. This leads to discussion of what the data seem to show.
This analysis is all basically descriptive, establishing the facts. A final section foreshadows use of the
information that has been assembled in further research aimed at understanding and explaining the
facts, leading hopefully to better informed policies towards rural development, migration and
urbanization.
Treatment of Urban Areas in the Census Reports
(a) 1967 Census: Volume 2 of the 1967 Population Census is “Statistics for Urban Areas”. For
mainland Tanzania, the report explains that the then 17 regions were divided into 60 districts and 14
towns, plus Dar es Salaam. The 14 towns have their own town councils, responsible directly to the

4
regional headquarters. In addition, the district administrations cover 17 ‘former townships’ which are
treated as urban areas in the census, making 32 urban areas in all. The definition of urban was thus
based on administrative criteria – but this probably coincided pretty well with the larger denser
settlements at that time (many of which were nevertheless quite small).
(b) 1978 Census: Volume IV of the 1978 Population Census shows in Table 5 (p.7) a list of urban
areas/localities by region together with the populations of each3. In addition to Dar es Salaam, the 14
towns and 17 former townships of 1967, this list includes 78 additional settlements, making 110 urban
areas in all. Regarding the definition of urban, Table 15 of the same volume shows which wards are
included in each urban area but does not say what criteria were used to determine whether a ward was
urban or not. By this date the Tanzanian ‘Ujamaa’ programme of village consolidation was well under
way producing some villages with sizeable populations. However, as the majority of the urban areas in
the report are stated to be regional or district headquarters, it appears that no villages were yet
considered to be urban.
(c) 1988 Census: Here matters become more complicated. According to Vol. X of the 2002 Census: “It
should be noted that in the 1988 Population Census, identification as well as the size of the urban
localities was not addressed by the Bureau of Statistics as it was for the 1967 and 1978 Censuses”.
However, the 20 volumes of Regional Profiles published as part of the census reports indicate for each
ward whether it is ‘urban’, ‘mixed’ or ‘rural’, with the urban populations totaled for each district and
each region – enabling regional urban populations to be established. It seems that whether part or all of
a ward was considered to be urban was left to the judgement of the district administration. No criteria
were laid down centrally. We may surmise that different judgements were made in different areas4 but
it seems likely that most would be administrative centres. Examination of the ward figures suggests that
were around 170 ‘urban areas’ at this time.
(d) 2002 Census: Vol. X of the 2002 Census gives regional rural and urban populations (Table 1.10,
p.10) with a fuller discussion in Chapter 10 (pp. 160-165). It also notes that: “The urban areas are
defined as the localities that are identified as urban areas by the district authority. There is no clear and 3 The urban populations in this table differ somewhat from those shown in Table 6 of the 1978 Preliminary Census Report and, being later, are more authoritative. 4 We may note here also figures published in Appendix 4 of the Tanzania National Human Settlements Development Policy in 2000. These claim to be 1988 populations but appear in most cases to be greatly inflated compared with the other sources – Vol. X of the 2002 Census reports that [in the 1988 Census]: “The assignment of urban population portion in a mixed ward was mainly based on guesstimate.”

5
uniform definition applied by the various districts in the country.” This chapter also refers to the
National Human Settlements figures (see F/N 4). The number of urban settlements in the 2002 census
had fallen to around 150, suggesting a stricter definition than in 1988.
(e) 2012 Census: The 2012 census report on ‘Migration and Urbanisation’ is not scheduled to be
published until May 2014. However, the census tables reporting ‘Population distribution by Age and
Sex’, which were released in September 2013, include a rural-urban breakdown of the population down
to district level. These figures may be preliminary but have been adopted in this paper. As regards the
definition of ‘urban’, this report says: “For the purpose of the 2012 PHC, urban population consists of
people living in areas legally recognized (gazetted) as urban and all areas recognized by Local
Government Authorities as urban.” A listing of ‘urban centres’ compiled by NBS, in association with
government departments, for the 2012 census shows nearly 600 such centres. It appears that many
smaller settlements not previously considered urban are now so considered – a point on which the
forthcoming ‘Migration and Urbanisation’ report may be expected to shed more light.
The key figures noted above are summarized in Table 1 below:
Census Year No. of Regions No. of Districts No. of Urban Areas 1967 17 60 32 1978 20 95 110 1988 20 [?] c.170 2002 20 123 c.150 2012 25 159 c.600 Table 1: Mainland Tanzania – Numbers of Regions, Districts and Urban Areas
Using the census urban areas data Thus figures for the total urban population of mainland Tanzania at regional as well as national level
are available for all five census years. The problem here is that the definition of ‘urban’ has not
remained the same over the period. In 1967 and 1978 the definition was clear but quite restrictive –
essentially regional and district administrative centres (whose boundaries probably expanded between
the two years). By 1988, and again in 2002, more settlements were being classified as urban but the
criteria seem to have differed between district authorities, with some being perhaps more generous than
others. In so doing, the authorities were no doubt responding to changes they could see on the ground.
The total population of mainland Tanzania increased by over 30% between 1978 and 1988, by 45%
6
between 1988 and 2002, and by a further 30 % between 2002 and 2012, leading to more and larger
settlements. Among the types of urban expansion taking place were:
i. Densification of established urban centres, particularly Dar es Salaam but also Mwanza,
Arusha, Dodoma, Mbeya and Moshi;
ii. Extension of shanty type settlements around these centres, extending their boundaries and
perhaps absorbing previously independent villages or other settlements;
iii. Growth of previously insignificant trading centres, particularly along major roads and railways;
iv. Growth of villages, particularly in the wake of the Ujamaa villagisation programme;
v. Temporary or semi-permanent settlements associated with small scale mining activities;
vi. Camps or settlements formed by refugees from neighbouring countries, particularly (at different
times) Burundi, DR Congo and Rwanda (See Appendix B for some estimates of numbers).
While it seems likely that expansion of types (i) – (iii) would generally be reflected in district authority
classifications, practice with types (iv) – (vi) is unclear, and cases of these kinds are hard to identify in
the census reports.
In the 2012 census, there seems to have been a relaxation of the criteria (or at least a widening of the
administrative definition) although again there is some uncertainty as to precisely what criteria Local
Government Authorities have followed. It seems possible that some populations in settlements of types
(iv) – (vi) are now being counted as urban. Thus caution is in order when using the census estimates of
urbanization over these years – some of the recorded changes may reflect changing definitions of
‘urban’. Moreover, even where the formal definition has not changed, expansion of the urban boundary
will lead to more people being counted as urban (see also F/N 11 on p.10).
Census migration data
In the long form census questionnaires for 1967, 1978, 1988 and 2002, administered to only a sample
of respondents, questions were included about place of birth, place of normal current residence and
place of residence in the previous year5. The information allows observations to be made on both long
term and short term migration. This is explained more fully in Chapter 9 of Vol. X of the 2002 Census
Report. However, the responses were coded by region only so that the data shed no light on rural-urban
migration. For this reason, the derivation of migration flows presented later in this paper has been
preferred.
5 It needs to be checked whether similar questions were included in the 2012 census.

7
Alternative measures of urbanization
A World Bank report on ‘The Urban Transition in Tanzania’ (World Bank (2009a)) notes that there are
three perspectives on ‘urban’ in Tanzania: The politico-administrative used by the Prime Minister’s
Office, Regional Administration and Local Government (PMO-RALG); The human settlements
perspective used by the Ministry of Lands and Human Settlements Development (MoLHSD; and the
statistical perspective adopted by the National Bureau of Statistics (NBS). None of these, the report
observes, explicitly accounts for population density. There is thus a question whether a density-based
measure of urbanization would provide a more consistent yardstick for tracking urbanization over long
periods, as the other measures may be affected by arbitrary changes in definition from time to time. A
pilot investigation into the feasibility of an urbanisation measure of the form “contiguous areas with a
density greater than X, and a total population greater than Y” is being carried out for Dodoma region as
a part of this project and will be reported separately. This will provide an opportunity to compare
census based urban population figures with those obtained using a density-based measure. In addition,
information is being sought on how the boundaries of regional capitals have changed between
censuses, to help assess the importance of this factor.
Overall trend in urbanization in Tanzania Bearing in mind what has been said above about the ‘urban’ definition, Table 2 shows urban and total
population for mainland Tanzania for each census year.
Tanzania 1967 Census
1978 Census
1988 Census
2002 Census
2012 Census
Mainland Urban Population (Growth rate % p.a.) - of which: Dar es Salaam (Growth rate % p.a.)
685,092
272,821
2,257,921 (11.5%)
769,445
(9.9%)
3,999,882 (5.9%)
1,205,443
(4.6%)
7,554,838 (4.7%)
2,336,055
(4.8%)
12,701,238 ( 5.3%)
4,364,541
(6.5%)
Mainland Total Population (Growth rate % p.a.)
11,975,757 17,036,499
(3.3%)
22,507,047
(2.8%)
33,461,849
(2.9%)
43,625,354
(2.7%) Urbanisation (%) 5.7 13.3 17.8 22.6 29.1
Table 2: Overall trend in urbanization in Tanzania
These figures show quite rapid urbanization in the first period with a subsequent slowing down. While
total population growth has gradually declined from 3.3% p.a. in the first period to 2.7% p.a. now, the
urban population has always grown more rapidly so that by 2012 urbanisation had risen to 29.1%

8
compared with 5.7% in 1967. This is still quite low by international standards, implying that more than
70% of the population remains rural, emphasizing the importance of relating developments in the urban
sector to conditions in rural areas. We may note, for example, that of the 31.6 million increase in the
total population between 1967 and 2012, 12.0 million were absorbed into urban areas; the increase in
the rural population was therefore 19.6 million, nearly a threefold increase over 1967, adding greatly to
the pressure of population on land and other resources in the rural areas.
The Regional Dimension Table 3 sets out urbanization percentages and urban population growth rates for each of the 20 regions6
for the 1978 to 2012 period7.
Regiona Urbanization (%) Urban Population Growth
(% p.a.) 1978 1988 2002 2012 1978-1988 1988-2002 2002-2012
1. DOD 8.8 10.6 12.6 15.4 4.4 3.5 4.2 2. ARU/MAY 8.0 12.1 23.4 24.1 8.3 9.0 3.3 3. KIL 7.5 15.0 20.9 24.2 9.4 4.0 3.3 4. TAN 14.1 17.6 18.4 21.6 4.5 2.1 3.9 5. MOR 14.4 21.0 27.0 28.7 7.1 4.1 3.0 6. PWA 7.2 15.0 21.1 32.8 9.8 4.9 6.8 7. DAR 91.3 89.6 93.9 100.0 4.6 4.8 6.5 8. LIN 10.1 15.1 16.0 18.7 6.2 1.9 2.5 9. MTW 12.0 14.4 20.3 22.9 3.3 4.2 2.5 10. RUV 7.7 11.7 15.2 24.6 7.7 4.5 7.2 11. IRI/NJO 9.1 9.8 17.2 25.7 3.3 5.8 5.1 12. MBE 8.9 18.0 20.4 33.2 10.7 3.3 7.9 13. SIN 9.4 8.6 13.7 12.5 1.7 5.7 1.4 14. TAB 13.1 14.3 12.9 12.6 3.3 2.8 2.7 15. RUK/KAT 11.7 14.1 17.6 25.1 6.4 5.2 7.0 16. KIG 9.9 12.3 12.1 17.2 5.0 4.8 6.1 17. SHI/GEI/SIM 4.2 6.6 9.2 12.1 7.6 5.8 4.6 18. KAG/GEI 3.4 5.3 6.2 9.9 7.3 4.4 8.2 19. MWA/GEI/SIM 10.2 18.1 20.5 28.3 8.7 4.2 6.4 20. MAR 7.3 10.5 18.6 17.4 6.6 6.9 1.8 Mainland 13.3 17.8 22.6 29.1 5.9 4.7 5.3 [Note: a Listed here with NBS numbers of 2002. See Appendix A for full names of regions.]
Table 3: Urbanization and urban population growth by region, Tanzania 1978 to 2012
6 Although figures are given separately for Arusha and Manyara regions in the 2002 census reports, this division of Arusha region took place in 2003. Combining ARU and MAY here preserves comparability with earlier years. Similarly, by 2012, 4 new regions had been created with Iringa (IRI) being divided into Iringa and Njombe (NJO), Rukwa (RUK) being divided into Rukwa and Katavi (KAT), while parts of Mwanza (MWA) and Shinyanga (SHI) have been reallocated to the new regions of Geita (GEI) and Simiyu (SIM). To preserve comparability, districts have here been allocated back to the previous 20 regions. Appendix A lists today’s 25 regions, indicating the areas transferred since 2002. 7 Taking the regional analysis back to 1967, when there were 17 regions, would be difficult.

9
Dar es Salaam (DAR) of course stands out. Although no longer formally the capital of Tanzania – that
is now Dodoma – it remains the primate city, accommodating 10% of the national population, and its
growth has accelerated recently. It is not really comparable with the other regions, being defined by its
municipal boundaries. It used to have a small rural population within those boundaries but by 2012 that
was no longer the case and it seems likely that some of the growth of the surrounding Pwani (PWA)
region may be due to overflow from Dar8. As will emerge, its growth has been fueled mainly by in-
migration from other regions.
What is most striking about the figures for other regions is how variable their urbanization experience
has been. Some that grew fast in one period, slowed in others; others, which started slow, speeded up
later. Only four regions urbanised below the average rate in all three periods: Dodoma9, Tanga, Mtwara
and Tabora, with Tabora less urbanized in 2012 than it was in 1978. However, there are signs that more
regions are losing urban dynamism: In 1978-1988, urban growth was below population growth in only
one region, Singida (SIN); In 1988-2002, there were three, Tanga (TAN), Lindi (LIN) and Tabora
(TAB); in 2002-2012, there were five, Lindi, Mtwara (MTW), Singida, Tabora and Mara (MAR).
Only two regions urbanized above the average rate in all three periods: Pwani and Rukwa. However, by
2012, two regions were more than 30% urbanized (Pwani and Mbeya), while another four were more
than 25% (Morogoro, Iringa, Rukwa and Mwanza). At the other end of the spectrum, Kagera was still
under 10% urbanized in 2012. We can hope that looking more closely at these regional differences will
throw new light on the drivers of urbanization in Tanzania. As a step in this direction, we look next at
the relative roles of natural population growth and internal migration in urban growth at regional level.
The relative roles of natural growth and migration in urbanisation In this section, we introduce four measures which aid interpretation of the data. They are:
i. P(rom) , the regional propensity for rural out-migration: This is the percentage of the expected
rural population in a region that migrates either to the urban parts of the same region or to other
regions (a negative value indicating a net inflow to the region’s rural areas);
8 Indeed, there may be a case for treating Dar and Pwani as a single region for the kind of analysis done in this paper. 9 It is surprising to find Dodoma region in this position but the decision in 1973 to relocate the capital there has not been implemented with any enthusiasm – most government departments remain in Dar.
10
ii. P(uim) , the regional propensity for urban in-migration: This is the number of migrants to the
region’s urban areas expressed as a percentage of the expected urban population (a negative
value indicating that some of the expected urban population left the region’s urban areas);
iii. P(rim) , the regional propensity for in-migration, both rural and urban: This is the number of
migrants coming into the region expressed as a percentage of the expected total population of
the region, rural and urban (a negative value indicating a net outflow from the region);
iv. MUProp , the proportion of the increase in a region’s urban population attributable to in-
migration.
To obtain these measures, it is first assumed that the natural growth rate for all regions between the
census years1978, 1988, 2002 and 2012 is the national average rate for each period. Of course, this is
unlikely to be quite right but it provides a benchmark – the ‘expected population’ – against which other
movements can be assessed10. Next it is supposed that the expected growth in the rural population in
each region that is not found to be still rural at the end of each period goes either to the urban parts of
the same region11; or, if there is still a surplus, it is supposed to migrate to other regions12. The
calculations leading to the derived measures are set out in Appendix C, Tables C1 (for 1978-1988), C2 (for 1988-2002) and C3 (for 2002-2012).
(a) Regional propensities for regional in-migration (P(rim)) A good starting point is to consider which regions have gained most from migration and which have
lost population. Table 4 sets out the figures for P(rim) for the three inter-censal periods13, adding a
column for the whole period 1978 to 2012. To avoid the appearance of a random series of numbers, the
regions are listed with the gainers at the top and the losers at the bottom.
The inter-regional flows of migrants balance out, hence the zeros in the final row. Dar dominates the
table, with over 70% of the increase in its population between 1978 and 2012 being accounted for by
in-migration. This inflow has been high and rising (only Kigoma being higher, in one period, 1988-
2002, boosted by refugees from Burundi and DRC). Next, Rukwa and Arusha regions have been 10 Potts (2009, p.254) takes a similar position: “… as a general guide, the contribution of net in-migration to the growth of one town, or a group of towns, can be assessed by comparing its growth to the national rate.” 11 It has been pointed out to me that when the urban population increases because the urban boundary has expanded, no migration is involved (Deborah Potts, personal communication). The quantitative importance of this needs to be assessed. 12 It is important to keep in mind that these are all net flows. Potts (2006, pp.73-77) discusses the extent of circular migration in SSA countries; she also discusses the relative contributions of natural increase and in-migration to urban growth, noting that higher rural birth rates are balanced by a higher proportion of people of child-bearing age in urban areas. 13 Propensities for 1967-1978 have not been calculated because of the change in number of regions (See F/N 7).
11
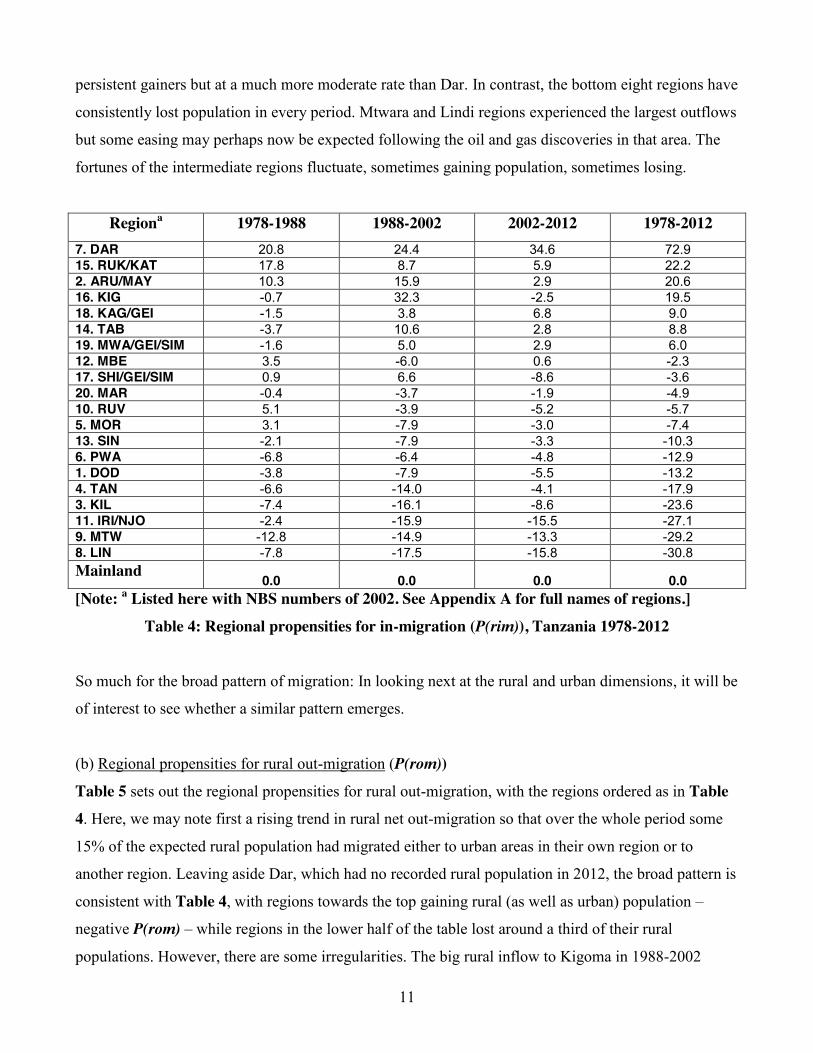
persistent gainers but at a much more moderate rate than Dar. In contrast, the bottom eight regions have
consistently lost population in every period. Mtwara and Lindi regions experienced the largest outflows
but some easing may perhaps now be expected following the oil and gas discoveries in that area. The
fortunes of the intermediate regions fluctuate, sometimes gaining population, sometimes losing.
Regiona 1978-1988 1988-2002 2002-2012 1978-2012 7. DAR 20.8 24.4 34.6 72.9 15. RUK/KAT 17.8 8.7 5.9 22.2 2. ARU/MAY 10.3 15.9 2.9 20.6 16. KIG -0.7 32.3 -2.5 19.5 18. KAG/GEI -1.5 3.8 6.8 9.0 14. TAB -3.7 10.6 2.8 8.8 19. MWA/GEI/SIM -1.6 5.0 2.9 6.0 12. MBE 3.5 -6.0 0.6 -2.3 17. SHI/GEI/SIM 0.9 6.6 -8.6 -3.6 20. MAR -0.4 -3.7 -1.9 -4.9 10. RUV 5.1 -3.9 -5.2 -5.7 5. MOR 3.1 -7.9 -3.0 -7.4 13. SIN -2.1 -7.9 -3.3 -10.3 6. PWA -6.8 -6.4 -4.8 -12.9 1. DOD -3.8 -7.9 -5.5 -13.2 4. TAN -6.6 -14.0 -4.1 -17.9 3. KIL -7.4 -16.1 -8.6 -23.6 11. IRI/NJO -2.4 -15.9 -15.5 -27.1 9. MTW -12.8 -14.9 -13.3 -29.2 8. LIN -7.8 -17.5 -15.8 -30.8 Mainland 0.0 0.0 0.0 0.0 [Note: a Listed here with NBS numbers of 2002. See Appendix A for full names of regions.]
Table 4: Regional propensities for in-migration (P(rim)), Tanzania 1978-2012
So much for the broad pattern of migration: In looking next at the rural and urban dimensions, it will be
of interest to see whether a similar pattern emerges.
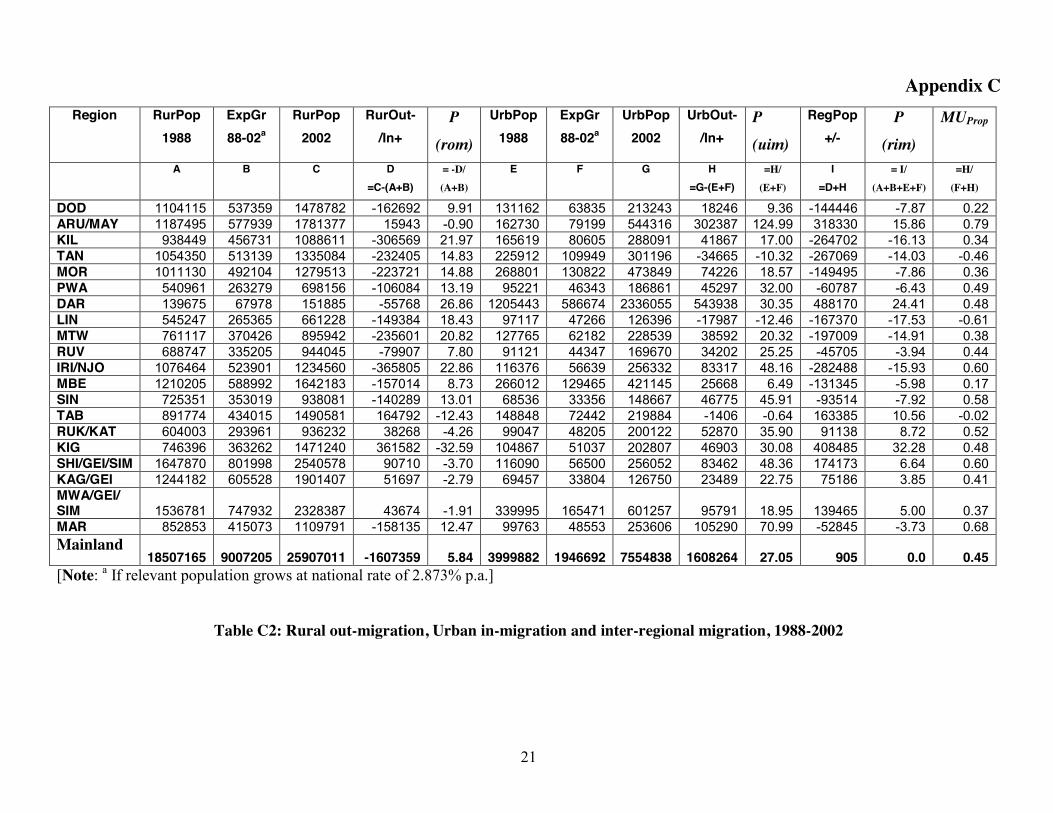
(b) Regional propensities for rural out-migration (P(rom)) Table 5 sets out the regional propensities for rural out-migration, with the regions ordered as in Table 4. Here, we may note first a rising trend in rural net out-migration so that over the whole period some
15% of the expected rural population had migrated either to urban areas in their own region or to
another region. Leaving aside Dar, which had no recorded rural population in 2012, the broad pattern is
consistent with Table 4, with regions towards the top gaining rural (as well as urban) population –
negative P(rom) – while regions in the lower half of the table lost around a third of their rural
populations. However, there are some irregularities. The big rural inflow to Kigoma in 1988-2002

12
stands out – presumably mainly refugees. The inflows to Kagera, Mwanza, Tabora and Shinyanga in
the same period may be connected with artisanal mining, which is thought to have attracted some
750,000 workers to the rural parts of these regions14. Lower down the table, Singida and Dodoma had
relatively modest outflows; Pwani’s on the other hand are rather high – presumably mainly to Dar.
Somewhat surprising are the high outflows from Kilimanjaro, generally regarded a rather prosperous
area.
Regiona 1978-1988 1988-2002 2002-2012 1978-2012 7. DAR -43.6 26.9 100.0 100.0 15. RUK/KAT -14.6 -4.3 3.7 -6.4 2. ARU/MAY -5.4 -0.9 -1.9 -5.4 16. KIG 3.3 -32.6 8.1 -11.4 18. KAG/GEI 3.5 -2.8 -2.6 -2.9 14. TAB 5.0 -12.4 -3.1 -9.8 19. MWA/GEI/SIM 10.2 -1.9 7.1 11.0 12. MBE 6.8 8.7 15.5 24.2 17. SHI/GEI/SIM 1.6 -3.7 11.5 9.8 20. MAR 3.8 12.5 0.4 12.1 10. RUV -0.6 7.8 15.7 20.6 5. MOR 4.8 14.9 5.1 18.6 13. SIN 1.2 13.0 1.9 12.6 6. PWA 14.6 13.2 18.9 33.4 1. DOD 5.8 9.9 8.6 18.3 4. TAN 10.5 14.8 7.8 23.5 3. KIL 14.9 22.0 12.4 34.3 11. IRI/NJO 3.1 22.9 24.1 39.3 9. MTW 15.2 20.8 16.2 36.4 8. LIN 13.0 18.4 18.5 35.7 Mainland 5.2 5.8 8.4 15.1 [Note: a Listed here with NBS numbers of 2002. See Appendix A for full names of regions.]
Table 5: Regional propensities for rural out-migration (P(rom)), Tanzania 1978-2012
Some of the anomalous figures may perhaps be explained by relatively high urbanization in some
regions, providing a destination within the region for rural migrants. If so, it should show up in the
figures next considered.
(c) Regional propensities for urban in-migration (P(uim)) Table 6 sets out the figures for net urban in-migration, with the regions again ordered as in Table 4.
A quick glance at these figures is enough to appreciate that urban in-migration bears little relation to
overall regional in-migration. The highest rates are scattered through the list, with Dar ranked 9th, not 14 Bryceson et al (2012)

13
first. These high P(uim) values indicate that some regions with a relatively low initial urbanization rate
have urbanised more rapidly than some with longer established urban areas. The lowest rate is for
Tabora, suggesting that incomers to this region settled mainly in rural areas; the next lowest rate is for
Lindi, which was the heaviest loser of population, indicating that urbanization in this region had little
attraction for its rural migrants (a situation that may now change as oil and gas related activity picks up
in the vicinity of Lindi and Mtwara towns).
Regiona 1978-1988 1988-2002 2002-2012 1978-2012 7. DAR 18.6 30.4 43.3 88.7 15. RUK/KAT 41.2 35.9 50.9 119.7 2. ARU/MAY 67.3 125.0 6.0 120.1 16. KIG 23.2 30.1 38.1 84.7 18. KAG/GEI 53.5 22.7 69.1 137.7 14. TAB 4.8 -0.6 0.3 2.2 19. MWA/GEI/SIM 74.2 19.0 42.0 104.9 12. MBE 108.4 6.5 63.6 133.3 17. SHI/GEI/SIM 57.0 48.4 20.6 93.4 20. MAR 43.0 71.0 -8.2 55.3 10. RUV 58.8 25.2 53.2 121.1 5. MOR 50.4 18.6 3.0 40.3 13. SIN -10.6 45.9 -11.9 10.0 6. PWA 93.3 32.0 47.9 136.5 1. DOD 16.6 9.4 15.5 33.2 4. TAN 17.2 -10.3 12.3 11.8 3. KIL 85.4 17.0 5.8 54.4 11. IRI/NJO 4.8 48.2 26.4 71.9 9. MTW 4.7 20.3 -2.2 14.9 8. LIN 38.2 -12.5 -1.7 3.9 Mainland 34.1 27.0 29.0 75.8 [Note: a Listed here with NBS numbers of 2002. See Appendix A for full names of regions.]
Table 6: Regional propensities for urban in-migration (P(uim)), Tanzania 1978-2012
A plus point from these observations, with future analytical work in mind, is that it appears that the
forces driving rural out-migration differ from those driving urban in-migration, within as well as
between regions. The fact that urbanization propensities also vary quite markedly between one period
and the next may also be helpful in this respect, if they can be related to parallel variations in
Tanzania’s development trajectory.
To illustrate the contrast between these two propensities, Figure 1 plots P(rom) and P(uim) against the
regions ordered as in Table 4.

14
-20.0
0.0
20.0
40.0
60.0
80.0
100.0
120.0
140.0
160.0
DARRUK
ARUKIG
KAGTAB
MWAMBE SHI
MARRUV
MORSIN
PWADOD
TAN KIL IRI
MTW LIN
PROMPUIM
Figure 1: Regional propensities for rural out-migration (P(rom)) and urban in-migration (Puim)),
with regions ranked by overall in-migration (Dar on the left, Lindi on the right)
(d) Proportion of urban increase attributable to in-migration (MUProp) It has been suggested that the contribution of rural-urban migration to urban growth in sub-Saharan
Africa has been slowing down recently, with natural growth of the already urbanized population
becoming more important (Potts (2009), Christiaensen et al (2013)). However, this does not (yet) seem
to be generally the case in Tanzania, as the figures for MUProp (the proportion of the increase in a
region’s urban population attributable to in-migration) in Table 7 show15. This proportion dropped in
the 1988-2002 period but has since picked up. For most regions, in-migration has accounted for around
half the increase in urban population over 1978 to 2012. However, by the 2002-2012 period, four
regions were losing part of their natural growth (Mara, Singida, Mtwara and Lindi) – indeed, in
Singida’s case, the urban population actually declined – while in another two cases (Morogoro and
Tabora), the contribution of in-migration was very small. These cases were balanced by a contribution
of in-migration well over 50% in most of the remaining regions. We conclude that in Tanzania, rural-
urban migration is still important but not in all regions.
15 The reason for this measure differing from P(uim) can be seen in the formulae at the head of the Appendix C tables. The numerator is the same but the denominator is expected population for P(uim), actual population for MUProp.

15
Regiona 1978-1988 1988-2002 2002-2012 1978-2012 7. DAR 0.43 0.48 0.65 0.57 15. RUK/KAT 0.63 0.52 0.69 0.63 2. ARU/MAY 0.73 0.79 0.21 0.60 16. KIG 0.49 0.48 0.62 0.56 18. KAG/GEI 0.69 0.41 0.75 0.66 14. TAB 0.17 -0.02 0.01 0.03 19. MWA/GEI/SIM 0.75 0.37 0.64 0.59 12. MBE 0.82 0.17 0.73 0.64 17. SHI/GEI/SIM 0.70 0.60 0.47 0.56 20. MAR 0.64 0.68 -0.55 0.43 10. RUV 0.71 0.44 0.70 0.63 5. MOR 0.67 0.36 0.11 0.36 13. SIN -0.77 0.58 -1.05 0.14 6. PWA 0.79 0.49 0.67 0.64 1. DOD 0.41 0.22 0.40 0.34 4. TAN 0.41 -0.46 0.35 0.16 3. KIL 0.78 0.34 0.20 0.42 11. IRI/NJO 0.16 0.60 0.53 0.52 9. MTW 0.16 0.38 -0.10 0.19 8. LIN 0.61 -0.61 -0.08 0.06 Mainland 0.58 0.45 0.55 0.52 [Note: a Listed here with NBS numbers of 2002. See Appendix A for full names of regions.]
Table 7: Proportion of the increase in each region’s urban population attributable to in-migration (MUProp), Tanzania 1978-2012
Next steps
The ultimate objective of this project is to obtain a better understanding of the urbanization process in
Tanzania, with a view to identifying policy interventions that will lead to urbanization making a more
positive contribution to Tanzania’s development than has so far been the case. The findings can be
expected to be relevant to other similarly placed countries in sub-Saharan Africa.
In this first phase of the project, data from the 1967, 1978, 1988, 2002 and 2012 censuses has been
used to quantify the interaction between population growth, internal migration and urbanization,
showing up big differences in the experience of Tanzania’s various regions16. Further elements planned
for this phase of the project are:
x Identification of towns with over 10,000 population in 2012, to link with town populations
derived from previous censuses17;
16 Appendix B provides some estimates of refugee populations in the regions on the census dates; also useful would be to estimate the numbers of artisanal miners and their regional location. 17 Unfortunately, populations for smaller towns have not yet become available although those for regional capitals have – See Working Paper 2.

16
x A check on the effect of boundary changes on the recorded urban populations of the 20 regional
capitals18;
x Investigation of the feasibility of a density-based measure of urbanization as it appears that the
definition of ‘urban’ has not been uniform across previous censuses. A standard density-based
measure, if feasible, would ensure comparability across the period under review.
The outcome of the first two items is reported in Working Paper 2 (‘Tanzania’s Urban Populations,
1967-2012’) and of the third item in Working Paper 3 (‘A Density-based Measure of ‘urban’ for
Tanzania?’).
While it is a useful first step to document what has been happening in this way, policy
recommendations need to rest on an understanding what is driving these processes, i.e. moving from
description to explanation. This will be the focus of the next phase of the project, proposals for which
are now being developed.
References
Barrios S, L Bertinelli & E Strobl (2006) “Climatic change and rural-urban migration: The case of sub-Saharan Africa” Journal of Urban Economics 60(3):357-371
Beegle K, J de Weerdt & S Dercon (2011) “Migration and economic mobility in Tanzania: Evidence from a tracking survey” Review of Economics and Statistics 93(3): 1010-1033
Bruckner M (2012) “Economic growth, size of the agricultural sector, and urbanization in Africa” Journal of Urban Economics 71(1):26-36
Bryceson DF & D Potts (Eds) (2006) African Urban Economies: Viability, Vitality or Vitiation of Major Cities in East and Southern Africa Palgrave Macmillan
Bryceson DF, JB Jonsson, C Kinabo & M Shand (2012) “Unearthing treasure and trouble: Mining as an impetus to urbanization in Tanzania” Journal of Contemporary African Studies 30(4)
Christiaensen L, M Gindelsky & R Jedwab (2013) “Rural push, urban pull … or urban push? New historical evidence from 40 developing countries” (mimeo)
Cohen B (2004) “Urban growth in developing countries: A review of current trends and a caution regarding existing forecasts” World Development 32(1): 23-51
Collier P (1979) “Migration and unemployment: A dynamic general equilibrium analysis applied to Tanzania” Oxford Economic Papers 31(2): 205-36
Fay, M & C Opal (2000) Urbanisation without growth World Bank Policy Research Working Paper No 2412
Gollin D, R Jedwab & D Vollrath (2013) “Urbanisation with and without Industrialisation” (mimeo)
18 The necessary information has not yet been located – See Working Paper 2.

17
Harris J & M Todaro (1970) “Migration, unemployment and development: A two-sector analysis” American Economic Review 97: 87-98
Lall SV, H Selod & Z Shalizi (2006) Rural-urban migration in developing countries: A survey of theoretical predictions and empirical findings World Bank Policy Research Working Paper No 3915
National Bureau of Statistics (NBS), Tanzania:
1967 Population Census, Volume 2 ‘Statistics for Urban Areas’
1978 Population Census, Vol. IV
1988 Population Census, Regional Profiles (20 vols)
2002 Population and Housing Census, General Report & Vol. X
2012 Population and Housing Census, ‘Population distribution by age and sex’ (posted on NBS website, Sept 2013)
Potts D (2006) “Urban growth and urban economies in Eastern and Southern Africa: Trends and prospects”, Chapter 3 in Bryceson D & D Potts (Eds) (2006) African Urban Economies: Viability, Vitality or Vitiation of Major Cities in East and Southern Africa Palgrave Macmillan
Potts D (2009) “The slowing of sub-Saharan Africa’s urbanization: Evidence and implications for urban livelihoods” Environment and Urbanization 21: 253-9
Sabot R H (1979) Economic development and migration: Tanzania 1900-1971 Clarendon Press, Oxford.
World Bank (2009a) The Urban Transition in Tanzania Report No. 44354-TZ v2
World Bank (2009b) World Development Report 2009: Reshaping Economic Geography

18
Appendix A 2012 Regions 2002 Regions Including in 2002
1. Dodoma (DOD) 1. Dodoma (DOD)
2. Arusha (ARU) 2. Arusha (ARU/MAY) All Manyara.
3. Kilimanjaro (KIL) 3. Kilimanjaro (KIL)
4. Tanga (TAN) 4. Tanga (TAN)
5. Morogoro (MOR) 5. Morogoro (MOR)
6. Pwani (PWA) 6. Pwani (PWA)
7. Dar es Salaam (DAR) 7. Dar es Salaam (DAR)
8. Lindi (LIN) 8. Lindi (LIN)
9. Mtwara (MTW) 9. Mtwara (MTW)
10. Ruvuma (RUV) 10. Ruvuma (RUV)
11. Iringa (IRI) 11. Iringa (IRI/NJO) All Njombe.
12. Mbeya (MBE) 12. Mbeya (MBE)
13. Singida (SIN) 13. Singida (SIN)
14. Tabora (TAB) 14. Tabora (TAB)
15. Rukwa (RUK) 15. Rukwa (RUK/KAT) All Katavi
16. Kigoma (KIG) 16. Kigoma (KIG)
17. Shinyanga (SHI) 17. Shinyanga (SHI/GEI/SIM) Maswa, Meatu, Itilima & Bariadi Districts from Simiyu; Bukombe & Mbogwe Districts from Geita.
18. Kagera (KAG) 18. Kagera (KAG/GEI) Chato District from Geita.
19. Mwanza (MWA) 19. Mwanza (MWA/GEI/SIM) Geita & Nyang’hwale Districts from Geita; Busega District from Simiyu.
20. Mara (MAR) 20. Mara (MAR)
21. Manyara (MAY)
22. Njombe (NJO)
23. Katavi (KAT)
24. Simiyu (SIM)
25. Geita (GEI)
The Regions of Tanzania, 2002 and 2012 (NBS numbering)

19
Apppendix B
Refugees in Tanzania According to UNHCR, a first wave of refugees from Burundi came to Tanzania in the 1970s, being
accommodated in camps in Kigoma region and at Mishamo in Rukwa region. Some 162,000 of these
were offered naturalization in 2010, although the process was suspended in 2011 so that the current
status of these people is presently unclear. Two further waves of around 800,000 refugees arrived in
mid-1994 and 1996, coming from DR Congo and Burundi, being mainly accommodated in camps in
Kagera and Kigoma regions.
At the time of the 2002 and 2012 censuses, the numbers recorded by UNHCR are shown below, with
migrant figures19 derived from the 2002 census shown for comparison:
From 2002 Census (Migrants, ‘000s)
2002 UNHCR (Refugees ‘000s)
2012 UNHCR (Refugees ‘000s)
Burundi 654 541 35* DR Congo 163 140 63 Somalia 3 2 Rwanda 44 3 0 TOTAL 796 687 101* Note: * See note to table below.
The numbers (‘000s) in camps in Tanzania at the same dates were:
Region 2002 Census (Migrants, 000s)
Camp (District) UNHCR
2002 UNHCR (Refugees ‘000s)
2012 UNHCR (Refugees ‘000s)
Kigoma 405 Nyarugusu (Kasulu) 56 67 Mtabila 2 (Kasulu) 44 35* Myovosi (Kasulu) 39 Mtendeli (Kibondo) 52 Nduta (Kibondo) 50
Kagera 164 Lukole (Ngara) 111 Rukwa 167 Mishamo (urban) 45 37 Tabora 46 Ulyankulu (urban) 42 TOTAL 782 439 139* Note: * Mtabila camp was closed in 2013, and the occupants repatriated to Burundi. These figures do not include the 162,000 Burundi refugees who have been offered naturalization and mostly remain in the same camps as in 2002.
19 Only figures for regions with more than 10,000 migrants shown; there were also 18,000 migrants from Uganda in Kagera and 14,000 migrants from Mozambique in Mtwara.

20
Appendix C
RurPop 1978
ExpGr
78-88a
RurPop 1988
RurOut- /In+
P
(rom)
UrbPop 1978
ExpGr
78-88a
UrbPop 1988
UrbOut- /In+
P
(uim)
RegPop +/-
P
(rim)
MUProp
A B C D =C-(A+B)
= -D/ (A+B)
E F
G H =G-(E+F)
=H/ (E+F)
I =D+H
= I/ (A+B+E+F)
=H/ (F+H)
DOD 886828 284785 1104115 -67498 5.76 85177 27353 131162 18632 16.56 -48866 -3.81 0.41 ARU/MAY 852588 273790 1187495 61117 -5.43 73635 23646 162730 65449 67.28 126566 10.34 0.73 KIL 834838 268090 938449 -164479 14.91 67599 21708 165619 76312 85.45 -88167 -7.40 0.78 TAN 891803 286383 1054350 -123836 10.51 145964 46873 225912 33075 17.15 -90761 -6.62 0.41 MOR 803959 258174 1011130 -51003 4.80 135305 43450 268801 90046 50.37 39043 3.15 0.67 PWA 479304 153918 540961 -92261 14.57 37282 11972 95221 45967 93.33 -46294 -6.78 0.79 DAR 73645 23649 139675 42381 -43.56 769445 247090 1205443 188908 18.58 231288 20.77 0.43 LIN 474434 152354 545247 -81541 13.01 53190 17081 97117 26846 38.20 -54695 -7.85 0.61 MTW 679463 218195 761117 -136541 15.21 92355 29658 127765 5752 4.71 -130788 -12.83 0.16 RUV 518152 166393 688747 4202 -0.61 43423 13944 91121 33754 58.84 37955 5.12 0.71 IRI/NJO 840968 270058 1076464 -34562 3.11 84076 26999 116376 5301 4.77 -29262 -2.39 0.16 MBE 983241 315746 1210205 -88782 6.83 96623 31028 266012 138361 108.39 49578 3.48 0.82 SIN 555939 178528 725351 -9116 1.24 58010 18629 68536 -8103 -10.57 -17218 -2.12 -0.77 TAB 710408 228132 891774 -46766 4.98 107499 34521 148848 6828 4.81 -39938 -3.70 0.17 RUK/KAT 398805 128068 604003 77130 -14.64 53092 17049 99047 28906 41.21 106036 17.76 0.63 KIG 584503 187700 746396 -25807 3.34 64438 20693 104867 19736 23.18 -6071 -0.71 0.49 SHI/GEI/SIM 1267580 407056 1647870 -26766 1.60 55955 17969 116090 42166 57.04 15401 0.88 0.70 KAG/GEI 975506 313262 1244182 -44586 3.46 34261 11002 69457 24194 53.45 -20393 -1.53 0.69 MWA/GEI/SIM 1295607 416056 1536781 -174882 10.22 147772 47454 339995 144769 74.15 -30113 -1.58 0.75 MAR 671007 215479 852853 -33633 3.79 52820 16962 99763 29981 42.96 -3652 -0.38 0.64 Mainland
14778578 4745817 18507165 -1017230 5.21 2257921 725082 3999882 1016879 34.09 -351 0.0 0.58 [Note: a If relevant population grows at national rate of 2.824% p.a.]
Table C1: Rural out-migration, Urban in-migration and inter-regional migration, 1978-1988
21
Appendix C Region RurPop
1988 ExpGr 88-02a
RurPop 2002
RurOut- /In+
P
(rom)
UrbPop 1988
ExpGr 88-02a
UrbPop 2002
UrbOut- /In+
P
(uim)
RegPop +/-
P
(rim)
MUProp
A B C D =C-(A+B)
= -D/ (A+B)
E F G H =G-(E+F)
=H/ (E+F)
I =D+H
= I/ (A+B+E+F)
=H/ (F+H)
DOD 1104115 537359 1478782 -162692 9.91 131162 63835 213243 18246 9.36 -144446 -7.87 0.22 ARU/MAY 1187495 577939 1781377 15943 -0.90 162730 79199 544316 302387 124.99 318330 15.86 0.79 KIL 938449 456731 1088611 -306569 21.97 165619 80605 288091 41867 17.00 -264702 -16.13 0.34 TAN 1054350 513139 1335084 -232405 14.83 225912 109949 301196 -34665 -10.32 -267069 -14.03 -0.46 MOR 1011130 492104 1279513 -223721 14.88 268801 130822 473849 74226 18.57 -149495 -7.86 0.36 PWA 540961 263279 698156 -106084 13.19 95221 46343 186861 45297 32.00 -60787 -6.43 0.49 DAR 139675 67978 151885 -55768 26.86 1205443 586674 2336055 543938 30.35 488170 24.41 0.48 LIN 545247 265365 661228 -149384 18.43 97117 47266 126396 -17987 -12.46 -167370 -17.53 -0.61 MTW 761117 370426 895942 -235601 20.82 127765 62182 228539 38592 20.32 -197009 -14.91 0.38 RUV 688747 335205 944045 -79907 7.80 91121 44347 169670 34202 25.25 -45705 -3.94 0.44 IRI/NJO 1076464 523901 1234560 -365805 22.86 116376 56639 256332 83317 48.16 -282488 -15.93 0.60 MBE 1210205 588992 1642183 -157014 8.73 266012 129465 421145 25668 6.49 -131345 -5.98 0.17 SIN 725351 353019 938081 -140289 13.01 68536 33356 148667 46775 45.91 -93514 -7.92 0.58 TAB 891774 434015 1490581 164792 -12.43 148848 72442 219884 -1406 -0.64 163385 10.56 -0.02 RUK/KAT 604003 293961 936232 38268 -4.26 99047 48205 200122 52870 35.90 91138 8.72 0.52 KIG 746396 363262 1471240 361582 -32.59 104867 51037 202807 46903 30.08 408485 32.28 0.48 SHI/GEI/SIM 1647870 801998 2540578 90710 -3.70 116090 56500 256052 83462 48.36 174173 6.64 0.60 KAG/GEI 1244182 605528 1901407 51697 -2.79 69457 33804 126750 23489 22.75 75186 3.85 0.41 MWA/GEI/ SIM 1536781 747932 2328387 43674 -1.91 339995 165471 601257 95791 18.95 139465 5.00 0.37 MAR 852853 415073 1109791 -158135 12.47 99763 48553 253606 105290 70.99 -52845 -3.73 0.68 Mainland
18507165 9007205 25907011 -1607359 5.84 3999882 1946692 7554838 1608264 27.05 905 0.0 0.45 [Note: a If relevant population grows at national rate of 2.873% p.a.]
Table C2: Rural out-migration, Urban in-migration and inter-regional migration, 1988-2002

22
Appendix C Region RurPop
2002 ExpGr 02-12a
RurPop 2012
RurOut- /In+
P
(rom)
UrbPop 2002
ExpGr 02-12a
UrbPop 2012
UrbOut- /In+
P
(uim)
RegPop +/-
P
(rim)
MUPro
p
A B C D =C-(A+B)
= -D/ (A+B)
E F G H =G-(E+F)
=H/ (E+F)
I =D+H
= I/ (A+B+E+
F)
=H/ (F+H)
DOD 1478782 449192 1762394 -165580 8.59 213243 64774 321194 43177 15.53 -122403 -5.55 0.40 ARU/MAY 1781377 541107 2367101 44617 -1.92 544316 165340 752340 42684 6.01 87300 2.88 0.21 KIL 1088611 330674 1242712 -176573 12.44 288091 87510 397375 21774 5.80 -154799 -8.62 0.20 TAN 1335084 405542 1604297 -136329 7.83 301196 91491 440908 48221 12.28 -88108 -4.13 0.35 MOR 1279513 388662 1582434 -85741 5.14 473849 143935 636058 18274 2.96 -67468 -2.95 0.11 PWA 698156 212070 738297 -171929 18.89 186861 56761 360371 116749 47.92 -55180 -4.78 0.67 DAR 151885 46136 0 -198021 100.0 2336055 709595 4364541 1318891 43.30 1120870 34.56 0.65 LIN 661228 200853 702603 -159478 18.50 126396 38394 162049 -2741 -1.66 -162219 -15.80 -0.08 MTW 895942 272149 979350 -188741 16.16 228539 69421 291504 -6456 -2.17 -195197 -13.31 -0.10 RUV 944045 286761 1038071 -192735 15.66 169670 51539 338820 117611 53.17 -75124 -5.17 0.70 IRI/NJO 1234560 375007 1221079 -388488 24.14 256332 77863 422256 88061 26.35 -300427 -15.46 0.53 MBE 1642183 498826 1809298 -331711 15.49 421145 127926 898112 349041 63.57 17330 0.64 0.73 SIN 938081 284950 1199936 -23095 1.89 148667 45159 170701 -23125 -11.93 -46219 -3.26 -1.05 TAB 1490581 452776 2004114 60757 -3.13 219884 66792 287509 833 0.29 61591 2.76 0.01 RUK/KAT 936232 284388 1175534 -45086 3.69 200122 60789 393609 132698 50.86 87612 5.91 0.69 KIG 1471240 446901 1762669 -155472 8.11 202807 61604 365261 100850 38.14 -54622 -2.50 0.62 SHI/GEI/ SIM 2540578 771721 2931269 -381030 11.50 256052 77778 402563 68733 20.59 -312296 -8.57 0.47 KAG/GEI 1901407 577567 2543717 64743 -2.61 126750 38501 279433 114182 69.10 178924 6.77 0.75 MWA/ SIM/GEI 2328387 707266 2818823 -216830 7.14 601257 182637 1113222 329328 42.01 112498 2.95 0.64 MAR 1109791 337108 1440418 -6481 0.45 253606 77035 303412 -27229 -8.24 -33710 -1.90 -0.55 Mainland
25907011 7869459 30924116 -2852354 8.44 7554838 2294842
12701238
2851558 28.95 -796 0.00 0.55 [Note: a If relevant population grows at national rate of 2.688% p.a.]
Table C3: Rural out-migration, Urban in-migration and inter-regional migration, 2002-2012

Working paper
Tanzania’s Urban Population
1967-2012
Angela Ambroz Hugh Wenban-Smith
April 2014

1
INTERNATIONAL GROWTH CENTRE (IGC)
Project on urbanization in Tanzania Phase 1: Data assembly and preliminary analysis
Working Paper 2
TANZANIA’S URBAN POPULATIONS, 1967-2012
Angela Ambroz1 & H B Wenban-Smith2
Final Version: 4 April 2014
1 IGC In-country Economist, Tanzania ([email protected]) 2 Independent Research Economist ([email protected])

2
TANZANIA’S URBAN POPULATIONS, 1967-2012
Angela Ambroz & Hugh Wenban-Smith (Final Version: 4 April 2014)
Introduction In this working paper, we track the populations of Tanzania’s larger towns using census data from
1967, 1978, 1988, 2002 and 20123. This data is set out in the Appendix A tables, which show, for each
region, the population for the regional capital, other large towns, and rural areas. For 2012, regional
capital populations and total regional urban populations can be derived from Volume 2 of the
Tanzanian National Bureau of Statistics 2012 Census Report but populations for smaller towns have
not yet been published. This paper therefore discusses the evolution of the individual regional capitals
and considers other urban areas collectively, rather than individually.
Data sources: Pre-2012 urban populations
A full discussion of the derivation of the pre-2012 population figures can be found in Wenban-Smith
(2013a). In brief, in addition to the census reports for these years, comparisons were made with figures
published on two websites to clarify some uncertainties and to fill gaps (particularly for 1988):
Thomas Brinkhoff: http://www.citypopulation.de/Tanzania.html and
E-Geopolis: http://www.e-geopolis.eu
The procedure then was: Where a census figure was available for a recognized town, this was taken as
the best estimate; where a census figure was not available, the Thomas Brinkhoff figure was accepted,
if available; otherwise, the E-Geopolis figure adjusted for the 2-year difference in timing was taken. In
a few cases (Tukuyu, Kilosa and Mpanda in 1988; Arusha4, Kilosa, Tumbi/Kibaha, Mpanda and
Mwanza in 2002), the population was inferred using a mix of census and other information.
Data sources: 2012 urban populations
The 2012 Census volume on ‘Migration and Urbanisation’ is not scheduled to be published until end of
May 2014. However, the volume ‘Population Distribution by Age and Sex’ published in September
3 We would like to acknowledge here information provided by Mr Ruyobya and Mr Kuchengo of the Census Unit of the National Bureau of Statistics, Tanzania. 4 Arusha poses a particular difficulty. The published figure is 333,791. However, the census report gives the total population of Arusha District as 274,668, of which 8,044 were in rural wards and 41,647 in mixed wards, suggesting an urban population of about 260,000. Nevertheless, the higher figure has been adopted in Appendix A, to avoid a large unallocated ‘other urban’ number.
3
2013 (NBS, 2013) includes a rural/urban split for regions and districts, down to the ward level. This
enables urban populations for areas which do not include any mixed wards to be evaluated. In this way,
populations for Municipal Councils and most Town Councils can be established – although they should
perhaps be regarded as provisional until full publication in May. Smaller urban areas usually include a
number of mixed wards so that population figures for them must await publication by NBS.
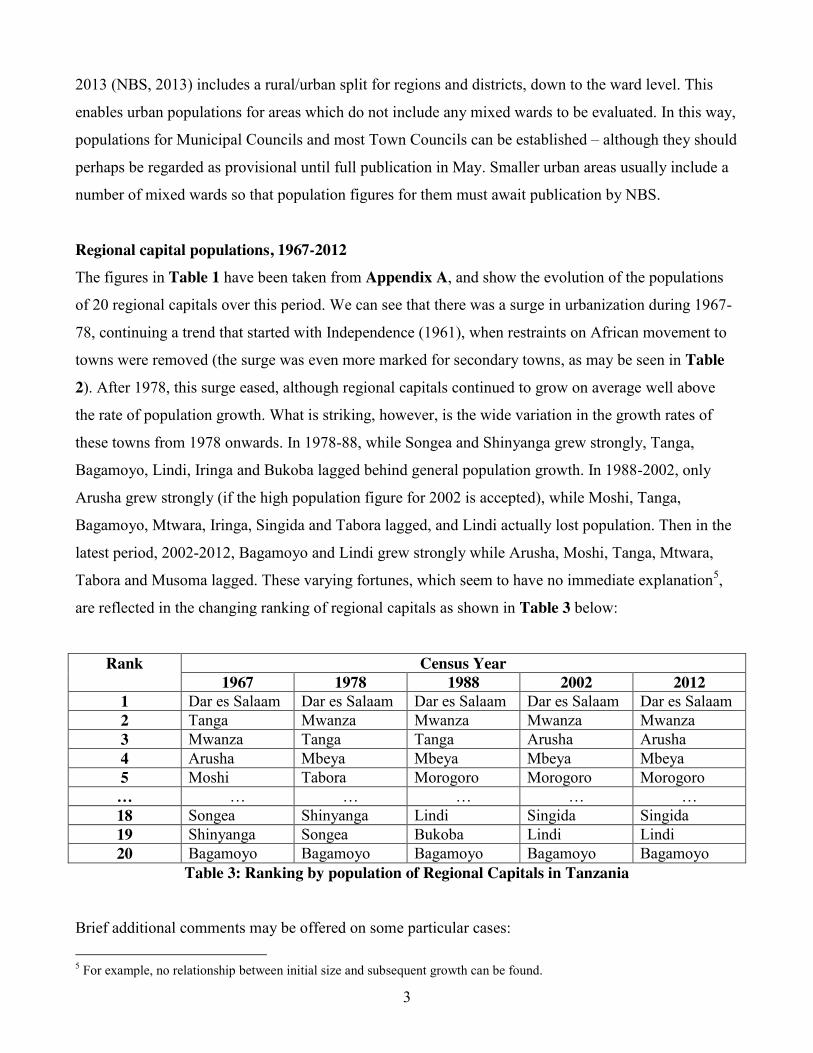
Regional capital populations, 1967-2012
The figures in Table 1 have been taken from Appendix A, and show the evolution of the populations
of 20 regional capitals over this period. We can see that there was a surge in urbanization during 1967-
78, continuing a trend that started with Independence (1961), when restraints on African movement to
towns were removed (the surge was even more marked for secondary towns, as may be seen in Table 2). After 1978, this surge eased, although regional capitals continued to grow on average well above
the rate of population growth. What is striking, however, is the wide variation in the growth rates of
these towns from 1978 onwards. In 1978-88, while Songea and Shinyanga grew strongly, Tanga,
Bagamoyo, Lindi, Iringa and Bukoba lagged behind general population growth. In 1988-2002, only
Arusha grew strongly (if the high population figure for 2002 is accepted), while Moshi, Tanga,
Bagamoyo, Mtwara, Iringa, Singida and Tabora lagged, and Lindi actually lost population. Then in the
latest period, 2002-2012, Bagamoyo and Lindi grew strongly while Arusha, Moshi, Tanga, Mtwara,
Tabora and Musoma lagged. These varying fortunes, which seem to have no immediate explanation5,
are reflected in the changing ranking of regional capitals as shown in Table 3 below:
Rank Census Year 1967 1978 1988 2002 2012
1 Dar es Salaam Dar es Salaam Dar es Salaam Dar es Salaam Dar es Salaam 2 Tanga Mwanza Mwanza Mwanza Mwanza 3 Mwanza Tanga Tanga Arusha Arusha 4 Arusha Mbeya Mbeya Mbeya Mbeya 5 Moshi Tabora Morogoro Morogoro Morogoro … … … … … … 18 Songea Shinyanga Lindi Singida Singida 19 Shinyanga Songea Bukoba Lindi Lindi 20 Bagamoyo Bagamoyo Bagamoyo Bagamoyo Bagamoyo
Table 3: Ranking by population of Regional Capitals in Tanzania
Brief additional comments may be offered on some particular cases: 5 For example, no relationship between initial size and subsequent growth can be found.

4
Dodoma: The somewhat muted growth of Dodoma, despite being selected by popular referendum as
Tanzania’s new capital in 1973, is explained by failure to follow through that decision, with the
majority of government departments remaining in Dar. It is also unfortunately the case that Dodoma
has few particular advantages, apart from a central location.
Arusha: Arusha has emerged as Tanzania’s third city. This may owe something to a generous
definition of ‘urban’, though Arusha has also attracted considerable activity associated with game park
tourism and its role as the location for the International Criminal Tribunal for Rwanda .
Moshi: The relatively slow growth of Moshi is a puzzle, given its position as capital of the prosperous
Kilimanjaro region. However, Table 2 shows relatively fast growth of other towns in the region,
particularly during 1978-88.
Tanga: This is another town that has grown relatively slowly, having been the second biggest city in
Tanzania in 1967. Failure of its port activities to flourish in the face of competition from Dar and
Mombasa may provide part of the explanation.
Bagamoyo: Although Bagamoyo has been included in this analysis as capital of Pwani region, it does
not really fulfil that function. In fact, Pwani is largely administered from Dar. A more appropriate
treatment might be to view Dar and Pwani regions as a single entity, with Bagamoyo seen as a
secondary town. As Appendix A shows, Kibaha in Pwani region, which is virtually a commuter suburb
to Dar now, is nearly twice as large as Bagamoyo.
Lindi and Mtwara: These two regions have been in long-term decline with substantial rural out-
migration (Wenban-Smith, 2013b). However, Lindi is now the site of an upturn in activity following oil
and gas discoveries in the area. This likely explains its recent growth, though Mtwara does not yet
appear to have benefited.
Mbeya: The main town of the Southern Highlands, Mbeya grew particularly rapidly during 1978-88.
Table 2 shows that secondary towns in the region also grew rapidly then. The region benefits from a
good climate, prospering agriculture, and the construction of the Tazara railway. However, there has
been little research to flesh out these conjectures. Mbeya would make an excellent case study of
urbanization in Tanzania.
Shinyanga: Shinyanga grew strongly in both 1967-78 and 1978-88. The town is close to the former
Williamson Diamond Mines and there has been considerable growth in artisanal mining in the area.
This may have boosted the town’s population, although most of the mining activities are in rural areas.
More information is needed about the location of artisanal mining activity.

5
Effect of boundary changes As the populations of Tanzania’s cities and towns have grown, their boundaries have expanded. In
theory this should be reflected in gazetted changes but this does not always happen, or may only do so
after some lapse of time. In the census reports, what is considered to be urban is built bottom up. The
smallest census units, enumeration areas (EAs) are classified as either ‘urban’ or ‘rural’6. A number of
EAs then make up a ward. A ward may thus be ‘urban’, ‘rural’ or ‘mixed’, depending on the
classification of its constituent EAs. The urban populations reported in the censuses include only EAs
classified as ‘urban’, so counting only part of the populations of ‘mixed’ wards, even though some of
these wards may effectively be part of the same town. With successive censuses, EAs and wards which
were previously classified as ‘rural’ or ‘mixed’ may evolve to become ‘urban’. Ward boundaries also
change over time: sometimes due to increasing population (when populous wards may be sub-divided);
sometimes, it is said, due to gerrymandering (anecdotal evidence indicates that ward boundaries are
more likely to change in the months leading up to an election – this would be an intriguing area of
future research).
In an attempt to assess the quantitative significance of shifting urban boundaries for urban growth and
migration, we sought historical data from the University of Dar es Salaam, the Ministry of Lands and
Settlements, and the National Bureau of Statistics. Two avenues of enquiry seemed worth pursuing: (i)
locating the government gazettes which are supposed to record boundary changes, and (ii) locating
historic maps from which boundary changes might be deduced. Unfortunately, up to the time of
writing, neither line of enquiry has been fruitful.
Secondary town populations, 1967-2012 Turning to Table 2, which shows the evolution of secondary towns, there is less to comment on.
Overall, growth of these towns has been faster than for regional capitals. By 1978, quite a few smaller
towns which had not counted as urban in 1967 had arisen, and these continued to grow during 1978-88,
particularly in Kilimanjaro, Mbeya, and Mwanza regions7. Growth slowed during 1988-2002 but still
averaged above 5% per year. Growth continued during 2002-2012 but with a wider spread of rates,
with secondary towns in Lindi and Singida regions actually losing population. At the same time, there
was stronger growth of secondary towns in Mbeya region (over 10% per year), and, in 10 other regions, 6 However, as noted elsewhere, no central definition of ‘urban’ has been imposed, the judgement being left to local authorities. 7 On the reasonable assumption that settlements not classified as urban in the base year did not then have zero population, these growth rates are overstated, but without additional information, we cannot say by how much.
6
secondary towns grew by more than 5% per year. It may be possible to comment further when more
information on individual smaller towns is available.
Conclusions
We have commented in our first Working Paper on data limitations. It is appropriate to add a reminder
here. First, the definition of ‘urban’ in the Tanzanian censuses is not completely clear, resting mainly
on the judgment of district officials. It is possible that some of the changes recorded reflect changing
definitions as well as actual urban growth. Secondly, there is the question how urban boundary changes
have affected the story. Thirdly, some developments that might be regarded as urbanization, such as
mining settlements and refugee camps, appear to have been classed as rural. Nevertheless, we think that
the figures presented can be taken as giving a reasonable broad picture of urbanization trends in
Tanzania.
This working paper thus adds detail to the analysis reported in Wenban-Smith (2013b), providing more
material to inform the further work proposed for Phase 2 of this project. While further refinement of the
census statistics would no doubt be possible, we suggest that detailed case studies of the development
of individual towns would be more helpful in throwing fresh light on the urbanization process in
Tanzania.
References
Tanzania Census Reports National Bureau of Statistics,1967 Population Census, Volume 2 ‘Statistics for Urban Areas’ National Bureau of Statistics,1978 Population Census, Volume IV National Bureau of Statistics,1988 Population Census, Regional Profiles (20 volumes) National Bureau of Statistics, 2002 Population and Housing Census, General Report & Volume X National Bureau of Statistics, 2012 Population and Housing Census, Volume 2 ‘Population Distribution by Age and Sex’
Wenban-Smith, H B (2013a) Urbanisation in Tanzania, 1967-2002: What the census reports do (and do not) tell us (Unpublished working paper)
Wenban-Smith, H B (2013b) Population Growth, Internal Migration and Urbanisation in Tanzania, 1967-2012: A Census Based Regional Analysis (Working Paper No.1, IGC project on Urbanisation in Tanzania).

7
Regional Capital
Population of Regional Capitals Growth rate (% p.a.) 1967 1978 1988 2002 2012 67-78 78-88 88-02 02-12
Dodoma 23559 45807 83205 150604* 213636 6.23 6.15 4.33 3.56 Arusha 32452 55223 102544 333791** 416442 4.95 6.38 8.80 2.24 Moshi 26864 52046 96645 144336 184292 6.20 6.38 2.91 2.47 Tanga 61058 103399 137364 172557* 221127 4.91 2.88 1.64 2.51 Morogoro 25262 60782 117593 209058* 305840 8.31 6.82 4.20 3.88 Bagamoyo 5112 16272 21184 28368 74788*** 11.10 2.67 2.11 10.18*** Dar es Salaam 272821 769445 1205443 2336055 4364541 9.88 4.59 4.84 6.45 Lindi 13352 27312 33014 29178 78841 6.72 1.91 -0.88 10.45 Mtwara 20413 48491 66878 79277* 100626 8.18 3.27 1.22 2.41 Songea 5430 17955 52985 98683* 203309 11.49 11.43 4.54 7.50 Iringa 21746 57164 73516 102208* 151345 9.18 2.55 2.38 4.00 Mbeya 12479 76601 130798 232596* 385279 17.93 5.50 4.20 5.18 Singida 9478 29258 39630 58153 85242 10.79 3.08 2.78 3.90 Tabora 21012 67388 92532 126089* 160608 11.18 3.22 2.23 2.45 Sumbawanga 0 28586 46631 74890* 124204 5.02 3.44 5.19 Kigoma/Ujiji 21369 50075 74224 131792* 215458 8.05 4.01 4.19 5.04 Shinyanga 5135 20439 46802 73921* 103795 13.38 8.64 3.32 3.45 Bukoba 8141 21547 28316 59157* 128796 9.25 2.77 5.40 8.09 Mwanza 34861 110553 172287 385810* 706453 11.06 4.54 5.93 6.24 Musoma 15412 31051 68364 104851* 134327 6.58 8.21 3.10 2.51 TOTAL 635956 1689394 2689955 4931374 8358949 9.29 4.76 4.42 5.42 [Notes: * From Thomas Brinkhoff: http://www.citypopulation.de/Tanzania.html ** See F/N 4 (p.2) *** Provisional, may include some mixed wards All other figures from Tanzania Census Reports listed in References.]
Table 1: Evolution of the populations of Tanzanian regional capitals, 1967-2012

8
Region Urban Population (excl. Regional Capitals) Growth rate (% p.a.) 1967 1978 1988 2002 2012 67-78 78-88 88-02 02-12
DOD 6943 39370 47957 62639 107558 17.09 1.99 1.93 5.56 ARU/MAY 0 18412 60186 210525 335898 12.57 9.36 4.78 KIL 0 15553 68974 143755 213083 16.06 5.39 4.01 TAN 11433 42565 88548 128639 219781 12.69 7.60 2.70 5.50 MOR 6321 74523 151208 264791 330218 25.14 7.33 4.08 2.23 PWA 0 21010 74037 158493 285583 13.42 5.59 6.07 DAR 0 0 0 0 0 LIN 3751 25878 64103 97218 83208 19.19 9.50 3.02 -1.54 MTW 0 43864 60887 149262 190878 3.33 6.61 2.49 RUV 0 25468 38136 70987 135511 4.12 4.54 6.68 IRI/NJO 0 26912 42860 154124 270911 4.76 9.57 5.80 MBE 6487 20022 135214 188549 512833 10.79 21.05 2.40 10.52 SIN 0 28752 28906 90514 85459 0.05 8.49 -0.57 TAB 0 40111 56316 93795 126901 3.45 3.71 3.07 RUK/KAT 0 24506 52416 125232 269405 7.90 6.42 7.96 KIG 0 14363 30643 71015 149803 7.87 6.19 7.75 SHI/GEI/SIM 10594 35516 69288 182131 298768 11.62 6.91 7.15 5.07 KAG/GEI 0 12714 41141 67593 150637 12.46 3.61 8.34 MWA/GEI/SIM 3607 37219 167708 215447 406769 23.64 16.25 1.81 6.56 MAR 0 21769 31399 148755 169085 3.73 11.75 1.29 TOTAL 49136 568527 1309927 2623464 4342289 24.93a 8.71 5.09 5.17 Note: a Does not take into account 1967 populations of smaller settlements not then considered to be urban.
Table 2: Evolution of the populations of Tanzania’s smaller towns, 1967-2012
9
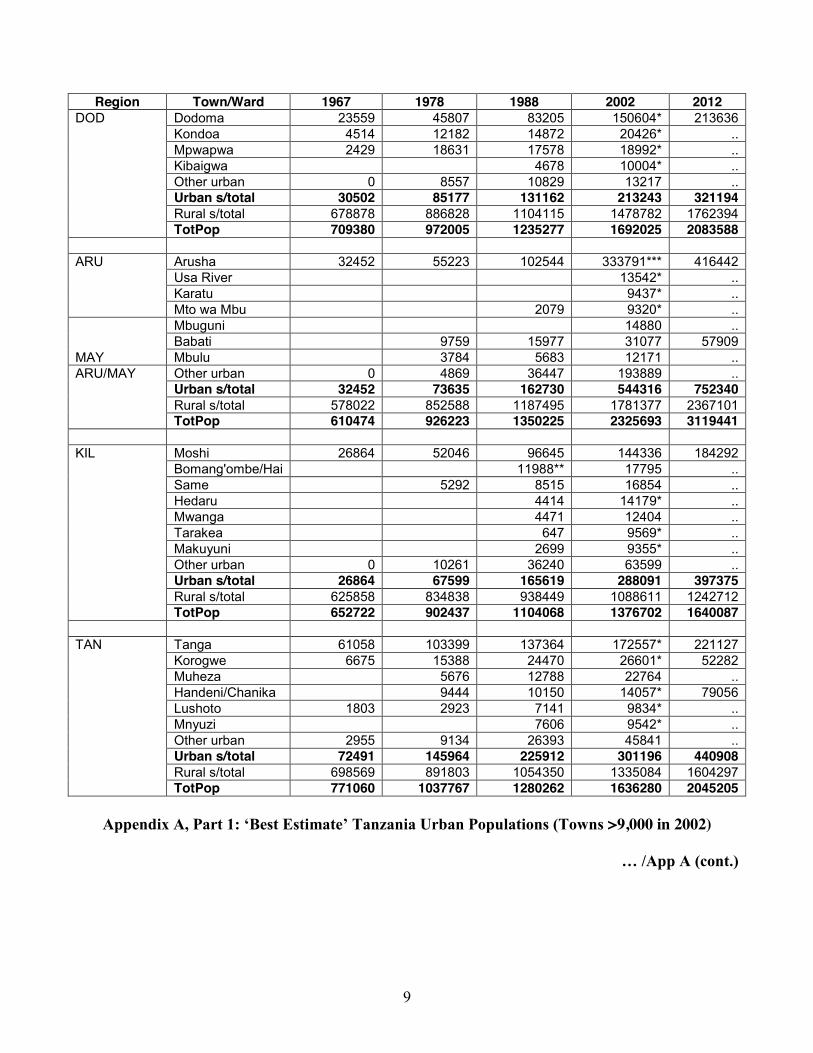
Region Town/Ward 1967 1978 1988 2002 2012
DOD Dodoma 23559 45807 83205 150604* 213636 Kondoa 4514 12182 14872 20426* .. Mpwapwa 2429 18631 17578 18992* .. Kibaigwa 4678 10004* .. Other urban 0 8557 10829 13217 .. Urban s/total 30502 85177 131162 213243 321194 Rural s/total 678878 886828 1104115 1478782 1762394 TotPop 709380 972005 1235277 1692025 2083588
ARU Arusha 32452 55223 102544 333791*** 416442
Usa River 13542* .. Karatu 9437* .. Mto wa Mbu 2079 9320* ..
MAY
Mbuguni 14880 .. Babati 9759 15977 31077 57909 Mbulu 3784 5683 12171 ..
ARU/MAY Other urban 0 4869 36447 193889 .. Urban s/total 32452 73635 162730 544316 752340 Rural s/total 578022 852588 1187495 1781377 2367101 TotPop 610474 926223 1350225 2325693 3119441
KIL Moshi 26864 52046 96645 144336 184292
Bomang'ombe/Hai 11988** 17795 .. Same 5292 8515 16854 .. Hedaru 4414 14179* .. Mwanga 4471 12404 .. Tarakea 647 9569* .. Makuyuni 2699 9355* .. Other urban 0 10261 36240 63599 .. Urban s/total 26864 67599 165619 288091 397375 Rural s/total 625858 834838 938449 1088611 1242712 TotPop 652722 902437 1104068 1376702 1640087
TAN Tanga 61058 103399 137364 172557* 221127
Korogwe 6675 15388 24470 26601* 52282 Muheza 5676 12788 22764 .. Handeni/Chanika 9444 10150 14057* 79056 Lushoto 1803 2923 7141 9834* .. Mnyuzi 7606 9542* .. Other urban 2955 9134 26393 45841 .. Urban s/total 72491 145964 225912 301196 440908 Rural s/total 698569 891803 1054350 1335084 1604297 TotPop 771060 1037767 1280262 1636280 2045205
Appendix A, Part 1: ‘Best Estimate’ Tanzania Urban Populations (Towns >9,000 in 2002)
… /App A (cont.)

10
Region Town/Ward 1967 1978 1988 2002 2012
MOR Morogoro 25262 60782 117593 209058* 305840 Ifakara 15250 27918 41606* .. Kidatu-Kidodi 21884 30430 38486* .. Kilosa 4458 12886 22903 18260 .. Gairo (11847**) 9595 16982* .. Mlimba 13740* .. Mvomero 7966 12576* .. Mtibwa 12348** .. Mang'ula 11233 12083* .. Mikumi 5508 5321 11778* .. Kimamba (A+B) 1863 9164 8909 10562
..
Dumila 9650* .. Other urban 0 9831 26933 66720 .. Urban s/total 31583 135305 268801 473849 636058 Rural s/total 653521 803959 1011130 1279513 1582434 TotPop 685104 939264 1279931 1753362 2218492
PWA Kibaha/Tumbi 2817 8443 42503* 128488
Bagamoyo 5112 16272 21184 28368* 74788? Mlandizi 6484 11268 17324* .. Kibiti 9594 11395* .. Chalinze 11902 10469* .. Ikwiriri 4448 10029* .. Kilindoni 4033 5728 9463* .. Other urban 0 7676 22654 57310 .. Urban s/total 5112 37282 95221 186861 360371 Rural s/total 506394 479304 540961 698156 738297 TotPop 511506 516586 636182 885017 1098668
DAR Dar es Salaam 272821 769445 1205443 2336055 4364541
Rural s/total 0 73645 139675 151233 0 TotPop 272821 843090 1345118 2487288 4364541
LIN Lindi 13352 27312 33014 29178 78841
Nachingwea 3751 8886 14350 18810* .. Nambambo 14458 .. Liwale 7260 11862 14096* .. Ruangwa 6539 9605* .. Narunyu 9394* .. Other urban 0 9732 31352 30855 .. Urban s/total 17103 53190 97117 126396 162049 Rural s/total 474434 545247 661228 702603 TotPop see Mtwara 527624 642364 787624 864652
Appendix A, Part 2: ‘Best Estimate’ Tanzania Urban Populations (Towns >9,000 in 2002)
… /App A (cont.)

11
Region Town/Ward 1967 1978 1988 2002 2012
MTW Mtwara 20413 48491 66878 79277* 100626 Masasi 13129 27861 34172 58314 Newala/Luchingu 18395 12896 16910* .. Mkoma 11001** .. Tandahimba 5322 10713* .. Nanyamba 6898 9872* .. Mahuta 6668 7910 9460* .. Ndanda 9234* .. Other urban 0 5672 0 47900 .. Urban s/total 20413 92355 127765 228539 291504 Rural s/total 1020733 679463 761117 895942 979350 TotPop 1041146 771818 888882 1124481 1270854
RUV Songea 5430 17955 52985 98683* 203309
Tunduru/Mlingoti 18160 21737 24512* .. Mbinga 7308 9389 15359* .. Other urban 0 0 7010 31116 .. Urban s/total 5430 43423 91121 169670 338820 Rural s/total 387613 518152 688747 944045 1038171 TotPop 393043 561575 779868 1113715 1376991
IRI/NJO Iringa 21746 57164 73516 102208* 151345
Makambako 9097 15489 35919* 57288 Njombe 5874 7870 34630* 64122 Ilula 17065* .. Mafinga 11414 12818 16612* 51902 Other urban 0 527 6683 49898 .. Urban s/total 21746 84076 116376 256332 422256 Rural s/total 668159 840968 1076464 1234560 1221079 TotPop 689905 925044 1192840 1490892 1643335
MBE Mbeya 12479 76601 130798 232596* 385279
Utengule 17804 30816* .. Tunduma (10961**) 12077 28237* 97562 Vwawa 1585 6716 19298* .. Kyela 4906 10294 17602* .. Tukuyu 4089 7081 11600*** 15856* .. Ubaruku 12685* .. Rujewa 9337 9413* .. Other urban 2398 6450 67386 54642 .. Urban s/total 18966 96623 266012 421145 898112 Rural s/total 950087 983241 1210205 1642183 1809298 TotPop 969053 1079864 1476217 2063328 2707410
Appendix A, Part 3: ‘Best Estimate’ Tanzania Urban Populations (Towns >9,000 in 2002)
… /App A (cont.)

12
Region Town/Ward 1967 1978 1988 2002 2012
SIN Singida 9478 29258 39630 58153 85242 Manyoni 8157 10981 16645* .. Itigi 6729 6469 14362* .. Kiomboi 9039 6869 11350* .. Other urban 0 4827 4587 48157 .. Urban s/total 9478 58010 68536 148667 170701 Rural s/total 448460 555939 725351 938081 1199936 TotPop 457938 613949 793887 1086748 1370637
TAB Tabora 21012 67388 92532 126089* 160608
Nzega 9542 14965 24347 .. Urambo 10692 11830 18913* .. Igunga 4847 8607 15553* .. Sikonge 5114 9506* .. Other urban 0 15030 15800 25476 .. Urban s/total 21012 107499 148848 219884 287509 Rural s/total 541859 710408 891774 1490581 2004114 TotPop 562871 817907 1040622 1710465 2291623
RUK/KAT Sumbawanga 28586 46631 74890* 124204
Mpanda/Kashaulili 13450 19305 26636 81540 Namanyere 10985 15638* .. Kirando 9936* .. Laela 9745* .. Chala 9046* .. Other urban 0 11056 22126 54330 .. Urban s/total 0 53092 99047 200122 393609 Rural s/total 398805 604003 936232 1175534 TotPop see Mbeya 451897 703050 1136354 1569143
KIG Kigoma/Ujiji 21369 50075 74224 131792* 215458
Kasulu 10838 17964 33668 67704 Nguruka 20413* .. Kibondo 3525 6108 13241* .. Other urban 0 0 6571 3693 .. Urban s/total 21369 64438 104867 202807 365261 Rural s/total 452074 584503 746396 1471240 1762669 TotPop 473443 648941 851263 1674047 2127930
SHI/GEI/SIM Shinyanga 5135 20439 46802 73921* 103795
Kahama 3211 7637 11383 26003** 95087 Nyalikungu/Maswa 6704 9782 17384* .. Ushirombo 5250** 16016* .. Bariadi 4603 10800 15462* .. Isagehe 10909* .. Masumbwe 10791* .. Diobahika 10616* .. Bugarama 9248* .. Other urban 7383 16572 37323 65702 .. Urban s/total 15729 55955 116090 256052 402563 Rural s/total 883739 1267580 1647870 2540578 2931269 TotPop 899468 1323535 1763960 2796630 3333832
Appendix A, Part 4: ‘Best Estimate’ Tanzania Urban Populations (Towns >9,000 in 2002) … /App A (cont.)

13
Region Town/Ward 1967 1978 1988 2002 2012
KAG/GEI Bukoba 8141 21547 28316 59157* 128796 Chato 9022 13540* .. Biharamulo 3349 5469 9585* .. Buseresere 9202* .. Other urban 0 9365 26650 35266 .. Urban s/total 8141 34261 69457 126750 279433 Rural s/total 650571 975506 1244182 1901407 2543717 TotPop 658712 1009767 1313639 2028157 2823150
MWA/GEI/SIM Mwanza 34861 110553 172287 385810* 706453
Geita/Kalangalala 6917 14417 39562* 167160? Sengerema 13745 21696 38424* .. Nansio 3607 7804 11107 28545 .. Magu 4859 10492 17689 .. Nkome 15443* .. Katoro 13458* .. Ngudu 3894 6644 12324* .. Misungwi 6505 12127* .. Kisesa/Kisasa 6752 10179* .. Other urban 0 0 90095 27696 .. Urban s/total 38468 147772 339995 601257 1113222 Rural s/total 1017415 1295607 1536781 2328387 2818823 TotPop 1055883 1443379 1876776 2929644 3932045
MAR Musoma 15412 31051 68364 104851* 134327
Bunda 7873 9401 40404* .. Tarime 9854 15590 29339 .. Sirari 16795* .. Mugumu 4042 6674 12549* .. Shirati 9794* .. Other urban 0 0 0 39874 .. Urban s/total 15412 52820 99763 253606 303412 Rural s/total 528713 671007 852853 1109791 1440418 TotPop 544125 723827 952616 1363397 1743830
Mainland Named above 672356 2128362 3538096 6655998 ..
Other urban 12736 129559 461786 898840 .. Urban s/total 685092 2257921 3999882 7554838 12701238 Rural s/total 11290665 14778578 18507165 25907011 30924116 TotPop 11975757 17036499 22507047 33461849 43625354
[Notes: * From Thomas Brinkhoff: http://www.citypopulation.de/Tanzania.html ** From E-Geopolis: http://www.e-geopolis.eu *** Assessed using census and other data (See also F/N 4, p. 2). .. Not yet available. All other figures from Tanzania Census Reports listed in References.]
Appendix A, Part 5: ‘Best Estimate’ Tanzania Urban Populations (Towns >9,000 in 2002)
Working paper
A Density-Based Measure of ‘Urban’ for Tanzania?
A Feasibility Study Using Dodoma Region
Hugh Wenban-Smith
April 2014

1
INTERNATIONAL GROWTH CENTRE (IGC)
Project on urbanization in Tanzania Phase 1: Data assembly and preliminary analysis
Working Paper 3
A DENSITY-BASED MEASURE OF ‘URBAN’ FOR TANZANIA? A feasibility study using Dodoma region
H B Wenban-Smith
Independent Research Economist ([email protected]) Final Version: 4 April 2014

2
A DENSITY-BASED MEASURE OF ‘URBAN’ FOR TANZANIA? A feasibility study using Dodoma region
Hugh Wenban-Smith1
Final Version: 4 April 2014
Introduction
In the Tanzanian censuses of 1967 and 1978, the definition of ‘urban’ was based on whether a town
was gazetted, with populations within the defined boundary categorized as urban. In the later censuses
of 1988, 2002 and 2012, as the number of potential urban areas increased, a different approach was
adopted. Each Enumeration Area (of about 100 households, i.e. 400-500 people) was classified as
‘rural’ or ‘urban’ as decided by the district authorities2. No central criteria were laid down and it seems
likely that the judgement of district authorities may have varied from region to region and between
censuses.
In deciding the classification of EAs, the authorities were no doubt responding to changes they could
see on the ground. The total population of Tanzania increased by over 30% between 1978 and 1988, by
45% between 1988 and 2002, and by a further 68% between 2002 and 2012, leading to more and larger
settlements. Among the types of urban expansion taking place were:
vii. Densification of established urban centres, particularly Dar es Salaam but also Arusha,
Mwanza, Dodoma, Mbeya and Moshi;
viii. Extension of shanty type settlements around these centres, extending their boundaries and
perhaps absorbing previously independent villages or other settlements;
ix. Growth of previously insignificant trading centres, particularly along major roads and railways;
x. Growth of villages, particularly in the wake of the Ujamaa villagisation programme;
xi. Temporary or semi-permanent settlements associated with small scale mining activities;
xii. Camps or settlements formed by refugees from neighbouring countries, particularly (at different
times) from Burundi, DR Congo and Rwanda.
While it seems likely that expansion of types (i) – (iii) would generally be reflected in district authority
classifications, practice with types (iv) – (vi) may have been more varied, and cases of these kinds are 1 Independent Research Economist ([email protected] ). I gratefully acknowledge input from Prof. Steve Gibbons, Director, Spatial Economics Research Centre, LSE and from Vincent Mugaya and his team at the GIS unit, National Bureau of Statistics, Tanzania. 2 Certain other categories were also separately identified, such as prisons and hospitals.

3
more difficult to identify in the census reports. Indeed, Volume X of the 2002 Census remarks that
“The urban areas are defined as the localities that are identified as urban areas by the district authority.
There is no clear and uniform definition applied by the various districts in the country.” Similarly, in
the 2012 Census report, it states “For the purpose of the 2012 PHC, urban population consists of people
living in areas legally recognized (gazetted) as urban and all areas recognized by Local Government
Authorities as urban.” In consequence, it is hard to know precisely what the recorded increase in urban
populations in the censuses has measured.
Of course, there is no single ‘correct’ definition of ‘urban’. Appendix 1 briefly reviews international
practice, showing that an ‘urban’ population may vary from as few as 200 (in Sweden) up to 5,000 or
more (in India). For Tanzania, a World Bank study on ‘The Urban Transition in Tanzania’ (2009)
provides an in-depth discussion (Ch. 1, pp9-21). Much may depend on the use to which the information
is to be put. Administrative boundaries are useful in defining which authority is responsible for which
area even if not all the area is urban in character. Another alternative is to consider what functions the
area fulfills, e.g. whether typically urban services and facilities are present within the area, but this is
quite demanding of information which may not be easy to obtain. A simpler method is to suppose that
if an area has a density greater than some threshold value and a total population of sufficient size, then
it is likely to be ‘urban’. This has the advantage of providing a consistent definition so that, even if not
ideal, it is at least comparable between areas and across time.
In this paper, we use data from Dodoma region for 2002 and 2012 to investigate what the effect of
adopting a density-based measure of ‘urban’ in Tanzania would be. We conclude that despite the
advantage of consistency, a density-based measure would have limitations unless used in conjunction
with other criteria – see Conclusions section below.
A density-based definition of ‘urban’
The definition we consider is of the general form “contiguous areas with a density greater than X
persons per hectare and a total population greater than Y.” Ideally the areas in question would be
Enumeration Areas (EAs) but in this investigation we use wards and ‘streets’ as these are the units used
in the data (explained more fully below). For X, we test values of 1.5, 2.5, 5.0 and 7.5 persons per
hectare (equivalent to 150, 250, 500 and 750 persons per sq. km). For Y, we test values of 5,000 and
10,000. These values are higher than those often used in developed countries3, but appear appropriate
3 e.g. OECD adopts a cut-off of 150 people per sq. km, except that for Japan the cut-off is 500 people per sq. km.

4
to conditions in Tanzania, where urban settlements have fewer roads, parks and public buildings to
reduce urban densities, and there is commonly a big difference between very sparsely populated rural
areas and rather dense urban settlements.
Data used
Ward populations for the Dodoma region can be found in the 1988, 2002 and 2012 Census reports.
However, it should be noted that in 1988 Dodoma region had 3 districts and 121 wards, in 2002 it had 5
districts and 146 wards, and in 2012 it had 7 districts and 189 wards. At ward level, wards that become
very large may get sub-divided for the next census, with new ward names being introduced (so that the
previous ward name may now refer to a smaller area).
For ward and ‘street’ areas, the GIS Shapefiles for 2002 have been made publicly available by the
National Bureau of Statistics (NBS)4, while pre-publication ward level GIS Shapefiles for Dodoma
region were kindly provided to us by NBS. GIS mapping was not carried out for the 1988 census (or
earlier ones) so that densities at ward (or lower) level for 1988 and earlier years cannot be computed.
Results for 2002
In the 2002 census GIS Shapefiles, the basic unit is the ‘Street’ (mtaa in Swahili). In rural areas, this
generally corresponds with Enumeration Areas (EAs), but in towns several EAs are often combined to
form a ‘Street’. EAs typically contain around 500 people; urban ‘streets’ typically contain between
1,000 and 5,000 people. The coding of these spatial units enables ward totals to be obtained by
aggregation. As a first step, what the total urban population of the whole Dodoma region would be
using a range of density cut-offs for wards and streets was calculated (without regard to the total
population of individual settlements). The results are shown in Table 1 below.
4 It was noted that the ward populations obtained from the Shapefiles are generally a bit lower than those reported in the 2002 Census Report, for reasons which have not been determined, but typically by only a few tens (i.e. around 0.1%), so not material in the context of density calculations.

5
Criterion Resulting urban population
Area (sq.km)
No of units
As in 2002 Census 213,243 .. ..
Using ward units (Sum of populations in wards having greater than the specified density)
Density >7.5/Ha 110,324 35.1 11
Density >5.0/Ha 129,623 61.7 12
Density >2.5/Ha 167,074 177.0 14
Density >1.5/Ha 206,481 408.0 17
Using ‘Street’ units (Sum of populations in streets having greater than the specified density)
Density >7.5/Ha 163,060 52.3 84
Density >5.0/Ha 187,169 88.4 96
Density >2.5/Ha 214,520 176.1 123
Density >1.5/Ha 295,431 603.1 156
Table 1: Urban population of Dodoma region in 2002 under different urban measures
For wards, the higher density cut-offs appear too severe. Indeed, with >7.5/Ha, only 11 wards, all in the
Dodoma Urban District, qualify. To get an urban population comparable with that found in the census,
it is necessary to go down to >1.5/Ha, when 17 wards qualify (with the last three rather low density
wards adding 231 sq. km, or 130%, to the area, but only 39,407, or 24%, to the population). Average
densities are higher at ‘street’ level, and an urban total comparable to that found in the census is
obtained using >2.5/Ha. On this criterion, 123 ‘streets’ qualify – the highest density case being Gereza
la Isanga in Hazina ward (with a startling 1736 people on 2.4 Ha = Density of 726/Ha), the next highest
case being Baruti in Viwandani ward (754 people on 4.2 Ha = Density of 178/Ha), both in Dodoma
Urban District. It is striking that applying this criterion produces an area similar to that found if the
>2.5/Ha ward criterion is applied.
Adopting the >1.5/Ha ward and >2.5/Ha ‘street’ cut-offs, we next see how this would affect the
population counts for individual towns, having regard to the 5,000 and 10,000 size criteria. The results
are shown in Table 2.
For the three larger towns, Dodoma, Kondoa and Mpwapwa, it may be seen that using the >1.5/Ha
ward criterion leads to population figures very similar to those in the 2002 census report. However,
using the >2.5/Ha ‘street’ criterion yields populations about 15% lower, no doubt due to the exclusion
of less dense ‘streets’ both within the towns (e.g. parks) and around their peripheries.

6
Towns 2002 Census Population
Using ward density >1.5/Ha
Using street density >2.5/Ha
Dodoma 150,604 155,113 145,391 Kondoa 20,426 21,758 18,134 Mpwapwa 18,992 18,428 15,842 Kibaigwa 10,004 [15,207] 7,969 Mvumi Mission 8,875 [13,179] 7,904 Kongwa .. 11,182 [4,744] Ving’hawe .. [10,995] 5,050 Other urban 13,217 0 14,230 Urban s/total 213,243 206481 214,520 Rural s/total 1,478,782 1,485,544 1,477,505 TOTAL POPN 1,692,025 1,692,025 1,692,025 Note: Figures in square brackets are ward populations which fail to meet the density or the size criterion, and which are therefore not included in the urban sub-totals.
Table 2: Dodoma Region: 2002 urban populations under different measures
For the next tier of towns, we find Kibaigwa and Mvumi Mission, both with sizeable populations,
counting as urban in the census but not if the >1.5/Ha ward criterion is applied; they then re-qualify if
the >2.5/Ha ‘street’ criterion is applied, albeit with urban populations 20% and 10% lower than in the
census. Kongwa, on the other hand, is not listed as urban in the census but comes in on the >1.5/Ha
ward criterion with a population over 10,000 (the Kongwa Mjini ward has a population of 11,182 and
an average density of 1.57/Ha). It then drops out again on the >2.5/Ha ‘street’ criterion – the 9 ‘streets’
that qualify have a total population of only 4,744). Finally, Ving’hawe ward has a population of 10,995
but the density is only 1.05/Ha; however, when its ‘streets’ are considered, the 7 with >2.5/Ha have a
total population of 5,050.
Although we have only looked at one region and one census year here, the conclusion seems to be that
whatever criterion is applied, the results are likely to be more secure for towns with populations above
10,000 than for those with smaller populations. With the latter, the >1.5/Ha ward criterion is liable to
exclude sizeable towns which are part of large area wards, while the >2.5/Ha ‘street’ criterion will
bring in some of these towns but may understate their populations.

7
Results for 2012 Our results for 2012 are provisional and incomplete as ‘street’ level populations and areas are not yet
available5. However, we have been able to produce a ward level analysis similar to that for 2002
reported above. Starting with the whole region analysis, the results are shown in Table 3 below.
Criterion Resulting urban population
Area (sq.km)
No of units
As in 2012 Census 321,194 .. ..
Using ward units (Sum of populations in wards having greater than the specified density)
Density >7.5/Ha 136,727 52.2 14
Density >5.0/Ha 217,624 184.6 18
Density >2.5/Ha 239,911 231.7 20
Density >1.5/Ha 348,192 840.7 26
Using ‘Street’ units (Sum of populations in streets having greater than the specified density)
Density >7.5/Ha .. .. ..
Density >5.0/Ha .. .. ..
Density >2.5/Ha .. .. ..
Density >1.5/Ha .. .. ..
Table 3: Urban population of Dodoma region in 2012 under different urban measures
As was found for 2002 (see Table 1), it is necessary to go down to the > 1.5/Ha ward density criterion
to give an urban population comparable with that reported for the region in the 2012 census report. In
fact, using this criterion we get a rather larger urban population (for 2002, it was rather smaller). The
number of wards now meeting the criterion has risen from 17 to 26, while their combined area has
more than doubled from 408 to 841 sq. km, indicative partly of the urban expansion taking place and
partly of the rather low average density (1.8/Ha) of the last 6 wards.
Adopting this criterion, we next consider the effect on populations of the larger towns. This is done in
Table 4.
5 Ward level data for Chemba district of Dodoma region was also missing. However, the effect on our results is not significant as this district contains only one small urban area (Mrijo).
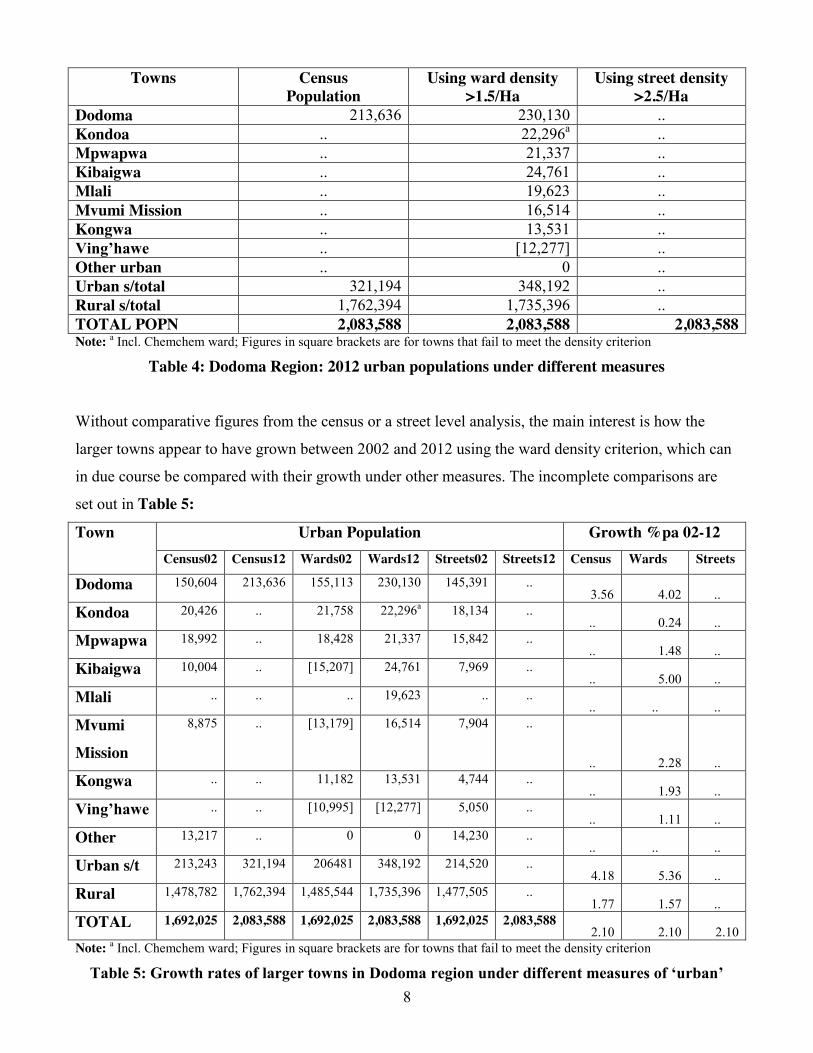
8
Towns Census Population
Using ward density >1.5/Ha
Using street density >2.5/Ha
Dodoma 213,636 230,130 .. Kondoa .. 22,296a .. Mpwapwa .. 21,337 .. Kibaigwa .. 24,761 .. Mlali .. 19,623 .. Mvumi Mission .. 16,514 .. Kongwa .. 13,531 .. Ving’hawe .. [12,277] .. Other urban .. 0 .. Urban s/total 321,194 348,192 .. Rural s/total 1,762,394 1,735,396 .. TOTAL POPN 2,083,588 2,083,588 2,083,588 Note: a Incl. Chemchem ward; Figures in square brackets are for towns that fail to meet the density criterion
Table 4: Dodoma Region: 2012 urban populations under different measures
Without comparative figures from the census or a street level analysis, the main interest is how the
larger towns appear to have grown between 2002 and 2012 using the ward density criterion, which can
in due course be compared with their growth under other measures. The incomplete comparisons are
set out in Table 5:
Town Urban Population Growth %pa 02-12 Census02 Census12 Wards02 Wards12 Streets02 Streets12 Census Wards Streets
Dodoma 150,604 213,636 155,113 230,130 145,391 .. 3.56 4.02 ..
Kondoa 20,426 .. 21,758 22,296a 18,134 .. .. 0.24 ..
Mpwapwa 18,992 .. 18,428 21,337 15,842 .. .. 1.48 ..
Kibaigwa 10,004 .. [15,207] 24,761 7,969 .. .. 5.00 ..
Mlali .. .. .. 19,623 .. .. .. .. ..
Mvumi Mission
8,875 .. [13,179] 16,514 7,904 ..
.. 2.28 .. Kongwa .. .. 11,182 13,531 4,744 ..
.. 1.93 .. Ving’hawe .. .. [10,995] [12,277] 5,050 ..
.. 1.11 .. Other 13,217 .. 0 0 14,230 ..
.. .. .. Urban s/t 213,243 321,194 206481 348,192 214,520 ..
4.18 5.36 .. Rural 1,478,782 1,762,394 1,485,544 1,735,396 1,477,505 ..
1.77 1.57 .. TOTAL 1,692,025 2,083,588 1,692,025 2,083,588 1,692,025 2,083,588
2.10 2.10 2.10 Note: a Incl. Chemchem ward; Figures in square brackets are for towns that fail to meet the density criterion
Table 5: Growth rates of larger towns in Dodoma region under different measures of ‘urban’

9
What we find here is a little odd. Although using the ward density >1.5/Ha criterion gives a rather
higher growth rate for Dodoma and for the urban sub-total than the census does, growth rates for the
other listed towns, except Kibaigwa, are rather low. At the same time, a large new town, Mlali in
Kongwa district, appears with a population of nearly 20,000. Further comment here must await the
availability of more data.
Conclusions In this working paper, the effect of an ‘urban’ definition based on density at ward and ‘street’ level has
been investigated for Dodoma region. It has been noted that to get an urban population comparable to
that reported in the census reports, the density cut-off at ward level needs to be 1.5/Ha while at ‘street’
level the density cut-off needs to be 2.5/Ha. At the same time, some limitations in using these criteria
have also been noted:
x The 1.5/Ha ward level criterion may miss some sizeable towns if they are part of a ward which
includes a large rural area;
x The 2.5/Ha ‘street’ level criterion will omit some relatively low density areas within urban areas
and so may understate urban populations.
To assess whether adoption of a density-based measure would be an improvement, there needs to be
comparison with alternatives. Two alternatives are: (a) the existing exercise of judgement at EA level
by district officials, or (b) a centrally specified definition. The strengths and weaknesses of each
approach are summarized in Table 6.
Method Strengths Weaknesses
Local district judgement x Uses local knowledge x Fine grain if done at
EA level
x Judgement may vary from district to district and over time
x Judgements may not be sufficiently objective
Centrally imposed definition x Ensures consistency x Does not incorporate local knowledge
Ward level density criterion x Easy to apply; consistent
x May miss towns in large wards x Arbitrary cut-off
Street level density criterion x Easy to apply; consistent
x Will omit lower density areas within urban areas
x Arbitrary cut-off Table 6: Strengths and weaknesses of alternative approaches to definition of ‘urban’

10
It is perhaps not the role of a working paper to make recommendations on this point. Nevertheless,
there does appear to be scope for adopting the best features of all four approaches, as highlighted in
bold below.
We start by observing that there is much to be said for the present approach of getting local officials to make the judgement, as they will have better information on local circumstances and
hence be better able to judge whether a particular area is urban in character. However, there is a risk
that, without some central guidance, such judgements may vary from district to district, and even
within the same district may change over time, as new officials come into office. There is also perhaps
a risk that extraneous considerations may come into play (such as a hope for greater prestige, or a
larger resource allocation, if a larger urban population is reported). It would therefore be desirable to try to ensure consistency at local level by providing some central guidance. Such guidance could include density criteria, such as those suggested above, but should perhaps also add some qualifications to address the limitations we have identified.
A further issue to consider is that a simple ‘urban’/’rural’ division does not sufficiently recognize the
complexities of urban development in countries like Tanzania, where much urban growth is highly
informal. A solution to this problem might be to introduce a sub-division of the ‘urban’ category
into ‘urban – informal’ and ‘urban – formal’ in the census enumeration, the distinction resting on
whether or not urban services such as water, sanitation and paved roads are available, and on housing
standards. The indicators of deprivation adopted by UN-HABITAT (2008) in its 2008/2009 State of the
World’s Cities Report (pp. 92-95) might be appropriate for this purpose.
References National Bureau of Statistics, Tanzania (2003) 2002 Census Report, Vol X
National Bureau of Statistics, Tanzania (2013) 2012 Census Report, Vol 1
National Bureau of Statistics, Tanzania GIS Shapefiles for 2002 (available on NBS website)
Uchida H & A Nelson (2008) “Agglomeration Index: Towards a new measure of urban concentration”, Background paper for World Development Report 2009.
UN-HABITAT (2008) State of the World’s Cities 2008/2009: Harmonious Cities
World Bank (2009) “The Urban Transition in Tanzania” (Report No. 44354-TZ v2)

11
Appendix I
Measuring urbanization In discussing urbanisation, it is important to keep in mind that the definition of an urban area in the UN statistics varies quite widely from country to country (as well as across time within countries) and that large numbers of settlements that count as urban are actually quite small. Thus in Sweden an urban area has a population of 200 or more; in Britain, the current Office of National Statistics (ONS) definition of an urban area is “Areas of built up land of at least 20 Ha, with a population of 1,500 or more”; in India, however, the definition requires (inter alia) a minimum population of 5,000. Yet when urbanization is under discussion, the picture in most people’s minds is probably of a town or city of 100,000 or more.
Moreover, there are often problems with identification of urban boundaries, particularly as urban population growth leads to colonization of peripheral areas. Apart from developments on the ground running ahead of administrative boundaries, areas previously separate become merged. This is increasingly recognized in the concept of urban agglomerations. Thus in India, an urban agglomeration may constitute:
“(i) A city or town with a continuous outgrowth, the outgrowth being outside the statutory limits but falling within the boundaries of the adjoining village or villages; or
(ii) Two or more adjoining towns with their outgrowths, if any; or
(iii) A city and one or more adjoining towns with or without outgrowths all of which form a continuous spread.”
While the problems with the measurement of urbanisation are fairly well known (although often ignored in public discussion), fixing them is another matter. An interesting recent development is the use by the World Bank of a new Agglomeration Index in its World Development Report 2009, a report which is also timely in taking economic geography as its main theme. The development of the Agglomeration Index is described in a background paper by Uchida & Nelson (2008). It is based on three criteria: population density; travel time to the urban centre; and size of the urban centre. The Index is calculated by aggregating the population in 1 x1 km cells which satisfy critical values for all three criteria, and dividing this number by a country’s total population. After some experimentation with values, those adopted by the World Bank are:
(i) Population density ≥ 150 people per sq. km;
(ii) Travel time to urban centre ≤ 60 minutes;
(iii) Population of urban centre ≥ 50,000.
The authors comment:
“The index does not define what is urban per se – it does not incorporate urban characteristics such as political status and the presence of particular services or activities. Instead, the index creates a globally consistent definition of settlement concentration that could be used to conduct cross-country comparative analyses … A new measure of agglomeration does not suggest that the UN’s data is flawed. The matter is analogous to measurements of global poverty levels across countries. Each country has its own definition based on legitimate factors, but the varying definitions among countries make cross-country analysis and aggregation nearly impossible.”
Does the new index change our view of urbanization? So far the index has only been estimated for a single year (2000). For this year, the index gives a significantly higher value than the UN series for the South Asia region (50.4% compared with 27.2%) and for the Middle East and North Africa region (67.5% compared with about 57%); on the other hand it gives a lower value for the Latin America and

12
Caribbean region (64.4% compared with 75.4%). For other regions, the difference is relatively small. However, the regional averages hide some quite significant differences at country level. The Table below shows a small selection of cases. First, three countries for which the Agglomeration Index is significantly higher than the UN figure; secondly, three countries for which it makes little difference; finally three countries for which the Agglomeration Index is significantly lower:
Country UN urban share (%)
Agglomeration index (%)
AI higher than UN Egypt Bangladesh Uganda
42.5 23.2 12.1
92.6 42.8 25.0
AI about the same Saudi Arabia Turkey China
79.9 64.7 35.8
79.3 62.5 36.2
AI lower than UN Australia Sweden Brazil
87.2 84.0 81.2
75.2 53.8 60.4
Table 4: Comparison of World Bank Agglomeration Index and UN urban share for selected countries
Source: Uchida & Nelson (2008, Table A.2)
One could spend some time puzzling over the reasons for these differences. The main point however is that the Agglomeration Index, which is comparable across countries, can give a very different view of the extent of urbanization in particular cases.

Designed by soapbox.co.uk
The International Growth Centre (IGC) aims to promote sustainable growth in developing countries by providing demand-led policy advice based on frontier research.
Find out more about our work on our website www.theigc.org
For media or communications enquiries, please contact [email protected]
Subscribe to our newsletter and topic updates www.theigc.org/newsletter
Follow us on Twitter @the_igc
Contact us International Growth Centre, London School of Economic and Political Science, Houghton Street, London WC2A 2AE
Related Documents