ICUC9 - 9 th International Conference on Urban Climate jointly with 12 th Symposium on the Urban Environment Urban weather generator: a method to predict neighborhood-specific urban temperatures for use in building energy simulations Bruno Bueno 1 , Aiko Nakano 2 , Leslie Norford 2 1 Fraunhofer Institute for Solar Energy Systems ISE, Germany 2 Massachusetts Institute of Technology, Cambridge, USA dated: 1 July 2015 Abstract The Urban Weather Generator (UWG) is a simple and computationally efficient model that predicts canopy- level urban air temperature using meteorological information measured at a reference weather station. Intended for use by architects, planners and building service engineers, it simplifies the inherent thermal coupling between buildings and the urban canopy and requires a level of user expertise and computation time commensurate with typical building design workflows. To map typical or annual meteorological year weather files to an urban weather file in the same format, UWG uses four submodules: the rural station model, vertical diffusion model, urban boundary-layer (UBL) model and urban canopy and building energy model. The near-universal nature of the urban weather file makes it compatible with widely used building energy simulation programs. Decoupling the production of the urban weather file from the building energy simulation requires the user to represent within UWG the thermal characteristics of existing or proposed buildings with reasonable accuracy. Comparison with an iterative coupling of buildings with urban canyons shows satisfactory performance. Access by designers to urban and building parameters required by UWG is assessed. Improvements to the model, allow the user to define and describe different urban neighborhoods. Thermal interactions between neighborhoods are modeled as occurring through vertical transport of heat by convection and radiation from the urban canopy to higher regions of the urban boundary layer and advection of that heat, where the warmer UBL interacts with downwind neighborhoods. Designers can also specify the weighted presence of different building uses (i.e., commercial, residential, industrial) in each neighborhood. An upgraded representation of the energy balance in the UBL uses the known physics of longwave radiation in participating media to define an equivalent sky temperature. The current UWG also provides an improved representation of the effects of surface roughness on airflow. Model predictions and measurements in Singapore are compared with previous validations in two mid-latitude cities. The comparison in Singapore shows satisfactory performance of the model for all weather conditions. Unexpectedly, the choice of two reference weather stations in Singapore, one near open water and the other in the interior of the island, has minimal impact on the estimation of diurnal temperature patterns in targeted neighborhoods, because vertical energy exchange dominates the impact of advection in the UBL. However, the temperatures at the two reference stations are not identical and differences between neighborhood temperatures estimated by the UWG and the reference station, which show the magnitude of the urban heat island effect, depend on the choice of weather station. In aggregate, validations to date show that the model can be applied to different climates and urban configurations to obtain an estimation of the Urban Heat Island (UHI) effect. The spatial specificity and accuracy of these estimates are assessed in the context of building performance. 1. Introduction Originally published by Bueno et al. (2013), the UWG applies energy conservation principles to control volumes in the urban canopy layer and the urban boundary layer for which boundary conditions can be imposed (Fig. 1). The UWG’s four modules are shown in Fig. 2. The Rural Station Model (RSM) is a rural canopy model that reads hourly values of meteorological fields measured at the rural site and calculates sensible heat fluxes, which are then provided to the Vertical Diffusion Model (VDM) and the Urban Boundary Layer (UBL) model. The model is based on an energy balance at the soil surface. A transient heat diffusion equation is solved by finite differences representing the storage and release of heat from the ground. The VDM reads air temperatures and velocities measured at the weather station and sensible heat fluxes calculated by the RSM, and solves a heat diffusion equation to calculate vertical profiles of air temperature above the weather station, which are then provided to the UBL model. The UBL model calculates air temperatures above the urban canopy layer from the vertical profiles of air temperature provided by the VDM and the sensible heat fluxes provided by the RSM and the Urban Canopy and Building Energy Model (UC-BEM). The model is based on an energy balance for a selected control volume inside the urban boundary layer. The UC-BEM calculates urban canyon air temperature and humidity from radiation and precipitation data, air velocity and humidity measured at the weather station, and the air temperature above the urban canopy layer calculated by the UBL model. The model is based on the Town presenting author Les Norford

Welcome message from author
This document is posted to help you gain knowledge. Please leave a comment to let me know what you think about it! Share it to your friends and learn new things together.
Transcript
ICUC9 - 9th International Conference on Urban Climate jointly with 12th Symposium on the Urban Environment
Urban weather generator: a method to predict neighborhood-specific urban temperatures for use in
building energy simulations
Bruno Bueno1, Aiko Nakano2, Leslie Norford2 1 Fraunhofer Institute for Solar Energy Systems ISE, Germany
2 Massachusetts Institute of Technology, Cambridge, USA
dated: 1 July 2015
Abstract The Urban Weather Generator (UWG) is a simple and computationally efficient model that predicts canopy-
level urban air temperature using meteorological information measured at a reference weather station. Intended for use by architects, planners and building service engineers, it simplifies the inherent thermal coupling between buildings and the urban canopy and requires a level of user expertise and computation time commensurate with typical building design workflows. To map typical or annual meteorological year weather files to an urban weather file in the same format, UWG uses four submodules: the rural station model, vertical diffusion model, urban boundary-layer (UBL) model and urban canopy and building energy model. The near-universal nature of the urban weather file makes it compatible with widely used building energy simulation programs. Decoupling the production of the urban weather file from the building energy simulation requires the user to represent within UWG the thermal characteristics of existing or proposed buildings with reasonable accuracy. Comparison with an iterative coupling of buildings with urban canyons shows satisfactory performance. Access by designers to urban and building parameters required by UWG is assessed.
Improvements to the model, allow the user to define and describe different urban neighborhoods. Thermal
interactions between neighborhoods are modeled as occurring through vertical transport of heat by convection and radiation from the urban canopy to higher regions of the urban boundary layer and advection of that heat, where the warmer UBL interacts with downwind neighborhoods. Designers can also specify the weighted presence of different building uses (i.e., commercial, residential, industrial) in each neighborhood. An upgraded representation of the energy balance in the UBL uses the known physics of longwave radiation in participating media to define an equivalent sky temperature. The current UWG also provides an improved representation of the effects of surface roughness on airflow.
Model predictions and measurements in Singapore are compared with previous validations in two mid-latitude
cities. The comparison in Singapore shows satisfactory performance of the model for all weather conditions. Unexpectedly, the choice of two reference weather stations in Singapore, one near open water and the other in the interior of the island, has minimal impact on the estimation of diurnal temperature patterns in targeted neighborhoods, because vertical energy exchange dominates the impact of advection in the UBL. However, the temperatures at the two reference stations are not identical and differences between neighborhood temperatures estimated by the UWG and the reference station, which show the magnitude of the urban heat island effect, depend on the choice of weather station. In aggregate, validations to date show that the model can be applied to different climates and urban configurations to obtain an estimation of the Urban Heat Island (UHI) effect. The spatial specificity and accuracy of these estimates are assessed in the context of building performance.
1. Introduction
Originally published by Bueno et al. (2013), the UWG applies energy conservation principles to control volumes in the urban canopy layer and the urban boundary layer for which boundary conditions can be imposed (Fig. 1). The UWG’s four modules are shown in Fig. 2. The Rural Station Model (RSM) is a rural canopy model that reads hourly values of meteorological fields measured at the rural site and calculates sensible heat fluxes, which are then provided to the Vertical Diffusion Model (VDM) and the Urban Boundary Layer (UBL) model. The model is based on an energy balance at the soil surface. A transient heat diffusion equation is solved by finite differences representing the storage and release of heat from the ground. The VDM reads air temperatures and velocities measured at the weather station and sensible heat fluxes calculated by the RSM, and solves a heat diffusion equation to calculate vertical profiles of air temperature above the weather station, which are then provided to the UBL model. The UBL model calculates air temperatures above the urban canopy layer from the vertical profiles of air temperature provided by the VDM and the sensible heat fluxes provided by the RSM and the Urban Canopy and Building Energy Model (UC-BEM). The model is based on an energy balance for a selected control volume inside the urban boundary layer. The UC-BEM calculates urban canyon air temperature and humidity from radiation and precipitation data, air velocity and humidity measured at the weather station, and the air temperature above the urban canopy layer calculated by the UBL model. The model is based on the Town
presenting author
Les Norford
ICUC9 - 9th International Conference on Urban Climate jointly with 12th Symposium on the Urban Environment
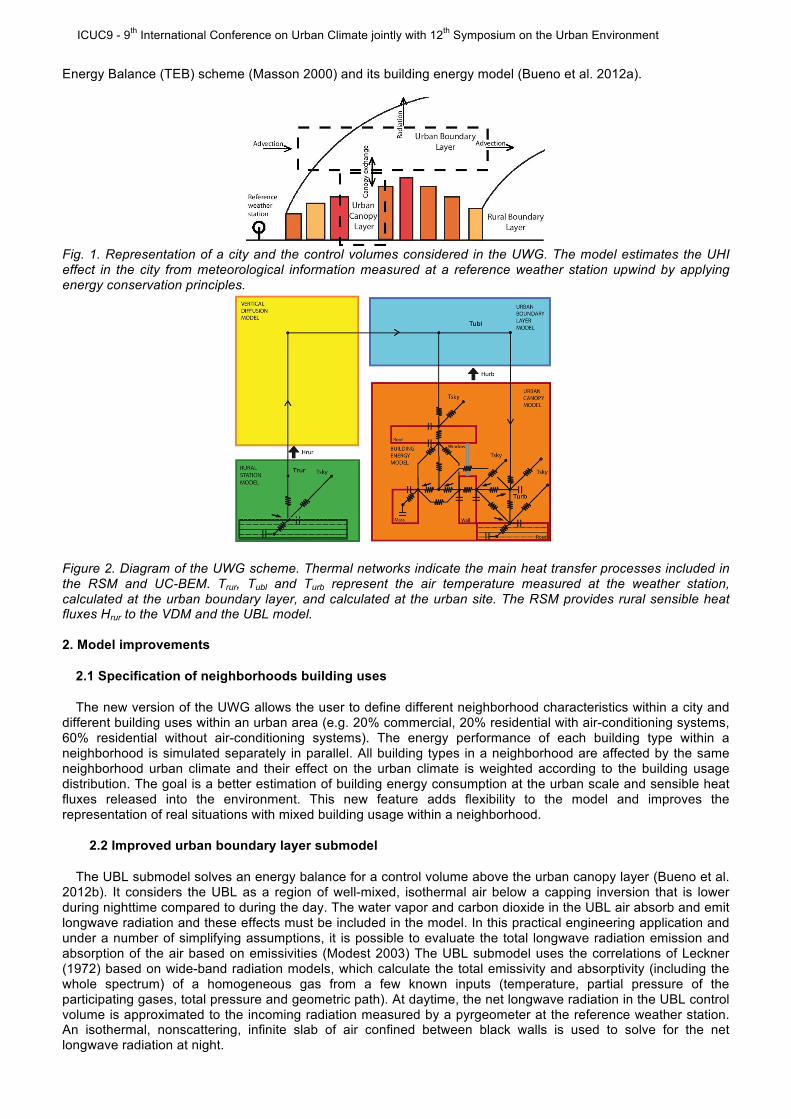
Energy Balance (TEB) scheme (Masson 2000) and its building energy model (Bueno et al. 2012a).
Fig. 1. Representation of a city and the control volumes considered in the UWG. The model estimates the UHI effect in the city from meteorological information measured at a reference weather station upwind by applying energy conservation principles.
Figure 2. Diagram of the UWG scheme. Thermal networks indicate the main heat transfer processes included in the RSM and UC-BEM. Trur, Tubl and Turb represent the air temperature measured at the weather station, calculated at the urban boundary layer, and calculated at the urban site. The RSM provides rural sensible heat fluxes Hrur to the VDM and the UBL model. 2. Model improvements
2.1 Specification of neighborhoods building uses
The new version of the UWG allows the user to define different neighborhood characteristics within a city and different building uses within an urban area (e.g. 20% commercial, 20% residential with air-conditioning systems, 60% residential without air-conditioning systems). The energy performance of each building type within a neighborhood is simulated separately in parallel. All building types in a neighborhood are affected by the same neighborhood urban climate and their effect on the urban climate is weighted according to the building usage distribution. The goal is a better estimation of building energy consumption at the urban scale and sensible heat fluxes released into the environment. This new feature adds flexibility to the model and improves the representation of real situations with mixed building usage within a neighborhood.
2.2 Improved urban boundary layer submodel
The UBL submodel solves an energy balance for a control volume above the urban canopy layer (Bueno et al. 2012b). It considers the UBL as a region of well-mixed, isothermal air below a capping inversion that is lower during nighttime compared to during the day. The water vapor and carbon dioxide in the UBL air absorb and emit longwave radiation and these effects must be included in the model. In this practical engineering application and under a number of simplifying assumptions, it is possible to evaluate the total longwave radiation emission and absorption of the air based on emissivities (Modest 2003) The UBL submodel uses the correlations of Leckner (1972) based on wide-band radiation models, which calculate the total emissivity and absorptivity (including the whole spectrum) of a homogeneous gas from a few known inputs (temperature, partial pressure of the participating gases, total pressure and geometric path). At daytime, the net longwave radiation in the UBL control volume is approximated to the incoming radiation measured by a pyrgeometer at the reference weather station. An isothermal, nonscattering, infinite slab of air confined between black walls is used to solve for the net longwave radiation at night.
ICUC9 - 9th International Conference on Urban Climate jointly with 12th Symposium on the Urban Environment
The upper "surface" temperature, which represents an effective sky temperature above the UBL (θsky) is calculated from the incoming longwave radiation ( L↓) according to the following expression:
,)1( 44ublskyL εσθσθα +−↓= (1)
where α and ε are the bulk absorptivity and emissivity of air in the control volume, respectively, σ is the Stefan Boltzmann constant, and θubl is the temperature of the control volume at the previous time-step. Assuming that the absorptivity equals the emissivity and linearizing the radiative heat transfer equation, the energy balance of the UBL submodel is now given by:
VCVρcvdθudt
= Hu + urefρcp θref −θu( )∫ dAf + 4εσθm3 θsky −θu( )+ 4εσθm3 θsurf −θu( ), (2)
where VCV is the control volume, ρ is the air density, cv is the specific heat of air at constant volume, cp is the specific heat of air at constant pressure, θu is the average potential temperature of the control volume, Hu is the sensible heat flux at the surface of the control volume [W], θref is a reference potential temperature outside the control volume, uref is a reference air velocity, Af is the lateral area of heat exchange between the control volume and its surroundings, Ah is the horizontal area of the control volume, θm is an average air temperature, and θsurf is an effective surface temperature including roofs, roads, and the urban canopy air.
3. Evaluation with field data
3.1 Description of study area and model set-up
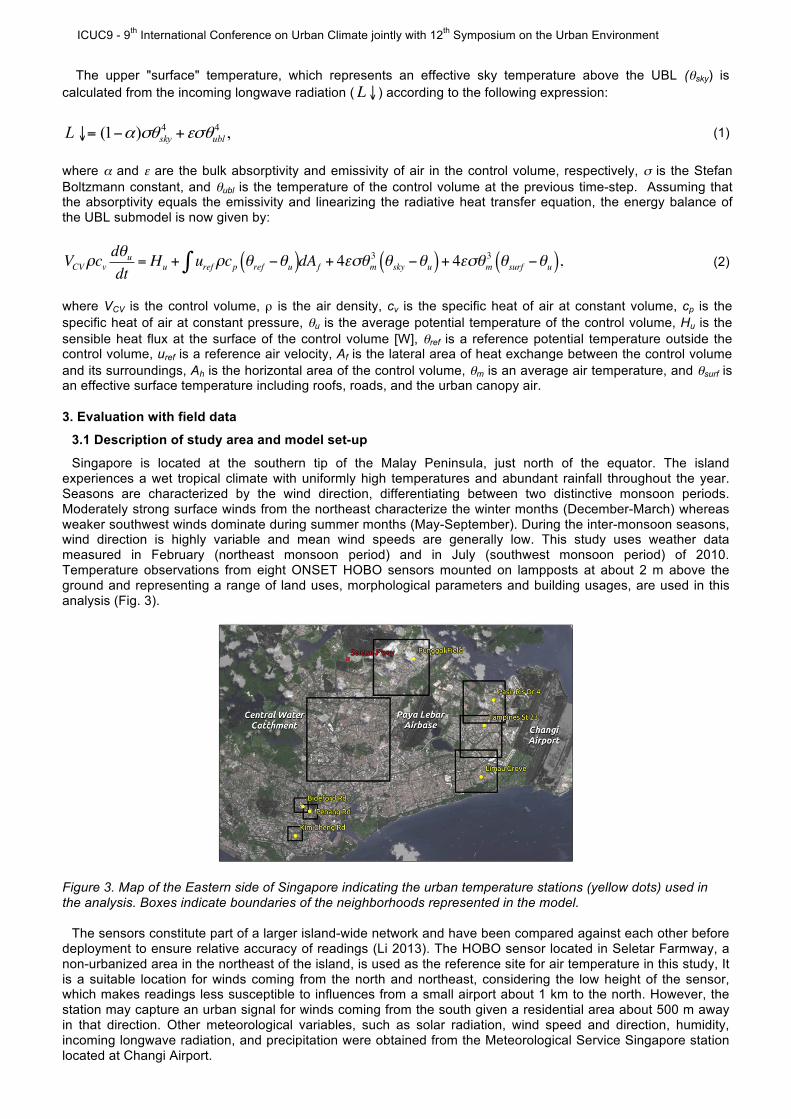
Singapore is located at the southern tip of the Malay Peninsula, just north of the equator. The island experiences a wet tropical climate with uniformly high temperatures and abundant rainfall throughout the year. Seasons are characterized by the wind direction, differentiating between two distinctive monsoon periods. Moderately strong surface winds from the northeast characterize the winter months (December-March) whereas weaker southwest winds dominate during summer months (May-September). During the inter-monsoon seasons, wind direction is highly variable and mean wind speeds are generally low. This study uses weather data measured in February (northeast monsoon period) and in July (southwest monsoon period) of 2010. Temperature observations from eight ONSET HOBO sensors mounted on lampposts at about 2 m above the ground and representing a range of land uses, morphological parameters and building usages, are used in this analysis (Fig. 3).
Figure 3. Map of the Eastern side of Singapore indicating the urban temperature stations (yellow dots) used in the analysis. Boxes indicate boundaries of the neighborhoods represented in the model.
The sensors constitute part of a larger island-wide network and have been compared against each other before
deployment to ensure relative accuracy of readings (Li 2013). The HOBO sensor located in Seletar Farmway, a non-urbanized area in the northeast of the island, is used as the reference site for air temperature in this study, It is a suitable location for winds coming from the north and northeast, considering the low height of the sensor, which makes readings less susceptible to influences from a small airport about 1 km to the north. However, the station may capture an urban signal for winds coming from the south given a residential area about 500 m away in that direction. Other meteorological variables, such as solar radiation, wind speed and direction, humidity, incoming longwave radiation, and precipitation were obtained from the Meteorological Service Singapore station located at Changi Airport.
ICUC9 - 9th International Conference on Urban Climate jointly with 12th Symposium on the Urban Environment
The required morphological parameters were obtained by both manual and automated methods. Building usage distribution for each urban area was obtained from the Urban Redevelopment Authority Integrated Map System. The building parameters required by the UWG are the typical ones for building energy simulations, including internal heat gains. Anthropogenic heat fluxes from building energy uses other than air-conditioning systems are inputs to the model, while heat fluxes from air-conditioning operation are calculated by the model Building materials for this case study are similar to those used in another paper that simulates the UHI effect in Singapore using a mesocale atmospheric model coupled with an urban canopy model (Li et al. 2013). These simulations were also used to estimate the nighttime and daytime boundary layer heights required as inputs in the UWG. The anthropogenic heat from traffic is also an input of the model and was obtained from Quah and Roth (2012). Values for the other model parameters were based on previous experiences with the model.
3.2 Prediction of urban air temperature
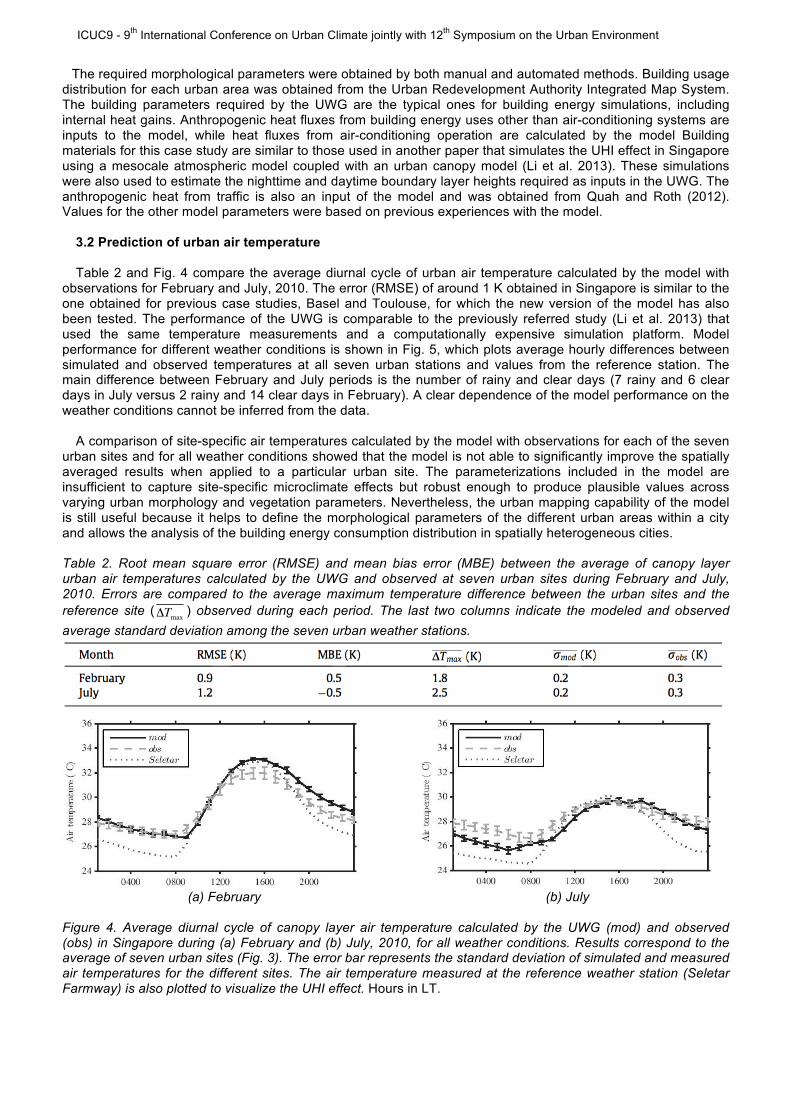
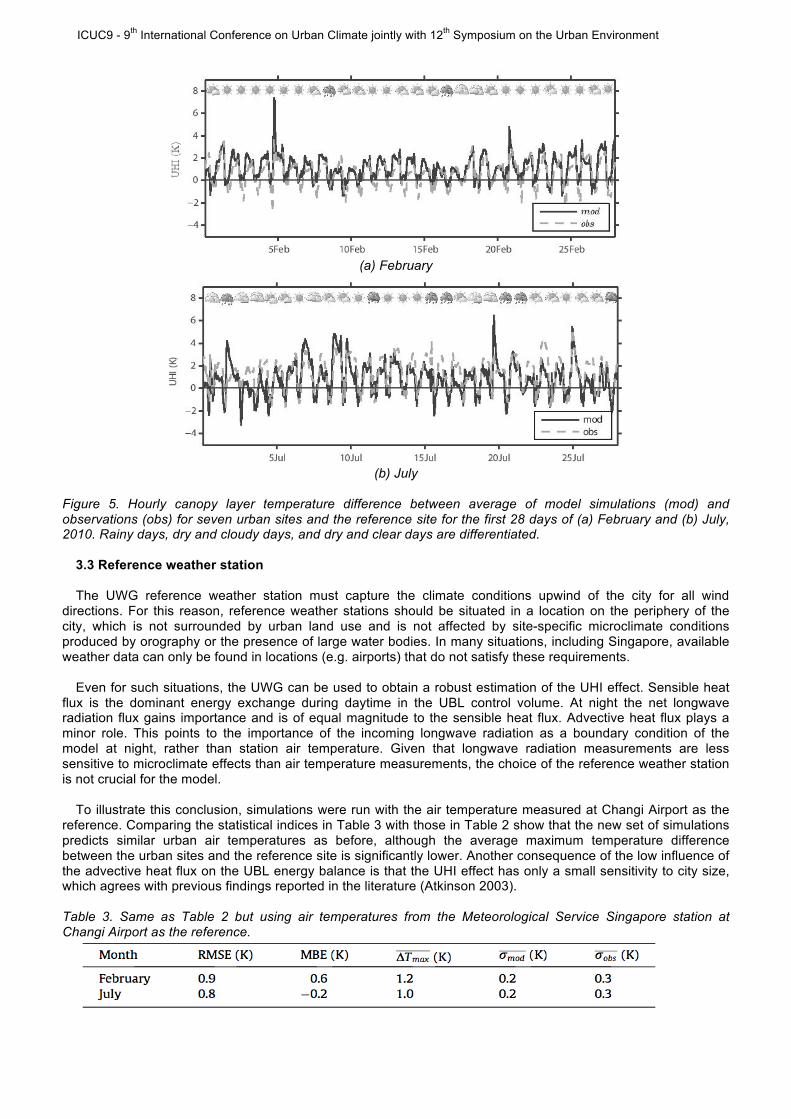
Table 2 and Fig. 4 compare the average diurnal cycle of urban air temperature calculated by the model with observations for February and July, 2010. The error (RMSE) of around 1 K obtained in Singapore is similar to the one obtained for previous case studies, Basel and Toulouse, for which the new version of the model has also been tested. The performance of the UWG is comparable to the previously referred study (Li et al. 2013) that used the same temperature measurements and a computationally expensive simulation platform. Model performance for different weather conditions is shown in Fig. 5, which plots average hourly differences between simulated and observed temperatures at all seven urban stations and values from the reference station. The main difference between February and July periods is the number of rainy and clear days (7 rainy and 6 clear days in July versus 2 rainy and 14 clear days in February). A clear dependence of the model performance on the weather conditions cannot be inferred from the data.
A comparison of site-specific air temperatures calculated by the model with observations for each of the seven
urban sites and for all weather conditions showed that the model is not able to significantly improve the spatially averaged results when applied to a particular urban site. The parameterizations included in the model are insufficient to capture site-specific microclimate effects but robust enough to produce plausible values across varying urban morphology and vegetation parameters. Nevertheless, the urban mapping capability of the model is still useful because it helps to define the morphological parameters of the different urban areas within a city and allows the analysis of the building energy consumption distribution in spatially heterogeneous cities. Table 2. Root mean square error (RMSE) and mean bias error (MBE) between the average of canopy layer urban air temperatures calculated by the UWG and observed at seven urban sites during February and July, 2010. Errors are compared to the average maximum temperature difference between the urban sites and the reference site (ΔTmax ) observed during each period. The last two columns indicate the modeled and observed average standard deviation among the seven urban weather stations.
(a) February
(b) July
Figure 4. Average diurnal cycle of canopy layer air temperature calculated by the UWG (mod) and observed (obs) in Singapore during (a) February and (b) July, 2010, for all weather conditions. Results correspond to the average of seven urban sites (Fig. 3). The error bar represents the standard deviation of simulated and measured air temperatures for the different sites. The air temperature measured at the reference weather station (Seletar Farmway) is also plotted to visualize the UHI effect. Hours in LT.
ICUC9 - 9th International Conference on Urban Climate jointly with 12th Symposium on the Urban Environment
(a) February
(b) July
Figure 5. Hourly canopy layer temperature difference between average of model simulations (mod) and observations (obs) for seven urban sites and the reference site for the first 28 days of (a) February and (b) July, 2010. Rainy days, dry and cloudy days, and dry and clear days are differentiated. 3.3 Reference weather station
The UWG reference weather station must capture the climate conditions upwind of the city for all wind directions. For this reason, reference weather stations should be situated in a location on the periphery of the city, which is not surrounded by urban land use and is not affected by site-specific microclimate conditions produced by orography or the presence of large water bodies. In many situations, including Singapore, available weather data can only be found in locations (e.g. airports) that do not satisfy these requirements.
Even for such situations, the UWG can be used to obtain a robust estimation of the UHI effect. Sensible heat
flux is the dominant energy exchange during daytime in the UBL control volume. At night the net longwave radiation flux gains importance and is of equal magnitude to the sensible heat flux. Advective heat flux plays a minor role. This points to the importance of the incoming longwave radiation as a boundary condition of the model at night, rather than station air temperature. Given that longwave radiation measurements are less sensitive to microclimate effects than air temperature measurements, the choice of the reference weather station is not crucial for the model.
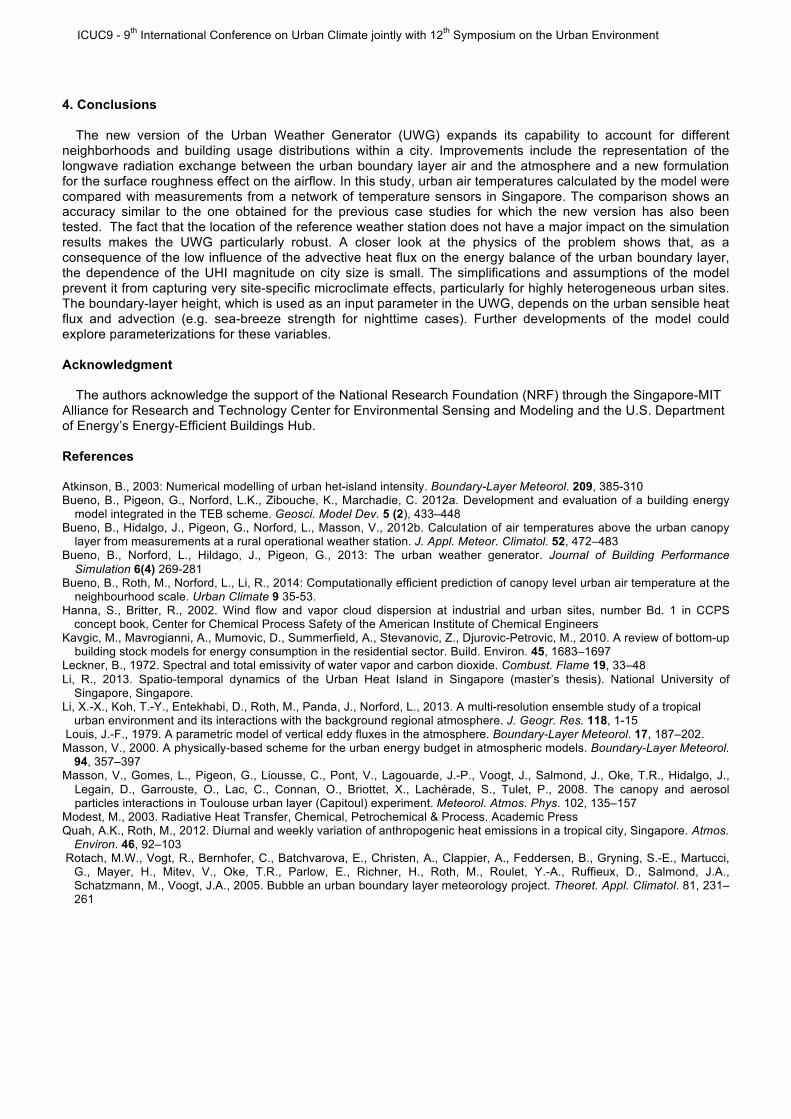
To illustrate this conclusion, simulations were run with the air temperature measured at Changi Airport as the
reference. Comparing the statistical indices in Table 3 with those in Table 2 show that the new set of simulations predicts similar urban air temperatures as before, although the average maximum temperature difference between the urban sites and the reference site is significantly lower. Another consequence of the low influence of the advective heat flux on the UBL energy balance is that the UHI effect has only a small sensitivity to city size, which agrees with previous findings reported in the literature (Atkinson 2003).
Table 3. Same as Table 2 but using air temperatures from the Meteorological Service Singapore station at Changi Airport as the reference.
ICUC9 - 9th International Conference on Urban Climate jointly with 12th Symposium on the Urban Environment
4. Conclusions
The new version of the Urban Weather Generator (UWG) expands its capability to account for different neighborhoods and building usage distributions within a city. Improvements include the representation of the longwave radiation exchange between the urban boundary layer air and the atmosphere and a new formulation for the surface roughness effect on the airflow. In this study, urban air temperatures calculated by the model were compared with measurements from a network of temperature sensors in Singapore. The comparison shows an accuracy similar to the one obtained for the previous case studies for which the new version has also been tested. The fact that the location of the reference weather station does not have a major impact on the simulation results makes the UWG particularly robust. A closer look at the physics of the problem shows that, as a consequence of the low influence of the advective heat flux on the energy balance of the urban boundary layer, the dependence of the UHI magnitude on city size is small. The simplifications and assumptions of the model prevent it from capturing very site-specific microclimate effects, particularly for highly heterogeneous urban sites. The boundary-layer height, which is used as an input parameter in the UWG, depends on the urban sensible heat flux and advection (e.g. sea-breeze strength for nighttime cases). Further developments of the model could explore parameterizations for these variables.
Acknowledgment
The authors acknowledge the support of the National Research Foundation (NRF) through the Singapore-MIT
Alliance for Research and Technology Center for Environmental Sensing and Modeling and the U.S. Department of Energy’s Energy-Efficient Buildings Hub. References Atkinson, B., 2003: Numerical modelling of urban het-island intensity. Boundary-Layer Meteorol. 209, 385-310 Bueno, B., Pigeon, G., Norford, L.K., Zibouche, K., Marchadie, C. 2012a. Development and evaluation of a building energy
model integrated in the TEB scheme. Geosci. Model Dev. 5 (2), 433–448 Bueno, B., Hidalgo, J., Pigeon, G., Norford, L., Masson, V., 2012b. Calculation of air temperatures above the urban canopy
layer from measurements at a rural operational weather station. J. Appl. Meteor. Climatol. 52, 472–483 Bueno, B., Norford, L., Hildago, J., Pigeon, G., 2013: The urban weather generator. Journal of Building Performance
Simulation 6(4) 269-281 Bueno, B., Roth, M., Norford, L., Li, R., 2014: Computationally efficient prediction of canopy level urban air temperature at the
neighbourhood scale. Urban Climate 9 35-53. Hanna, S., Britter, R., 2002. Wind flow and vapor cloud dispersion at industrial and urban sites, number Bd. 1 in CCPS
concept book, Center for Chemical Process Safety of the American Institute of Chemical Engineers Kavgic, M., Mavrogianni, A., Mumovic, D., Summerfield, A., Stevanovic, Z., Djurovic-Petrovic, M., 2010. A review of bottom-up
building stock models for energy consumption in the residential sector. Build. Environ. 45, 1683–1697 Leckner, B., 1972. Spectral and total emissivity of water vapor and carbon dioxide. Combust. Flame 19, 33–48 Li, R., 2013. Spatio-temporal dynamics of the Urban Heat Island in Singapore (master’s thesis). National University of
Singapore, Singapore. Li, X.-X., Koh, T.-Y., Entekhabi, D., Roth, M., Panda, J., Norford, L., 2013. A multi-resolution ensemble study of a tropical
urban environment and its interactions with the background regional atmosphere. J. Geogr. Res. 118, 1-15 Louis, J.-F., 1979. A parametric model of vertical eddy fluxes in the atmosphere. Boundary-Layer Meteorol. 17, 187–202. Masson, V., 2000. A physically-based scheme for the urban energy budget in atmospheric models. Boundary-Layer Meteorol.
94, 357–397 Masson, V., Gomes, L., Pigeon, G., Liousse, C., Pont, V., Lagouarde, J.-P., Voogt, J., Salmond, J., Oke, T.R., Hidalgo, J.,
Legain, D., Garrouste, O., Lac, C., Connan, O., Briottet, X., Lachérade, S., Tulet, P., 2008. The canopy and aerosol particles interactions in Toulouse urban layer (Capitoul) experiment. Meteorol. Atmos. Phys. 102, 135–157
Modest, M., 2003. Radiative Heat Transfer, Chemical, Petrochemical & Process. Academic Press Quah, A.K., Roth, M., 2012. Diurnal and weekly variation of anthropogenic heat emissions in a tropical city, Singapore. Atmos.
Environ. 46, 92–103 Rotach, M.W., Vogt, R., Bernhofer, C., Batchvarova, E., Christen, A., Clappier, A., Feddersen, B., Gryning, S.-E., Martucci,
G., Mayer, H., Mitev, V., Oke, T.R., Parlow, E., Richner, H., Roth, M., Roulet, Y.-A., Ruffieux, D., Salmond, J.A., Schatzmann, M., Voogt, J.A., 2005. Bubble an urban boundary layer meteorology project. Theoret. Appl. Climatol. 81, 231–261
Related Documents