Applied Catalysis B: Environmental 178 (2015) 65–73 Contents lists available at ScienceDirect Applied Catalysis B: Environmental journal homepage: www.elsevier.com/locate/apcatb Urban wastewater disinfection for agricultural reuse: effect of solar driven AOPs in the inactivation of a multidrug resistant E. coli strain Giovanna Ferro a , Antonino Fiorentino a , María Castro Alferez b , M. Inmaculada Polo-López b , Luigi Rizzo a , Pilar Fernández-Ibá ˜ nez b,∗ a Department of Civil Engineering, University of Salerno, Via Giovanni Paolo II, 132, 84084 Fisciano (SA), Italy b Plataforma Solar de Almería–CIEMAT, Carretera Senés km 4, 04200 Tabernas (Almería), Spain article info Article history: Received 11 July 2014 Received in revised form 23 September 2014 Accepted 14 October 2014 Available online 24 October 2014 Keywords: Antibiotic resistant bacteria Photocatalysis Solar disinfection Urban wastewater Wastewater reuse. abstract The occurrence of antibiotics in urban wastewater treatment plants (UWTPs) may result in the devel- opment of antibiotic resistance and subsequently in the release of multidrug resistant bacteria (MDR) and genes into the effluent. Conventional disinfection processes are only partially effective in controlling ARB spread, so advanced oxidation processes (AOPs) have been investigated as alternative option in this work. In particular, the aim of this work was to comparatively assess the efficiency of solar disinfection and solar driven AOPs (namely H 2 O 2 /sunlight, TiO 2 /sunlight, H 2 O 2 /TiO 2 /sunlight, natural photo-Fenton) for the inactivation of a multidrug (namely ampicillin, ciprofloxacin and tetracycline) resistant E. coli strain isolated from the effluent of the biological process of an UWTP. Different concentrations of H 2 O 2 (0.588–1.470–2.205 mM), TiO 2 (50–100 mg L −1 ), H 2 O 2 /TiO 2 (0.147 mM/50 mg L −1 , 0.588 mM/100 mg L −1 ) and Fe 2+ /H 2 O 2 (0.090/0.294, 0.179/0.588, 0.358/1.176 mM) were evaluated at pilot-scale (in compound parabolic collector reactor) in real biologically treated wastewater. All investigated processes resulted in a complete inactivation (5-log decrease) of bacteria until detection limit, but the best disinfection effi- ciency in terms of treatment time (20 min to reach the detection limit) and required energy (0.98 kJ L −1 ) was observed for photo-Fenton at pH 4 (Fe 2+ /H 2 O 2 :0.090/0.294 mM). Antimicrobial susceptibility was tested by Kirby-Bauer disk diffusion method. Ampicillin and ciprofloxacin (to which the selected strain is resistant), cefuroxime and nitrofurantoin were chosen as tested antibiotics. None of the investigated processes affected antibiotic resistance of survived colonies. © 2014 Elsevier B.V. All rights reserved. 1. Introduction Around 1.2 billion people live in areas of physical water scarcity [1] and by 2025, 1.8 billion people are expected to be living in countries or regions with “absolute” water scarcity [1,2]. The sev- eral dimensions of water scarcity, namely in availability, in access, or due to the difficulties in finding a reliable source of safe water which is not time consuming and expensive, especially in arid regions, make the wastewater reuse an interesting option for aug- menting available water supplies [3]. Among many applications of wastewater reuse, including aquaculture, environmental uses, recreation, industrial and urban uses [3], agriculture irrigation is by far the most established one [4], both in arid and semi-arid countries at all development levels, and in low-income countries where urban agriculture provides livelihood opportunities and food security [5]. ∗ Corresponding author. Tel.: +34 950 387957; fax: +34 950 365015. E-mail address: [email protected] (P. Fernández-Ibá ˜ nez). Wastewater reuse entails some benefits like decrease in water scarcity pressure in many areas, and it becomes a contribution toward a more integrated management of urban water resources, but, if not planned, properly managed and implemented, it can involve environmental and public health risks [4–6]. Some main issues concern the potential health risk for end users in contact with reclaimed wastewaters by irrigating food crops, especially in low- and middle-income countries. The major risk arises from the presence of pathogenic microorganisms in wastewater and it is especially worrisome when vegetables are eaten raw or undercooked, such as leafy greens [7]. As countries move to higher income levels, their approach to wastewater reuse for irrigation changes from unplanned to planned and more regulated and, at the same time, wastewater pollution concerns tend to change from predominantly fecal contamina- tion to emerging contaminants, such as disinfectants, endocrine disruptors, illicit drugs, personal care products, pesticides, pharma- ceuticals, resistant microorganisms [i.e. antibiotic resistant bacteria (ARB)]. Urban wastewater treatment plant (UWTP) effluents are http://dx.doi.org/10.1016/j.apcatb.2014.10.043 0926-3373/© 2014 Elsevier B.V. All rights reserved.

Welcome message from author
This document is posted to help you gain knowledge. Please leave a comment to let me know what you think about it! Share it to your friends and learn new things together.
Transcript
Ud
GMa
b
a
ARR2AA
KAPSUW
1
[ceowrmorbcws
h0
Applied Catalysis B: Environmental 178 (2015) 65–73
Contents lists available at ScienceDirect
Applied Catalysis B: Environmental
journa l homepage: www.e lsev ier .com/ locate /apcatb
rban wastewater disinfection for agricultural reuse: effect of solarriven AOPs in the inactivation of a multidrug resistant E. coli strain
iovanna Ferroa, Antonino Fiorentinoa, María Castro Alferezb,. Inmaculada Polo-Lópezb, Luigi Rizzoa, Pilar Fernández-Ibánezb,∗
Department of Civil Engineering, University of Salerno, Via Giovanni Paolo II, 132, 84084 Fisciano (SA), ItalyPlataforma Solar de Almería–CIEMAT, Carretera Senés km 4, 04200 Tabernas (Almería), Spain
r t i c l e i n f o
rticle history:eceived 11 July 2014eceived in revised form3 September 2014ccepted 14 October 2014vailable online 24 October 2014
eywords:ntibiotic resistant bacteriahotocatalysisolar disinfectionrban wastewaterastewater reuse.
a b s t r a c t
The occurrence of antibiotics in urban wastewater treatment plants (UWTPs) may result in the devel-opment of antibiotic resistance and subsequently in the release of multidrug resistant bacteria (MDR)and genes into the effluent. Conventional disinfection processes are only partially effective in controllingARB spread, so advanced oxidation processes (AOPs) have been investigated as alternative option in thiswork. In particular, the aim of this work was to comparatively assess the efficiency of solar disinfectionand solar driven AOPs (namely H2O2/sunlight, TiO2/sunlight, H2O2/TiO2/sunlight, natural photo-Fenton)for the inactivation of a multidrug (namely ampicillin, ciprofloxacin and tetracycline) resistant E. colistrain isolated from the effluent of the biological process of an UWTP. Different concentrations of H2O2
(0.588–1.470–2.205 mM), TiO2 (50–100 mg L−1), H2O2/TiO2 (0.147 mM/50 mg L−1, 0.588 mM/100 mg L−1)and Fe2+/H2O2 (0.090/0.294, 0.179/0.588, 0.358/1.176 mM) were evaluated at pilot-scale (in compoundparabolic collector reactor) in real biologically treated wastewater. All investigated processes resulted ina complete inactivation (5-log decrease) of bacteria until detection limit, but the best disinfection effi-
−1
ciency in terms of treatment time (20 min to reach the detection limit) and required energy (0.98 kJ L )was observed for photo-Fenton at pH 4 (Fe2+/H2O2:0.090/0.294 mM). Antimicrobial susceptibility wastested by Kirby-Bauer disk diffusion method. Ampicillin and ciprofloxacin (to which the selected strainis resistant), cefuroxime and nitrofurantoin were chosen as tested antibiotics. None of the investigatedprocesses affected antibiotic resistance of survived colonies.. Introduction
Around 1.2 billion people live in areas of physical water scarcity1] and by 2025, 1.8 billion people are expected to be living inountries or regions with “absolute” water scarcity [1,2]. The sev-ral dimensions of water scarcity, namely in availability, in access,r due to the difficulties in finding a reliable source of safe waterhich is not time consuming and expensive, especially in arid
egions, make the wastewater reuse an interesting option for aug-enting available water supplies [3]. Among many applications
f wastewater reuse, including aquaculture, environmental uses,ecreation, industrial and urban uses [3], agriculture irrigation isy far the most established one [4], both in arid and semi-arid
ountries at all development levels, and in low-income countrieshere urban agriculture provides livelihood opportunities and foodecurity [5].
∗ Corresponding author. Tel.: +34 950 387957; fax: +34 950 365015.E-mail address: [email protected] (P. Fernández-Ibánez).
ttp://dx.doi.org/10.1016/j.apcatb.2014.10.043926-3373/© 2014 Elsevier B.V. All rights reserved.
© 2014 Elsevier B.V. All rights reserved.
Wastewater reuse entails some benefits like decrease inwater scarcity pressure in many areas, and it becomes acontribution toward a more integrated management of urbanwater resources, but, if not planned, properly managed andimplemented, it can involve environmental and public healthrisks [4–6]. Some main issues concern the potential healthrisk for end users in contact with reclaimed wastewaters byirrigating food crops, especially in low- and middle-incomecountries. The major risk arises from the presence of pathogenicmicroorganisms in wastewater and it is especially worrisomewhen vegetables are eaten raw or undercooked, such as leafygreens [7].
As countries move to higher income levels, their approach towastewater reuse for irrigation changes from unplanned to plannedand more regulated and, at the same time, wastewater pollutionconcerns tend to change from predominantly fecal contamina-
tion to emerging contaminants, such as disinfectants, endocrinedisruptors, illicit drugs, personal care products, pesticides, pharma-ceuticals, resistant microorganisms [i.e. antibiotic resistant bacteria(ARB)]. Urban wastewater treatment plant (UWTP) effluents are
6 s B: En
soeirtrmp
UrbmtiBsIlfoatpww
mivdeTcpalaecms
2
2
lfs
TC
A
6 G. Ferro et al. / Applied Catalysi
uspected to be among the main anthropogenic sources for antibi-tics, MDR and antibiotic resistant genes (ARGs) release into thenvironment [8–10]. Nevertheless the detection of MDR and ARGsn wastewater effluents represents a new issue of concern in theeuse of wastewater. In particular, MDR, carrying antibiotic resis-ance genetic material that can be spread into the environment [11],esults in a decrease of antibiotic therapeutic potential against ani-al and human pathogens [12] and, finally, poses a severe risk to
ublic health [13].Conventional disinfection processes, namely chlorination and
V radiation, may not be effective in controlling MDR spread intoeceiving water [14–18]. Alternative disinfection processes haveeen investigated in order to control MDR spread into the environ-ent, overcoming drawbacks of traditional technologies. Among
hem advanced oxidation processes (AOPs) have been successfullynvestigated for the removal of a wide range of contaminants [19].ut up to date, a few and not exhaustive works are available in thecientific literature about their effect on MDR inactivation [20–23].t is well known that AOPs can take advantage of natural sunlightike sources of photons, thereby lowering the treatment costs [19];rom this perspective, they may decrease health risk for consumersf wastewater-irrigated crops in developing countries [24] and ben attractive option for wastewater treatment in small communi-ies. Among solar driven AOPs, heterogeneous and homogeneoushotocatalysis (i.e. TiO2 and photo-Fenton, respectively) are thosehich have received most research attention in recent decades forastewater treatment purposes [13,25,26].
The aim of this study was to comparatively assess the perfor-ance of different solar driven AOPs and solar water disinfection
n a pilot-scale compound parabolic collector plant, on the inacti-ation of a multidrug resistant E. coli strain in real wastewater, toecrease the microbial risk of treated and reclaimed UWTP efflu-nts. More specifically, solar photo-inactivation, H2O2/sunlight,iO2/sunlight, H2O2/TiO2/sunlight, photo-Fenton at pH ∼8.5, werearried out under different catalyst doses to (i) evaluate and com-are their effect on a multidrug resistant E. coli strain isolated fromn UWTP effluent and inoculated in an UWTP effluent freshly col-ected, and (ii) investigate the effect of disinfection processes onntibiotic resistance of surviving colonies. To the authors’ knowl-dge this work is the first where different solar driven AOPs wereomparatively investigated in the inactivation of an indigenousultidrug resistant bacterium strain, in real UWTP effluent, at pilot
cale.
. Materials and methods
.1. Selection of multidrug resistant E. coli strain
E. coli multidrug resistant strain was selected from UWTPocated in the province of Salerno (Italy). It was isolatedrom the effluent sample of the biological process (activatedludge) by membrane filtration and subsequent cultivation (24 h
able 1hemical characterization of the secondary UWTP effluent (El Bobar, Almería, Spain) afte
Secondary UWTP effluent characterization
Conductivity 1504 ± 154 (�s cm−1)pH 9.05 ± 0.12Turbidity 50 ± 16 (NTU)TC 70.21 ± 9.90 (mg L−1)IC 48.85 ± 7.94 (mg L−1)TOC 21.35 ± 4.80 (mg L−1)F− 0.11 ± 0.02 (mg L−1)Cl− 324.4 ± 49.1 (mg L−1)NO2
− 2.7 ± 2.1 (mg L−1)
verage values and standard deviation are reported.
vironmental 178 (2015) 65–73
incubation time at 44 ◦C) on selective medium, as described [27].Briefly, 50 mL of wastewater or its serial dilutions were filteredthrough membranes which were incubated on tryptone, bile salts,X-glucuronide (TBX, Oxoid), supplemented with a mixture of threeantibiotics (16 mg L−1 of ampicillin (AMP), 2 mg L−1 of ciprofloxacin(CIP) and 8 mg L−1 of tetracycline (TET)). Antibiotic concentrationswere selected according to the double of the respective minimuminhibitory concentration (MIC) values available in EUCAST database(2014). Some colonies were randomly picked up and frozen in 15%glycerol Triptone Soy broth (TSB) at −20 ◦C.
2.2. Inoculum and sample preparation
Wastewater samples were freshly collected from the UWTP ofAlmería, El Bobar (Spain), from the effluent of the biological process(activated sludge), on the morning of each disinfection experiment.They were autoclaved (15 min at 121 ◦C) in order to remove indige-nous bacteria and then inoculated with the selected multidrugresistant (MDR) E. coli strain, as described elsewhere [24]. Briefly,MDR E. coli colonies were unfrozen and reactivated by streaking onChromoCult® Coliform Agar (Merck KGaA, Darmstadt, Germany)and incubated at 37 ◦C for 18–24 h. A single colony from the platewas inoculated into 14 mL sterile Luria Bertani broth (LB, Sigma-Aldrich, USA) and incubated at 37 ◦C for 18 h by constant agitationin a rotator shaker to obtain a stationary phase culture. Cells wereharvested by centrifugation at 3000 rpm for 10 min and the pelletwas re-suspended in 14 mL phosphate buffer saline (PBS, Oxoid),yielding a final concentration of 109 CFU mL−1 approximately.
Wastewater had initial TOC values ranging from 15.09 to33.04 mg L−1, pH 8.84–9.26 and conductivity between 1010 and1668 �S cm−1. Total carbon and TOC were analyzed by ShimadzuTOC-5050 (Shimadzu Corporation, Kyoto, Japan) and the concen-trations of ions present in wastewater were evaluated by ionchromatography (IC) with a Dionex DX-600 (Dionex Corpora-tion, Sunnyvale, California, USA) system for anions and with aDionex DX-120 system for cations. Wastewater characterizationis reported in Table 1.
2.3. Bacterial count
Standard plated counting method was used through 10-foldserial dilutions in PBS after an incubation period of 24 h at 37 ◦C.Volumes of 20 �L were plated on Endo agar (Fluka, Sigma-Aldrich,USA). When very low concentrations of MDR E. coli were expectedto be found in water treated samples, 250 or 500 �L samples werespread onto ChromoCult® Coliform Agar plates. The detection limitof this experimental method was found to be 2 CFU mL−1.
2.4. Oxidants and catalysts dosages
2.4.1. Hydrogen peroxide (H2O2)Different H2O2 (Riedel-de Haën, Germany) concentrations were
used: 0.588, 1.470 and 2.205 mM in H2O2/sunlight experiments;
r autoclaving process.
Br− 2.6 ± 1.0 (mg L−1)NO3
− 25 ± 28.9 (mg L−1)PO4
3− 7.6 ± 9.2 (mg L−1)SO4
2− 81.4 ± 13.8 (mg L−1)Na+ 184.1 ± 28.5 (mg L−1)NH4
+ 34.7 ± 11.5 (mg L−1)K+ 25.5 ± 4.8 (mg L−1)Mg2+ 26.7 ± 6.6 (mg L−1)Ca2+ 51.8 ± 8.0 (mg L−1)
B: En
00cewwbGdmTwc
i2Ht
2
rpeo
2
sfm0s51lirco
2
p[tpaTtC
t1wtmdmbtcmr
G. Ferro et al. / Applied Catalysis
.147 and 0.588 mM in H2O2/TiO2/sunlight experiments; 0.294,
.588, 1.176 mM in solar photo-Fenton experiments. Those con-entrations were chosen according to the results from previousxperiments at laboratory scale (data not shown). H2O2 at 30 wt%as used as received and diluted into the reactor filled with waste-ater sample. H2O2 was determined by a colorimetric method
ased on the use of titanium (IV) oxysulfate (Riedel-de Haën,ermany), which forms a stable yellow complex with H2O2etected by absorbance measurements at 410 nm. Absorbance waseasured using a spectrophotometer (PG Instruments Ltd T-60-U).
he signal was read with reference to a H2O2 standard in distilledater. Absorbance measurement was linearly correlated with H2O2
oncentration in the range 0.1–100 mg L−1.Catalase was added to wastewater samples in order to elim-
nate residual H2O2: 1 mL samples were mixed with 20 �L of300 U mg−1 bovine liver catalase at 0.1 g L−1 (Sigma-Aldrich, USA).2O2 and catalase at these concentrations have been demonstrated
o have no detrimental effects on E. coli viability [28].
.4.2. Titanium dioxide (TiO2)Aeroxide P25 (Evonik Corporation, Germany) TiO2 was used as
eceived from the manufacturer as slurry to perform heterogeneoushotocatalytic experiments. They were carried out at two differ-nt concentrations: 50 and 100 mg L−1 photocatalyst loading beingptimized according to previous laboratory tests [29].
.4.3. IronFerrous sulfate (FeSO4•7H2O, PANREAC, Spain) was used as
ource of Fe2+ at concentrations of 0.090, 0.179 and 0.358 mMor homogeneous photo-Fenton reaction. Fe2+ concentrations were
easured according to ISO 6332. All samples were filtered with.20 �m CHROMAFIL® XtraPET-20/25 (PANREAC, Spain) and mea-ured with spectrophotometer (PG Instruments Ltd. T-60-U) at10 nm. The concentration ratio of iron and hydrogen peroxide was:2. For photo-Fenton tests, a freshly prepared solution of bovine
iver catalase (0.1 g L−1,Sigma-Aldrich, USA) was added to samplesn a ratio 0.1/5 (v/v) to eliminate residual H2O2 and avoid Fentoneactions after sample collection. H2O2 and catalase at these con-entrations have been demonstrated to have no detrimental effectsn E. coli viability.
.5. Solar photo-reactor
Experiments were carried out in a pilot-scale compoundarabolic collector (CPC) plant. This system, described elsewhere29], consists of tube modules placed on a tilted platform connectedo a recirculation tank and a centrifugal pump. They are cylindricalrototypes made of borosilicate glass of 2.5 mm thickness whichllows a 90% transmission of UVA in the natural solar spectrum.he photo-reactor is inclined at 37◦ with respect to the horizontalo maximize solar radiation collection and is equipped with staticPC [30] whose concentration factor is equal to 1.
The photoreactor volume is 8.5 L, the illuminated volume is 4.7 L,he irradiated collector surface is 0.4 m2, water flow rate was set as6 L min−1. This flow rate guarantees a turbulent regime (Re = 8600)hich results in a proper homogenization of water samples. For
he case of heterogeneous photocatalysis, it was also required toaintain TiO2 nanoparticles perfectly suspended, homogeneously
istributed and without sedimentation. This flow regime also per-its the best conditions for achieving a good contact between
acteria and catalyst nanoparticles during photocatalytic disinfec-
ion, and any bacterial removal associated to particle sedimentationan be discarded. The experimental setup allowed two experi-ents to be performed simultaneously in two identical solar CPCeactors.
vironmental 178 (2015) 65–73 67
2.6. Solar experiments
All solar experiments were carried out in duplicate during 3–5 hof solar exposure on clear sunny days at Plataforma Solar de Almería(PSA, Southeast of Spain, latitude 37◦84′ N and longitude 2◦ 34′ W)from October 2013 to May 2014.
Solar photo-reactor was filled in with 8.5 L of autoclaved realwastewater. The selected strain was added to an initial concentra-tion of ∼105 CFU mL−1 and the suspension was homogenized whilethe reactor was still covered. Reagents were added to each reactortank and re-circulated for 15 min to ensure homogenization. Thenthe first sample was taken and the cover was removed. Sampleswere collected at regular intervals to determine indicator concen-trations: sampling frequency varied on the basis of treatment.
Water temperature was measured hourly in each reactor by athermometer (Checktemp, Hanna instruments, Spain): it rangedfrom 21.2 to 44.0 ◦C. pH (multi720, WTW, Germany) and H2O2were also measured in the reactor during the experiments. For eachtest, a water sample was taken and kept in the dark at laboratorytemperature as a control which was plated at the end of the exper-iment. Inactivation results were plotted as the average of at leasttwo replicates for each solar driven experiment.
2.7. Solar UVA radiation measurement
Solar UVA radiation was measured with a global UVA pyranome-ter (300–400 nm, Model CUV4, Kipp&Zonen, Netherlands) tilted37◦, the same angle as the local latitude. This instrument providesdata in terms of incident UVA (in W m−2), which is the solar radiantUVA energy rate incident on a surface per unit area. In this study,the inactivation rate is plotted as a function of both experimentaltime (t) and cumulative energy per unit of volume (QUV) receivedin the photoreactor, and calculated by Eq. (1):
QUV,n = QUV,n−1 + �tnUVG,nAr
Vt�tn = tn − tn−1 (1)
where QUV,n, QUV,n − 1 is the UV energy accumulated per liter (kJ L−1)at times n and n − 1, UVG,n is the average incident radiation onthe irradiated area, �tn is the experimental time of sample, Ar isthe illuminated area of collector (m2), Vt is the total volume ofwater treated (L). QUV is commonly used to compare results underdifferent conditions [19].
The average solar UVA irradiance for all tests was37.34 ± 4.30 W m−2 within the period 10:00–16:00 local time,with maximum values of 44.38 W m−2.
2.8. Antibiotic resistance assay
Antibiotic resistance phenotypes were tested by Kirby-Bauerdisk diffusion method according to standard recommendations[31]. Briefly, E. coli colonies, prior to and after disinfectiontreatment, were randomly collected from some agar/irradiationtime and transferred into a physiological solution to achieve1–2 × 10⁸ CFU mL−1 (0.5 McFarland) suspension. Then it wasspread onto Mueller Hinton agar II (Fluka, Sigma-Aldrich, USA)using a sterile cotton swab. Antibiotic discs (Biolife, Italy) of ampi-cillin (AMP, 10 �g), ciprofloxacin (CIPR, 5 �g), cefuroxime (CXM,30 �g), nitrofurantoin (NI, 100 �g), tetracycline (TET, 30 �g) andvancomycin (VAN, 30 �g) were placed on the surface of each inoc-ulated plate. After 18 h of incubation at 35 ◦C, the diameters of
antibiotic inhibition of growth were measured and compared withinhibition diameters of E. coli for disk diffusion method available inEUCAST (2014) database. The strain was classified as resistant (R) ifthe measured diameter was lower than: 14 mm for AMP, 19 mm for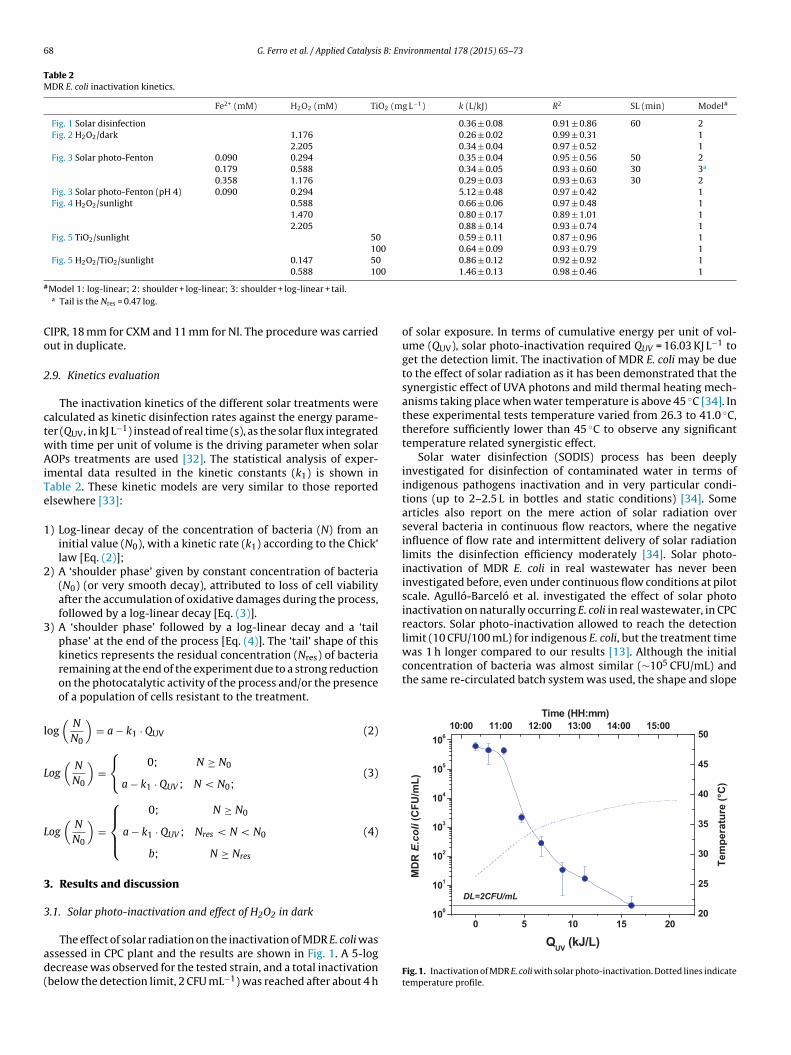
68 G. Ferro et al. / Applied Catalysis B: Environmental 178 (2015) 65–73
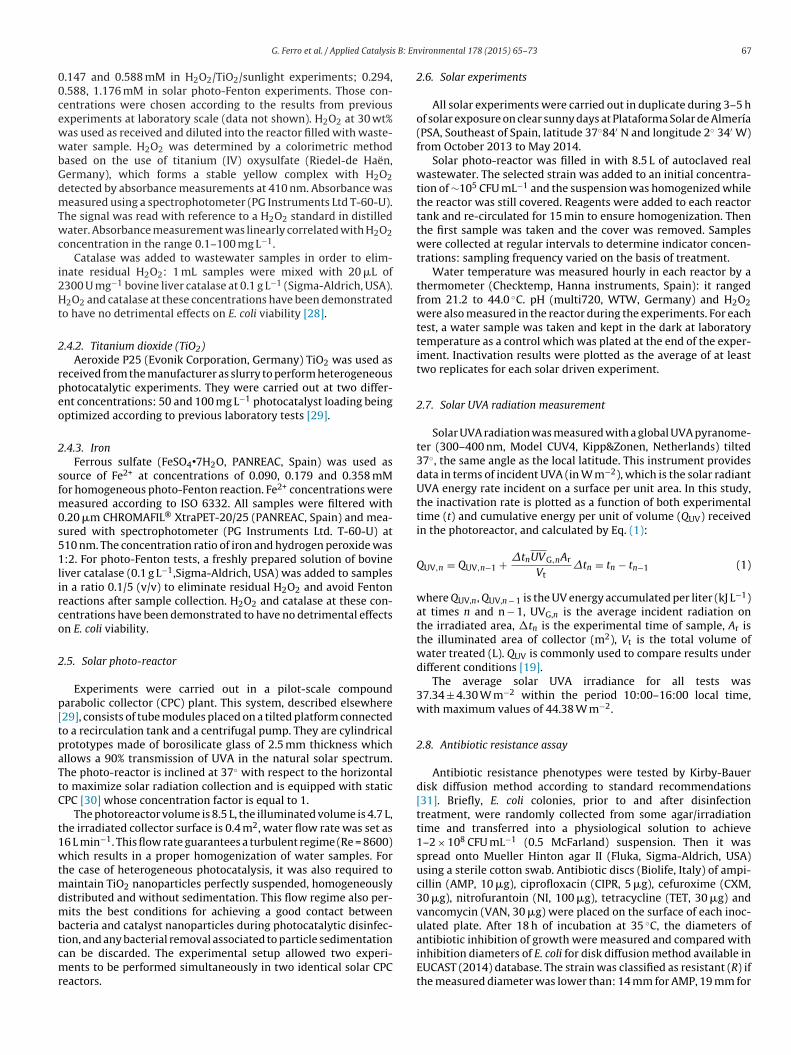
Table 2MDR E. coli inactivation kinetics.
Fe2+ (mM) H2O2 (mM) TiO2 (mg L−1) k (L/kJ) R2 SL (min) Model#
Fig. 1 Solar disinfection 0.36 ± 0.08 0.91 ± 0.86 60 2Fig. 2 H2O2/dark 1.176 0.26 ± 0.02 0.99 ± 0.31 1
2.205 0.34 ± 0.04 0.97 ± 0.52 1Fig. 3 Solar photo-Fenton 0.090 0.294 0.35 ± 0.04 0.95 ± 0.56 50 2
0.179 0.588 0.34 ± 0.05 0.93 ± 0.60 30 3a
0.358 1.176 0.29 ± 0.03 0.93 ± 0.63 30 2Fig. 3 Solar photo-Fenton (pH 4) 0.090 0.294 5.12 ± 0.48 0.97 ± 0.42 1Fig. 4 H2O2/sunlight 0.588 0.66 ± 0.06 0.97 ± 0.48 1
1.470 0.80 ± 0.17 0.89 ± 1.01 12.205 0.88 ± 0.14 0.93 ± 0.74 1
Fig. 5 TiO2/sunlight 50 0.59 ± 0.11 0.87 ± 0.96 1100 0.64 ± 0.09 0.93 ± 0.79 1
Fig. 5 H2O2/TiO2/sunlight 0.147 50 0.86 ± 0.12 0.92 ± 0.92 10.588 100 1.46 ± 0.13 0.98 ± 0.46 1
#
Co
2
ctwAiTe
1
2
3
l
L
L
3
3
ad(
limit (10 CFU/100 mL) for indigenous E. coli, but the treatment timewas 1 h longer compared to our results [13]. Although the initialconcentration of bacteria was almost similar (∼105 CFU/mL) andthe same re-circulated batch system was used, the shape and slope
0 5 10 15 20100
101
102
103
104
105
106
20
25
30
35
40
45
5010:00 11:00 12:00 13:00 14:00 15:00
MD
RE.coli
(CFU
/mL)
Tem
pera
ture
(°C
)
DL=2CFU/mL
Time (HH:mm)
Model 1: log-linear; 2: shoulder + log-linear; 3: shoulder + log-linear + tail.a Tail is the Nres = 0.47 log.
IPR, 18 mm for CXM and 11 mm for NI. The procedure was carriedut in duplicate.
.9. Kinetics evaluation
The inactivation kinetics of the different solar treatments werealculated as kinetic disinfection rates against the energy parame-er (QUV, in kJ L−1) instead of real time (s), as the solar flux integratedith time per unit of volume is the driving parameter when solarOPs treatments are used [32]. The statistical analysis of exper-
mental data resulted in the kinetic constants (k1) is shown inable 2. These kinetic models are very similar to those reportedlsewhere [33]:
) Log-linear decay of the concentration of bacteria (N) from aninitial value (N0), with a kinetic rate (k1) according to the Chick’law [Eq. (2)];
) A ‘shoulder phase’ given by constant concentration of bacteria(N0) (or very smooth decay), attributed to loss of cell viabilityafter the accumulation of oxidative damages during the process,followed by a log-linear decay [Eq. (3)].
) A ‘shoulder phase’ followed by a log-linear decay and a ‘tailphase’ at the end of the process [Eq. (4)]. The ‘tail’ shape of thiskinetics represents the residual concentration (Nres) of bacteriaremaining at the end of the experiment due to a strong reductionon the photocatalytic activity of the process and/or the presenceof a population of cells resistant to the treatment.
og(
N
N0
)= a − k1 · QUV (2)
og(
N
N0
)=
{0; N ≥ N0
a − k1 · QUV ; N < N0;(3)
og(
N
N0
)=
⎧⎪⎨⎪⎩
0; N ≥ N0
a − k1 · QUV ; Nres < N < N0
b; N ≥ Nres
(4)
. Results and discussion
.1. Solar photo-inactivation and effect of H2O2 in dark
The effect of solar radiation on the inactivation of MDR E. coli wasssessed in CPC plant and the results are shown in Fig. 1. A 5-logecrease was observed for the tested strain, and a total inactivationbelow the detection limit, 2 CFU mL−1) was reached after about 4 h
of solar exposure. In terms of cumulative energy per unit of vol-ume (QUV), solar photo-inactivation required QUV = 16.03 KJ L−1 toget the detection limit. The inactivation of MDR E. coli may be dueto the effect of solar radiation as it has been demonstrated that thesynergistic effect of UVA photons and mild thermal heating mech-anisms taking place when water temperature is above 45 ◦C [34]. Inthese experimental tests temperature varied from 26.3 to 41.0 ◦C,therefore sufficiently lower than 45 ◦C to observe any significanttemperature related synergistic effect.
Solar water disinfection (SODIS) process has been deeplyinvestigated for disinfection of contaminated water in terms ofindigenous pathogens inactivation and in very particular condi-tions (up to 2–2.5 L in bottles and static conditions) [34]. Somearticles also report on the mere action of solar radiation overseveral bacteria in continuous flow reactors, where the negativeinfluence of flow rate and intermittent delivery of solar radiationlimits the disinfection efficiency moderately [34]. Solar photo-inactivation of MDR E. coli in real wastewater has never beeninvestigated before, even under continuous flow conditions at pilotscale. Agulló-Barceló et al. investigated the effect of solar photoinactivation on naturally occurring E. coli in real wastewater, in CPCreactors. Solar photo-inactivation allowed to reach the detection
QUV (kJ/L)
Fig. 1. Inactivation of MDR E. coli with solar photo-inactivation. Dotted lines indicatetemperature profile.
G. Ferro et al. / Applied Catalysis B: Environmental 178 (2015) 65–73 69
10:00 11:00 12:00 13:00 14:00100
101
102
103
104
105
106
20
25
30
35
40
45
50M
DR
E.coli (
CFU
/mL)
Time (HH:mm)
1.176 mM 2.205 mM
Tem
pera
ture
(°C
)
DL=2CFU/mL
ofiolcoMw(lssM
pths1attctcetltsdt2i
3
Ueow4Mc
0 5 10 15 20100
101
102
103
104
105
106
20
25
30
35
40
45
5011:00 12:00 13:00 14:00 15:00
MD
RE.coli
(CFU
/mL)
QUV (kJ/L)
Fe2+=0.090 mM,H2O2=0.294 mM, pH=8.9
Fe2+=0.179 mM,H2O2=0.588 mM, pH=8.7
Fe2+=0.358 mM,H2O2=1.176 mM, pH=8.6
Fe2+=0.090 mM,H2O2=0.294 mM, pH=4.0
Tem
pera
ture
(°C
)
DL=2CFU/mL
Time (HH:mm)
may be due to the different sensitivity of the MDR E. coli strain
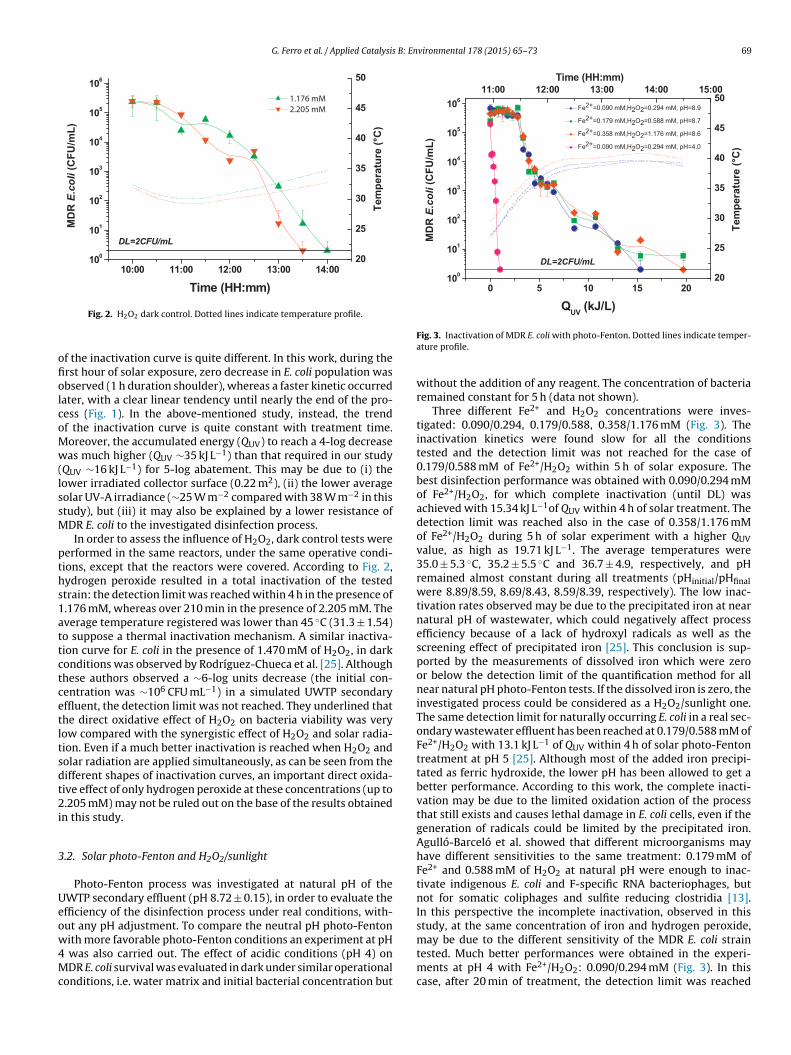
Fig. 2. H2O2 dark control. Dotted lines indicate temperature profile.
f the inactivation curve is quite different. In this work, during therst hour of solar exposure, zero decrease in E. coli population wasbserved (1 h duration shoulder), whereas a faster kinetic occurredater, with a clear linear tendency until nearly the end of the pro-ess (Fig. 1). In the above-mentioned study, instead, the trendf the inactivation curve is quite constant with treatment time.oreover, the accumulated energy (QUV) to reach a 4-log decreaseas much higher (QUV ∼35 kJ L−1) than that required in our study
QUV ∼16 kJ L−1) for 5-log abatement. This may be due to (i) theower irradiated collector surface (0.22 m2), (ii) the lower averageolar UV-A irradiance (∼25 W m−2 compared with 38 W m−2 in thistudy), but (iii) it may also be explained by a lower resistance ofDR E. coli to the investigated disinfection process.In order to assess the influence of H2O2, dark control tests were
erformed in the same reactors, under the same operative condi-ions, except that the reactors were covered. According to Fig. 2,ydrogen peroxide resulted in a total inactivation of the testedtrain: the detection limit was reached within 4 h in the presence of.176 mM, whereas over 210 min in the presence of 2.205 mM. Theverage temperature registered was lower than 45 ◦C (31.3 ± 1.54)o suppose a thermal inactivation mechanism. A similar inactiva-ion curve for E. coli in the presence of 1.470 mM of H2O2, in darkonditions was observed by Rodríguez-Chueca et al. [25]. Althoughhese authors observed a ∼6-log units decrease (the initial con-entration was ∼106 CFU mL−1) in a simulated UWTP secondaryffluent, the detection limit was not reached. They underlined thathe direct oxidative effect of H2O2 on bacteria viability was veryow compared with the synergistic effect of H2O2 and solar radia-ion. Even if a much better inactivation is reached when H2O2 andolar radiation are applied simultaneously, as can be seen from theifferent shapes of inactivation curves, an important direct oxida-ive effect of only hydrogen peroxide at these concentrations (up to.205 mM) may not be ruled out on the base of the results obtained
n this study.
.2. Solar photo-Fenton and H2O2/sunlight
Photo-Fenton process was investigated at natural pH of theWTP secondary effluent (pH 8.72 ± 0.15), in order to evaluate thefficiency of the disinfection process under real conditions, with-ut any pH adjustment. To compare the neutral pH photo-Fentonith more favorable photo-Fenton conditions an experiment at pH
was also carried out. The effect of acidic conditions (pH 4) onDR E. coli survival was evaluated in dark under similar operationalonditions, i.e. water matrix and initial bacterial concentration but
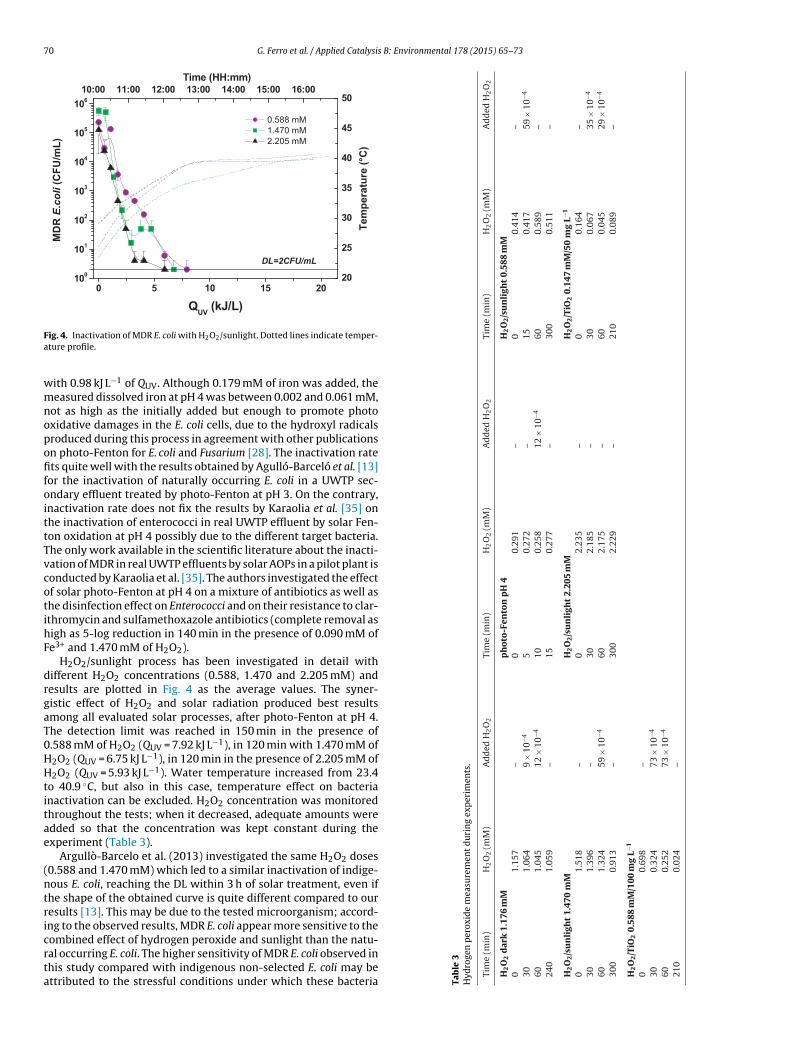
Fig. 3. Inactivation of MDR E. coli with photo-Fenton. Dotted lines indicate temper-ature profile.
without the addition of any reagent. The concentration of bacteriaremained constant for 5 h (data not shown).
Three different Fe2+ and H2O2 concentrations were inves-tigated: 0.090/0.294, 0.179/0.588, 0.358/1.176 mM (Fig. 3). Theinactivation kinetics were found slow for all the conditionstested and the detection limit was not reached for the case of0.179/0.588 mM of Fe2+/H2O2 within 5 h of solar exposure. Thebest disinfection performance was obtained with 0.090/0.294 mMof Fe2+/H2O2, for which complete inactivation (until DL) wasachieved with 15.34 kJ L−1of QUV within 4 h of solar treatment. Thedetection limit was reached also in the case of 0.358/1.176 mMof Fe2+/H2O2 during 5 h of solar experiment with a higher QUVvalue, as high as 19.71 kJ L−1. The average temperatures were35.0 ± 5.3 ◦C, 35.2 ± 5.5 ◦C and 36.7 ± 4.9, respectively, and pHremained almost constant during all treatments (pHinitial/pHfinalwere 8.89/8.59, 8.69/8.43, 8.59/8.39, respectively). The low inac-tivation rates observed may be due to the precipitated iron at nearnatural pH of wastewater, which could negatively affect processefficiency because of a lack of hydroxyl radicals as well as thescreening effect of precipitated iron [25]. This conclusion is sup-ported by the measurements of dissolved iron which were zeroor below the detection limit of the quantification method for allnear natural pH photo-Fenton tests. If the dissolved iron is zero, theinvestigated process could be considered as a H2O2/sunlight one.The same detection limit for naturally occurring E. coli in a real sec-ondary wastewater effluent has been reached at 0.179/0.588 mM ofFe2+/H2O2 with 13.1 kJ L−1 of QUV within 4 h of solar photo-Fentontreatment at pH 5 [25]. Although most of the added iron precipi-tated as ferric hydroxide, the lower pH has been allowed to get abetter performance. According to this work, the complete inacti-vation may be due to the limited oxidation action of the processthat still exists and causes lethal damage in E. coli cells, even if thegeneration of radicals could be limited by the precipitated iron.Agulló-Barceló et al. showed that different microorganisms mayhave different sensitivities to the same treatment: 0.179 mM ofFe2+ and 0.588 mM of H2O2 at natural pH were enough to inac-tivate indigenous E. coli and F-specific RNA bacteriophages, butnot for somatic coliphages and sulfite reducing clostridia [13].In this perspective the incomplete inactivation, observed in thisstudy, at the same concentration of iron and hydrogen peroxide,
tested. Much better performances were obtained in the experi-ments at pH 4 with Fe2+/H2O2: 0.090/0.294 mM (Fig. 3). In thiscase, after 20 min of treatment, the detection limit was reached
70 G. Ferro et al. / Applied Catalysis B: Environmental 178 (2015) 65–73
0 5 10 15 20100
101
102
103
104
105
106
20
25
30
35
40
45
5010:00 11:00 12:00 13:00 14:00 15:00 16:00
MD
RE.coli
(CFU
/mL)
QUV (kJ/L)
0.588 mM 1.470 mM 2.205 mM
Tem
pera
ture
(°C
)
DL=2CFU/mL
Time (HH:mm)
Fa
wmnopofifoittTvcotihF
drgaT0HHtitae
(ntricrta
erox
ide
mea
sure
men
td
uri
ng
exp
erim
ents
.
n)
H2O
2(m
M)
Ad
ded
H2O
2Ti
me
(min
)H
2O
2(m
M)
Ad
ded
H2O
2Ti
me
(min
)H
2O
2(m
M)
Ad
ded
H2O
2
k1.
176
mM
ph
oto
-Fen
ton
pH
4H
2O
2/s
un
ligh
t0.
588
mM
1.15
7–
00.
291
–0
0.41
4–
1.06
49
×10
−45
0.27
2–
150.
417
59×
10−4
1.04
512
×10
−410
0.25
812
×10
−460
0.58
9–
1.05
9–
150.
277
–30
00.
511
–
ligh
t1.
470
mM
H2O
2/s
un
ligh
t2.
205
mM
H2O
2/T
iO2
0.14
7m
M/5
0m
gL−1
1.51
8–
02.
235
–0
0.16
4–
1.39
6–
302.
185
–30
0.06
735
×10
−4
1.32
459
×10
−460
2.17
5–
600.
045
29×
10−4
0.91
3–
300
2.22
9–
210
0.08
9–
20.
588
mM
/100
mg
L−1
0.69
8–
0.32
473
×10
−4
0.25
273
×10
−4
0.02
4–
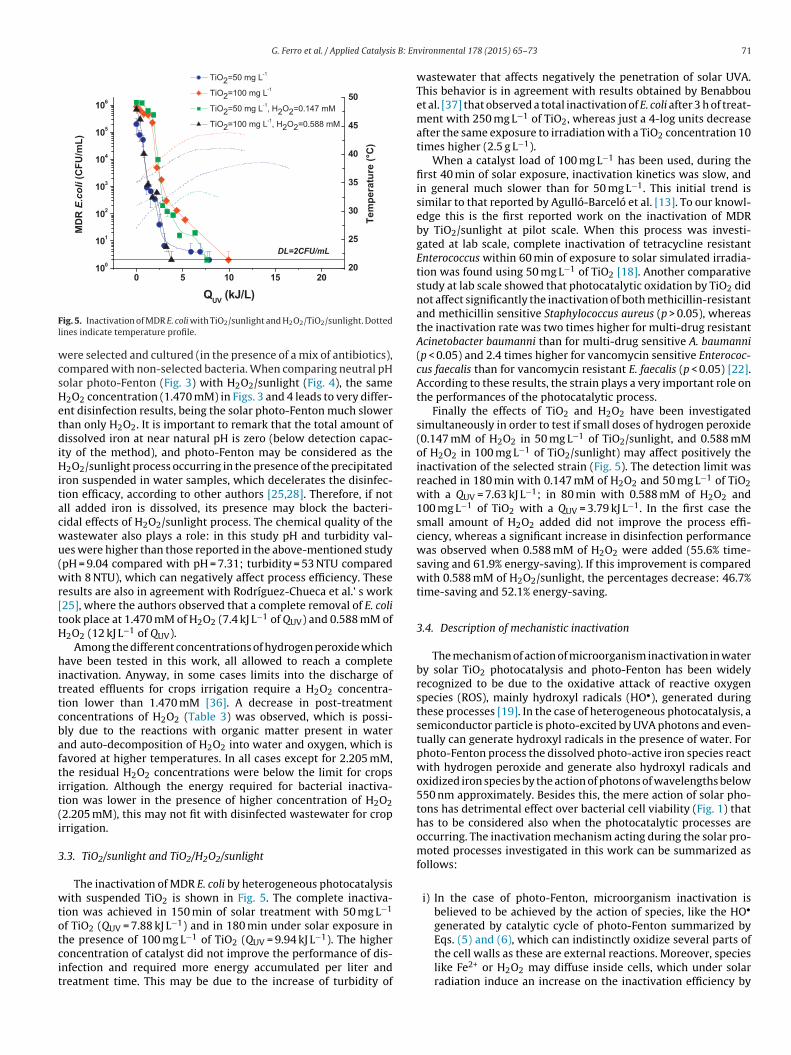
ig. 4. Inactivation of MDR E. coli with H2O2/sunlight. Dotted lines indicate temper-ture profile.
ith 0.98 kJ L−1 of QUV. Although 0.179 mM of iron was added, theeasured dissolved iron at pH 4 was between 0.002 and 0.061 mM,
ot as high as the initially added but enough to promote photoxidative damages in the E. coli cells, due to the hydroxyl radicalsroduced during this process in agreement with other publicationsn photo-Fenton for E. coli and Fusarium [28]. The inactivation ratets quite well with the results obtained by Agulló-Barceló et al. [13]
or the inactivation of naturally occurring E. coli in a UWTP sec-ndary effluent treated by photo-Fenton at pH 3. On the contrary,nactivation rate does not fix the results by Karaolia et al. [35] onhe inactivation of enterococci in real UWTP effluent by solar Fen-on oxidation at pH 4 possibly due to the different target bacteria.he only work available in the scientific literature about the inacti-ation of MDR in real UWTP effluents by solar AOPs in a pilot plant isonducted by Karaolia et al. [35]. The authors investigated the effectf solar photo-Fenton at pH 4 on a mixture of antibiotics as well ashe disinfection effect on Enterococci and on their resistance to clar-thromycin and sulfamethoxazole antibiotics (complete removal asigh as 5-log reduction in 140 min in the presence of 0.090 mM ofe3+ and 1.470 mM of H2O2).
H2O2/sunlight process has been investigated in detail withifferent H2O2 concentrations (0.588, 1.470 and 2.205 mM) andesults are plotted in Fig. 4 as the average values. The syner-istic effect of H2O2 and solar radiation produced best resultsmong all evaluated solar processes, after photo-Fenton at pH 4.he detection limit was reached in 150 min in the presence of.588 mM of H2O2 (QUV = 7.92 kJ L−1), in 120 min with 1.470 mM of2O2 (QUV = 6.75 kJ L−1), in 120 min in the presence of 2.205 mM of2O2 (QUV = 5.93 kJ L−1). Water temperature increased from 23.4
o 40.9 ◦C, but also in this case, temperature effect on bacterianactivation can be excluded. H2O2 concentration was monitoredhroughout the tests; when it decreased, adequate amounts weredded so that the concentration was kept constant during thexperiment (Table 3).
Argullò-Barcelo et al. (2013) investigated the same H2O2 doses0.588 and 1.470 mM) which led to a similar inactivation of indige-ous E. coli, reaching the DL within 3 h of solar treatment, even ifhe shape of the obtained curve is quite different compared to ouresults [13]. This may be due to the tested microorganism; accord-ng to the observed results, MDR E. coli appear more sensitive to the
ombined effect of hydrogen peroxide and sunlight than the natu-al occurring E. coli. The higher sensitivity of MDR E. coli observed inhis study compared with indigenous non-selected E. coli may bettributed to the stressful conditions under which these bacteria Table
3H
ydro
gen
p
Tim
e(m
i
H2O
2d
ar0 30 60 24
0
H2O
2/s
un
0 30 60 300
H2O
2/T
iO0 30 60 21
0
G. Ferro et al. / Applied Catalysis B: En
Fl
wcsHetdiHitacwu(wr[tH
hittcbaftit(i
3
wtotcit
ig. 5. Inactivation of MDR E. coli with TiO2/sunlight and H2O2/TiO2/sunlight. Dottedines indicate temperature profile.
ere selected and cultured (in the presence of a mix of antibiotics),ompared with non-selected bacteria. When comparing neutral pHolar photo-Fenton (Fig. 3) with H2O2/sunlight (Fig. 4), the same2O2 concentration (1.470 mM) in Figs. 3 and 4 leads to very differ-nt disinfection results, being the solar photo-Fenton much slowerhan only H2O2. It is important to remark that the total amount ofissolved iron at near natural pH is zero (below detection capac-
ty of the method), and photo-Fenton may be considered as the2O2/sunlight process occurring in the presence of the precipitated
ron suspended in water samples, which decelerates the disinfec-ion efficacy, according to other authors [25,28]. Therefore, if notll added iron is dissolved, its presence may block the bacteri-idal effects of H2O2/sunlight process. The chemical quality of theastewater also plays a role: in this study pH and turbidity val-es were higher than those reported in the above-mentioned studypH = 9.04 compared with pH = 7.31; turbidity = 53 NTU comparedith 8 NTU), which can negatively affect process efficiency. These
esults are also in agreement with Rodríguez-Chueca et al.’ s work25], where the authors observed that a complete removal of E. coliook place at 1.470 mM of H2O2 (7.4 kJ L−1 of QUV) and 0.588 mM of2O2 (12 kJ L−1 of QUV).
Among the different concentrations of hydrogen peroxide whichave been tested in this work, all allowed to reach a complete
nactivation. Anyway, in some cases limits into the discharge ofreated effluents for crops irrigation require a H2O2 concentra-ion lower than 1.470 mM [36]. A decrease in post-treatmentoncentrations of H2O2 (Table 3) was observed, which is possi-ly due to the reactions with organic matter present in waternd auto-decomposition of H2O2 into water and oxygen, which isavored at higher temperatures. In all cases except for 2.205 mM,he residual H2O2 concentrations were below the limit for cropsrrigation. Although the energy required for bacterial inactiva-ion was lower in the presence of higher concentration of H2O22.205 mM), this may not fit with disinfected wastewater for croprrigation.
.3. TiO2/sunlight and TiO2/H2O2/sunlight
The inactivation of MDR E. coli by heterogeneous photocatalysisith suspended TiO2 is shown in Fig. 5. The complete inactiva-
ion was achieved in 150 min of solar treatment with 50 mg L−1
f TiO2 (QUV = 7.88 kJ L−1) and in 180 min under solar exposure in
he presence of 100 mg L−1 of TiO2 (QUV = 9.94 kJ L−1). The higheroncentration of catalyst did not improve the performance of dis-nfection and required more energy accumulated per liter andreatment time. This may be due to the increase of turbidity ofvironmental 178 (2015) 65–73 71
wastewater that affects negatively the penetration of solar UVA.This behavior is in agreement with results obtained by Benabbouet al. [37] that observed a total inactivation of E. coli after 3 h of treat-ment with 250 mg L−1 of TiO2, whereas just a 4-log units decreaseafter the same exposure to irradiation with a TiO2 concentration 10times higher (2.5 g L−1).
When a catalyst load of 100 mg L−1 has been used, during thefirst 40 min of solar exposure, inactivation kinetics was slow, andin general much slower than for 50 mg L−1. This initial trend issimilar to that reported by Agulló-Barceló et al. [13]. To our knowl-edge this is the first reported work on the inactivation of MDRby TiO2/sunlight at pilot scale. When this process was investi-gated at lab scale, complete inactivation of tetracycline resistantEnterococcus within 60 min of exposure to solar simulated irradia-tion was found using 50 mg L−1 of TiO2 [18]. Another comparativestudy at lab scale showed that photocatalytic oxidation by TiO2 didnot affect significantly the inactivation of both methicillin-resistantand methicillin sensitive Staphylococcus aureus (p > 0.05), whereasthe inactivation rate was two times higher for multi-drug resistantAcinetobacter baumanni than for multi-drug sensitive A. baumanni(p < 0.05) and 2.4 times higher for vancomycin sensitive Enterococ-cus faecalis than for vancomycin resistant E. faecalis (p < 0.05) [22].According to these results, the strain plays a very important role onthe performances of the photocatalytic process.
Finally the effects of TiO2 and H2O2 have been investigatedsimultaneously in order to test if small doses of hydrogen peroxide(0.147 mM of H2O2 in 50 mg L−1 of TiO2/sunlight, and 0.588 mMof H2O2 in 100 mg L−1 of TiO2/sunlight) may affect positively theinactivation of the selected strain (Fig. 5). The detection limit wasreached in 180 min with 0.147 mM of H2O2 and 50 mg L−1 of TiO2with a QUV = 7.63 kJ L−1; in 80 min with 0.588 mM of H2O2 and100 mg L−1 of TiO2 with a QUV = 3.79 kJ L−1. In the first case thesmall amount of H2O2 added did not improve the process effi-ciency, whereas a significant increase in disinfection performancewas observed when 0.588 mM of H2O2 were added (55.6% time-saving and 61.9% energy-saving). If this improvement is comparedwith 0.588 mM of H2O2/sunlight, the percentages decrease: 46.7%time-saving and 52.1% energy-saving.
3.4. Description of mechanistic inactivation
The mechanism of action of microorganism inactivation in waterby solar TiO2 photocatalysis and photo-Fenton has been widelyrecognized to be due to the oxidative attack of reactive oxygenspecies (ROS), mainly hydroxyl radicals (HO•), generated duringthese processes [19]. In the case of heterogeneous photocatalysis, asemiconductor particle is photo-excited by UVA photons and even-tually can generate hydroxyl radicals in the presence of water. Forphoto-Fenton process the dissolved photo-active iron species reactwith hydrogen peroxide and generate also hydroxyl radicals andoxidized iron species by the action of photons of wavelengths below550 nm approximately. Besides this, the mere action of solar pho-tons has detrimental effect over bacterial cell viability (Fig. 1) thathas to be considered also when the photocatalytic processes areoccurring. The inactivation mechanism acting during the solar pro-moted processes investigated in this work can be summarized asfollows:
i) In the case of photo-Fenton, microorganism inactivation isbelieved to be achieved by the action of species, like the HO•
generated by catalytic cycle of photo-Fenton summarized by
Eqs. (5) and (6), which can indistinctly oxidize several parts ofthe cell walls as these are external reactions. Moreover, specieslike Fe2+ or H2O2 may diffuse inside cells, which under solarradiation induce an increase on the inactivation efficiency by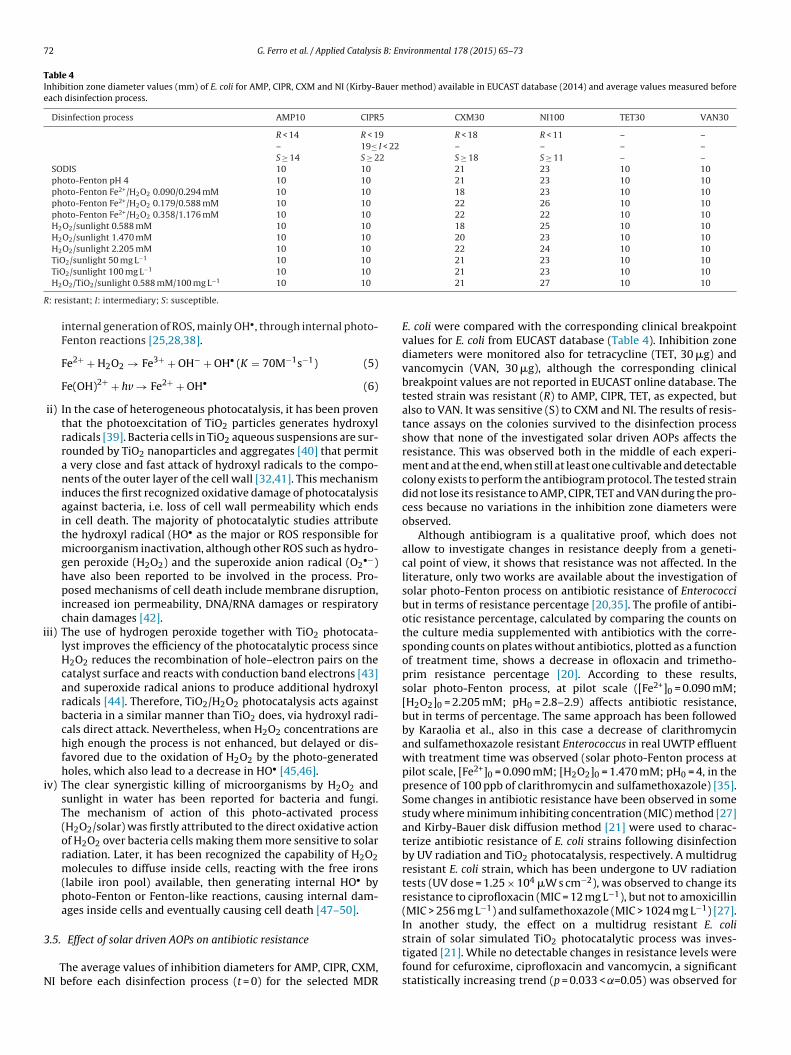
72 G. Ferro et al. / Applied Catalysis B: Environmental 178 (2015) 65–73
Table 4Inhibition zone diameter values (mm) of E. coli for AMP, CIPR, CXM and NI (Kirby-Bauer method) available in EUCAST database (2014) and average values measured beforeeach disinfection process.
Disinfection process AMP10 CIPR5 CXM30 NI100 TET30 VAN30
R < 14 R < 19 R < 18 R < 11 – –– 19≤ I < 22 – – – –S ≥ 14 S ≥ 22 S ≥ 18 S ≥ 11 – –
SODIS 10 10 21 23 10 10photo-Fenton pH 4 10 10 21 23 10 10photo-Fenton Fe2+/H2O2 0.090/0.294 mM 10 10 18 23 10 10photo-Fenton Fe2+/H2O2 0.179/0.588 mM 10 10 22 26 10 10photo-Fenton Fe2+/H2O2 0.358/1.176 mM 10 10 22 22 10 10H2O2/sunlight 0.588 mM 10 10 18 25 10 10H2O2/sunlight 1.470 mM 10 10 20 23 10 10H2O2/sunlight 2.205 mM 10 10 22 24 10 10TiO2/sunlight 50 mg L−1 10 10 21 23 10 10
R
i
i
3
N
TiO2/sunlight 100 mg L−1 10 10H2O2/TiO2/sunlight 0.588 mM/100 mg L−1 10 10
: resistant; I: intermediary; S: susceptible.
internal generation of ROS, mainly OH•, through internal photo-Fenton reactions [25,28,38].
Fe2+ + H2O2 → Fe3+ + OH− + OH• (K = 70M−1s−1) (5)
Fe(OH)2+ + hv → Fe2+ + OH• (6)
ii) In the case of heterogeneous photocatalysis, it has been proventhat the photoexcitation of TiO2 particles generates hydroxylradicals [39]. Bacteria cells in TiO2 aqueous suspensions are sur-rounded by TiO2 nanoparticles and aggregates [40] that permita very close and fast attack of hydroxyl radicals to the compo-nents of the outer layer of the cell wall [32,41]. This mechanisminduces the first recognized oxidative damage of photocatalysisagainst bacteria, i.e. loss of cell wall permeability which endsin cell death. The majority of photocatalytic studies attributethe hydroxyl radical (HO• as the major or ROS responsible formicroorganism inactivation, although other ROS such as hydro-gen peroxide (H2O2) and the superoxide anion radical (O2
•−)have also been reported to be involved in the process. Pro-posed mechanisms of cell death include membrane disruption,increased ion permeability, DNA/RNA damages or respiratorychain damages [42].
ii) The use of hydrogen peroxide together with TiO2 photocata-lyst improves the efficiency of the photocatalytic process sinceH2O2 reduces the recombination of hole–electron pairs on thecatalyst surface and reacts with conduction band electrons [43]and superoxide radical anions to produce additional hydroxylradicals [44]. Therefore, TiO2/H2O2 photocatalysis acts againstbacteria in a similar manner than TiO2 does, via hydroxyl radi-cals direct attack. Nevertheless, when H2O2 concentrations arehigh enough the process is not enhanced, but delayed or dis-favored due to the oxidation of H2O2 by the photo-generatedholes, which also lead to a decrease in HO• [45,46].
v) The clear synergistic killing of microorganisms by H2O2 andsunlight in water has been reported for bacteria and fungi.The mechanism of action of this photo-activated process(H2O2/solar) was firstly attributed to the direct oxidative actionof H2O2 over bacteria cells making them more sensitive to solarradiation. Later, it has been recognized the capability of H2O2molecules to diffuse inside cells, reacting with the free irons(labile iron pool) available, then generating internal HO• byphoto-Fenton or Fenton-like reactions, causing internal dam-ages inside cells and eventually causing cell death [47–50].
.5. Effect of solar driven AOPs on antibiotic resistance
The average values of inhibition diameters for AMP, CIPR, CXM,I before each disinfection process (t = 0) for the selected MDR
21 23 10 1021 27 10 10
E. coli were compared with the corresponding clinical breakpointvalues for E. coli from EUCAST database (Table 4). Inhibition zonediameters were monitored also for tetracycline (TET, 30 �g) andvancomycin (VAN, 30 �g), although the corresponding clinicalbreakpoint values are not reported in EUCAST online database. Thetested strain was resistant (R) to AMP, CIPR, TET, as expected, butalso to VAN. It was sensitive (S) to CXM and NI. The results of resis-tance assays on the colonies survived to the disinfection processshow that none of the investigated solar driven AOPs affects theresistance. This was observed both in the middle of each experi-ment and at the end, when still at least one cultivable and detectablecolony exists to perform the antibiogram protocol. The tested straindid not lose its resistance to AMP, CIPR, TET and VAN during the pro-cess because no variations in the inhibition zone diameters wereobserved.
Although antibiogram is a qualitative proof, which does notallow to investigate changes in resistance deeply from a geneti-cal point of view, it shows that resistance was not affected. In theliterature, only two works are available about the investigation ofsolar photo-Fenton process on antibiotic resistance of Enterococcibut in terms of resistance percentage [20,35]. The profile of antibi-otic resistance percentage, calculated by comparing the counts onthe culture media supplemented with antibiotics with the corre-sponding counts on plates without antibiotics, plotted as a functionof treatment time, shows a decrease in ofloxacin and trimetho-prim resistance percentage [20]. According to these results,solar photo-Fenton process, at pilot scale ([Fe2+]0 = 0.090 mM;[H2O2]0 = 2.205 mM; pH0 = 2.8–2.9) affects antibiotic resistance,but in terms of percentage. The same approach has been followedby Karaolia et al., also in this case a decrease of clarithromycinand sulfamethoxazole resistant Enterococcus in real UWTP effluentwith treatment time was observed (solar photo-Fenton process atpilot scale, [Fe2+]0 = 0.090 mM; [H2O2]0 = 1.470 mM; pH0 = 4, in thepresence of 100 ppb of clarithromycin and sulfamethoxazole) [35].Some changes in antibiotic resistance have been observed in somestudy where minimum inhibiting concentration (MIC) method [27]and Kirby-Bauer disk diffusion method [21] were used to charac-terize antibiotic resistance of E. coli strains following disinfectionby UV radiation and TiO2 photocatalysis, respectively. A multidrugresistant E. coli strain, which has been undergone to UV radiationtests (UV dose = 1.25 × 10⁴ �W s cm−2), was observed to change itsresistance to ciprofloxacin (MIC = 12 mg L−1), but not to amoxicillin(MIC > 256 mg L−1) and sulfamethoxazole (MIC > 1024 mg L−1) [27].In another study, the effect on a multidrug resistant E. coli
strain of solar simulated TiO2 photocatalytic process was inves-tigated [21]. While no detectable changes in resistance levels werefound for cefuroxime, ciprofloxacin and vancomycin, a significantstatistically increasing trend (p = 0.033 < ˛=0.05) was observed for
B: En
tiaeadt
4
sfpdwiarsUtppttTiHvba
epHaHww
A
ptap
R
[
[
[
[
[[[[[[
[
[[
[[[
[
[[
[
[
[
[
[
[
[
[[
[[[
[
[
[[
[[
[
[
G. Ferro et al. / Applied Catalysis
etracycline. As expected, the same strain can have different behav-ors to different antibiotics. Moreover, although no change inntibiotic resistance was observed in our study it does not nec-ssarily mean that any change in antibiotic resistance occurredt all, but only that no change occurred in the bacterial cells ran-omly selected among those survived to disinfection treatment athe given sampling time.
. Conclusions
Different solar AOPs (photo-Fenton at pH 8 and pH 4, H2O2 withunlight and solar heterogeneous photocatalysis) were evaluatedor disinfection of real effluents of urban wastewater treatmentlants containing a ARB E. coli strain. Among the different solarriven AOPs tested in this study, the best disinfection efficiencyas found for photo-Fenton at pH 4 (Fe2+/H2O2:0.090/0.294 mM),
n terms of treatment time (20 min to reach the detection limit)nd required energy. This high efficacy is due to the photo-Fentoneaction occurring between solar photons, added H2O2 and the dis-olved iron in the wastewater sample. But the treatment of realWTP effluents by this process would require acidification before
reatment and neutralization afterwards with the formation of ironrecipitated that should be subsequently removed, making thisrocess not really attractive on the economic point of view. Whenhe process is operated at near natural pH, iron precipitates andhe process can actually be considered as a H2O2/sunlight process.he efficiency found out for H2O2/sunlight process was very sim-lar for the three tested concentrations: 2.205, 1.470, 0.588 mM of
2O2. Solar photocatalytic (TiO2) inactivation efficiency was alsoery promising, but the removal of catalyst after treatment shoulde taken into count in a global assessment for wastewater reusepplication.
In the light of urban wastewater reuse for crop irrigationach of all investigated solar processes may be promising, excepthoto-Fenton at natural pH with 0.179 of Fe2+ and 0.588 mM of2O2. Among them the most feasible one, also considering thebove explained drawbacks for solar photo-Fenton process, may be2O2/sunlight at lower H2O2 concentrations (0.588 and 1.470 mM)hich also meet the standard for H2O2 residual concentration inastewater reuse for crops irrigation.
cknowledgements
The authors thank SFERA program (Solar Facilities for the Euro-ean Research Area, EC Grant agreement no. 228296) for fundinghe experimental work and also the Spanish Ministry of Economynd Competitiveness for financial support under the AQUASUNroject (reference: CTM2011-29143-C03-03).
eferences
[1] United Nations, International Decade for action: Water for life,2005–2015. Water Scarcity, 2014, http://www.un.org/waterforlifedecade/scarcity.shtml
[2] FAO, Water Development and Management Unit. Water Scarcity, 2014,http://www.fao.org/nr/water/docs/escarcity.pdf
[3] S.M. Scheierling, C.R. Bartone, D.D. Mara, P. Drechsel, Water Int. 36 (2011)420–440.
[4] P. Dreschel, C.A. Scott, L. Raschid-Sally, M. Redwood, A. Bahri, Wastewaterirrigation and health-assessing and mitigating risk in low-income countries,Earthscan-IDRC-IWMI, London, 2010.
[
[
vironmental 178 (2015) 65–73 73
[5] World Bank, World development report 2010: Improving wastewater usein agriculture: an emerging priority, 2010, http://elibrary.worldbank.org/doi/pdf/10.1596/1813-9450-5412
[6] WHO, WHO guidelines for the safe use of wastewater, excreta and greywater.Vol. II: Wastewater use in agriculture. Geneva, 2006.
[7] L.R. Beuchat, Microb. Infect. 4 (2002) 413–423.[8] K. Kümmerer, Chemosphere 75 (2009) 435–441.[9] A. Novo, S. André, P. Viana, O.C. Nunes, C.M. Manaia, Water Res. 47 (2013)
1875–1887.10] L. Rizzo, C. Manaia, C. Merlin, T. Schwartz, C. Dagot, M.C. Ploy, I. Michael, D.
Fatta-Kassinos, Sci. Tot. Environ. 447 (2013) 345–360.11] A. Łuczkiewicz, K. Jankowska, S. Fudala-Ksiazek, K. Olanczuk-Neyman, Water
Res. 44 (2010) 5089–5097.12] X.X. Zhang, T. Zhang, M. Zhang, H.H.P. Fang, S.P. Cheng, Appl. Microbiol. Bio-
technol. 82 (2009) 1169–1177.13] M. Agulló-Barceló, M.I. Polo-López, F. Lucena, J. Jofre, P. Fernández-Ibánez, Appl.
Catal. B: Environ. 136–137 (2013) 341–350.14] E.A. Auerbach, E.E. Seyfried, K.D. McMahon, Water Res. 41 (2007) 1143–1151.15] M.T. Guo, Q.B. Yuan, J. Yang, Water Res. 47 (2013) 6388–6394.16] J.J. Huang, H.Y. Hu, Y.H. Wu, B. Wei, Y. Lu, Chemosphere 90 (2013) 2247–2253.17] M. Munir, K. Wong, I. Xagoraraki, Water Res. 45 (2011) 681–693.18] L. Rizzo, G. Ferro, C.M. Manaia, Global NEST J. 16 (2014) 455–462.19] S. Malato, P. Fernández-Ibanez, M.I. Maldonado, J. Blanco, W. Gernjak, Catal.
Today 147 (2009) 1–59.20] I. Michael, E. Hapeshi, C. Michael, A.R. Varela, S. Kyriakou, C.M. Manaia, D. Fatta-
Kassinos, Water Res. 46 (2012) 5621–5634.21] L. Rizzo, A. Della Sala, A. Fiorentino, G. Li Puma, Water Res. 53 (2014) 145–152.22] T.-M. Tsai, H.-H. Chang, K.-C. Chang, Y.-L. Liu, C.-C. Tseng, J. Chem. Technol.
Biotechnol. 85 (2010) 1642–1653.23] P. Xiong, J. Hu, Water Res. 47 (2013) 4547–4555.24] F. Bichai, M.I. Polo-Lopez, P. Fernandez Ibanez, Water Res. 46 (2012) 6040–6050.25] J. Rodríguez-Chueca, M.I. Polo-López, R. Mosteo, M.P. Ormad, P. Fernández-
Ibánez, Appl. Catal. B: Environ. 150–151 (2014) 619–629.26] E. Ortega-Gómez, M.M. Ballesteros Martín, B. Esteban García, J.A. Sánchez Pérez,
P. Fernández Ibánez, Appl. Catal. B: Environ. 148–149 (2014) 484–489.27] L. Rizzo, A. Fiorentino, A. Anselmo, Chemosphere 92 (2013) 171–176.28] I. García-Fernández, M.I. Polo-López, I. Oller, P. Fernández-Ibanez, Appl. Catal.
B: Environ. 121–122 (2012) 20–29.29] P. Fernández-Ibanez, C. Sichel, M.I. Polo-López, M. de Cara-García, J.C. Tello,
Catal. Today 144 (2009) 62–68.30] C. Navntoft, E. Ubomba-Jaswa, K.G. McGuigan, P. Fernández-Ibánez, J. Pho-
tochem. Photobiol. B: Biol. 93 (2008) 155–161.31] EUCAST, European Committee on Antimicrobial Susceptibility Testing, 2014,
http://www.eucast.org/mic distributions/32] C. Sichel, J.C. Tello, M. de Cara, P. Fernández-Ibánez, Catal. Today 74 (2007)
152–160.33] I. García-Fernández, I. Fernández-Calderero, M.I. Polo-López, P. Fernández-
Ibánez, Catal. Today (2007) http://dx.doi.org/10.1016/j.cattod.2014.03.02634] K.G. McGuigan, T.M. Joyce, R.M. Conroy, J.B. Gillespie, M. Elmore-Meegan, J.
Appl. Microbiol. 84 (1998) 1138–1148.35] P. Karaolia, I. Michael, I. García-Fernández, A. Aguera, S. Malato, P. Fernández-
Ibanez, D. Fatta-Kassinos, Sci. Tot. Env. 468–469 (2014) 19–27.36] J. Coosemans, Acta Horticult. 382 (1995) 263–268.37] A.K. Benabbou, Z. Derriche, C. Felix, P. Lejeune, C. Guillard, Appl. Catal. B: Envi-
ron. 76 (2007) 257–263.38] A. Spüler, Photochem. Photobiol. Sci. 10 (2011) 381–388.39] M. Cho, H. Chung, W. Choi, J. Yoon, Water Res. 38 (2004) 1069–1077.40] D. Gumy, C. Morais, P. Bowen, C. Pulgarin, S. Giraldo, R. Hajdu, J. Kiwi, Appl.
Catal. B: Environ. 63 (2006) 76–84.41] M.I. Polo-López, P. Fernández-Ibanez, I. García-Fernández, I. Oller, I. Salgado-
Tránsito, C. Sichel, J. Chem. Technol. Biotechnol. 85 (2010) 1038–1048.42] D.A. Keane, K.G. McGuigan, P. Fernández-Ibánez, M.I. Polo-López, J.A. Byrne,
P.S.M. Dunlop, K. O’Shea, D.D. Dionysiou, S.C. Pillai, Catal. Sci. Technol. 4 (2014)1211–1226.
43] O. Legrini, E. Oliveros, A.M. Braun, Chem. Rev. 93 (1993) 671–698.44] T.A. Tuhkanen, in: S. Parsons (Ed.), UV/H2O2 Processes, IWA-Publishing, Lon-
don, 2004, pp. 86–110.45] Y. Wang, C.-S. Hong, Water Res. 33 (1999) 2031–2036.46] C. Pablos, J. Marugán, R. van Grieken, E. Serrano, Water Res. 47 (2013)
1237–1245.47] O. Feuerstein, D. Moreinos, D. Steinberg, J. Antimicrob. Chemother. 57 (2006)
872–876.48] C. Sichel, P. Fernandez-Ibanez, M. de Cara, J. Tello, Water Res. 43 (2009)
1841–1850.49] M.I. Polo-Lopez, I. García-Fernández, I. Oller, P. Fernández-Ibánez, Photochem.
Photobiol. Sci. 10 (2011) 381–388.50] D. Spuhler, J.A. Rengifo-Herrera, C. Pulgarin, Appl. Catal. B: Environ. 96 (2010)
126–141.
Related Documents