URBAN POVERTY ALLEVIATION MODEL FROM BEHAVIORAL PERSPECTIVE Emerging Trends in Academic Research (ETAR-14-181) Global Illuminator by Nazief Nirwanto and Harmono * BALI, 25-26 November 2014 * Faculty of Business & Economics., University of Merdeka Malang, Indonesia 1

Welcome message from author
This document is posted to help you gain knowledge. Please leave a comment to let me know what you think about it! Share it to your friends and learn new things together.
Transcript
URBAN POVERTY ALLEVIATION MODEL FROM BEHAVIORAL
PERSPECTIVE
Emerging Trends in Academic Research (ETAR-14-181)Global Illuminator
by
Nazief Nirwanto and Harmono*
BALI, 25-26 November 2014
* Faculty of Business & Economics., University of Merdeka Malang, Indonesia 1

TABLE OF CONTENT
Page
ABSTRACT ..................................................................................... ...... 3INTRODUCTION.......................................................................................... 4
OBJECTIVES OF RESEARCH...................................................................... 4POVERTY AND EMPOWERMENT ............................................................ 5CULTURAL VALUES AND POVERTY REDUCTION............................... 6METHODOLOGY............................................................................................ 6DISCUSSION ….............................................................................................. 8CONCLUSION................................................................................................. 13REFERENCES.................................................................................................. 13
ENCLOSURES …............................................................................................ 16
2
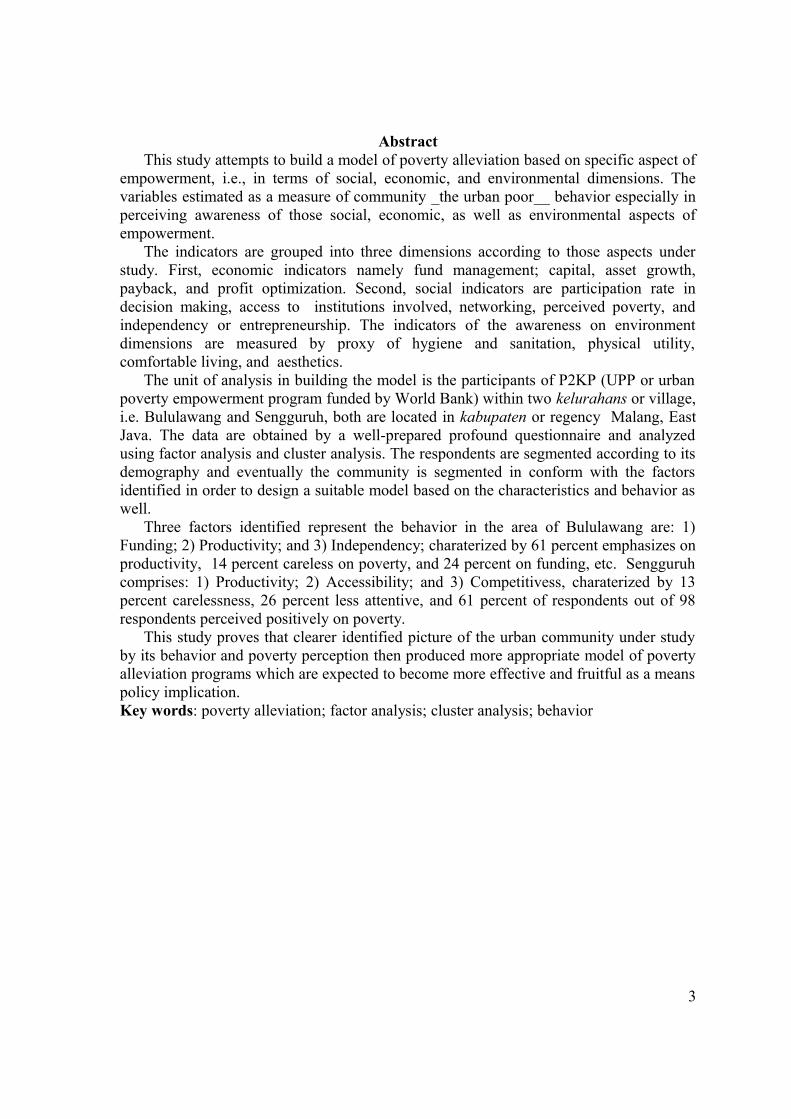
AbstractThis study attempts to build a model of poverty alleviation based on specific aspect of
empowerment, i.e., in terms of social, economic, and environmental dimensions. The variables estimated as a measure of community _the urban poor__ behavior especially in perceiving awareness of those social, economic, as well as environmental aspects of empowerment.
The indicators are grouped into three dimensions according to those aspects under study. First, economic indicators namely fund management; capital, asset growth, payback, and profit optimization. Second, social indicators are participation rate in decision making, access to institutions involved, networking, perceived poverty, and independency or entrepreneurship. The indicators of the awareness on environment dimensions are measured by proxy of hygiene and sanitation, physical utility, comfortable living, and aesthetics.
The unit of analysis in building the model is the participants of P2KP (UPP or urban poverty empowerment program funded by World Bank) within two kelurahans or village, i.e. Bululawang and Sengguruh, both are located in kabupaten or regency Malang, East Java. The data are obtained by a well-prepared profound questionnaire and analyzed using factor analysis and cluster analysis. The respondents are segmented according to its demography and eventually the community is segmented in conform with the factors identified in order to design a suitable model based on the characteristics and behavior as well.
Three factors identified represent the behavior in the area of Bululawang are: 1) Funding; 2) Productivity; and 3) Independency; charaterized by 61 percent emphasizes on productivity, 14 percent careless on poverty, and 24 percent on funding, etc. Sengguruh comprises: 1) Productivity; 2) Accessibility; and 3) Competitivess, charaterized by 13 percent carelessness, 26 percent less attentive, and 61 percent of respondents out of 98 respondents perceived positively on poverty.
This study proves that clearer identified picture of the urban community under study by its behavior and poverty perception then produced more appropriate model of poverty alleviation programs which are expected to become more effective and fruitful as a means policy implication. Key words: poverty alleviation; factor analysis; cluster analysis; behavior
3

INTRODUCTIONThe poverty reduction programs are generally project based, by using certain
characteristics of poverty employed by institutions such as World Bank, Board of Statistic (BPS), National Coordinating Board of Family Planning (BKKBN), Inpres Desa Tertinggal (IDT), etc. which are more centralistic, and other characteristics with a broader sense and priorly planned. Hence that standardization and generalization are made to be the base of the poverty reduction projects.
Urban Poverty Reduction Program (P2KP) funded by the World Bank is a poverty reduction program using the criteria based on research by the World Bank covering the whole area of Indonesia, which is used as the basis for determining the target. This program is executed by developing subdivision units such as NGO’s and other similar structures that taking into considerations the local wisdom in terms of economic, social, and environment, and integrated into a package of empowerment.
The shortcoming of this P2KP program is the homogeneous treatment upon the target groups without considering the unique characteristics of the members of society based on the various dimensions of the local value systems pertaining to the people’s behavior upon poverty. Besides, due to unfocused criteria those programs of poverty reduction tend to be in vain. Therefore, this study attempts to group and cluster the target groups based on behavioral dimensions which conform to the characteristics as well as to the local potentials available.
Some economists emphasize that the criteria of poverty should be up to the people concerned (Mubyarto, et al., 2002). The top-down approach to comprehend the criteria tend to bias and does not provide perfect solution to poverty, both from the point of view of the target groups as well as the method employed.
Other economists, on the other hand, emphasize more on the knowledge, attitude, and behavior that constitute local cultural values and wisdoms alive in the neighborhood (Sri-Edi Swasono, et al. (2004). Furthermore, Namba (2003) adds that local economy should take into account the ecosystem of the respective areas. The agricultural sector contributes more than that program with homogeneous treatment on poverty reduction for all areas.
The subjects of this research are the urban poor who are the members of P2KP project in two kelurahans (village) in Kabupaten (regency) Malang, i.e. Kelurahan Sengguruh and Bululawang, both in Kecamatan (county) Kepanjen and Bululawang respectively. The aspects portrayed here are the behavioral dimensions and the demography of the target groups. A model of poverty is later on can be designed taking advantage of the adaptive, relevant, as well as sustainable programs.
This study focuses on the development of urban poor reduction model by answering the following questions: (1) What factors constitute the attitude and behavior of the urban poor pertaining to poverty reduction based on economic, social, and environment awareness empowerment; (2) How to classify the urban poor targeted based on demographic as well as on psychographic characteristics that constitute their behavior---discovered in point no.(1)--- upon poverty reduction programs.
OBJECTIVES AND SIGNIFICANCEThis research will specifically: 1) identify the factors that contribute the attitude and
behavior of the urban poor in terms of poverty reduction programs from the point of view of social, economic, and environment awareness; 2) identify and classify into clusters by the demographic and psychographic characteristics of the target groups under study.
4
The research results are expected to present significant contribution to better poverty reduction programs and eventually resulted an effective solution to overcome poverty. Besides, the local governments can produce more focused and efficient public policies that can cover as comprehensive as possible in order to achieve wealth and prosperity.
Poverty and Empowerment As Soeprapoto (2004:9) notifies that from the conceptual point of view there has been
no significant difference in dealing with poverty. Poverty is no longer an individual catastrophy yet a structural and multidimensional case. It no longer is merely the problem of backwardness manifested with social, economic, and political dimension alone. Therefore, it requires a paradigm shift that poverty can only be alleviated by the empowerment of the poor themselves. Empowerment means a concept that born from a paradigm of thinking which stand to development focused on people or civilians concerned.
For example, Directorate of Housing and Settlements (2002:1) via P2KP Programs focuses the poverty reduction in terms of three dimensions, namely social, economic, and environmental. In this case a rotating fund provided for the members of the program is involved which deals with venture capital, SME’s management, pay back, and returns. The social dimension deals with the society’s empowerment horizontally including business networking, access to NGO’s and its related institutions. As for the environment awareness it is meant to improve the physical environment, including the sanitation, the esthetics of the surroundings, healthcare, education, etc.
From the macroeconomic side Syahza (2004:217-31) stresses on multiplier effect created by plasma model for palm plantation. The infrastructure necessary should Also be provided the government as well as other public policies that covers health and education would be of tremendous backup in the poverty reduction programs. There should be clear definition of poverty and sufficient instrument in controlling the execution of any programs that involve poor people. A strategic and effective means of income redistribution will be a indispensible tools to overcome the current problems.
Prominent Indonesian economist Mubyarto (1998) calls such programs on poverty alleviation in the wake of fiscal decentralization era an empowerment approach to anti poverty programs. However, in terms of implementation there is a strong tendency that such aid programs are considered as merely an income for consumption purposes; or else not optimized as it is directed to be. Under such conditions a more profound study should be conducted to go deeper into the real problems of poverty as such in order to determine the exact instrument to fight against it properly.
There has been various arguments over poverty line based on different aspects. Poverty is not confined only on the lack of income or poor standard of living. Yet it concerns as well the probability of individuals and family to go on and fulfill their living to sustain and progress and eventually achieved welfare.
Various programs on poverty alleviation have been implemented by different institutions such as government, NGOs and other international organizations as well (Namba, 2003:1-4, and Sukartawi, 1997:1-14). Sectoral programs such as IDT and those by the department of public works (Dinas PU) are executed to overcome poverty, especially in urban areas; not to mention the family planning program (BKKBN) with its Takesra/Kukesra and Raskin, Dinas Sosial with the KUBE and the poor empowerment programs, department of agriculture (Dinas Pertanian as P4K program), and other programs by different terms. However, those programs on poverty reduction have not resulted satisfactory outcomes to reduce the number of poor people. The number tends to increase as
5
the economic crises burst since 1998 (Namba, 2003:1-4; Mubyarto, 2004:1-3; Indroyono, 2002:1-2; and Benu, 2002:1-7). The criteria used seems to be too rigid that it does not work to produce successful results that it should be.
This behavioral approach in poverty reduction program from economic, social, as well as environmental aspects is expected to be able to synergize based on demographic and the characteristics of the ecosystem in the underlined areas. In this model the cultural aspect of human life is taken into considerations as an important component to fight poverty through empowering the poor with more flexible, adaptive, and effective paradigm.
Cultural Values and Poverty Alleviation Cultural values are subject to change in terms of political power and environmentally determined by external value systems brought by outsiders. Those determinants might gradually shift the fundamental structure. The existing conditions might affect the individual behavior to interact and form a particular group behavior. This group behavior might develop into a custom and eventually becomes a new cultural value system.
Socialist and capitalist systems tend to enforce the existing society to act and work accordingly. During colonialist era the rulers always attempt to perform divide et impera in order to weaken the social bond which next easier to control. However, there is an elite group consists of the noble which notoriously known as close to the ruling government and it possess certain cultural value system. This so-called the feudal exists in the plantation vicinity, government owned companies such as railroad PT. Kereta Api, and other institutions which were founded by the former Dutch-Indie ruling government.
In this reformation era which is characterized by transparency, participation, accountability, and greater responsibility it is a fundamental phenomena which will gradually form a new cultural values. In order that the underline program of poverty reduction work properly as planned all who concerned should conform with the existing cultural value system. Therefore, a perfect strategy should be set up based on local characteristics available. There are three local characteristics of ethnicity localities in Indonesia (Sumintardja, et al. 2001:13-24), that is teamwork or gotong royong, responsibility, respect to tradition, i.e. maintaining harmony in local culture and environment.
The approach to reach local culture taken in this study is through: (1) formal/ informal education, i.e. to forge positive as well as modern attitude, (2) to design a culture improvement strategy, i.e., entrepreneurial, economical, not consumptive, productive work ethics, technology oriented, efficiency, timely, independent, discipline, self-sustain (able to decide what is best for him/herself without neglecting local and global requirements), create conducive environment which subject to change.
METHODOLOGY This is an integrative exploratory as well as confirmatory applied research utilizing longitudinal development of the current model of poverty alleviation program. The unit analysis is the participant of P2KP (UPP) project in Kabupaten Malang, and the sampling frame is the community group (KSM) members in Kelurahan Bululawang Kecamatan Bululawang, and kelurahan Sengguruh kecamatan Kepanjen, characterized by local geographical and demographic traits (ethnic, religion, etc.) which is typical to Kabupaten Malang.
Primary data collected with questionnaire are then analyzed utilizing factor analysis to identify factors that contribute to the formation of the community behavior towards poverty reduction programs based on empowerment dimensions, namely from the aspect of
6

economic, social, and environmental dimensions. Furthermore, the poor community identity in terms of geographical aspect is determined to form particular clusters based also on empowerment framework (economic, social, and environment).
Next, this study attempts to design prototype model of poverty reduction based on the factor analysis results which identify clusters of the community with certain types of behavior characterizing the underline target groups. Fortified by previous empirical studies and observations the variables identified to build the questionnaires’ items are presented here in Table 1.
Table 1Operasionalization of Variables
Variable Dimension Indicator Measurement Scale Economic 1. economical
2. timely due payment3. productive4. technology oriented 5. funding behavior 6. efficient 7. entrepreneurship8. consumerism 9. income
Ordinal (Interval)Ordinal (Interval)Ordinal (Interval)Ordinal (Interval)Ordinal (Interval)Ordinal (Interval)Ordinal (Interval)Ordinal (Interval)Ordinal (Interval)
Social 1. accessibility2. organization3. work ethic4. independency5. timeliness6. access to information7. business network8. human resource quality9. integration of poor 10. perceived poverty
Ordinal (Interval)Ordinal (Interval)Ordinal (Interval)Ordinal (Interval)Ordinal (Interval)Ordinal (Interval)Ordinal (Interval)Ordinal (Interval)Ordinal (Interval)Ordinal (Interval)
Environment 1. sanitation 2. hygiene3. environment4. security5. aesthetic
Ordinal (Interval)Ordinal (Interval)Ordinal (Interval)Ordinal (Interval)Ordinal (Interval)
Demography Community Group Identity
1. Name2. Address3. ethnicity 4. religion5. education6. business7. occupation8. age9. gender10. income
Nominal Nominal Nominal NominalOrdinal (Interval)NominalNominalOrdinalNominalRasio
The respondents are KSM members who received funding aid from P2KP for both who succeed and not succeed in their businesses in two Kelurahans, i.e. kelurahan Sengguruh, kecamatan Kepanjen 249 KSM members and kelurahan Bululawang, kecamatan Bululawang 118 members. Each KSM has 3-4 members, both in kabupaten Malang.
The factor analysis and cluster analysis employ the following model:Xi = Ai1 F1 + Ai2F2 + Ai3F3 + . . . . . . . . . + AimFm + ViUi
where Xi = the-ith standard variableAij = regression coefficient of variable i on common factor jF = common factorVi = regression coefficient of variable i on unique factor iUi = unique factor for the-ith variable
7
m = number of factor
Unique factors are correlated with common factors. Common factor is a linear combination of observed variables, formulated as follows:
Fi = Wi1X1 + Wi2X2 + Wi3X3 + . . . . . . . . . . + WikXik
where Fi = the-ith factor estimatedWi = weight or coefficient factor scorek = number of variable
The variables are standardized and the sample size is at least four to five times of the variables estimated. The stages in factor analysis are as follows: a) formulate the problem; b) construct the correlation matrix; c) determine the number of factor; d) factor rotation (orthogonal, varimax, and cross rotation); e) interpret the factors identified; f) estimate the factor scores and select the surrogate variables; and g) test the best model.
Cluster analysis estimates the interdependence of variables. It classifies the object or element, in this case the community members based on set variable set to be included in the analysis as it has similar characteristics which belongs to a cluster. There are six stages of the model-building process in cluster analysis as follows: 1) set up the objective of cluster analysis; 2) determine the research design; 3) assumptions in cluster analysis; 4) deriving clusters and assessing overall fit; 5) interpretation of the clusters; 6) validation and profiling of the clusters.
Non hierarchy or agglomerative type of cluster analysis determines the number of cluster based on the number of factors identified in the factor analysis. This type of analysis is taken as the objective is to group the respondents based on the distance of similarity of each characteristics of members in terms of culture, demography, and psychography. This technique employs k-means clustering method which consists of the following steps: sequential threshold, parallel threshold, and optimizing partitioning or optimizing procedure. This method is done with Quick Cluster program from SPSS.
Non hierarchical cluster procedure starts with the cluster core determination then group the entire objects to the threshold values set up from the center point. Parallel threshold method set up several cluster cores in concordance. Objects with similar thresholds are grouped into one cluster. The reliability and validity in cluster analysis are tested by the following procedure: 1) validating the cluster solution; 2) profiling the cluster solution; 3) to split the sample into two groups, each is cluster analyzed separately and the results are compared; 4) a modified form of split sampling whereby cluster centers obtained from one cluster solution are employed to define clusters from other observations and the results are compared; and 5) a direct from of cross-validation.Most distance measures are quite sensitive to differing scales or magnitude among the variables. The standardization is the conversion of each variable to standard scores or Z scores by substraction the mean and dividing by the standard deviation for each variable.
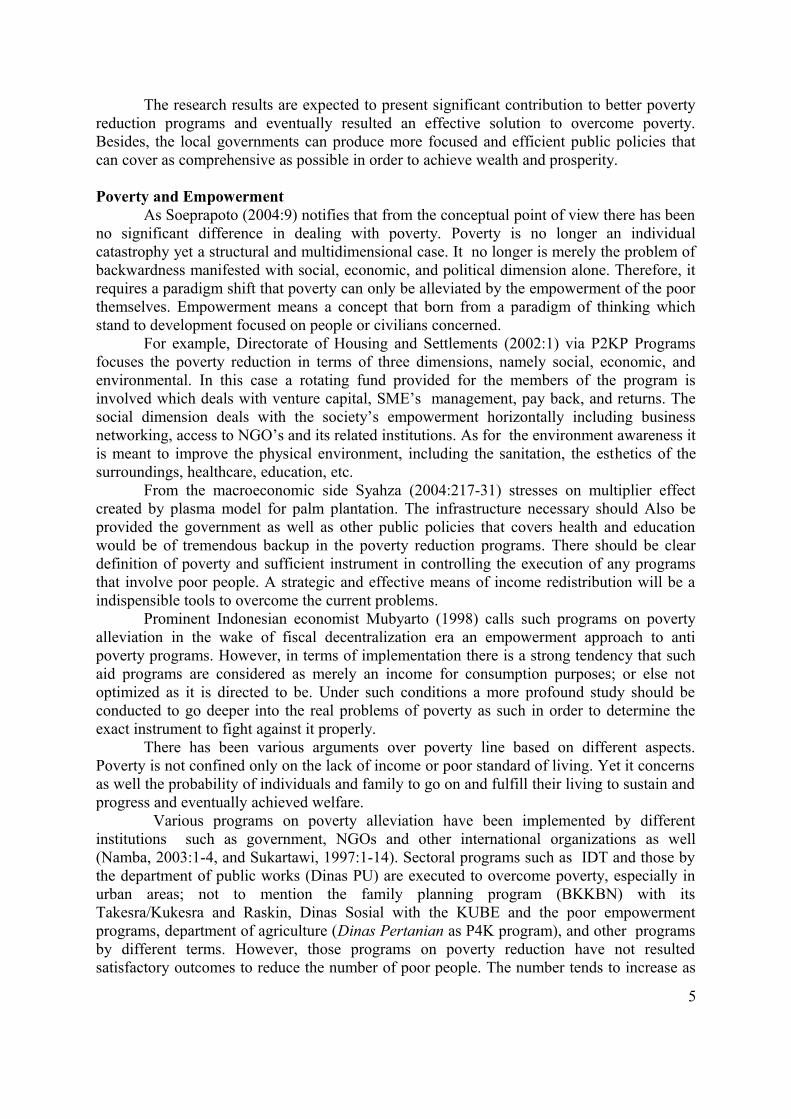
DISCUSSION The overall results of both factor and cluster analyses of sampling area one Bululawang, is presented in Figure 2. It depicts the factors in poverty reduction based on behavioral aspects and its characteristics of the underlined demography.
The factors taken into considerations for the community of desa Bululawang in perceiving poverty are: productifity, entrepreneurship, and funding strategy. They tend to have relatively higher income compared to those with shorter length of business and less
8

perceptive to those factors under considerations. The overall relationships can be seen in Figure 1. Members of cluster 1 (61 percent out of 66 respondents) possess traits that concerns more on productifity and in business for average 11 years 9 months, income average Rp 1.011.216,-. This cluster members represent independent and productive community; in spite of the lack of government aid and grant and they have relatively stable business. This is supported by the fact that the average income is higher as compared to the other clusters. In cluster 2 (14 percent of 66 respondents) members of community rely mostly on government aid and have been in business on average 15 years; the lowest profit is Rp 437.500,-. This cluster represents community with unproductive behavior, poor entrepreneurship, dependent, and not hard workers. Cluster 3 (24 percent of 66 respondents) characterizes those community who are attentive to poverty reduction, i.e. in terms of funding, productivity, and entrepreneurship. However, they are relatively recent in business, i.e. around 5 to 8 years, income average (IDR)/Rp 510.000,- monthly, in fact higher than that of cluster 2, who rely more on government support. This cluster members might represent the success of the P2KP programs which emphasizes on the empowerment of the poor through the three aspects of empowerment, namely economic, social, and cultural environment.
Figure 1Factors of Poverty Alleviation and Cluster in Desa Bululawang
9
Productivity
Entrepreneurship
Fund
i ng
F actor 2: P rodu cti vity
5. On t ime repayment represents successful business.
13. Technology ut ilizat ion improves product ivity and
competiti veness.
24. I rely on creativity and competi tion awareness .
41. Necessary to have skillful and experienced human resource.
Factor 3: Entrepreneurship12. Technology is necessary.33. Participation in organizations useful to business success.38. Information on government policy is needed for business
success.51. We build our own toilets as lack of public facilities.
Fact
or 1
: Fun
ding
4. O
n tim
e re
paym
ent o
f cre
dit lo
an.
14. I
bor
row
whe
n ne
eded
and
bas
ed o
n ab
il ity
to re
pay.
16. I
bor
row
to d
evel
op m
y bu
s ine
ss.
Cluster 1: 61% of 66 respndents, charactersitics:
• Education Elemenatry, Secondary, highschool
• Income average Rp1.011.216
• Address majority: M
alang, and Bululawang
• Moslem m
ajority
• Business: retail; food and drink.
• Length in business 11 yrs 9 months.
Clu
ster
3: 2
4% of
66
respo
nden
ts, c
hara
cte r
istics
:
• Sec
onda
ry a
nd H
ighs
choo
l.
• A
vera
ge in
com
e Rp5
10.0
00
• Add
ress
majo
rity:
Ma l
ang,
Sur
abay
a, M
adiu
n
and
surr
ound
ings
• M
osle
m m
ajor
ity•
Busi
ness:
retai
l; fo
od &
drin
k; f
a rm
er; ta
ilor ,
s tre
et ve
ndor
• Le
ngth
in b
usine
ss 8
yea r
s
Cluster 2: 14% of 66 respondents, characteristics:• Education: elementary, Secondary & highschool.• Average income Rp437,500,-• Address majority: Malang & surroundings, Bululawang• Moslem majority• Business:retail store; food & drink; farmer; tailor, etc• Length in business 15 years.
Prioritiz
e Productivity Facto
r
Rely on government aid
Consider all Factors
Source: Profiling of factor and cluster of sample Desa Bululawang (Nirwanto and Harmono, 2006)
In conclusion the behavioral factors and cluster demography of the community of Bululawang represent the characteristics of those concerned with poverty alleviation programs. Besides, they are relatively long enough in business and are more successful than those who rely more on government aid, less productive and dependent.
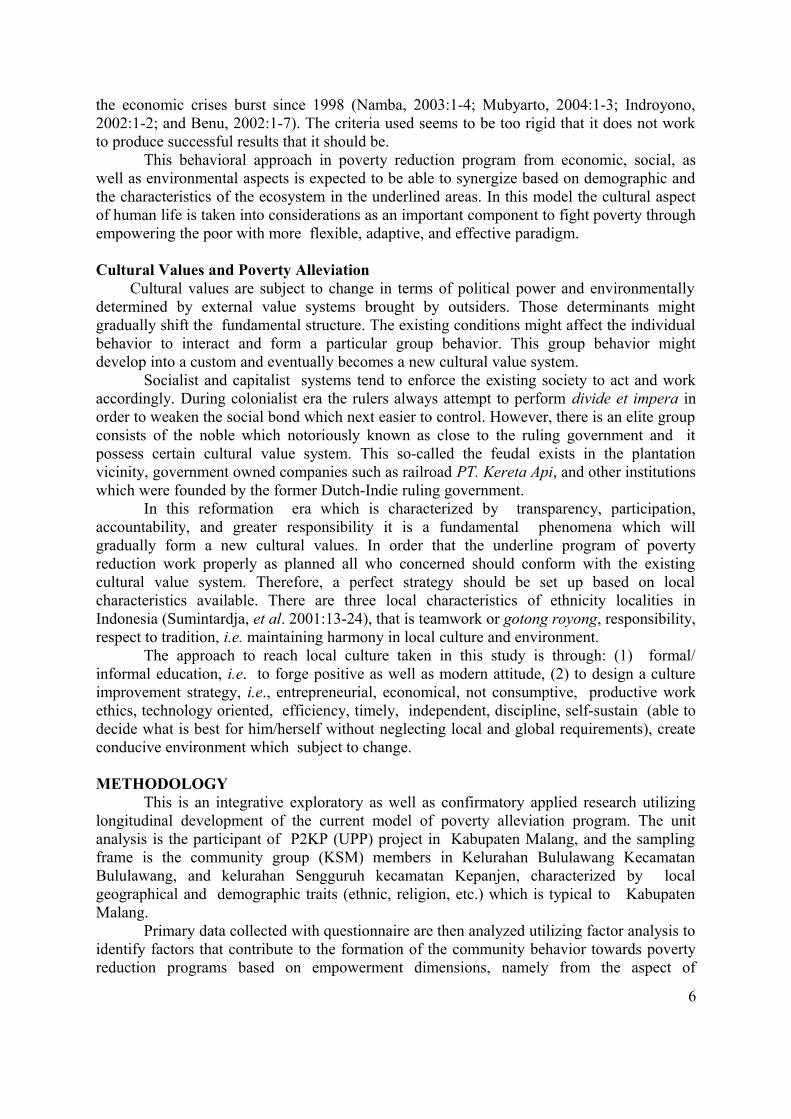
The second sampling area Kelurahan Sengguruh have characteristics and demography that are depicted in Figure 3. The factor analysis done on both sampling areas resulted in three factors that contribute to the community behavior in both kelurahans, i.e., u kelurahan Bululawang and Sengguruh and it likewise forms segments into three clusters in each area. Three factors in kelurahan Bululawang are: 1) Funding (variables 4, 14, and 16); 2) Productivity (variables 5, 13, 24, and 41); and 3) Entrepreneurship (variables 12, 33, 38, and 51). As for kelurahan Sengguruh the three factors are; 1) Productivity (variables 34, 35, 41, and 46); 2) Accesibility (variables 23, 31, and 42); and 3) Competitiveness (variables 9, 24, and 27). The details are in Figure 2 and Figure 3.
10
Each cluster in both areas is proportionally segmented. For Bululawang it is consecutively 61 percent, 14 percent, and 24 percent for 66 respondents. For Sengguruh consecutively is 13 percent, 26 percent, and 61 percent out of 98 respondents. Despite the same number of factors and clusters in both areas, each has different description and component. As for Bululawang, highest monthly income is in cluster 3; while for Sengguruh the highest income is in cluster 1. Perception on poverty concern the best is in cluster 3 in both areas with 61 percent. This signifies that the poverty alleviation program of P2KP is considered successful in areas that fundamentally possess positive perception on poverty in the first place. The local demography including education, ethnicity, and religion, have no significance in the community success in business to community members who receive aid from P2KP program. Besides, community members who have positive perception on entrepreneurship, productivity, and accessibility, credit loan, also have likewise a positive attitude upon the three empowerment aspects, namely awareness to physical environment, comfort, aesthetics, sanitation and hygiene including the willingness to build and maintain toilet.
Figure 2Factors of Poverty Reduction and Cluster in Sengguruh
11

Productivity
Accessibility
Com
petit
ivene
ss
Factor 1: Pr oductivi ty
• 34. Perseverance in good customer realtionships
• 35. Discipline i n ti me and hardwork
• 41. Expertise, skil lful, and experienced human resource support
business
• 46. Busi ness improves af ter receiving aid and supervision f rom
P2KP project
Factor 2: Accessibili ty• 23. I have access to government• 31. I collaborate with the government official to support business• 42. My business success supported by good relationships with local givernment
Fact
o r 3
: Com
p etit
iven
ess
• 9.
The
pro
duc ts
and
ser
vices
qua
lity a
re c
ompe
titive
.
• 24
. Rel
iance
on
new
ideas
and
kee
p up
with
com
peti t
or’s
str
ateg
y.•
27. I
pre
fer s
aving
rath
er th
an s
pend
al l
the
prof
its.
Cluster 1: 13% of 98 , characterstics:
• Seco nda ry a nd high scho ol.
• In com e 6 9% ave ra ge R p30 0.0 00,- ;
8% ove r Rp 50 0.0 00, 24 % over Rp 1 m illio n,-
• Ad dre ss major ity: Ma lang , Sur ab aya, Ma diun an d
sur ro und ings
• Majo rity Java nes e
• Moslem
• Busine ss: r eta il stor e; food & dr ink; far mer ; ta ilor;
pet ty se rvice s
Le ngt h in buisn ess 1-5 yea rs
Cluste r
3: 60
% of
98
Char
acte r
isti cs
:• E
duca
t i on-S
econ
d ary
& Hi gh
sch o
ol .
• Av e
rage i
n com
e to ta
l Rp 9
5 0.00
0 , -
• Add
ress
ma jo
ri t y: M
a lang
, Su ra
baya
Mad
i un an
d surr
ound
i ngs
• Eth n
i city
Jav
ane s
e
• Mos
l em• B
usi ne
ss: re
tail s
tores
; f oo d
& d r
i nk; f a
rme r;
ven d
o rs;
t a
i lor
• 20
% 6 -10
th , 13
% 1 1
-15th , 1
0% 15
-20th , t h
e re s
t ove
r
25
th , and
o nl y
20%
1-5t h .
Cluster 2: 26% of 98, characteristics:• Education, elementary, secondary, highschool.• Income 50% Rp325.000,- average total Rp 622,000,-• Address majority: Malang, and surroundings & Sengguruh• Javanese• Moslems• Business:retail store; food& drink; farmer; tailor, home• Length 32% 1-5 th, 49% 6-10 th & 14% 11-15 th 5% >25 th.
Unconcerned with Poverty
Reduction Prog ram
Product and services quality prioritized
All Factors Considered
Source: Profiling the results of Factor and Cluster Analysis, Sample Desa Sengguruh
(Nirwanto dan Harmono, 2006)
There is significant correlation between positive attitude towards factors of poverty and social, economic, and environment empowerment. Business success seems to correlate well with that positive attitude towards the empowerment aspects, namely social, economic, and environment, as the main concern of this study. Those with certain characteristics such as entrepreneurial, hardworking, independent, disciplined (indicated by timely due to loan repayment) also show positive attitude towards other aspects life and environment, and towards poverty itself. How the community members manage fund support provided by the P2KP program is proxied by the average monthly income in each cluster in both sampling areas. Judging from those two analyses it can be hypothesized that there is strong relationships between the community behavior towards the empowerment dimension (in terms of social, economic, and environment) and the success in business and eventually the society welfare. Besides income as the economic indicator it can also be observed how local community perceive and care towards environment, especially on hygiene, sanitation, aesthetic, health, and comfortable life. Positive attitude towards the empowerment aspects is believed to
12

motivate and boost the people themselves to fight against poverty. Every community and society possesses its own positive culture towards the social, economic, and environmental empowerment force to develop to help themselves against poverty.
CONCLUSION 1. Factors that constitue the behavior of community members who participate in P2KP
program from empowerment dimension of economic, social, and environment in two sampling areas, i.e. first, kelurahan Bululawang: a. Funding; b. Productivity; and c. Entrepreneurship. Second, Kelurahan Sengguruh: a. Productivity; b. Accessibility; and c. Competitiveness.
2. Cluster one in Bululawang tend to appreciate factors of productivity with highest monthly income among three clusters. Cluster two, less attention on factors of poverty in general is the lowest income. This cluster is also less independent and less productive. Cluster three, tend to be concerned with factors of poverty program of P2KP with average income slightly higher than cluster two.
3. Cluster one in Sengguruh does not perceive factors on poverty and has the lowest income. Cluster two less concerned with poverty factors with average low monthly income. Cluster three tends to be concerned with the poverty factors and has the highest monthly income among three clusters.
4. Community members who belong to cluster with the following behavioral characteristics: productive, independent, high accessibility, disciplined about funding, competitive, are proved to be more successful in managing business and fund.
5. Those belong to clusters with above behavior characteristics as in no.4, also proved to have positive attitude towards hygiene, sanitation, comfort, and environmental aesthetic. They are also willing to participate in building toilet and facilities independently without external support.
RECOMMENDATION1. Based on community clusters identified and their behavioral characteristics in terms of
empowerment dimensions, i.e. economic, social, and environment the dire actions should be taken immediately to empower the community members themselves as well as their environment. Community education is necessary to reveal that community empowerment must start from themselves. It should be conveyed that economic success by means of income as the main indicator will eventually induce social and environmental improvement.
2. Capacity building, education and practical training should be given especially in entrepreneurship and self-sustainability and all its aspects, including knowledge on environment, health and sanitation. Practical modules and appropriately planned activity should be given by those involved in the policy making competence.
REFERENCEBenu, Fredrik, (2002), Ekonomi Kerakyatan dan Pemberdayaan Ekonomi Rakyat: Suatu
Kajian Konseptual. Artikel Seminar Pemberdayaan Ekonomi Rakyat di Provinsi NTT. Kupang. pp.1-22
Departemen Permukiman dan Prasarana Wilayah Direktorat Jenderal Perumahan dan Permukiman, (2002), Pedoman Umum Bersama Membangun Kemandirian dalam Pengembangan Masyarakat, serta Perumahan dan Permukiman yang Berkelanjutan.
13
Harmono (2002), Pergeseran Sistem Nilai Budaya dan Pengaruhnya terhadap Gaya Manajemen di Indonesia, Jurnal Ilmu Pengetahuan Sosial, No.2 Penerbit: Fakultas Ekonomi Universitas Negeri Malang.
Indriyono, Phutut, (2002), Mana Indikator Kemiskinan yang Paling Benar? Diskusi Kelompok Fokus tentang Kajian Strategis Indikator Kemiskinan. Balitbang Propinsi Jawa Tengah.
Krisnamurthi, Bayu. (2001). Pemberdayaan Ekonomi Rakyat, Mencari Format Kebijakan Optimal. Makalah Seminar Pemberdayaan Ekonomi Rakyat: Strategi Revitalisasi Perekonomian Indonesia. CSIS- Bina Swadaya, Jakarta 21 Februari; Jurnal Ekonomi Rakyat
Mulyadi, Usman dan Sri Oenfiati, (2001), Perilaku Wanita Pedesaan dalam Mengembangkan Sentra Produksi Kecil Bordir: Kasus Pengembangan Ekonomi Kerakyatan di Kecamatan Tanggulangin, Sidoarjo. Hasil Penelitian Dasar Kontrak No.23/P2IPD/DPPM/2001.
Malhotra, Naresh K., (1999), Marketing Research. An Applied Approach. 3rd. ed. International Edition. Simon & Schuster, Inc. New Jersey
Mubyarto (2002), Kajian Strategis Indikator Kemiskinan, Penerbit Balitbang Propinsi Jawa Tengah.
--------(2004), Mengapa Bank Sulit Memberdayakan Ekonomi Rakyat?, Jurnal Artikel - Ekonomi Rakyat dan Reformasi Kebijakan - November.
Namba, Anton, (2003), Pendekatan Ekosistem dalam Penanggulangan Kemiskinan: Refleksi Penanggulangan Kemiskinan di Sulawesi Tengah, Hasil Penelitian Pusat P3R-YAE, Bogor.
Nugroho, Ganjar, (2000), Ketegangan antara Individualitas dan Sosialitas (Memahami Logika Pedagang Mojokuto), Jurnal Ilmu Sosial & Ilmu Politik, Vol 4, No.1, Juli. Fakultas Ilmu Sosial dan Ilmu Politik Univesitas Gadjah Mada Yogyakarta.
-------, (2001), Resistensi Wong Cilik atas Pasar (Alokasi Konsumsi), Jurnal Ilmu Sosial & Ilmu Politik, Vol. 5, No.1, Juli. Fakultas Ilmu Sosial dan Ilmu Politik Univesitas Gadjah Mada Yogyakarta.
Partodihardjo, S., Ismail, I.G., Subandi, Adnyana, M.O. & Darmawan, D.A. (1993). Peranan Sistem Usaha Tani Terpadu dalam Upaya Mengentaskan Kemiskinan di Berbagai Agroekosistem. Paper presented at the Symposium of Tanaman Pangan Research III in Bogor, 23-25 August 1993.
Soekartawi, (1997) Strategi Mengentas Kemiskinan di Indonesia Melalui Impres Desa Tertinggal, Jurnal Studi Indonesia. Vol. 7. No.2. August.
Soeprapoto, Riyadi (2004) Evaluasi Program Kebijakan Pengentasan Kemiskinan Pemkot Probolinggo. Hasil Penelitian. Kerjasama Pemkot Probolinggo dengan Laboratorium Otoda FIA-Unibraw Malang.
Sumintardja, Elmira N., dkk. (2002) Faktor Determinan Pembentuk Kepribadian Manusia Indonesia yang Mencerminkan Perilaku Sehat Mental dalam Tatanan Budaya Kolektif, Jurnal Ilmu-Ilmu Sosial dan Humaniora Padjadjaran, Vol.3. No.1. Maret. Penerbit: Lembaga Penelitian Universitas Padjadjaran Bandung.
Suyanto, Bagang dan Karnaji (2001), Rencana Induk Pengentasan Kemiskinan di Surabaya, Edisi Penerbit, Lutfansah Mediatama Surabaya.
Swasono, Sri-Edi (2004), Pembangunan Menggusur Orang Miskin Bukan Menggusur Kemiskinan, Diskusi Bulanan Pusat Studi Ekonomi Pancasila UGM, September.
Syahza, Almasdi, (2004), Pemberdayaan Ekonomi Masyarakat Perdesaan Melalui Pengembangan Industri Hilir Berbasis Kelapa Sawit di Daerah Riau, Jurnal
14
Sosiohumaniora, Vol. 6, No. 3. November. pp.217-231. Lembaga Penelitian Universitas Padjadjaran Bandung.
Sahubawa, Latif, M Arief Husein (2001), Peranan Segi Pengetahuan, Sikap, dan Perilaku Masyarakat terhadap Kelestarian Ekosistem Terumbu Karang di Cagar Alam / Taman Laut. Research Report. Kontrak No.18/P21PD/DPPM/III/2001.
Solikhah, (2001), Pola Pembinaan bagi Usaha Kecil Lapisan Bawah, LPM Universitas Gajayana Malang.
Santoso (2001), Peran Wanita Tani pada Program Penyuluhan di Pedesaan dan Faktor yang Mempengaruhinya: Studi Kasus di Sentra Usaha Sapi Potong Rakyat. Lemlit Universitas Bengkulu. Research Report.
Tim Peneliti BPS (2001), Research Report, Evaluasi Rumah Tangga Miskin dengan Indikator Baru di Kabupaten Pasuruan: BAPEDA Pasuruan in cooperation with BPS.
Tim Peneliti LPM Unibraw (2004), Research Report. Penyusunan Indeks Pembangunan Manusia Kota Pasuruan: BAPEDA Kota Pasuruan in cooperation with LPM Unibraw.
Wikantiyoso, Respati, (1997), Model Inkubator untuk Pembinaan dan Pengembangan Industri Kerajinan Kayu di Desa Junrejo Kota Batu Malang, Research Report Hibah Bersaing No. 34/P2IPT/DPPM/96/PHB/V/I/1996.
15

CURRICULUM VITAE
1. Name : Dr. Nazief Nirwanto, MADesignation : Professor of economics - University of Merdeka MalangPlace & Date of Birth: Malang / 23 January 1950Male/Female : Male Address – Office : Jalan Terusan Raya Dieng No.62-64 Malang 65146. Tel.(0341)568395
- Home : Jalan Bukit Tanggul P-3. Malang 65146. Tel.(0341) 568853 Fax.(0341)-582881. HP.08123355616; email: [email protected]
2. Name : Dr. HarmonoDesignation : University of Merdeka MalangPlace & Date of Birth: Bangorejo, Banyuwangi, 7 Oktober 1965 Male/Female : Male Address : Jalan Danau Bratan Timur IV-D28. Madyopuro- Malang
Tel.: (0341) 715146; HP.08123314003 email: [email protected]
16

ENCLOSURES: Results of CFA and cluster analysis based on data on kelurahan Sengguruh and Bululawang, The variables are: 09, 23, 24, 27, 31, 34, 35, 41, 42, and 46.
VAR00009
7.00
6.00
5.00
4.00
2.00
VAR00023
7.00
6.00
5.00
4.00
3.00
2.00
1.00
VAR00024
7.00
6.00
5.00
4.00
3.00
VAR00027
7.00
6.00
5.00
4.00
2.00
1.00
VAR00031
7.00
6.00
5.00
4.00
3.00
2.00
VAR00034
7.00
6.00
5.00
4.00
17

VAR00035
7.00
6.00
5.00
VAR00041
7.00
6.00
5.00
VAR00042
7.00
6.00
5.00 4.00
3.00
2.00
1.00
VAR00046
7.00
6.00
5.00
4.00
3.00
KMO and Bartlett's Test
.765
250.86145
.000
Kaiser-Meyer-Olkin Measure of SamplingAdequacy.
Approx. Chi-SquaredfSig.
Bartlett's Test ofSphericity
Anti-image Matrices
.828 -.117 -.144 -3.712E-02 2.348E-03 -2.294E-02 -6.489E-03 9.627E-02 -4.286E-02 -1.010E-02-.117 .544 -6.403E-02 -.245 -3.717E-02 -2.046E-03 -1.141E-02 -8.284E-02 -4.902E-02 -6.254E-02-.144 -6.403E-02 .607 -2.925E-02 -.180 .140 -1.713E-02 -2.953E-02 5.073E-02 -.233
-3.712E-02 -.245 -2.925E-02 .574 3.291E-03 -.125 2.885E-02 -.171 9.862E-02 6.670E-032.348E-03 -3.717E-02 -.180 3.291E-03 .542 -.131 -.163 5.897E-03 -.213 .111
-2.294E-02 -2.046E-03 .140 -.125 -.131 .640 -.174 -2.880E-02 -3.849E-02 -.108-6.489E-03 -1.141E-02 -1.713E-02 2.885E-02 -.163 -.174 .619 3.182E-02 -5.987E-02 -.1329.627E-02 -8.284E-02 -2.953E-02 -.171 5.897E-03 -2.880E-02 3.182E-02 .729 -.118 -8.723E-02
-4.286E-02 -4.902E-02 5.073E-02 9.862E-02 -.213 -3.849E-02 -5.987E-02 -.118 .703 -4.885E-02-1.010E-02 -6.254E-02 -.233 6.670E-03 .111 -.108 -.132 -8.723E-02 -4.885E-02 .643
.812a -.175 -.204 -5.385E-02 3.503E-03 -3.150E-02 -9.062E-03 .124 -5.619E-02 -1.383E-02-.175 .808a -.111 -.439 -6.840E-02 -3.466E-03 -1.965E-02 -.131 -7.927E-02 -.106-.204 -.111 .707a -4.959E-02 -.315 .224 -2.795E-02 -4.439E-02 7.770E-02 -.373
-5.385E-02 -.439 -4.959E-02 .722a 5.900E-03 -.207 4.842E-02 -.265 .155 1.098E-023.503E-03 -6.840E-02 -.315 5.900E-03 .731a -.223 -.281 9.375E-03 -.344 .187
-3.150E-02 -3.466E-03 .224 -.207 -.223 .767a -.277 -4.213E-02 -5.739E-02 -.169-9.062E-03 -1.965E-02 -2.795E-02 4.842E-02 -.281 -.277 .814a 4.735E-02 -9.078E-02 -.209
.124 -.131 -4.439E-02 -.265 9.375E-03 -4.213E-02 4.735E-02 .810a -.165 -.127-5.619E-02 -7.927E-02 7.770E-02 .155 -.344 -5.739E-02 -9.078E-02 -.165 .765a -7.266E-02-1.383E-02 -.106 -.373 1.098E-02 .187 -.169 -.209 -.127 -7.266E-02 .756a
VAR00009VAR00023VAR00027VAR00031VAR00034VAR00035VAR00041VAR00042VAR00046VAR00024VAR00009VAR00023VAR00027VAR00031VAR00034VAR00035VAR00041VAR00042VAR00046VAR00024
Anti-image Covariance
Anti-image Correlation
VAR00009 VAR00023 VAR00027 VAR00031 VAR00034 VAR00035 VAR00041 VAR00042 VAR00046 VAR00024
Measures of Sampling Adequacy(MSA)a.
18
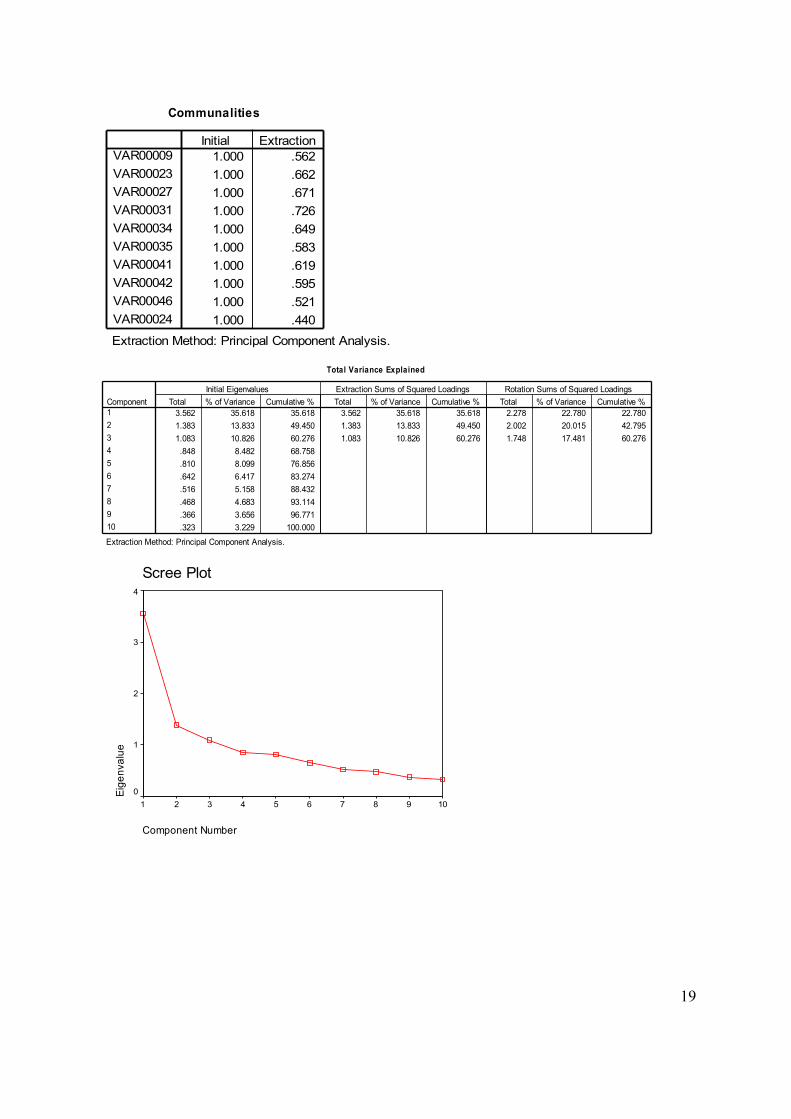
Communalities
1.000 .5621.000 .6621.000 .6711.000 .7261.000 .6491.000 .5831.000 .6191.000 .5951.000 .5211.000 .440
VAR00009VAR00023VAR00027VAR00031VAR00034VAR00035VAR00041VAR00042VAR00046VAR00024
Initial Extraction
Extraction Method: Principal Component Analysis.
Total Variance Explained
3.562 35.618 35.618 3.562 35.618 35.618 2.278 22.780 22.7801.383 13.833 49.450 1.383 13.833 49.450 2.002 20.015 42.7951.083 10.826 60.276 1.083 10.826 60.276 1.748 17.481 60.276.848 8.482 68.758.810 8.099 76.856.642 6.417 83.274.516 5.158 88.432.468 4.683 93.114.366 3.656 96.771.323 3.229 100.000
Component12345678910
Total % of Variance Cumulative % Total % of Variance Cumulative % Total % of Variance Cumulative %Initial Eigenvalues Extraction Sums of Squared Loadings Rotation Sums of Squared Loadings
Extraction Method: Principal Component Analysis.
Scree Plot
Component Number
10987654321
Eige
nval
ue
4
3
2
1
0
19
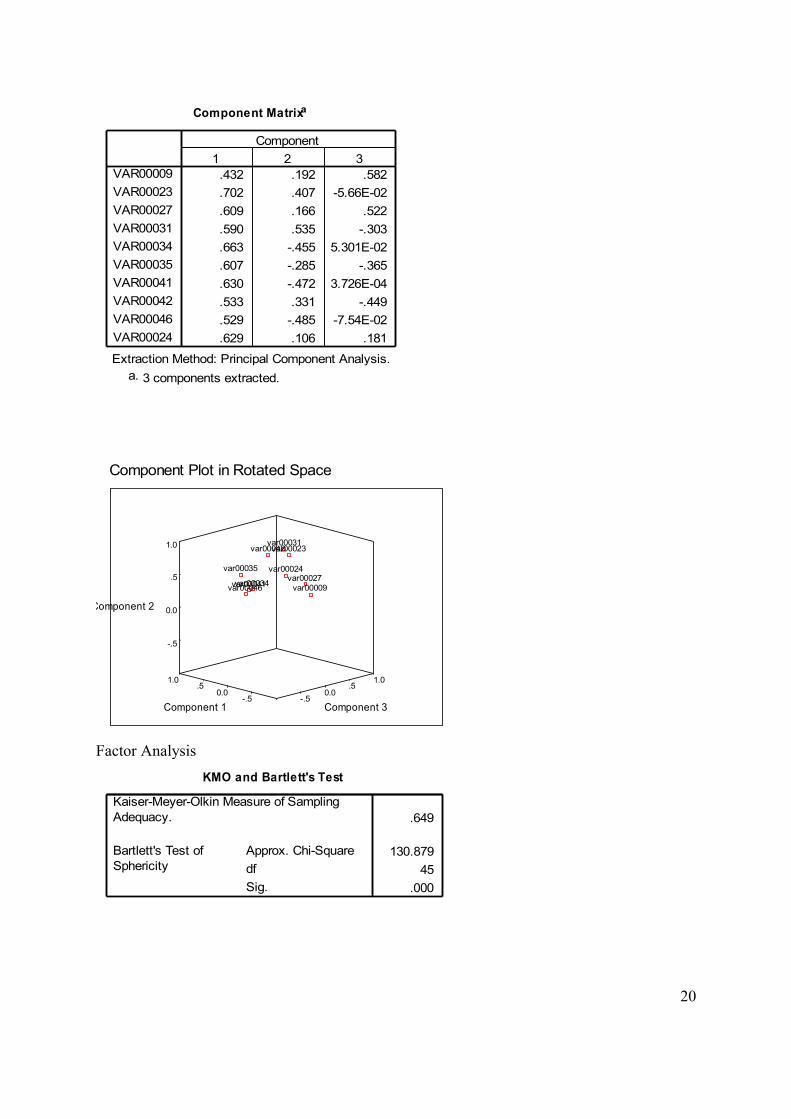
Component Matrixa
.432 .192 .582
.702 .407 -5.66E-02
.609 .166 .522
.590 .535 -.303
.663 -.455 5.301E-02
.607 -.285 -.365
.630 -.472 3.726E-04
.533 .331 -.449
.529 -.485 -7.54E-02
.629 .106 .181
VAR00009VAR00023VAR00027VAR00031VAR00034VAR00035VAR00041VAR00042VAR00046VAR00024
1 2 3Component
Extraction Method: Principal Component Analysis.3 components extracted.a.
Component Plot in Rotated Space
var00034var00041var00027
var00046 var00009
var00024
Component 2
var00035
1.01.0
var00023
-.5
0.0
var00031
.5 .5
var00042
.5
1.0
Component 3Component 10.00.0
-.5-.5
Factor AnalysisKMO and Bartlett's Test
.649
130.87945
.000
Kaiser-Meyer-Olkin Measure of SamplingAdequacy.
Approx. Chi-SquaredfSig.
Bartlett's Test ofSphericity
20

Anti-image Matrices
.665 -.107 -.294 7.978E-03 -1.549E-02 .151 -1.642E-02 8.621E-02 -.146 .102-.107 .565 7.593E-02 -.282 -4.756E-02 8.971E-04 1.187E-02 -4.727E-02 -3.742E-02 -9.616E-02-.294 7.593E-02 .595 -7.598E-02 -7.249E-02 -9.209E-02 .113 3.759E-03 3.205E-02 -.259
7.978E-03 -.282 -7.598E-02 .490 -3.301E-02 -9.592E-02 -4.407E-02 -.103 .192 3.460E-02-1.549E-02 -4.756E-02 -7.249E-02 -3.301E-02 .423 -.139 -.215 3.947E-02 -.156 8.951E-02
.151 8.971E-04 -9.209E-02 -9.592E-02 -.139 .584 -7.161E-02 -7.002E-02 -2.345E-02 -5.776E-02-1.642E-02 1.187E-02 .113 -4.407E-02 -.215 -7.161E-02 .483 4.929E-02 -8.949E-02 -.1618.621E-02 -4.727E-02 3.759E-03 -.103 3.947E-02 -7.002E-02 4.929E-02 .840 -.112 -.124
-.146 -3.742E-02 3.205E-02 .192 -.156 -2.345E-02 -8.949E-02 -.112 .614 9.831E-04.102 -9.616E-02 -.259 3.460E-02 8.951E-02 -5.776E-02 -.161 -.124 9.831E-04 .669.437a -.175 -.468 1.397E-02 -2.921E-02 .243 -2.897E-02 .115 -.229 .152
-.175 .670a .131 -.536 -9.733E-02 1.562E-03 2.273E-02 -6.861E-02 -6.351E-02 -.156-.468 .131 .505a -.141 -.145 -.156 .211 5.316E-03 5.299E-02 -.411
1.397E-02 -.536 -.141 .621a -7.254E-02 -.179 -9.059E-02 -.161 .349 6.045E-02-2.921E-02 -9.733E-02 -.145 -7.254E-02 .712a -.280 -.476 6.625E-02 -.307 .168
.243 1.562E-03 -.156 -.179 -.280 .799a -.135 -.100 -3.916E-02 -9.248E-02-2.897E-02 2.273E-02 .211 -9.059E-02 -.476 -.135 .709a 7.740E-02 -.164 -.284
.115 -6.861E-02 5.316E-03 -.161 6.625E-02 -.100 7.740E-02 .702a -.157 -.165-.229 -6.351E-02 5.299E-02 .349 -.307 -3.916E-02 -.164 -.157 .612a 1.534E-03.152 -.156 -.411 6.045E-02 .168 -9.248E-02 -.284 -.165 1.534E-03 .605a
VAR00009VAR00023VAR00027VAR00031VAR00034VAR00035VAR00041VAR00042VAR00046VAR00024VAR00009VAR00023VAR00027VAR00031VAR00034VAR00035VAR00041VAR00042VAR00046VAR00024
Anti-image Covariance
Anti-image Correlation
VAR00009 VAR00023 VAR00027 VAR00031 VAR00034 VAR00035 VAR00041 VAR00042 VAR00046 VAR00024
Measures of Sampling Adequacy(MSA)a.
Communalities
1.000 .7711.000 .5321.000 .6991.000 .6861.000 .7581.000 .5961.000 .7161.000 .3121.000 .6661.000 .370
VAR00009VAR00023VAR00027VAR00031VAR00034VAR00035VAR00041VAR00042VAR00046VAR00024
Initial Extraction
Extraction Method: Principal Component Analysis.
Total Variance Explained
3.114 31.144 31.144 3.114 31.144 31.144 2.325 23.248 23.2481.619 16.186 47.330 1.619 16.186 47.330 2.270 22.696 45.9441.373 13.732 61.063 1.373 13.732 61.063 1.512 15.119 61.0631.017 10.166 71.228.853 8.527 79.756.638 6.383 86.139.455 4.547 90.685.368 3.678 94.363.306 3.062 97.425.257 2.575 100.000
Component12345678910
Total % of Variance Cumulative % Total % of Variance Cumulative % Total % of Variance Cumulative %Initial Eigenvalues Extraction Sums of Squared Loadings Rotation Sums of Squared Loadings
Extraction Method: Principal Component Analysis.
21

Scree Plot
Component Number
10987654321
Eige
nval
ue3.5
3.0
2.5
2.0
1.5
1.0
.5
0.0
Component Matrixa
.225 .322 .785
.615 -.384 7.957E-02
.460 -6.78E-02 .695
.587 -.584 1.971E-02
.746 .413 -.174
.708 -5.30E-02 -.302
.702 .359 -.308
.356 -.396 -.166
.395 .713 -4.17E-02
.544 -.231 .145
VAR00009VAR00023VAR00027VAR00031VAR00034VAR00035VAR00041VAR00042VAR00046VAR00024
1 2 3Component
Extraction Method: Principal Component Analysis.3 components extracted.a.
22
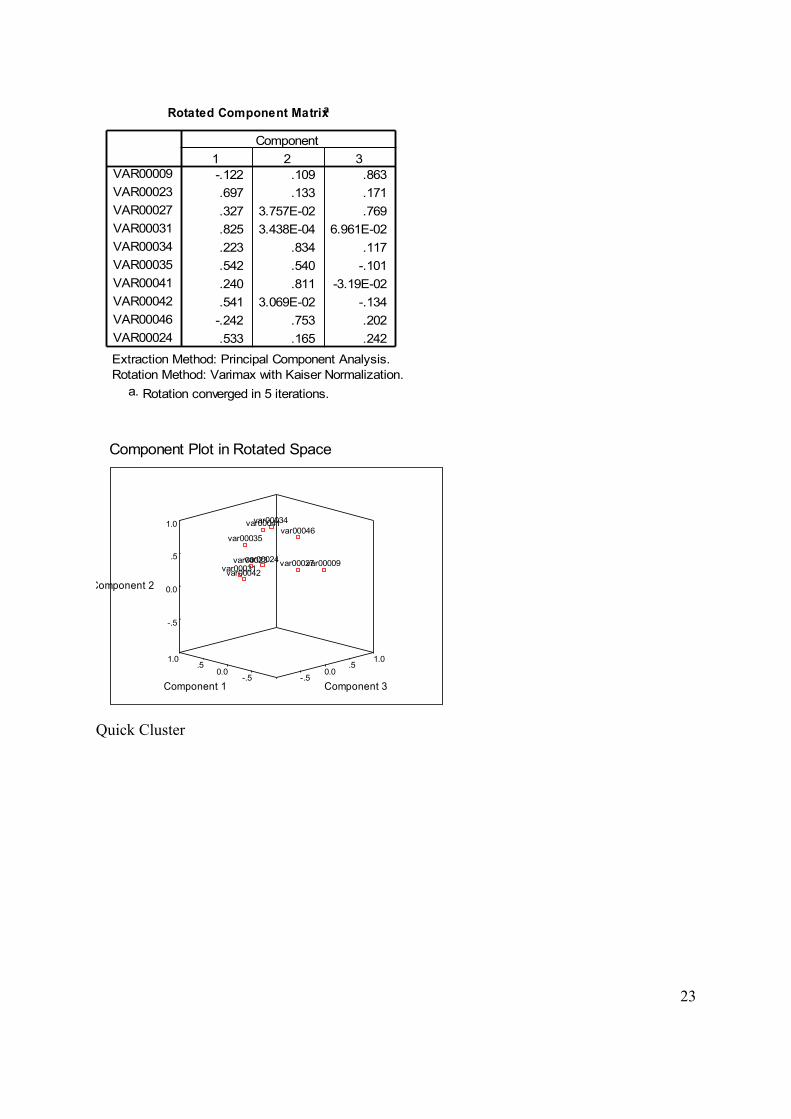
Rotated Component Matrixa
-.122 .109 .863.697 .133 .171.327 3.757E-02 .769.825 3.438E-04 6.961E-02.223 .834 .117.542 .540 -.101.240 .811 -3.19E-02.541 3.069E-02 -.134
-.242 .753 .202.533 .165 .242
VAR00009VAR00023VAR00027VAR00031VAR00034VAR00035VAR00041VAR00042VAR00046VAR00024
1 2 3Component
Extraction Method: Principal Component Analysis. Rotation Method: Varimax with Kaiser Normalization.
Rotation converged in 5 iterations.a.
Component Plot in Rotated Space
var00027var00031var00023var00024 var00009
Component 2
1.01.0
var00042
-.5
var00035
0.0
var00034
.5 .5
var00041
.5
var000461.0
Component 3Component 10.00.0
-.5-.5
Quick Cluster
23

Initial Cluster Centers
-2.26385 1.36127 1.36127-.32399 .77088 1.31831
-1.13363 -1.93288 1.26412-1.98133 -1.98133 1.02440
.75202 -1.53319 1.32332-2.27159 1.18876 1.18876-1.98058 -.29278 1.39502-1.78094 1.39237 1.39237-.12732 -1.21230 1.50015
-2.36439 1.27028 1.27028
Zscore(VAR00009)Zscore(VAR00023)Zscore(VAR00024)Zscore(VAR00027)Zscore(VAR00031)Zscore(VAR00034)Zscore(VAR00035)Zscore(VAR00041)Zscore(VAR00042)Zscore(VAR00046)
1 2 3Cluster
Iteration Historya
3.195 3.619 2.926.313 .312 .146.000 .177 7.053E-02.000 .000 .000
Iteration1234
1 2 3Change in Cluster Centers
Convergence achieved due to no or small distancechange. The maximum distance by which any centerhas changed is .000. The current iteration is 4. Theminimum distance between initial centers is 6.158.
a.
Distances between Final Cluster Centers
2.387 4.0172.387 3.0094.017 3.009
Cluster123
1 2 3
24

ANOVA
13.346 2 .740 95 18.033 .00020.674 2 .586 95 35.291 .00016.421 2 .675 95 24.314 .0009.468 2 .822 95 11.523 .000
20.431 2 .591 95 34.573 .00016.116 2 .682 95 23.639 .00011.739 2 .774 95 15.168 .0009.416 2 .823 95 11.443 .000
12.763 2 .752 95 16.964 .00012.562 2 .757 95 16.604 .000
Zscore(VAR00009)Zscore(VAR00023)Zscore(VAR00024)Zscore(VAR00027)Zscore(VAR00031)Zscore(VAR00034)Zscore(VAR00035)Zscore(VAR00041)Zscore(VAR00042)Zscore(VAR00046)
Mean Square dfCluster
Mean Square dfError
F Sig.
The F tests should be used only for descriptive purposes because the clusters have been chosen tomaximize the differences among cases in different clusters. The observed significance levels are notcorrected for this and thus cannot be interpreted as tests of the hypothesis that the cluster means areequal.
25
Related Documents